Article

Effects of the CDC10 (Septin 7) Gene on the Proliferation and Differentiation of Bovine Intramuscular Preadipocyte and 3T3-L1 Cells

1
The State Key Laboratory of Reproductive Regulation and Breeding of Grassland Livestock, School of Life Sciences, Inner Mongolia University, Hohhot 010070, China
2
Department of Agrobiology, Faculty of Agriculture, Niigata University, Niigata 950-2181, Japan
3
Department of Veterinary, Inner Mongolia Agricultural University, Hohhot 010018, China
4
National Engineering Laboratory for Animal Breeding and MOA Key Laboratory of Animal Genetics and Breeding, College of Animal Science and Technology, China Agricultural University, Beijing 100193, China
5
College of Animal Science, Inner Mongolia Agricultural University, Hohhot 010018, China
*
Author to whom correspondence should be addressed.
Animals 2023, 13(4), 609; https://doi.org/10.3390/ani13040609
Submission received: 31 December 2022 / Revised: 1 February 2023 / Accepted: 6 February 2023 / Published: 9 February 2023
(This article belongs to the Special Issue Marbling Fat in Livestock)

Abstract

:

Simple Summary

Intramuscular fat content and marbling affecting meat quality are important economic traits in beef cattle. CDC10 (cell division cycle 10 or Septin 7), a member of the septin family involved in cellular proliferation, was considered as a functional and positional candidate gene for beef marbling. In the present study, we found that overexpression of CDC10 could promote the differentiation of bovine intramuscular preadipocyte and 3T3-L1 cells, whereas knockdown of CDC10 resulted in the opposite consequences. Our results provide new insights into the regulatory roles of CDC10 in adipocytes in animals.

Abstract

Intramuscular fat content and marbling affecting meat quality are important economic traits in beef cattle. CDC10 (cell division cycle 10 or Septin 7), a member of the septin family involved in cellular proliferation, was considered as a functional and positional candidate gene for beef marbling. In a previous study, we revealed that the expression levels of CDC10 were also positively correlated with marbling scores in Japanese Black cattle. However, the regulatory mechanism of the CDC10 gene on IMF deposition in cattle remains unclear. In the present study, flow cytometry, EdU proliferation assays, and Oil Red O staining results showed that overexpression of CDC10 could promote the differentiation of bovine intramuscular preadipocyte (BIMP) and 3T3-L1 cells, whereas knockdown of CDC10 resulted in the opposite consequences. Furthermore, quantitative PCR and Western blotting results showed that overexpression of CDC10 could promote the expression levels of adipogenic marker genes PPARγ and C/EBPα at both mRNA and protein levels in BIMP and 3T3-L1 cells, whereas knockdown of CDC10 resulted in the opposite consequences. Our results provide new insights into the regulatory roles of CDC10 in adipocytes in animals.

1. Introduction

Intramuscular fat (IMF) content and marbling are important economic traits in the beef cattle industry. IMF is the streak of visible fat intermixed with the lean within a muscle fiber of different muscle types and locations [1]. It was found that the sensory quality traits of beef, such as tenderness, juiciness, taste, and flavor, were related to IMF content and marbling [2]. Moreover, IMF content is a complex quantitative trait affected by multiple genetic components, cellular signals, environmental conditions, and hormones [3,4]. To date, a number of studies have demonstrated that many candidate genes and mutations play important roles in regulating the deposition of IMF [5,6,7,8,9,10,11]. However, a better knowledge of the molecular architecture of IMF content and marbling is advantageous as it may provide effective scientific clues for improving meat quality, leading to economic benefits to the beef production industry.
Cell division cycle 10 (CDC10, also known as Septin 7) is a member of the septin family, which belongs to a family of cytoskeleton proteins with GTPase activity assembled as intracellular filamentous scaffolds [12]. To date, 13 different septin genes (SEPT1–SEPT12 and SEPT14) have been identified in mammals [13] and can be classified into four different subgroups (SEPT2, SEPT3, SEPT6, and SEPT7 subgroups) based on the sequence homology of their structural domains [14,15]. They play putative roles in cytokinesis, cellular morphogenesis, polarity determination, vesicle trafficking, and apoptosis [16,17,18,19]. Among them, the CDC10 gene is essential for cytokinesis in a variety of cells and is involved in cellular proliferation [20,21,22]. As reported, knockdown of the CDC10 gene results in fewer cells entering S-phase in the cell model and leads to abnormal mitotic spindle formation, but mitotic spindle abnormalities can be rescued by treatment with CDC10 protein; thus, the CDC10 gene is important for maintaining spindle formation [23]. CDC10 is related to the phosphorylation of MEK/ERK, which is a key signaling pathway for adipocyte differentiation. MEK/ERK activity is necessary for the expression of key adipogenic regulators CCAAT/enhancer binding proteins α (C/EBPα) and peroxisome proliferator-activated receptor γ (PPARγ) [24,25]. Furthermore, CDC10 could interact with fat storage-inducing transmembrane protein 2 (FIT2), which is a key gene that packs fat into lipid droplets [26] to induce their formation [27]. Therefore, these studies suggested that the CDC10 gene may play a critical role in adipogenesis. However, the regulatory role of CDC10 on the proliferation and differentiation of the preadipocyte remains unclear.
The aims of this study were to: (1) identify the growth curve and differentiation ability of primary cultured bovine intramuscular preadipocyte (BIMP); (2) detect the expression trend of the CDC10 gene during the proliferation and differentiation of BIMP and 3T3-L1 cells; (3) detect the effects on proliferation and differentiation of BIMP and 3T3-L1 preadipocyte after the knockdown or overexpression of the CDC10 gene. In this study, we initially investigated the mechanism of the CDC10 gene effect on the proliferation and differentiation of 3T3-L1 and BIMP to provide scientific clues for the improvement of beef quality.

2. Materials and Methods

2.1. Ethics Standards

All experimental procedures were carried out in accordance with the guidelines of the China Council on Animal Care. The protocol was approved on 1 March 2018 by the Institutional Animal Care and Use Ethics Committee of Inner Mongolia University, with the permit number for conducting animal experiments IMU-2018-01.

2.2. Cell Culture

BIMP were isolated from the longissimus dorsi muscle of three 24-month-old healthy Qinchuan steers. The three steers were randomly selected from the slaughterhouse. The isolated adipose tissue was washed three times in phosphate buffered saline (PBS). Then, the tissues were minced and digested with collagenase type I (Sigma-Aldrich, MO, USA) for 1 h at 37 °C in a shaker, and then passed through 50-, 100-, and 250-mesh sieves successively. The preadipocyte were collected with centrifugation at 1500 rpm for 5 min. Bovine preadipocyte were cultured in growth medium consisting of Dulbecco’s Modified Eagle Medium/Nutrient Mixture F-12 (DMEM/F12, Gibco-BRL, Carlsbad, CA, USA) with 1% penicillin-streptomycin (PS, Gibco-BRL, Carlsbad, CA, USA) and 20% fetal bovine serum (FBS, Gibco-BRL, Carlsbad, CA, USA) at 37 °C with 5% CO2. The 3T3-L1 preadipocyte were purchased from Procell (Wuhan, China) and were cultured in growth medium consisting of DMEM/F12 with 10% FBS at 37 °C with 5% CO2. For BIMP and 3T3-L1 differentiation, when the confluence of cells reached 90%, they were induced to differentiate using a differentiation cocktail (DMEM/F12 with 10% FBS, 0.5 mmol/L 3-Isobutyl-1-methyxanthine (IBMX), 10 μg/mL insulin, 1 μmol/mL dexamethasone (Sigma-Aldrich, MO, USA)) for 3 d. Cells were then cultured in DMEM/F12 with 10% FBS and 10 μg/mL insulin for 3 d. Finally, cells were cultured in DMEM/F12 with 10% FBS and the culture medium was changed every 3 d until day 15. Cells were incubated at 37 °C with 5% CO2.

2.3. Transfection of siRNA and Lentivirus Infection

The bovine and murine small-interfering RNA (siRNA) used in this study were designed by RIBOBIO (RIBOBIO, Guangzhou, China) and contained three CDC10 gene siRNA sequences (Table 1) and an siRNA negative control (NC). Cells were cultured in 6-well plates to reach about 50% confluency prior to transfection and then siRNA was transfected using the ribioFECTTMCP (RIBOBIO, Guangzhou, China) transfection reagent according to the manufacturer’s protocol.
For overexpression, we constructed two lentiviral overexpression vectors by introducing the coding region sequence of the bovine CDC10 gene (GenBank accession: BC148893.1) and of the murine CDC10 gene (GenBank accession: BC058587.1) available on GenBank into the virus plasmid. Constructions of bovine and murine overexpression vectors were completed by Gemma gene (Shanghai, China). In order to establish the stable cell line, the preadipocyte were inoculated with the lentivirus for 96 h and then stable cell lines were screened by flow cytometry assay.

2.4. RNA Isolation and Quantitative Real-Time PCR

Total RNA was extracted using RNeasy Mini Kit (Qiagen, Valencia, CA, USA) and then the reverse transcription kit (Takara, Kusatsu, Japan) was used to synthesize cDNA. Quantitative real-time PCR (RT-PCR) was carried out with the use of an SYBR Green master mix and specific primers (Table 2) on a BioRad system (Bio-Rad, Hercules, CA, USA). The relative mRNA abundance of each gene was analyzed by the 2−ΔΔCT method.

2.5. Western Blot Analysis

Cell samples were lysed using radioimmunoprecipitation assay (RIPA) buffer (Beyotime, Shanghai, China) supplemented with phenylmethylsulfonyl fluoride (PMSF) (Beyotime, Shanghai, China) and total protein was extracted. The total protein samples were separated by electrophoresis in SDS-polyacrylamide gels and then transferred to NC membranes (Pall Corporation, East Hills, NY, USA). After blocking the membrane in 5% skim milk for 2 h, the primary antibody was incubated overnight (4 °C) and the secondary antibody was incubated at room temperature for 1 h. Protein bands were exposed with chemiluminescent reagents (Thermo, Waltham, MA, USA). An anti-α-Tubulin antibody was used as the loading control. The protein expression was quantified using ImageJ (https://imagej.nih.gov/ij/, accessed on 18 June 2021). The following primary antibodies were used: CDC10 (1:1000, Abcam), CyclinD1 (1:500, Proteintech), CyclinB1 (1:500, Proteintech), α-Tubulin (1:1000, Proteintech), C/EBPα (1:500, Proteintech), and PPARγ (1:500, Proteintech). The secondary antibodies were anti-rabbit (1:10,000, Proteintech) and anti-mouse antibodies (1:10,000, Proteintech). The targeted proteins were detected using the Tanon-5200 (Tanon, Shanghai, China) instructions of the manufacturer.

2.6. EdU and Flow Cytometry Assay

We used the Cell-Light™ EdU Apollo® 488 In Vitro Imaging Kit (RIBOBIO, Guangzhou, China) and configured the mixed solution according to the instructions. The preadipocyte in the normal growth stage were treated with 50 μmol/L EdU medium for 2 h. After the cells were fixed with 4% paraformaldehyde, they were stained with the Apollo reaction solution and then the cell nucleus was stained with Hoechst. A Nikon TE2000 microscope (Nikon, Tokyo, Japan) was used to take pictures and the data were analyzed using ImageJ.
Preadipocyte were seeded in 6-well culture plates at a density of 2 × 10⁵ cells per well. Cells were transfected with CDC10-siRNA or a CDC10 overexpression vector. After washing three times with PBS, cells were fixed with 75% alcohol overnight at 4 °C, followed by treatment with 1 mg/mL RNase at 37 °C for 30 min, and were then stained with 50 mg/mL propidium iodide (PI) at 37 °C for 30 min. The samples were detected using a CytoFLEX flow cytometer (Becton Dickinson, Franklin Lakes, NJ, USA). The proliferation index shows the proportion of mitotic cells among the cells examined.

2.7. Oil Red O Staining

The CDC10-siRNA- or CDC10 overexpression vector-treated cells were matured for 9 d and then washed with PBS, fixed with 4% paraformaldehyde (PFA) for 0.5 h at room temperature, and washed again three times with PBS. After staining with Oil Red O (Sigma-Aldrich, MO, USA) solution for 1 h, the results were visualized on a fluorescence microscope (Nikon, Tokyo, Japan). Oil Red O was extracted with 100% isopropanol and its relative concentration was determined by measuring the absorbance at 510 nm.

2.8. Statistical Analysis

All charts were created using GraphPad Prism 7.0 and Origin 2019b. The data represent the mean ± SEM. The significance of differences between the groups was assessed using the Student’s t-test (*, p < 0.05; **, p < 0.01).

3. Results

3.1. Growth Curve of Primary Cultured BIMP and Identification of Adipogenic Marker Genes

In order to identify the growth of primary cultured BIMP and whether they can stably differentiate into adipocytes, we measured the growth curve of BIMP and also detected the expression trends of adipogenic marker genes during their differentiation. The growth curve of BIMP was drawn by trypan blue staining and the results are shown in Figure 1A. The growth curve of BIMP showed an “S” shape (Figure 1A). We found that the expression of PPARγ and C/EBPα increased first and then decreased during the differentiation in BIMP and 3T3-L1 cells (Figure 1B–E). The levels of PPARγ and C/EBPα proteins in the preadipocyte followed a similar trend as the mRNA expression (Figure 1F,G).

3.2. Expression of the CDC10 Gene in the Proliferation and Differentiation of BIMP and 3T3-L1 Cells

In order to unveil the function of CDC10 in preadipocyte in animals, both 3T3-L1 and BIMP cells were used to analyze CDC10 expression during preadipocyte proliferation and differentiation. We found that CDC10 expression increased during proliferation and differentiation in both cell types. Then, CDC10 mRNA levels peaked at day 8 during BIMP proliferation and peaked at hour 60 during 3T3-L1 proliferation (Figure 2A,C). Meanwhile, CDC10 mRNA levels continued to rise until day 15 in BIMP and 3T3-L1 differentiation (Figure 2B,D). The levels of CDC10 protein in the preadipocyte followed a similar trend as the mRNA expression (Figure 2E,F).

3.3. Knockdown of CDC10 Had No Significant Effect on the Proliferation of BIMP and 3T3-L1 Cells

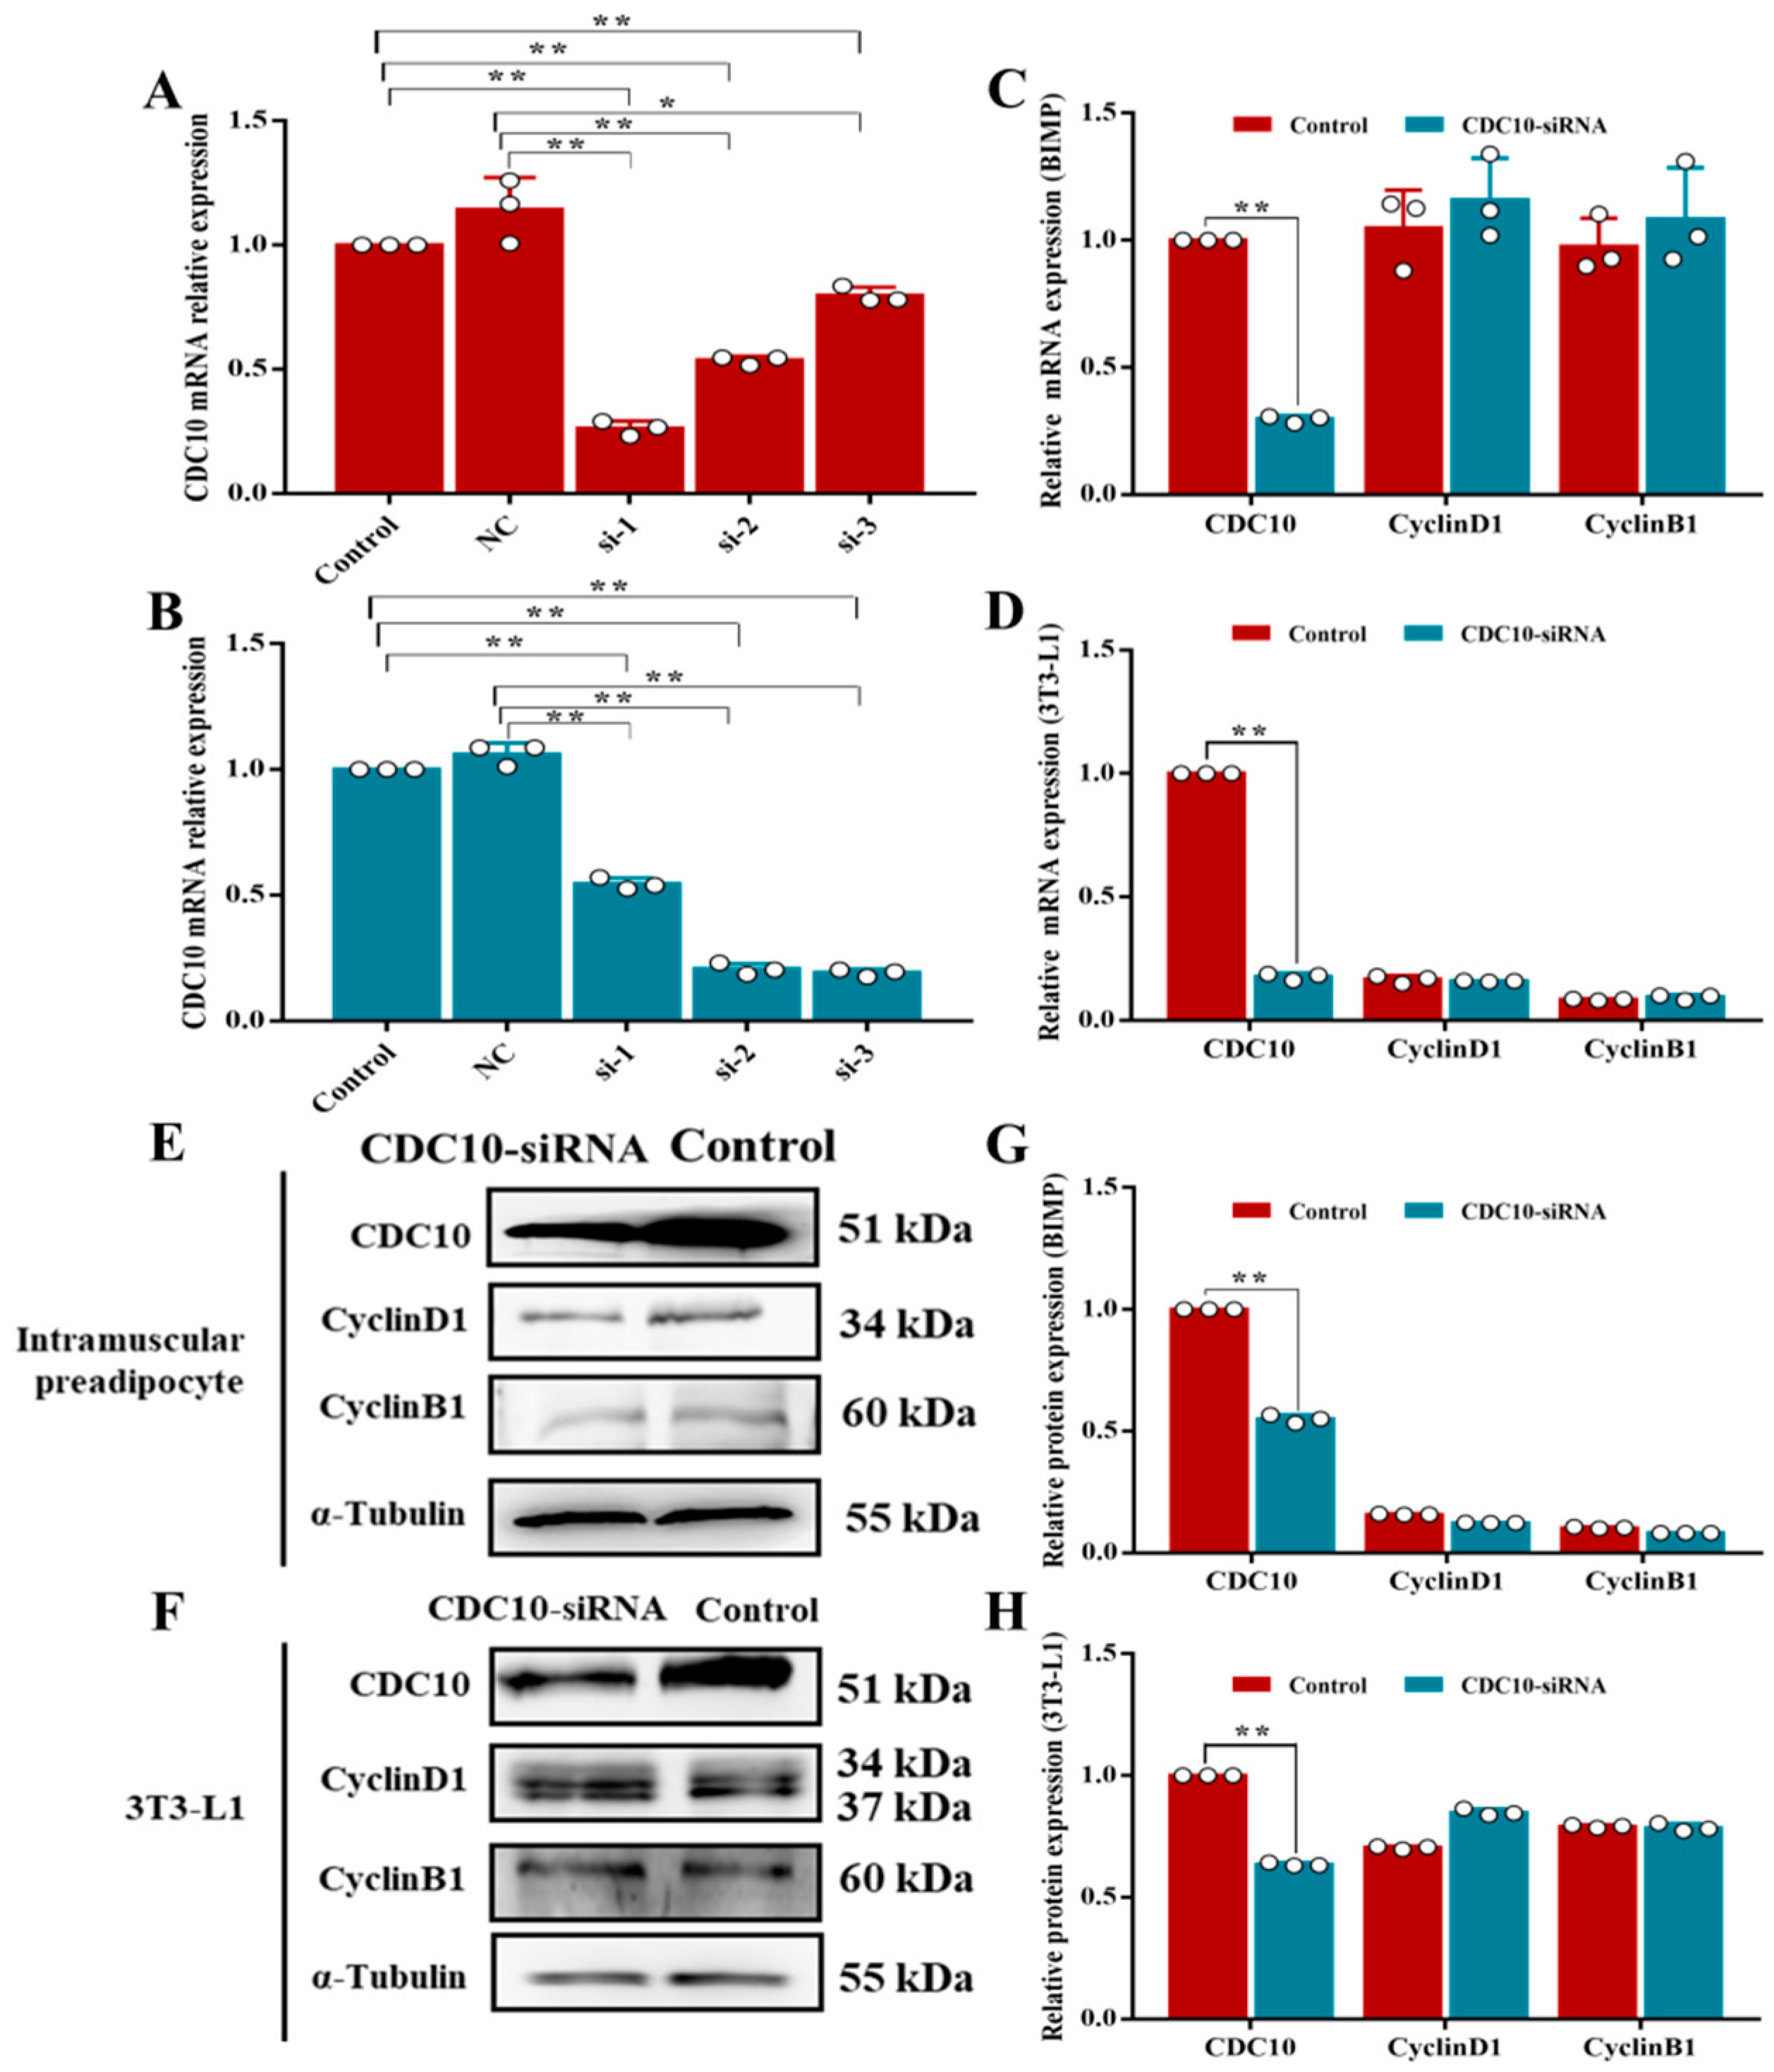
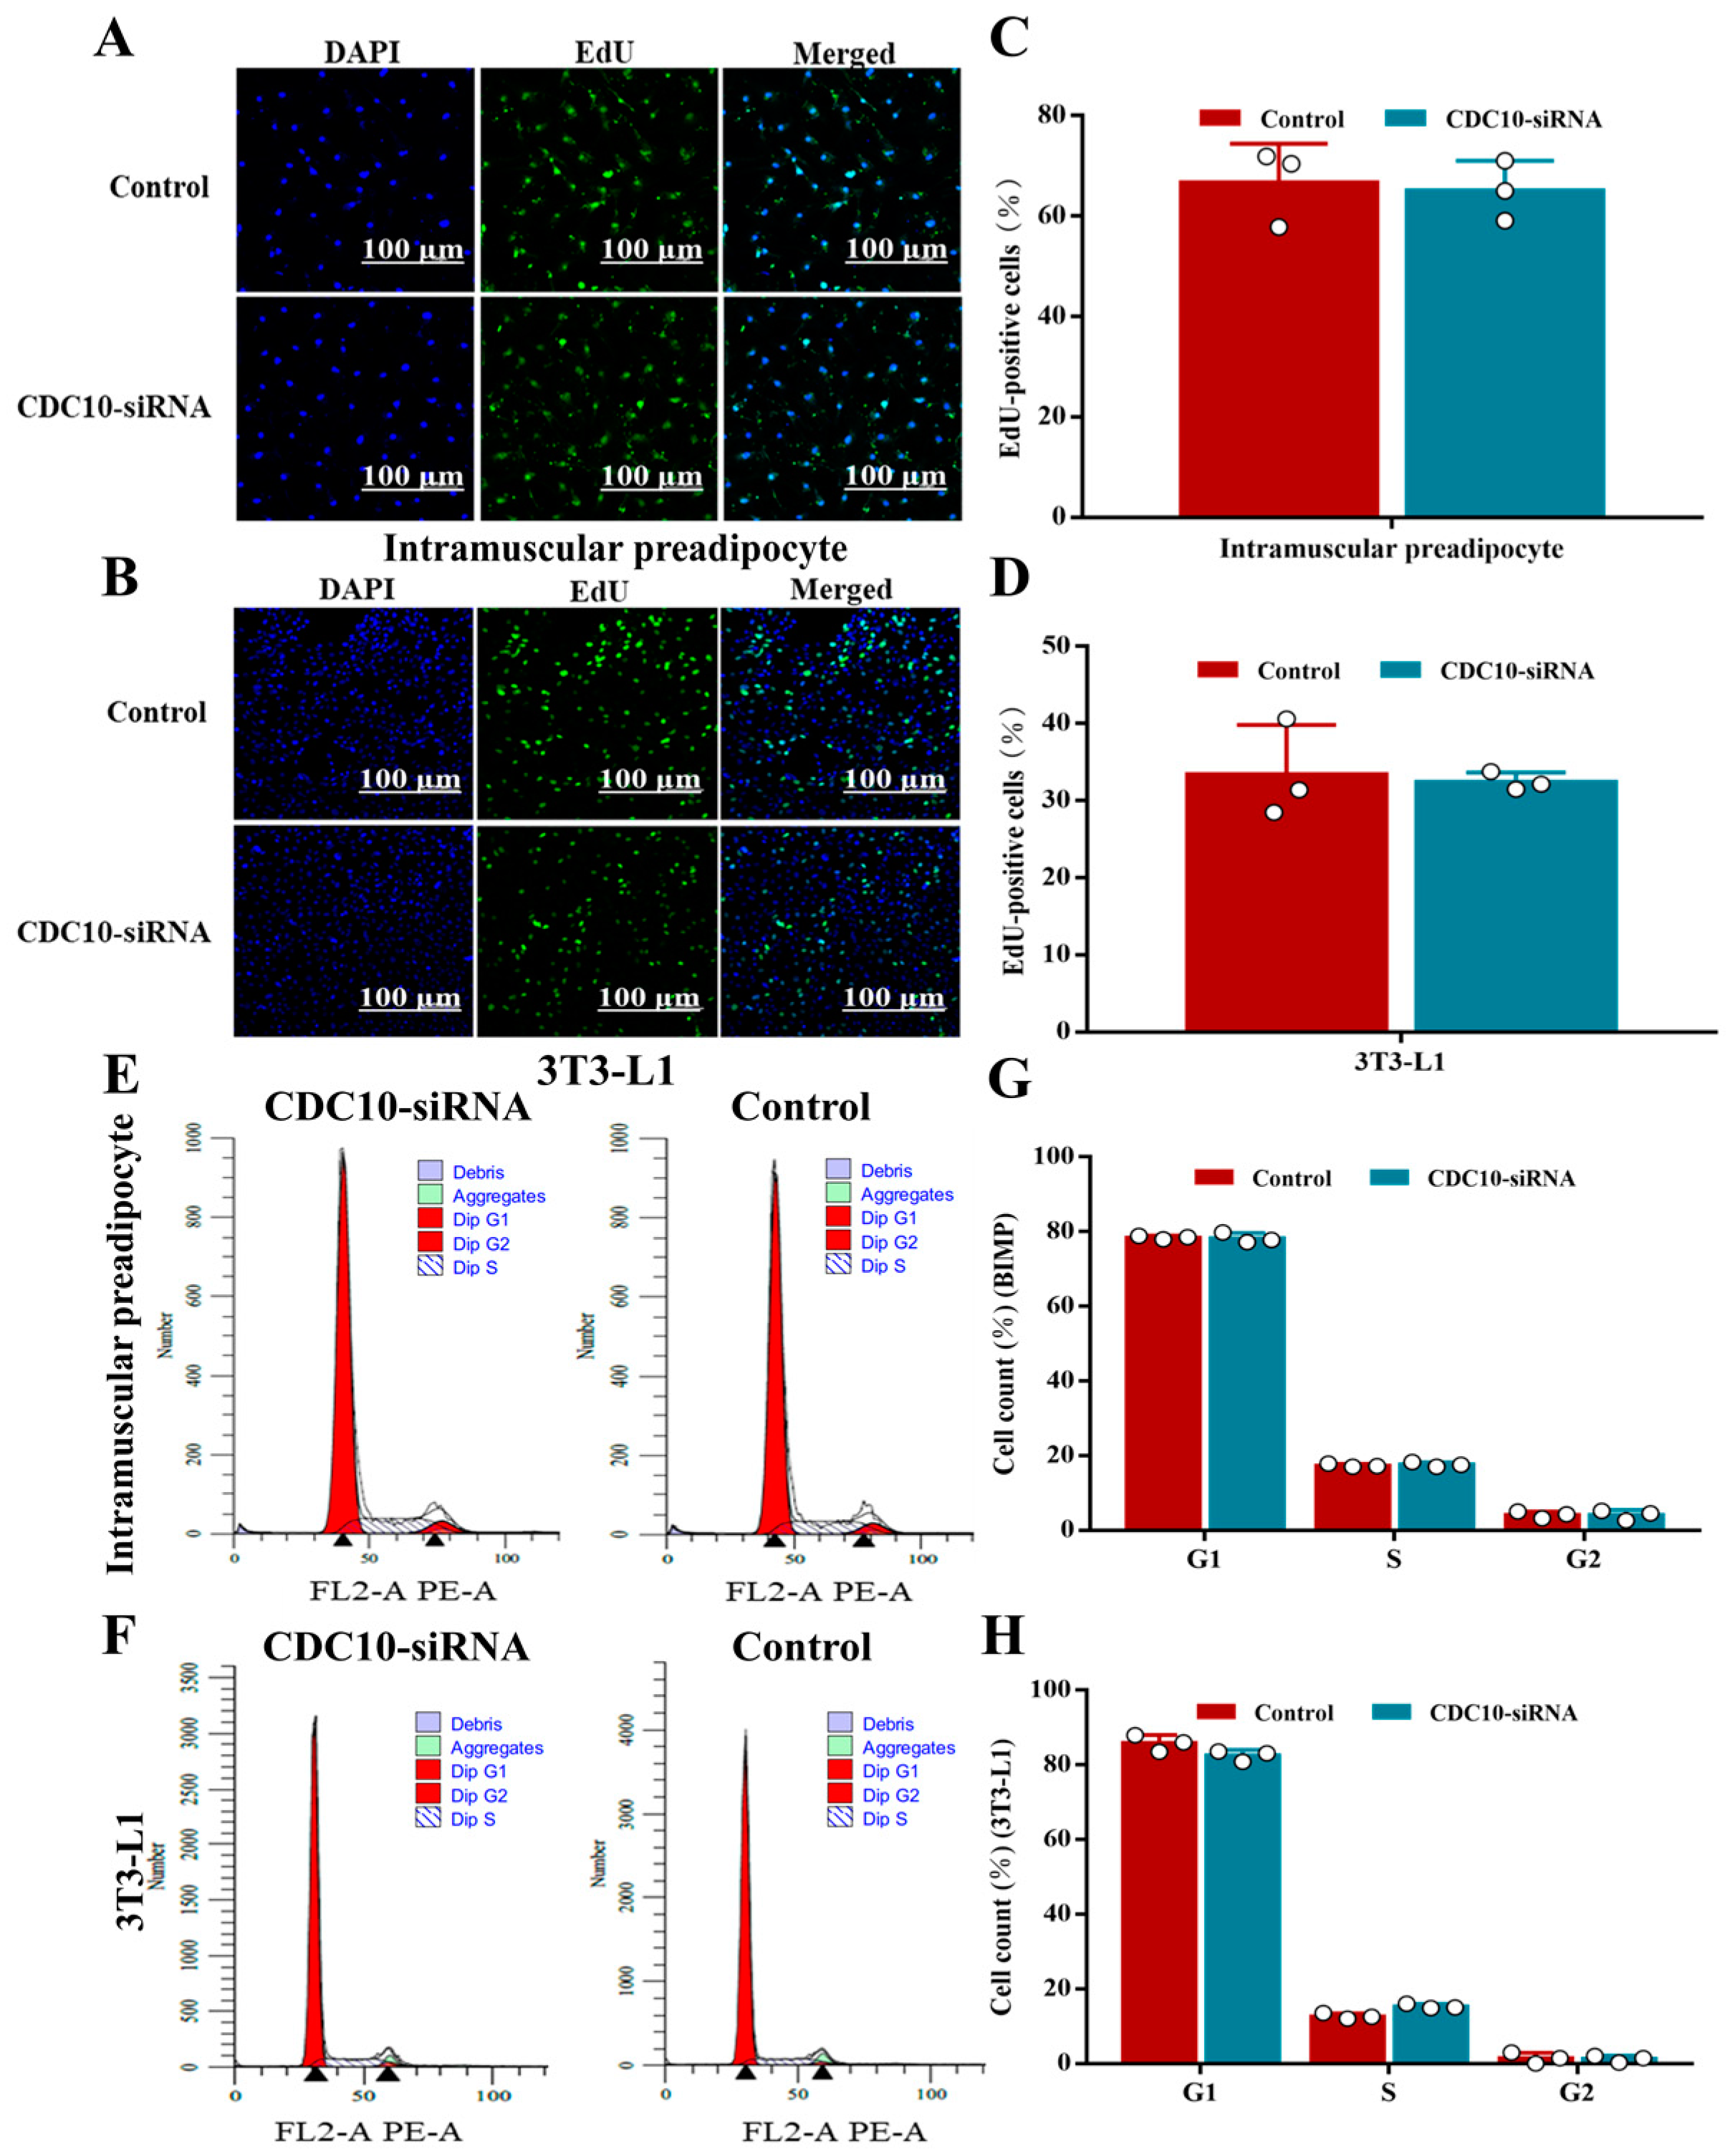
The interference efficiencies of the six siRNAs were detected by RT-PCR. The results indicated that CDC10-siRNA1 in BIMP had the strongest interference efficiency, with 81% and 82% compared to control and NC, respectively (Figure 3A), and CDC10-siRNA3 in 3T3-L1 had the strongest interference efficiency, with 74% and 77% compared to control and NC, respectively (Figure 3B). The interference efficiency in both cell types was greater than 70% and could be used for subsequent experiments. Compared with the control group, knockdown of CDC10 had no significant effect on the expression of CyclinD1 and CyclinB1 in both BIMP and 3T3-L1 cells (Figure 3C,D). Similarly, knockdown of CDC10 had no significant effect on the protein levels of CyclinD1 and CyclinB1 in both BIMP and 3T3-L1 cells (Figure 3E–H). Knockdown of CDC10 had no significant effect in the percentage of EdU-positive BIMP and 3T3-L1 cells compared with the control groups (Figure 4A–D). Moreover, we found using flow cytometry that the proportion of G1, S, and G2 phase cells was not significantly changed in both BIMP and 3T3-L1 cells following knockdown of CDC10 (Figure 4E–H).

3.4. Overexpression of CDC10 Had No Significant Effect on the Proliferation of BIMP and 3T3-L1 Cells

The titer of overexpressed virus was detected by gradient dilution method. The results show that lentivirus titers of BIMP, 3T3-L1, and NC were 1.1 × 10⁻⁶, 3.1 × 10⁻⁶, and 1.6 × 10⁻⁷, respectively. Therefore, these lentiviruses could be used in subsequent tests (Figure 5A). BIMP and 3T3-L1 cells were infected with lentivirus for 96 h. GFP fluorescence was found throughout the field of view and the results showed that BIMPs were effectively transfected (Figure 5B). Compared with the control group, overexpression of CDC10 had no significant effect on the expression of CyclinD1 and CyclinB1 in BIMP and 3T3-L1 cells (Figure 5C,D). Similarly, overexpression of CDC10 had no significant effect on the protein levels of CyclinD1 and CyclinB1 in BIMP and 3T3-L1 cells (Figure 5E–H). Stable cells were screened by flow cytometry after infection. Overexpression of CDC10 had no significant effect in the percentage of EdU-positive BIMP and 3T3-L1 cells compared with the control group (Figure 6A–D). Moreover, we found using flow cytometry that the proportion of G1, S, and G2 phase cells were not significantly changed in BIMP and 3T3-L1 cells following overexpression of CDC10 (Figure 6E–H).

3.5. Knockdown of CDC10 Inhibits Differentiation of BIMP and 3T3-L1 Cells

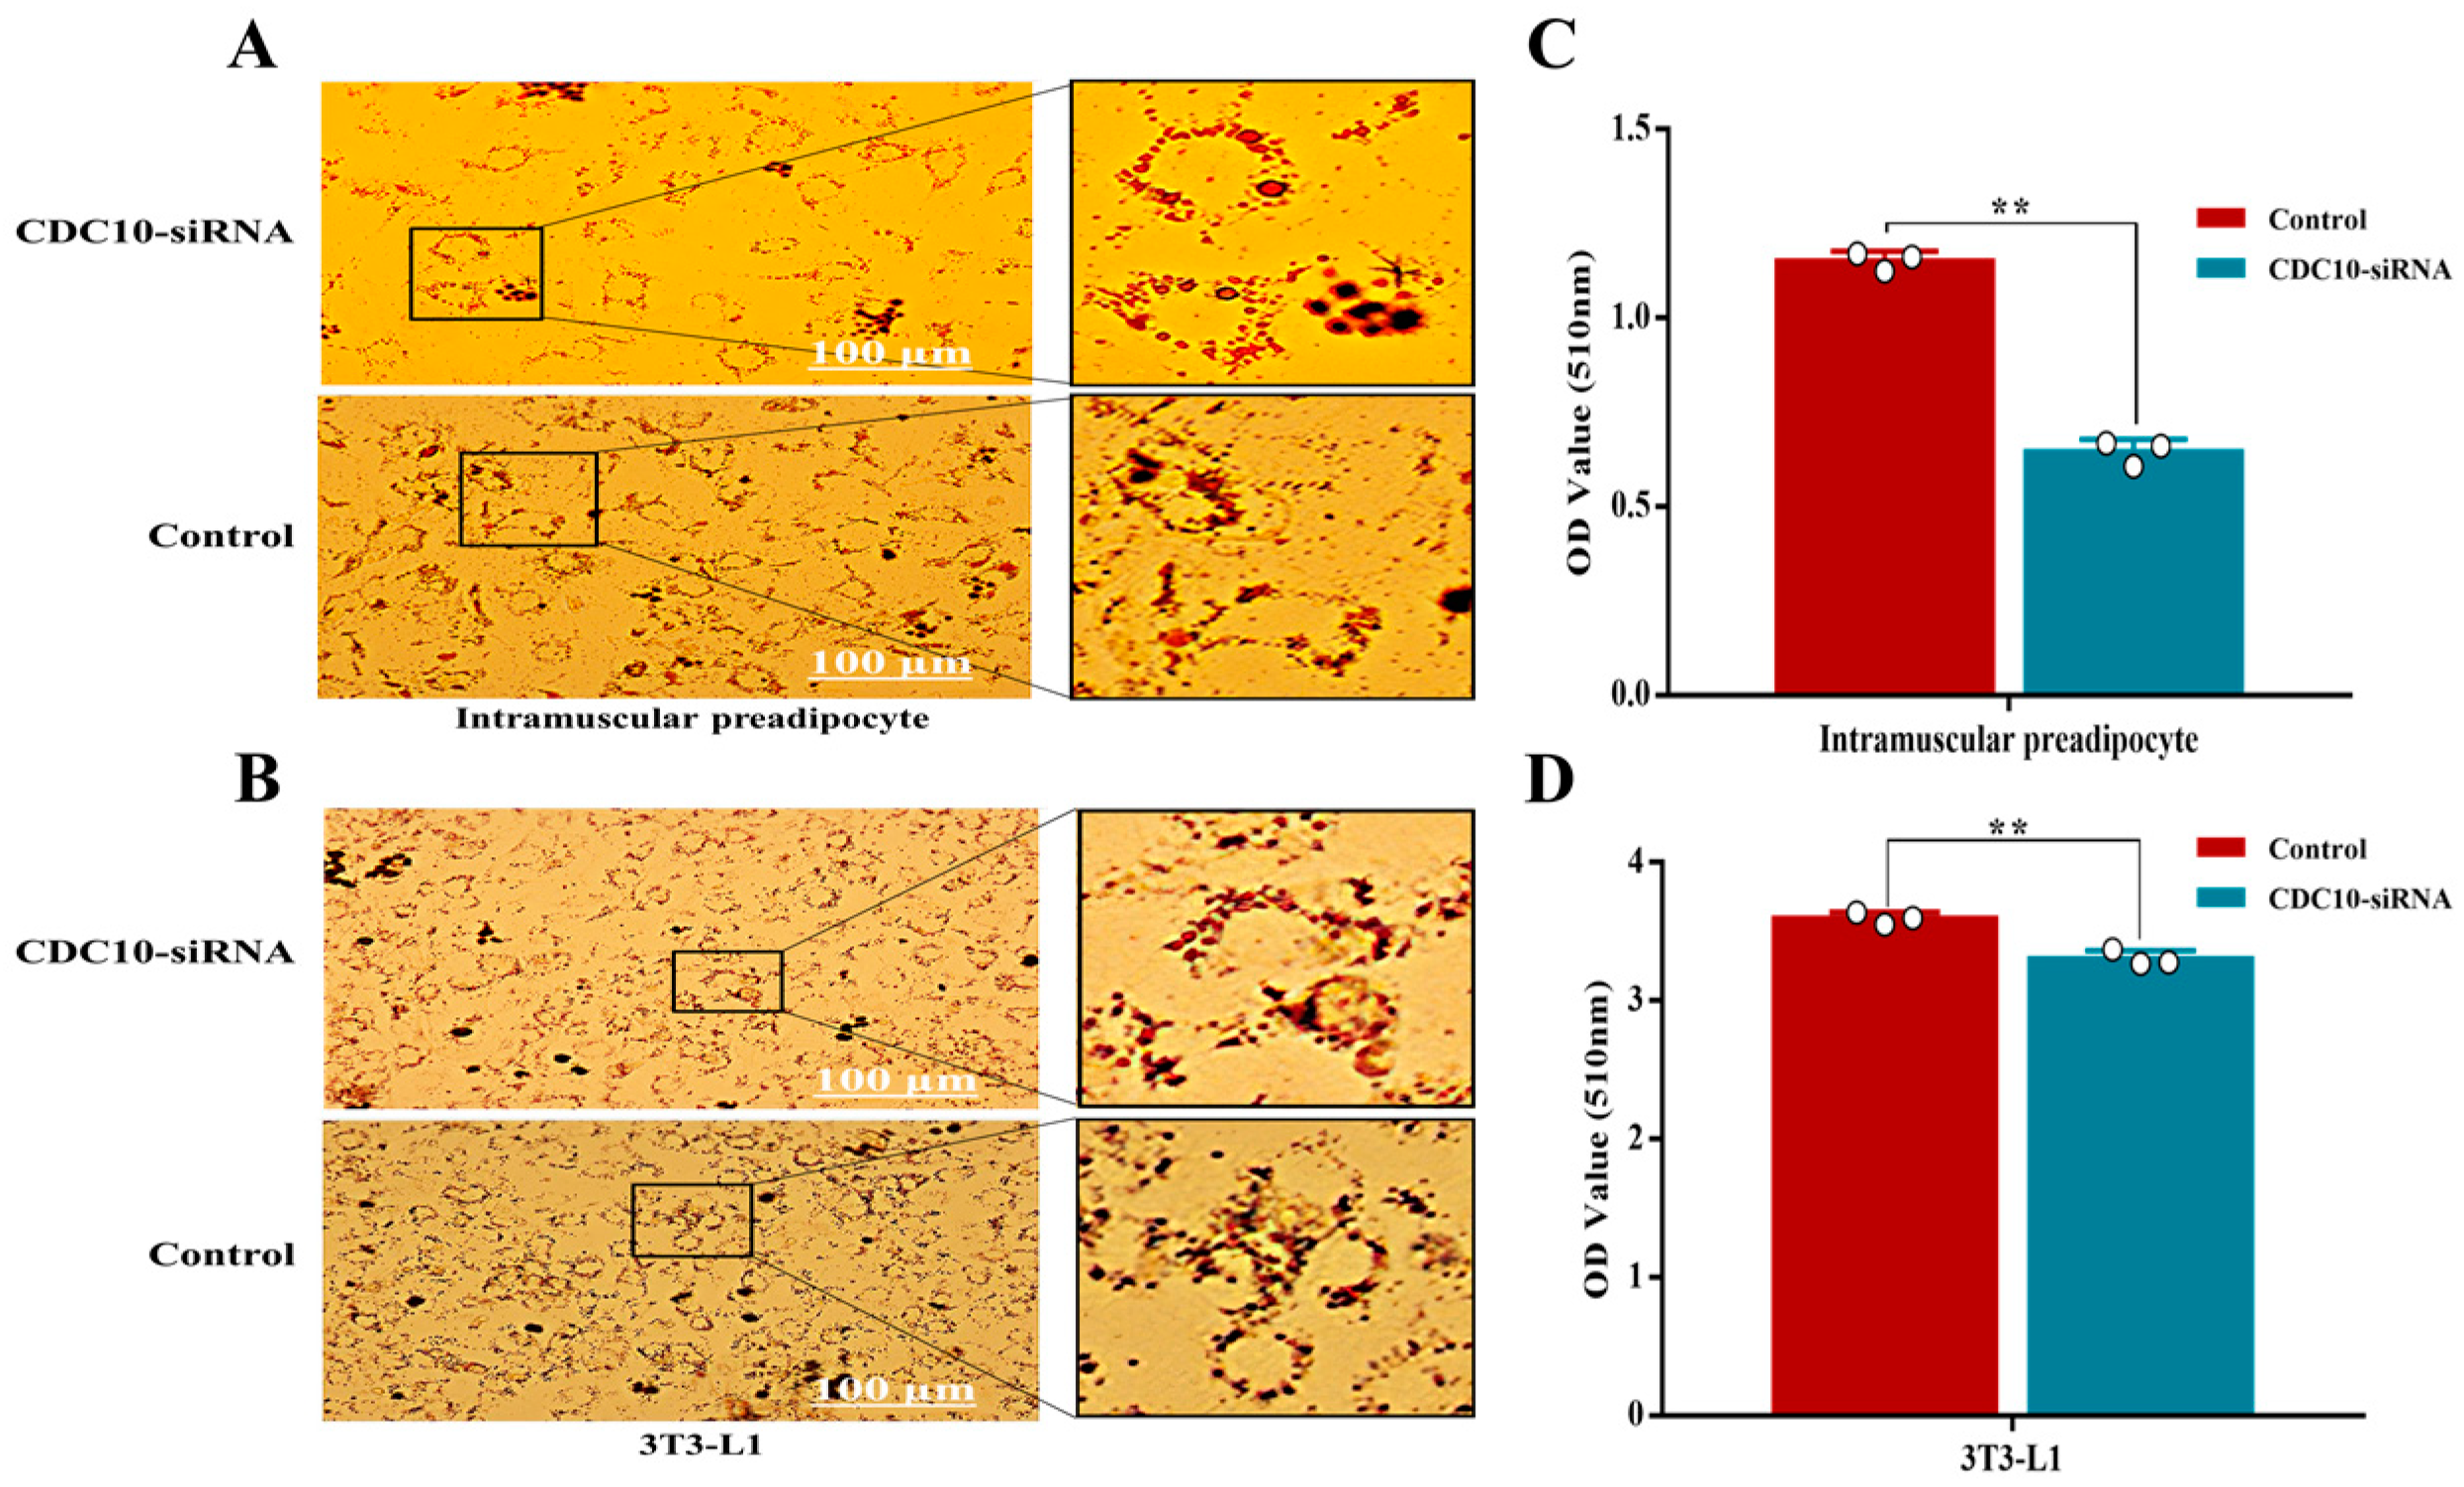
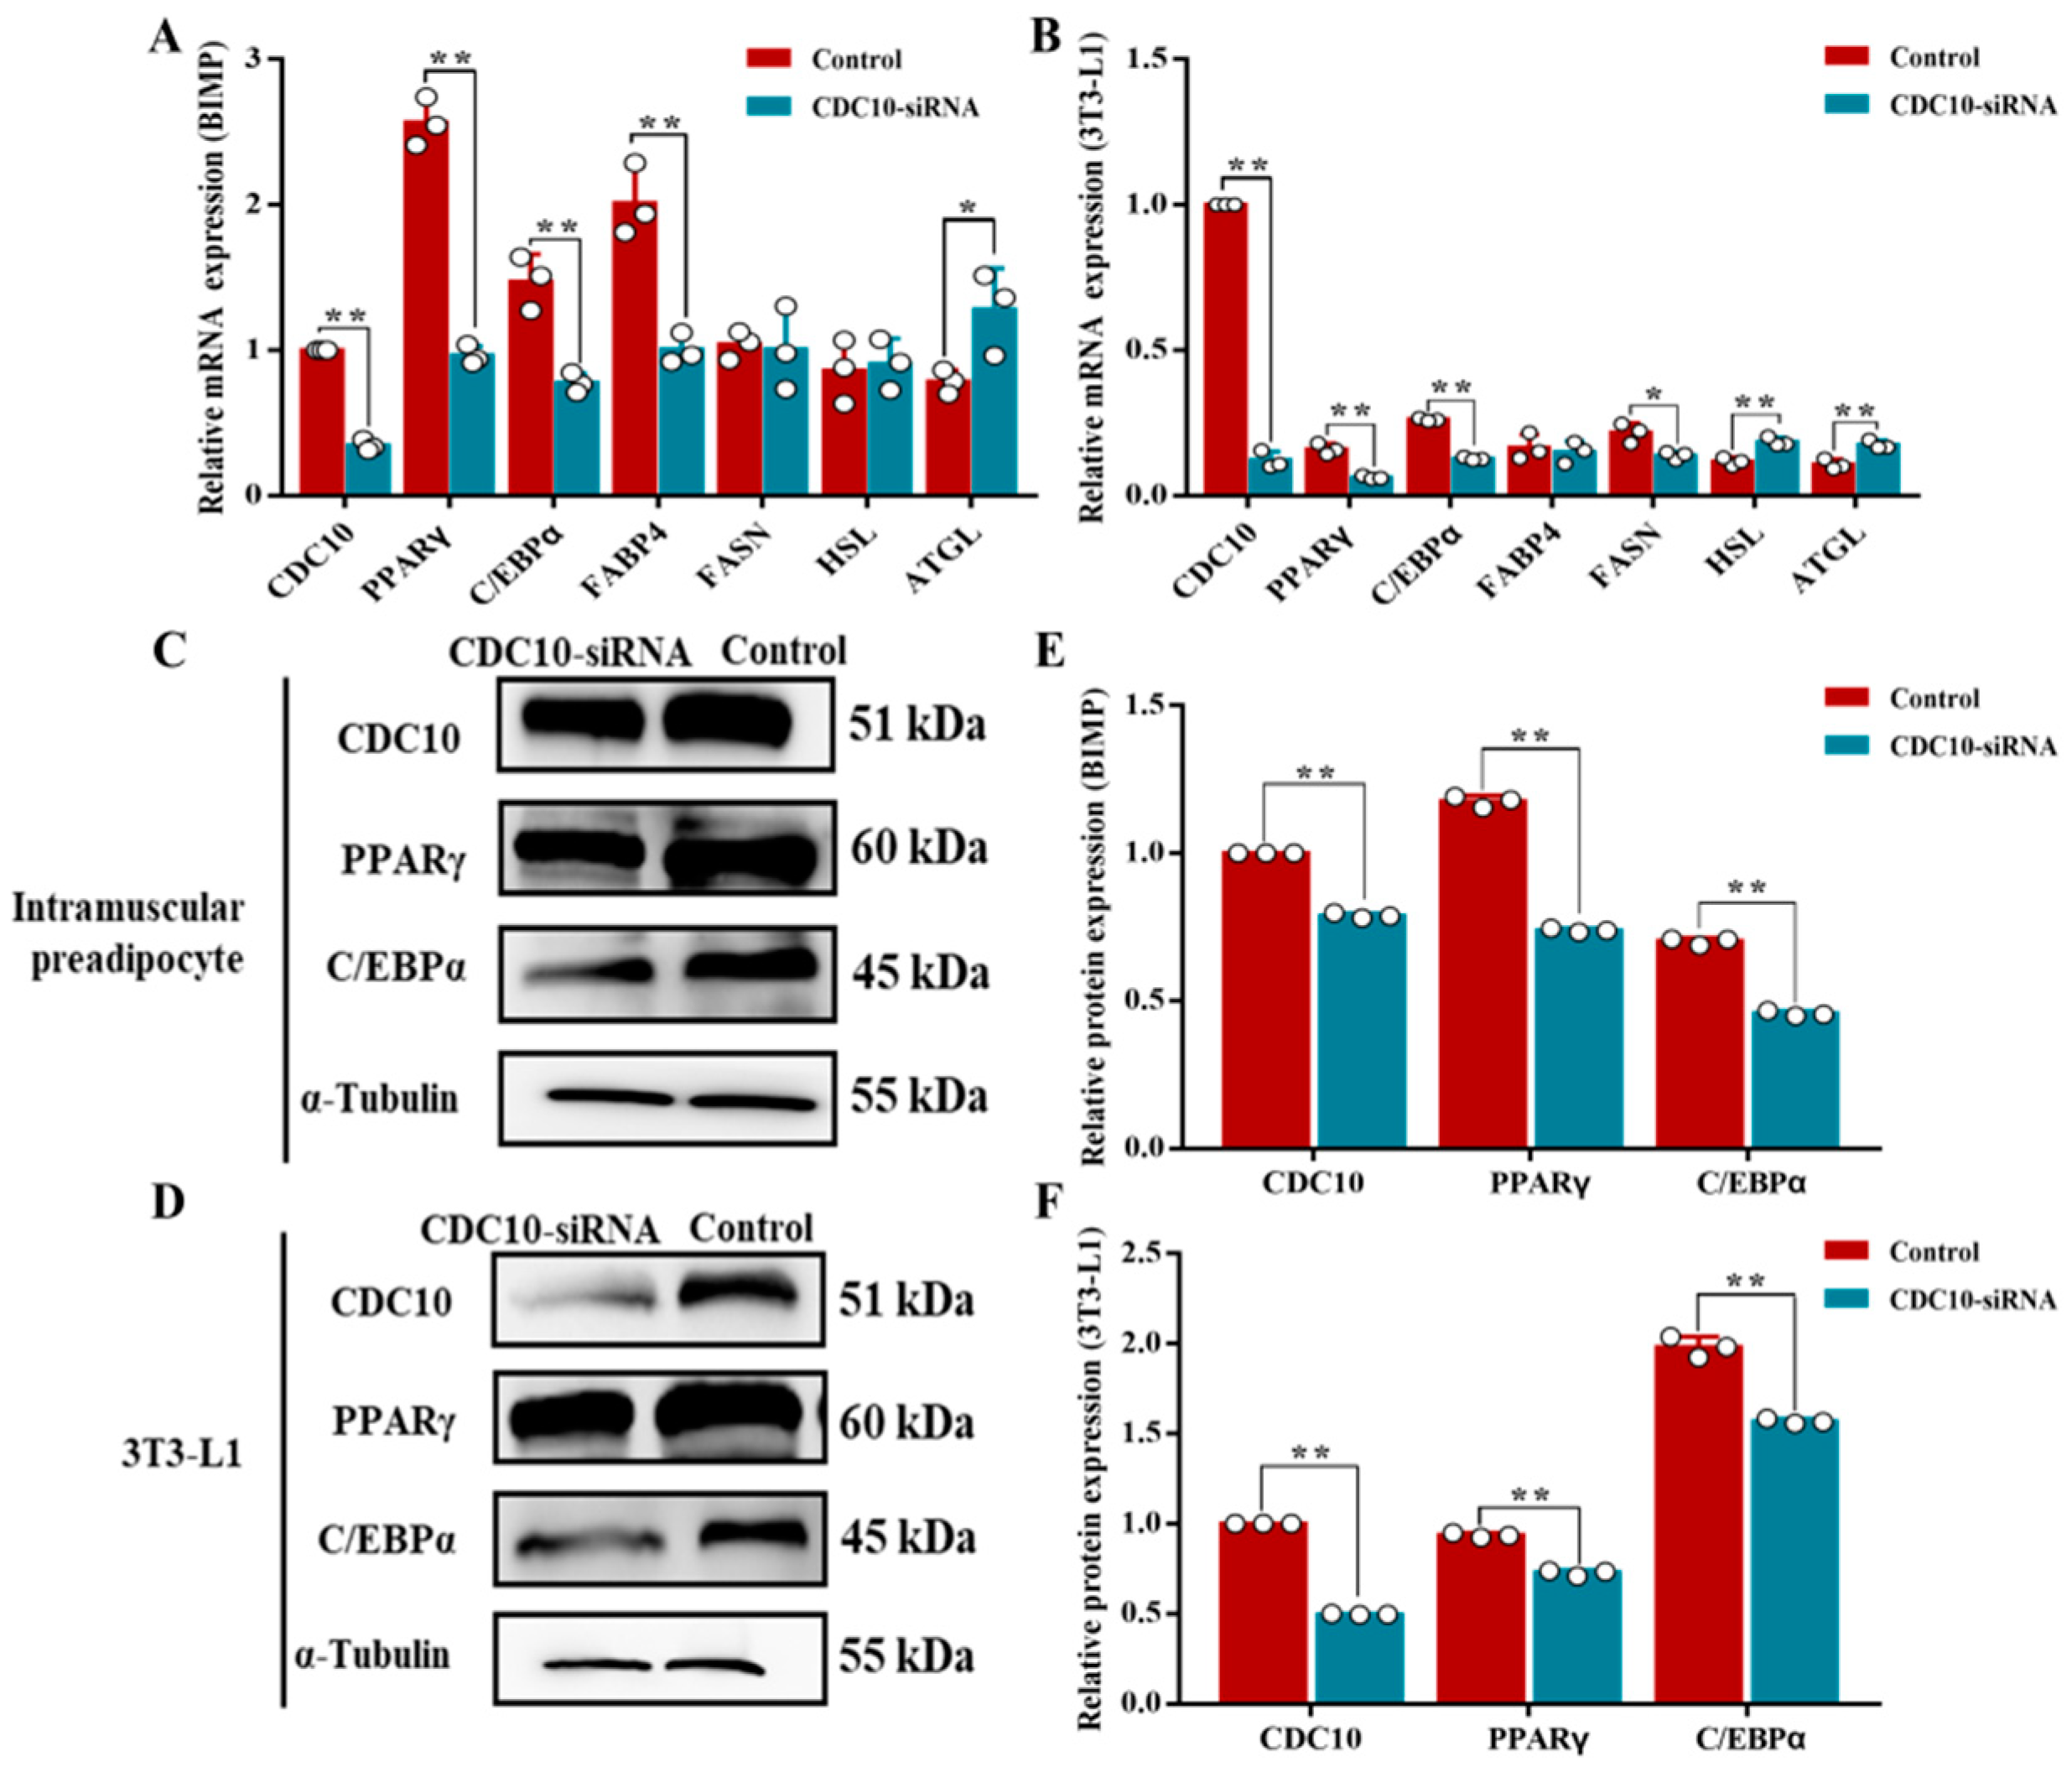
Oil Red O staining revealed that knockdown of CDC10 led to significantly reduced lipid droplets produced by BIMP and 3T3-L1 cells compared with the control groups (Figure 7A,B). The results of Oil Red O extraction showed that knockdown of CDC10 led to decreases in the intracellular lipid content of BIMP and 3T3-L1 cells compared with the control groups (p < 0.01) (Figure 7C,D). RT-PCR results showed that the expression of CDC10 was significantly lower than that of the control groups in BIMP and 3T3-L1 cells (p < 0.01) (Figure 8A,B). The levels of adipogenic marker genes PPARγ, C/EBPα, and fatty acid-binding protein (FABP4) were significantly reduced in BIMPs at the mRNA level following knockdown of CDC10 (p < 0.01, p < 0.01, and p < 0.01, respectively) (Figure 8A), while PPARγ, C/EBPα, and fatty acid synthetase (FASN) were significantly reduced in 3T3-L1 at the mRNA level following knockdown of CDC10 (p < 0.01, p < 0.01, and p < 0.05, respectively) (Figure 8B). However, expression of adipose triglyceride lipase (ATGL) was increased in BIMP (p < 0.05) and 3T3-L1 (p < 0.01) after knockdown of CDC10 (Figure 8A,B). Similarly, the protein levels of PPARγ and C/EBPα were significantly reduced in BIMP and 3T3-L1 cells after knockdown of CDC10 (Figure 8C–F).

3.6. Overexpression of CDC10 Promotes Differentiation of BIMP and 3T3-L1 Cells

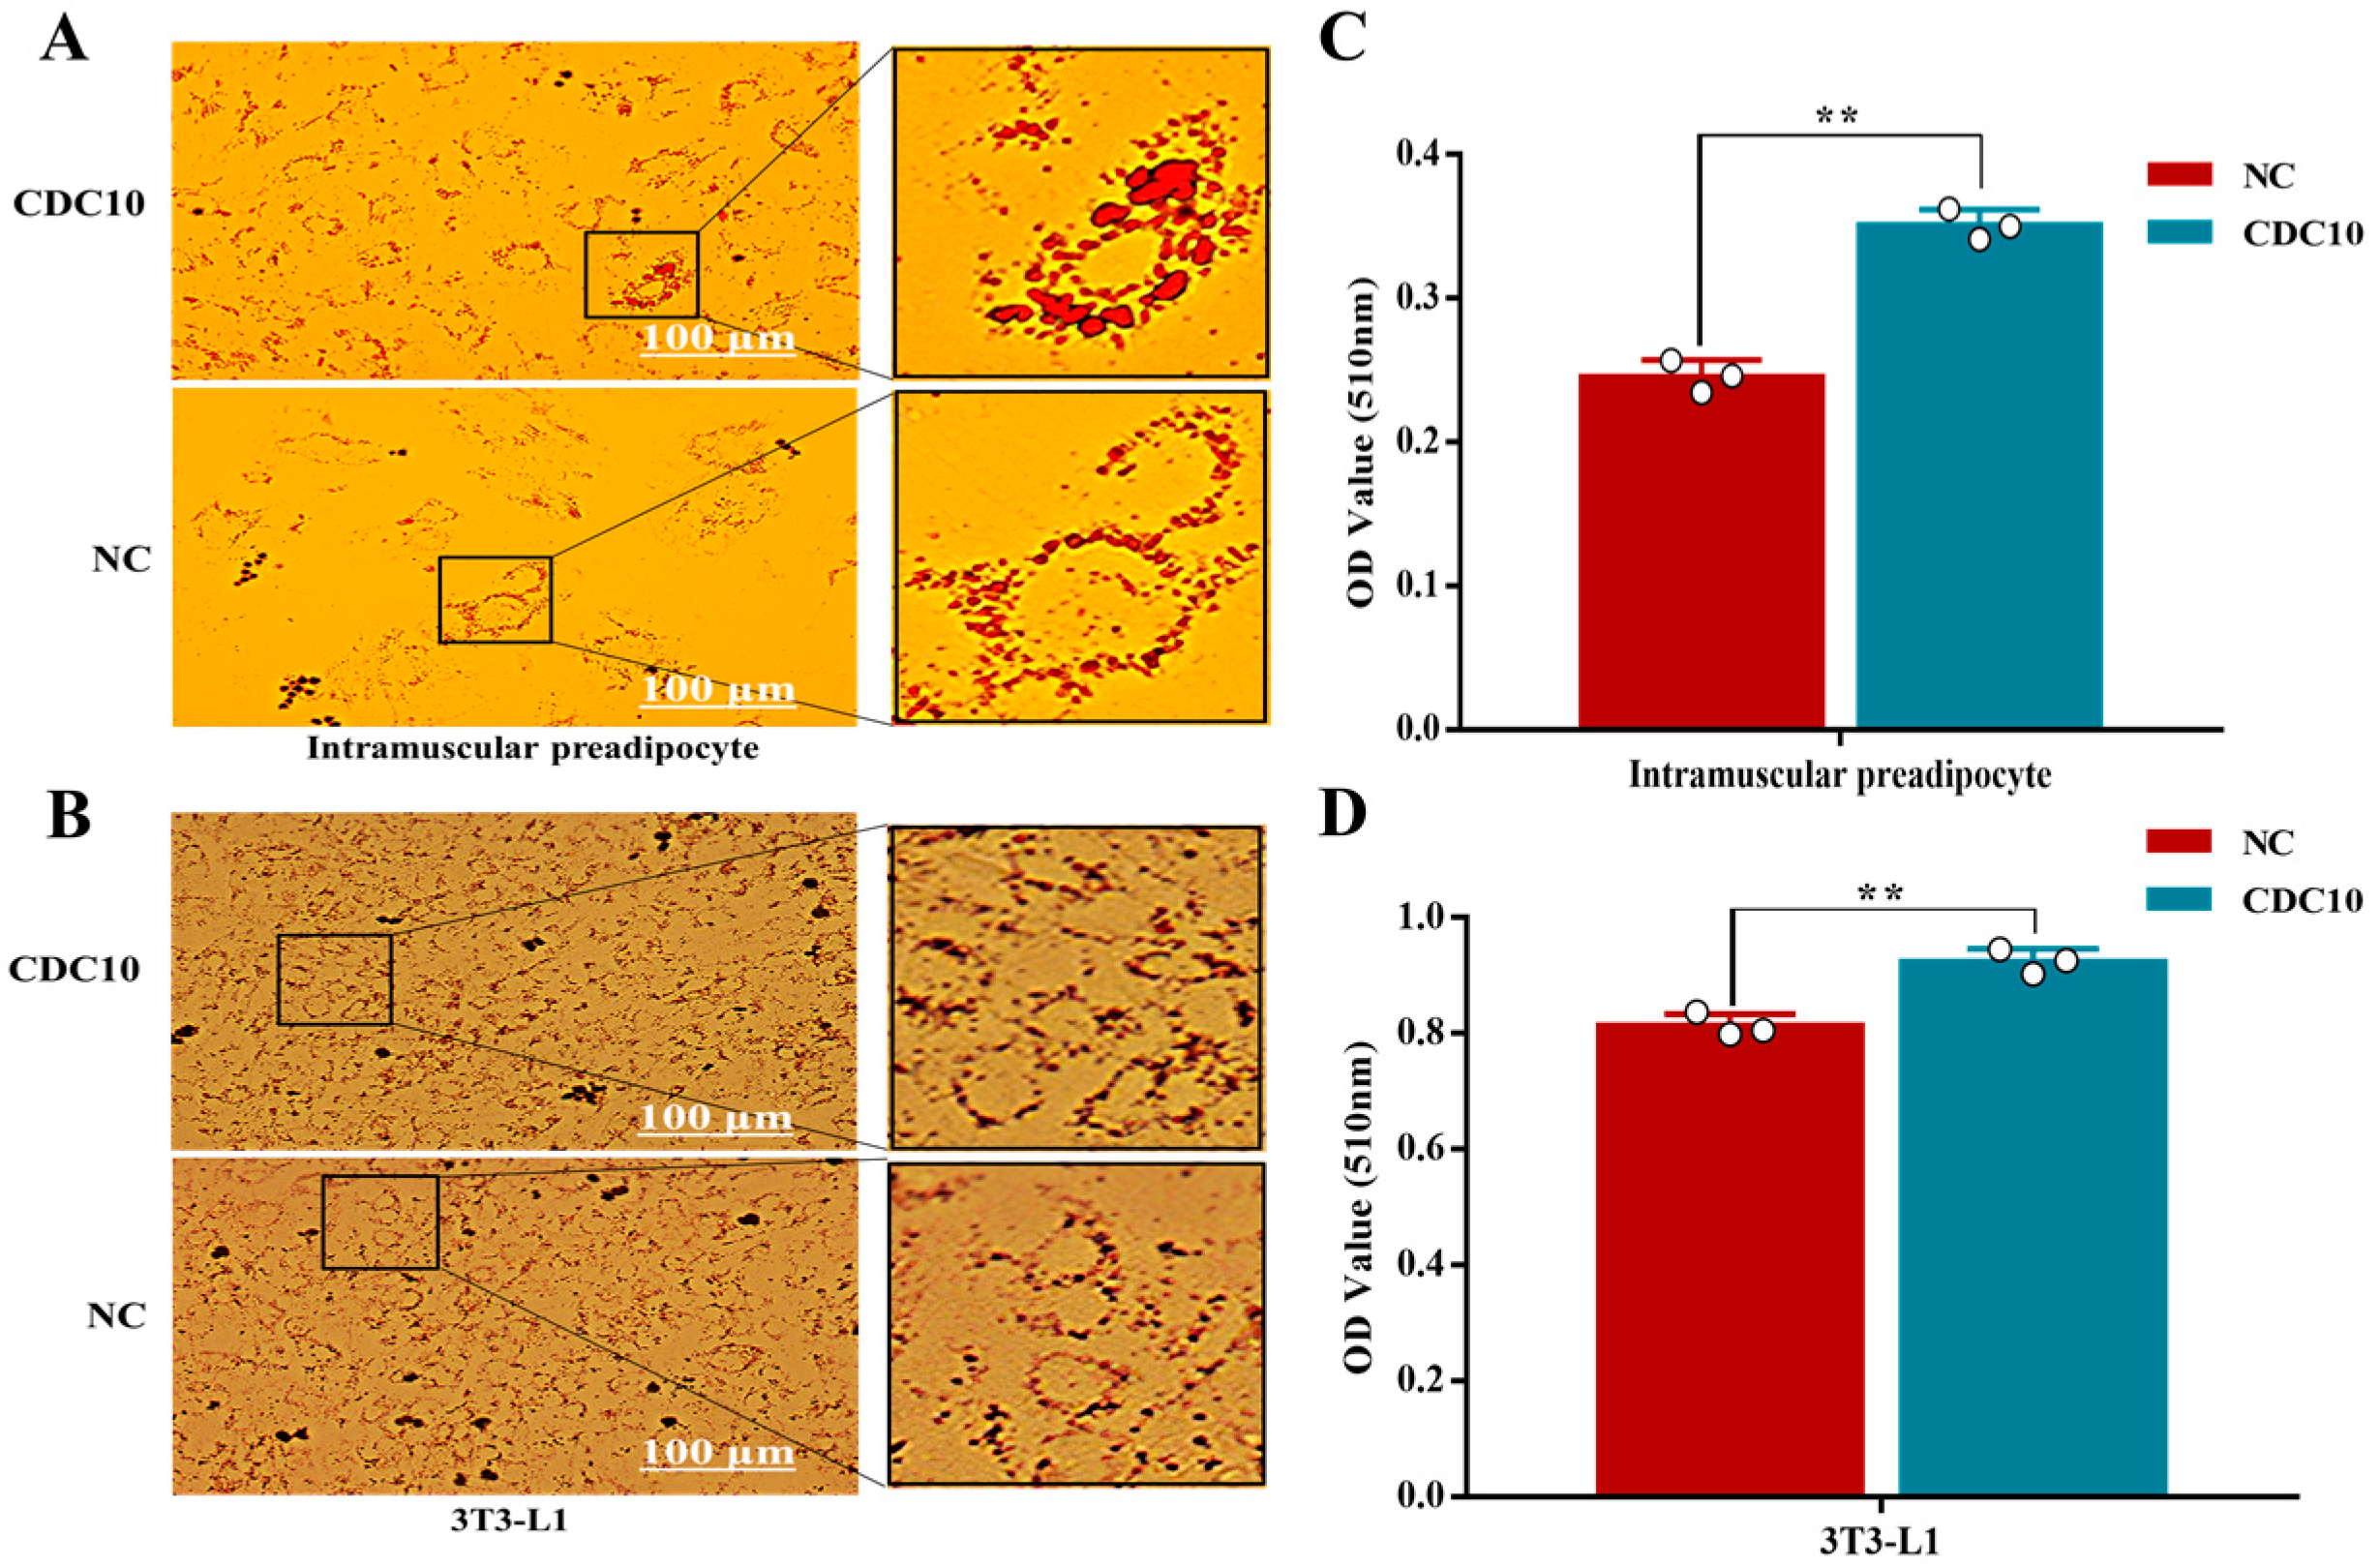
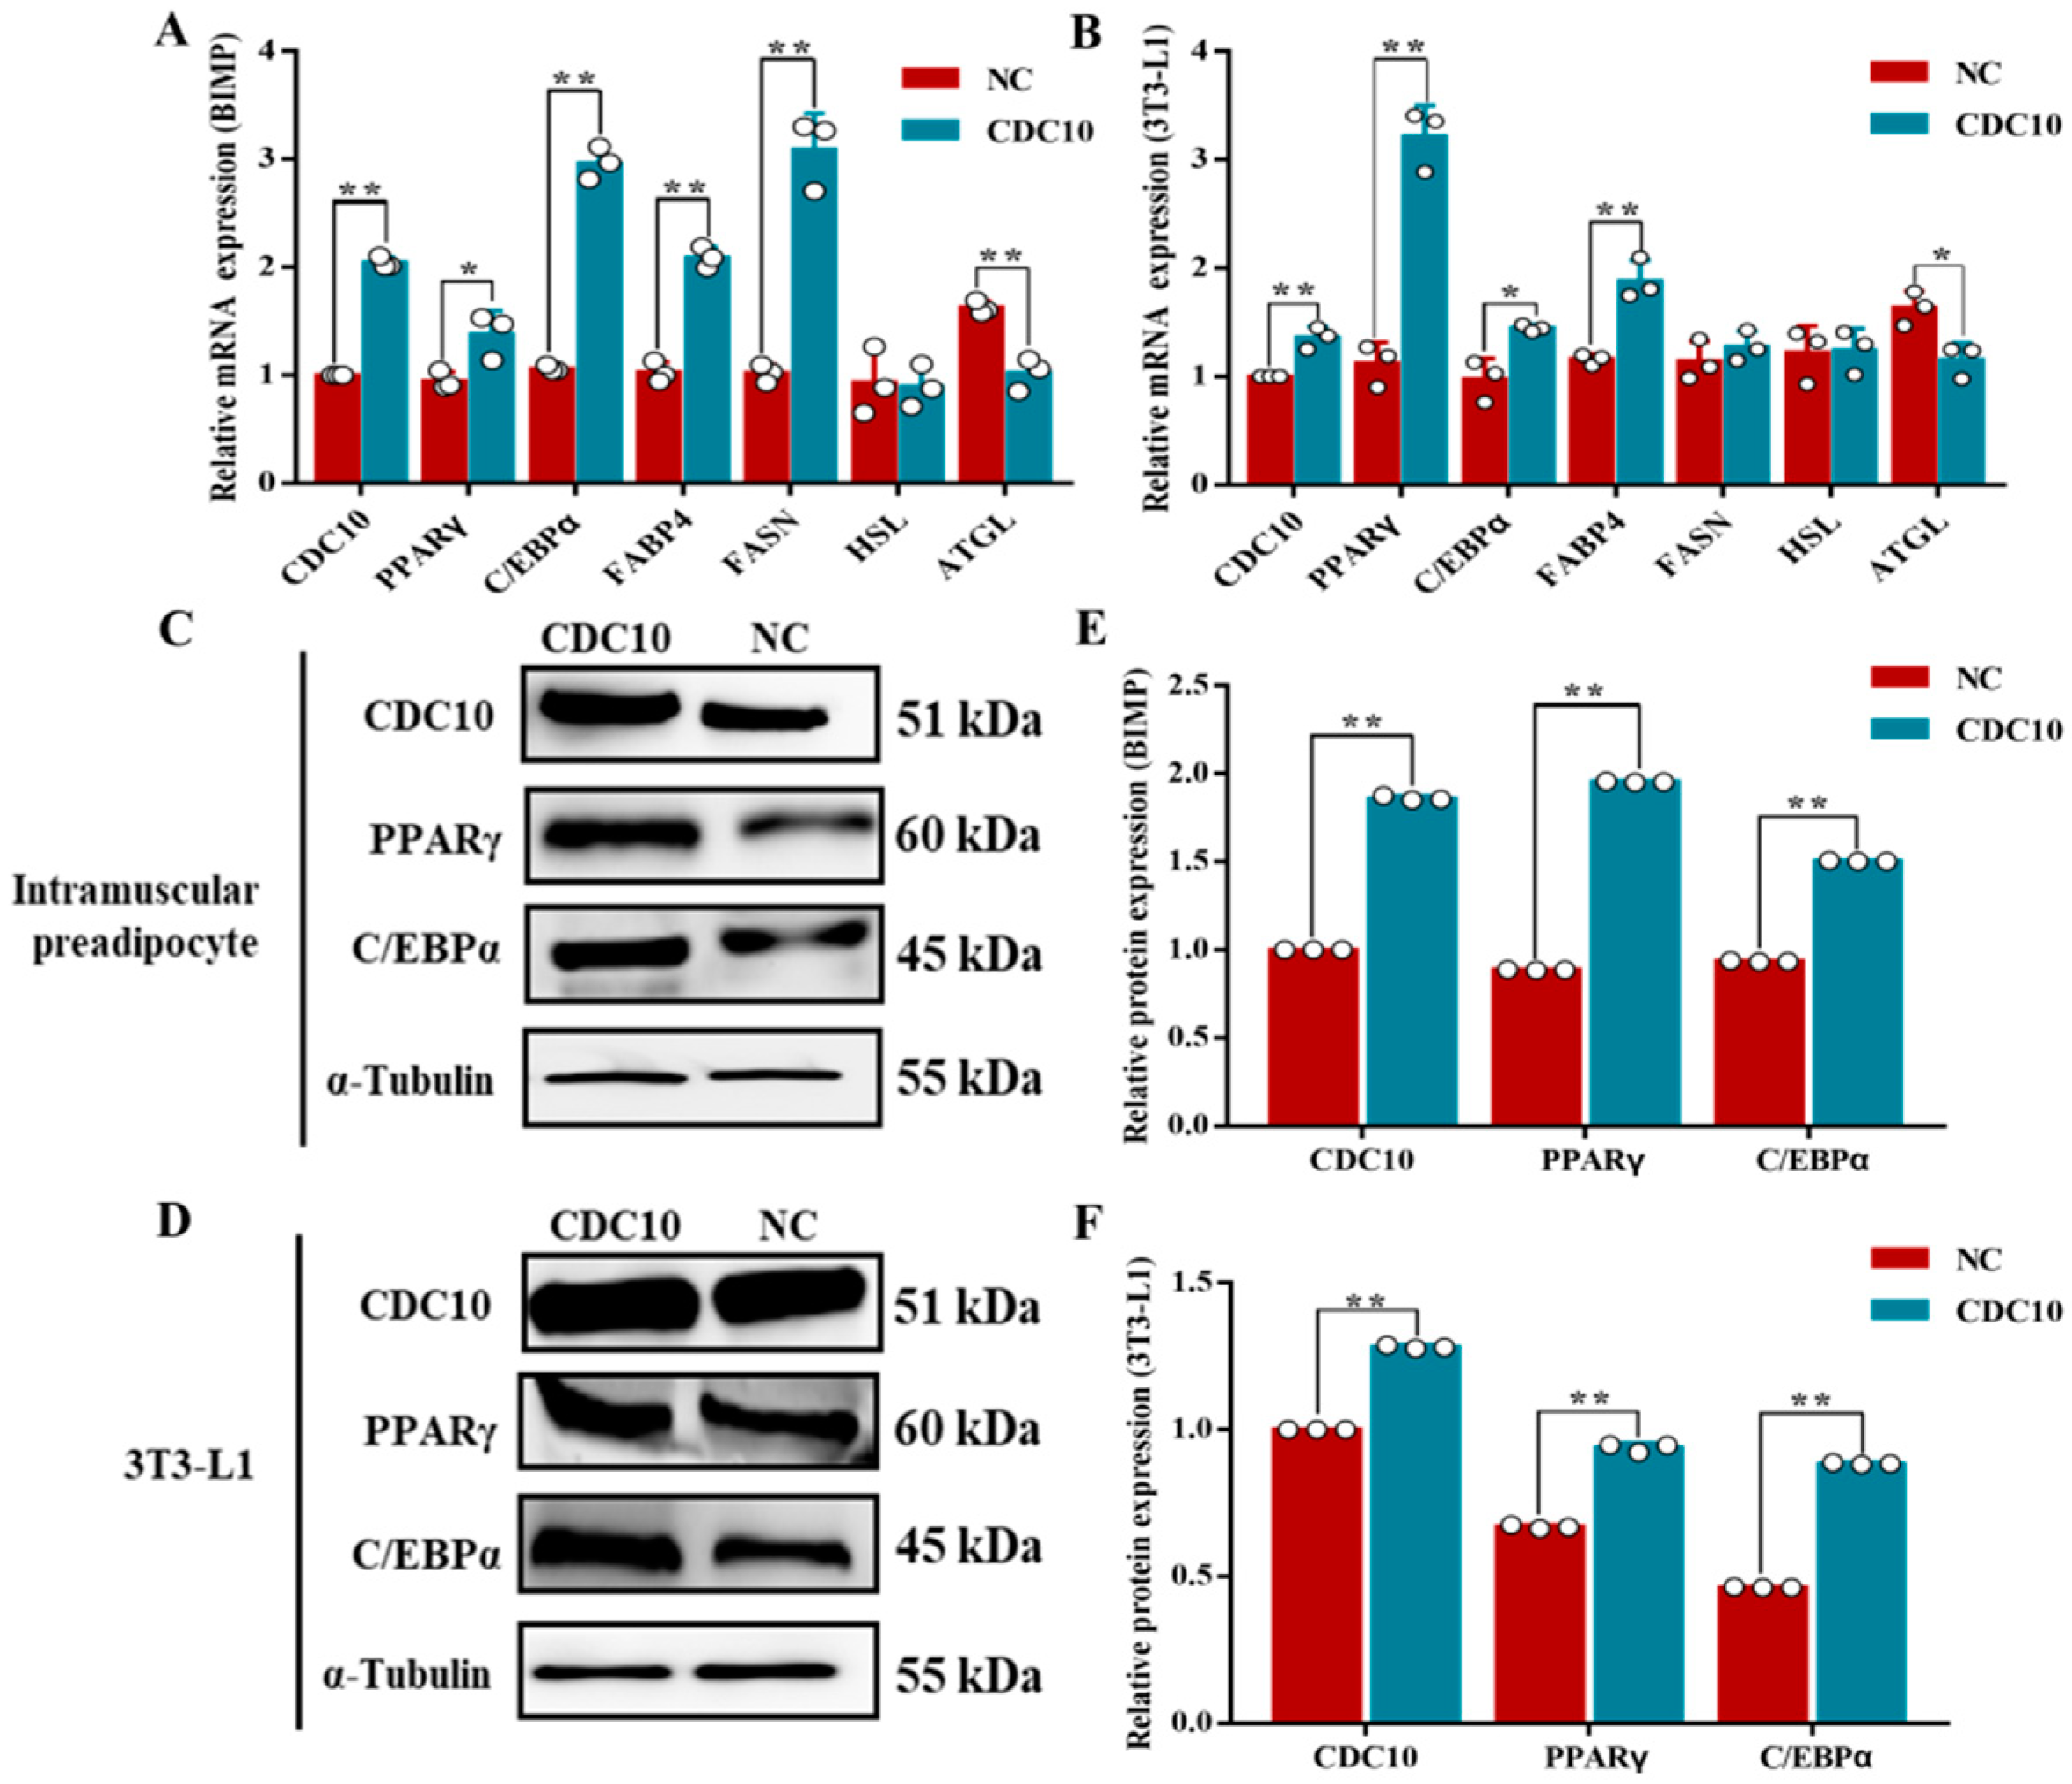
Oil Red O staining revealed that overexpression of CDC10 led to significantly increased lipid droplets produced by BIMP and 3T3-L1 cells compared with the control groups (Figure 9A,B). The results of Oil Red O extraction showed that overexpression of CDC10 led to increases in the intracellular lipid content of BIMP and 3T3-L1 cells compared with the control group (p < 0.01) (Figure 9C,D). RT-PCR results showed that the expression of CDC10 was significantly higher than that of the control group (p < 0.01) (Figure 10A,B). The levels of adipogenic marker genes PPARγ, C/EBPα, FABP4, and FASN were significantly increased in BIMPs at the mRNA level following overexpression of CDC10 (p < 0.05, p <0.01, p < 0.01, and p < 0.01, respectively) (Figure 10A), while PPARγ, C/EBPα, and FABP4 were significantly increased in 3T3-L1 at the mRNA level following overexpression of CDC10 (p < 0.01, p < 0.05, and p < 0.01, respectively) (Figure 10B). However, expression of ATGL was decreased in BIMP (p < 0.01) and 3T3-L1 cells (p < 0.05) after overexpression of CDC10 (Figure 10A,B). Similarly, the protein levels of PPARγ and C/EBPα were significantly increased in BIMP and 3T3-L1 cells after overexpression of CDC10 (Figure 10C–F).

4. Discussion

Marbling is an important determinant of beef quality and nutrient value. Therefore, it is essential to understand the mechanism of IMF deposition in beef cattle [4,28]. Intramuscular fat deposition involves a series of events that initiate and maintain preadipocyte proliferation, differentiation of preadipocyte into adipocytes, and adipocyte maturation in muscle [4,29]. In this study, we first used 3T3-L1 and BIMP cells as experimental materials, interfered with the CDC10 gene expression by siRNA, overexpressed the CDC10 gene by constructing a CDC10 gene lentiviral overexpression vector, and detected the effects on proliferation and differentiation of 3T3-L1 and BIMP cells after interfering and overexpressing the CDC10 gene. Eventually, we first demonstrated that CDC10 could promote the differentiation of BIMP and 3T3-L1 cells, providing new clues to reveal the mechanism of intramuscular fat formation.

4.1. Effect of the CDC10 Gene on Proliferation of BIMP and 3T3-L1 Cells

CDC10 could be considered as a centrosome protein that plays an important role in maintaining cell proliferation [23], and knockdown of the CDC10 gene significantly reduced the proliferation rate of breast cancer cells [22]. Studies on C2C12 cells found that the CDC10 gene is the direct target of miR-127-3p and overexpression of miR-127-3p could significantly inhibit the proliferation of C2C12 cells, whereas interference with miR-127-3p could significantly promote the proliferation of C2C12 cells by regulating the expression of CDC10 [30]. However, there was no effect of CDC10 on the proliferation of 3T3-L1 and BIMP cells by the EdU proliferation assay and the cell cycle-related assay, and also no influence on the expressions of CyclinD1 and CyclinB1 in this study. Thus, we speculate that CDC10 may differentially regulate proliferation in different cell types.

4.2. Effect of the CDC10 Gene on the Differentiation of BIMP and 3T3-L1 Cells

Adipocyte differentiation refers to the accumulation of fat and morphological changes achieved through the expression of a series of lipogenesis-related genes under the regulation of multiple transcription factors. CDC10 can form a reciprocal relationship by binding to the FIT2 gene, which is a key gene for packing fat into lipid droplets and is highly expressed in adipose tissue. During adipocyte differentiation, CDC10 and FIT2 are transiently enriched in lipid droplet formation sites, and the CDC10 gene can influence the formation of new lipid droplets by promoting the expression of FIT2 [27]. This is consistent with our findings that CDC10 can promote the differentiation of 3T3-L1 cells and bovine adipocytes that we observed through the Oil Red O stain assay, which showed that overexpression of CDC10 could increase the formation of lipid droplets, whereas knockdown of CDC10 could decrease formation of lipid droplets in BIMP and 3T3-L1 cells.
In addition, the expression levels of adipogenesis-related transcription factors and their activity could crucially determine the differentiation process of adipocytes. Among them, PPARγ plays an important role in the regulation of adipocyte differentiation, glucolipid metabolism, and insulin signaling. As reported, PPARγ could directly affect a number of genes related to lipid storage in adipocytes and is necessary for adipocyte differentiation [31]. C/EBPα is induced in the late stage of adipogenesis and is most abundant in mature adipocytes [32]. C/EBPα could initiate transcription of adipocyte-specific genes and promotes adipocytes to the terminal differentiation stage [33]. In this study, we first found that the expression levels of CDC10 had an upward trend during the differentiation of BIMP and 3T3-L1 cells. We also found that overexpression of CDC10 could increase the expression levels of PPARγ and C/EBPα, whereas knockdown of CDC10 could decrease the expression levels of PPARγ and C/EBPα in BIMP and 3T3-L1 cells, suggesting that the CDC10 gene has an effect on adipogenesis. Meanwhile, ATGL is the key rate-limiting enzyme involved in the breakdown of fat cells [34]. The main function of ATGL in adipocytes is to regulate lipid droplet size and fat degradation in adipocytes by catalyzing the hydrolysis of triglycerides in adipocytes [35,36]. In this study, overexpression of CDC10 could decrease the expression of ATGL, whereas knockdown of CDC10 could increase the expression of ATGL in BIMP and 3T3-L1 cells. Since PPARγ and C/EBPα are key genes involved in adipogenesis and ATGL is a key gene involved in adipocyte catabolism, we speculate that the promotion of 3T3-L1 and BIMP cell differentiation by CDC10 is achieved by promoting the expressions of the PPARγ and C/EBPα genes and suppressing the expression of the ATGL gene.
Besides, CDC10 depletion could specifically impair ERK1/2 phosphorylation and CDC10 is required for MEK/ERK activation [22]. The ERK1/2 pathway activation could accelerate preadipocyte proliferation and promote their differentiation, and ERK1/2 is required for PPARγ and C/EBPα gene transcription during adipocyte differentiation [37]. Similarly, the expression levels of CDC10 were also positively correlated with marbling scores in Japanese Black cattle [38]. In summary, we speculate that the CDC10 gene could regulate adipogenesis through promoting the expression of PPARγ and C/EBPα by regulating the MEK/ERK signaling pathway in IMF of marbling in beef cattle.

5. Conclusions

In conclusion, this is the first study to demonstrate the regulatory mechanism of the CDC10 gene in the process of preadipocyte proliferation and differentiation. We found that overexpression of CDC10 could promote the differentiation of BIMP and 3T3-L1 cells, whereas knockdown of CDC10 resulted in the opposite consequences. These findings provide new opportunities for improving the meat quality of beef by regulating intramuscular fat deposition and help us to better understand the role and regulatory mechanism of the CDC10 gene in IMF adipogenesis.

Author Contributions

Conceptualization, Z.C., T.Y., J.L. and B.T.; formal analysis, Z.C. and B.T.; methodology, Z.C., X.L., S.B., T.Y., G.C., J.L. and A.C.; project administration, A.C. and B.T.; writing—original draft, Z.C.; writing—review & editing, B.T. All authors have read and agreed to the published version of the manuscript.

Funding

This study was funded by the National Natural Science Foundation (32260819), the State Key Laboratory for Reproductive Regulation and Breeding of Grassland Livestock (2021ZZ0204) of China, and by grants from the Inner Mongolia Science & Technology Plan (2020ZD0007), the Inner Mongolia Engineering Technology Research Center of Germplasm Resources Conservation and Utilization (21400-222526), and the “Grassland Talent” Scholars Program (CYYC6068) of Inner Mongolia Autonomous Region of China, as well as the High-Level Overseas Talents Project ([2018] No. 190) from the Ministry of Human Resources and Social Security of China.

Institutional Review Board Statement

The animal study was reviewed and approved by the Institutional Animal Care and Use Ethics Committee of Inner Mongolia University, with the permit number for conducting animal experiments of IMU-2018-01.

Informed Consent Statement

Not applicable.

Data Availability Statement

The original contributions presented in the study are included in this article; further inquiries can be directed to the corresponding author.

Acknowledgments

The authors thank the Engineering Research Center of Fine Livestock’s Scale Breeding Ministry of Education of China and the Inner Mongolia Engineering Technology Research Center of Germplasm Resources Conservation and Utilization of China.

Conflicts of Interest

The authors declare no conflict of interest.

References

  1. Wang, Y.; Zhou, J.; Wang, G.; Cai, S.; Zeng, X.; Qiao, S. Advances in low-protein diets for swine. J. Anim. Sci. Biotechnol. 2018, 9, 60. [Google Scholar] [CrossRef]
  2. Bahelka, I.; Oravcová, M.; Peškovičová, D.; Tomka, J.; Hanusová, E.; Lahučký, R.; Demo, P. Comparison of accuracy of intramuscular fat prediction in live pigs using five different ultrasound intensity levels. Animal 2009, 3, 1205–1211. [Google Scholar] [CrossRef] [PubMed]
  3. Cho, I.C.; Park, H.B.; Ahn, J.S.; Han, S.H.; Lee, J.B.; Lim, H.T.; Yoo, C.K.; Jung, E.J.; Kim, D.H.; Sun, W.S.; et al. A functional regulatory variant of MYH3 influences muscle fiber-type composition and intramuscular fat content in pigs. PLoS Genet. 2019, 15, e1008279. [Google Scholar] [CrossRef] [PubMed]
  4. Nguyen, D.V.; Nguyen, O.C.; Malau-Aduli, A.E.O. Main regulatory factors of marbling level in beef cattle. Vet. Anim. Sci. 2021, 14, 100219. [Google Scholar] [CrossRef]
  5. Gui, L.; Jiang, B.; Zhang, Y.; Zan, L. Sequence variants in the bovine silent information regulator 6, their linkage and their associations with body measurements and carcass quality traits in Qinchuan cattle. Gene 2015, 559, 16–21. [Google Scholar] [CrossRef]
  6. Wang, Y.; Yang, W.; Gui, L.; Wang, H.; Zan, L. Association and expression analyses of the Ucp2 and Ucp3 gene polymorphisms with body measurement and meat quality traits in Qinchuan cattle. J. Genet. 2016, 95, 939–946. [Google Scholar] [CrossRef]
  7. Gui, L.; Wu, H.; Raza, S.H.A.; Schreurs, N.M.; Shah, M.A. The effect of haplotypes in the promoter region of SIRT4 gene on the ultrasound traits in Qinchuan cattle. Trop. Anim. Health Prod. 2019, 51, 1877–1882. [Google Scholar] [CrossRef]
  8. Raza, S.H.A.; Khan, R.; Abdelnour, S.A.; Abd El-Hack, M.E.; Khafaga, A.F.; Taha, A.; Ohran, H.; Mei, C.; Schreurs, N.M.; Zan, L. Advances of Molecular Markers and Their Application for Body Variables and Carcass Traits in Qinchuan Cattle. Genes 2019, 10, 717. [Google Scholar] [CrossRef]
  9. Li, Y.; Cheng, G.; Yamada, T.; Liu, J.; Zan, L.; Tong, B. Effect of Expressions and SNPs of Candidate Genes on Intramuscular Fat Content in Qinchuan Cattle. Animals 2020, 10, 1370. [Google Scholar] [CrossRef]
  10. Gui, L.S.; Raza, S.H.A.; Memon, S.; Li, Z.; Abd El-Aziz, A.H.; Ullah, I.; Jahejo, A.R.; Shoorei, H.; Khan, R.; Quan, G.; et al. Association of hormone-sensitive lipase (HSL) gene polymorphisms with the intramuscular fat content in two Chinese beef cattle breeds. Genomics 2020, 112, 3883–3889. [Google Scholar] [CrossRef]
  11. Raza, S.H.A.; Khan, S.; Amjadi, M.; Abdelnour, S.A.; Ohran, H.; Alanazi, K.M.; Abd El-Hack, M.E.; Taha, A.E.; Khan, R.; Gong, C.; et al. Genome-wide association studies reveal novel loci associated with carcass and body measures in beef cattle. Arch. Biochem. Biophys. 2020, 694, 108543. [Google Scholar] [CrossRef] [PubMed]
  12. Weirich, C.S.; Erzberger, J.P.; Barral, Y. The septin family of GTPases: Architecture and dynamics. Nat. Rev. Mol. Cell Biol. 2008, 9, 478–489. [Google Scholar] [CrossRef] [PubMed]
  13. Katharina, N.; Barbara, Z. The Mammalian Septin Interactome. Front. Cell Dev. Biol. 2017, 5, 3. [Google Scholar]
  14. Macara, I.G.; Baldarelli, R.; Field, C.M.; Glotzer, M.; Hayashi, Y.; Hsu, S.C.; Kennedy, M.B.; Kinoshita, M.; Longtine, M.; Low, C.; et al. Mammalian septins nomenclature. Mol. Biol. Cell 2002, 13, 4111–4113. [Google Scholar] [CrossRef] [PubMed]
  15. Makoto, K. The septins. Genome. Biol. 2003, 4, 236. [Google Scholar]
  16. Beites, C.L.; Xie, H.; Bowser, R.; Trimble, W.S. The septin CDCrel-1 binds syntaxin and inhibits exocytosis. Nat. Neurosci. 1999, 2, 434–439. [Google Scholar] [CrossRef]
  17. Field, C.M.; Kellogg, D. Septins: Cytoskeletal polymers or signalling GTPases? Trends. Cell Biol. 1999, 9, 387–394. [Google Scholar] [CrossRef]
  18. Larisch, S.; Yi, Y.; Lotan, R.; Kerner, H.; Eimerl, S.; Tony Parks, W.; Gottfried, Y.; Birkey Reffey, S.; de Caestecker, M.P.; Danielpour, D.; et al. A novel mitochondrial septin-like protein, ARTS, mediates apoptosis dependent on its P-loop motif. Nat. Cell Biol. 2000, 2, 915–921. [Google Scholar] [CrossRef]
  19. Kartmann, B.; Roth, D. Novel roles for mammalian septins: From vesicle trafficking to oncogenesis. J. Cell Sci. 2001, 114, 839–844. [Google Scholar] [CrossRef]
  20. Jia, Z.F.; Huang, Q.; Kang, C.S.; Yang, W.D.; Wang, G.X.; Yu, S.Z.; Jiang, H.; Pu, P.Y. Overexpression of septin 7 suppresses glioma cell growth. J. Neurooncol. 2010, 98, 329–340. [Google Scholar] [CrossRef]
  21. Menon, M.B.; Sawada, A.; Chaturvedi, A.; Mishra, P.; Schuster-Gossler, K.; Galla, M.; Schambach, A.; Gossler, A.; Förster, R.; Heuser, M.; et al. Genetic deletion of SEPT7 reveals a cell type-specific role of septins in microtubule destabilization for the completion of cytokinesis. PLoS Genet. 2016, 10, e1004558. [Google Scholar] [CrossRef]
  22. Zhang, N.; Liu, L.; Fan, N.; Zhang, Q.; Wang, W.; Zheng, M.; Ma, L.; Li, Y.; Shi, L. The requirement of SEPT2 and SEPT7 for migration and invasion in human breast cancer via MEK/ERK activation. Oncotarget 2016, 7, 61587–61600. [Google Scholar] [CrossRef] [Green Version]
  23. Chen, T.Y.; Lin, T.C.; Kuo, P.L.; Chen, Z.R.; Cheng, H.L.; Chao, Y.Y.; Syu, J.S.; Lu, F.I.; Wang, C.Y. Septin 7 is a centrosomal protein that ensures S phase entry and microtubule nucleation by maintaining the abundance of p150(glued). J. Cell Physiol. 2021, 236, 2706–2724. [Google Scholar] [CrossRef]
  24. Prusty, D.; Park, B.H.; Davis, K.E.; Farmer, S.R. Activation of MEK/ERK signaling promotes adipogenesis by enhancing peroxisome proliferator-activated receptor gamma (PPARgamma) and C/EBPalpha gene expression during the differentiation of 3T3-L1 preadipocytes. J. Biol. Chem. 2002, 277, 46226–46232. [Google Scholar] [CrossRef]
  25. Chambard, J.C.; Lefloch, R.; Pouyssegur, J.; Lenormand, P. ERK implication in cell cycle regulation. Biochim. Biophys. Acta 2007, 1773, 1299–1310. [Google Scholar] [CrossRef]
  26. Kadereit, B.; Kumar, P.; Wang, W.J.; Miranda, D.; Snapp, E.L.; Severina, N.; Torregroza, I.; Evans, T.; Silver, D.L. Evolutionarily conserved gene family important for fat storage. Proc. Natl. Acad. Sci. USA 2008, 105, 94–99. [Google Scholar] [CrossRef]
  27. Chen, F.; Yan, B.; Ren, J.; Lyu, R.; Wu, Y.; Guo, Y.; Li, D.; Zhang, H.; Hu, J. FIT2 organizes lipid droplet biogenesis with ER tubule-forming proteins and septins. J. Cell Biol. 2021, 220, e201907183. [Google Scholar] [CrossRef]
  28. Wang, S.; Zhou, G.; Shu, G.; Wang, L.; Zhu, X.; Gao, P.; Xi, Q.; Zhang, Y.; Yuan, L.; Jiang, Q. Glucose Utilization, Lipid Metabolism and BMP-Smad Signaling Pathway of Porcine Intramuscular Preadipocytes Compared with Subcutaneous Preadipocytes. Cell Physiol. Biochem. 2013, 31, 981–996. [Google Scholar] [CrossRef]
  29. Poleti, M.D.; Regitano, L.C.A.; Souza, G.H.M.F.; Cesar, A.S.M.; Simas, R.C.; Silva-Vignato, B.; Oliveira, G.B.; Andrade, S.C.S.; Cameron, L.C.; Coutinho, L.L. Longissimus dorsi muscle label-free quantitative proteomic reveals biological mechanisms associated with intramuscular fat deposition. J. Proteom. 2018, 179, 30–41. [Google Scholar] [CrossRef]
  30. Li, J.; Wang, G.; Jiang, J.; Zhang, L.; Zhou, P.; Ren, H. MicroRNA-127-3p regulates myoblast proliferation by targeting Sept7. Biotechnol. Lett. 2020, 42, 1633–1644. [Google Scholar] [CrossRef]
  31. Auwerx, J. PPARgamma, the ultimate thrifty gene. Diabetologia 1999, 42, 1033–1049. [Google Scholar] [CrossRef] [PubMed]
  32. Wu, Z.; Rosen, E.D.; Brun, R.; Hauser, S.; Adelmant, G.; Troy, A.E.; McKeon, C.; Darlington, G.J.; Spiegelman, B.M. Cross-regulation of C/EBP alpha and PPAR gamma controls the transcriptional pathway of adipogenesis and insulin sensitivity. Mol. Cell 1999, 3, 151–158. [Google Scholar] [CrossRef] [PubMed]
  33. Yeh, W.C.; Cao, Z.; Classon, M.; McKnight, S.L. Cascade regulation of terminal adipocyte differentiation by three members of the C/EBP family of leucine zipper proteins. Genes Dev. 1995, 9, 168–181. [Google Scholar] [CrossRef] [PubMed]
  34. Cerk, I.K.; Wechselberger, L.; Oberer, M. Adipose Triglyceride Lipase Regulation: An Overview. Curr. Protein Pept. Sci. 2018, 19, 221–233. [Google Scholar] [CrossRef]
  35. Zimmermann, R.; Strauss, J.G.; Haemmerle, G.; Schoiswohl, G.; Birner-Gruenberger, R.; Riederer, M.; Lass, A.; Neuberger, G.; Eisenhaber, F.; Hermetter, A.; et al. Fat mobilization in adipose tissue is promoted by adipose triglyceride lipase. Science 2004, 306, 1383–1386. [Google Scholar] [CrossRef]
  36. Smirnova, E.; Goldberg, E.B.; Makarova, K.S.; Lin, L.; Brown, W.J.; Jackson, C.L. ATGL has a key role in lipid droplet/adiposome degradation in mammalian cells. EMBO Rep. 2006, 7, 106–113. [Google Scholar] [CrossRef]
  37. Wang, M.; Wang, J.J.; Li, J.; Park, K.; Qian, X.; Ma, J.X.; Zhang, S.X. Pigment epithelium-derived factor suppresses adipogenesis via inhibition of the MAPK/ERK pathway in 3T3-L1 preadipocytes. Am. J. Physiol. Endocrinol. Metab. 2009, 297, E1378–E1387. [Google Scholar] [CrossRef]
  38. Tong, B.; Gao, G.Q.; Muramatsu, Y.; Ohta, T.; Kose, H.; Li, G.P.; Fatchiyah, F.; Yamada, T. Association of the expression levels in the longissimus muscle and a SNP in the CDC10 gene with marbling in Japanese Black beef cattle. Meat Sci. 2015, 108, 28–31. [Google Scholar] [CrossRef]
Figure 1. Growth curve of primary cultured bovine intramuscular preadipocyte (BIMP) and identification of adipogenic marker genes. (A) Growth curve of BIMP. (BE) Expression of PPARγ and C/EBPα mRNA during the differentiation of BIMP and 3T3-L1 cells. (F,G) Protein expression of PPARγ and C/EBPα during the differentiation of BIMP and 3T3-L1 cells. RT-PCR data was normalized to day 0.
Animals 13 00609 g001
Figure 2. Expression of the CDC10 gene in the proliferation and differentiation of bovine intramuscular preadipocyte (BIMP) and 3T3-L1 cells. (A,C) Expression of CDC10 mRNA during the proliferation of BIMP and 3T3-L1 cells. (B,D) Expression of CDC10 mRNA during the differentiation of BIMP and 3T3-L1 cells. (E,F) Protein expression of CDC10 during the proliferation and differentiation of BIMP and 3T3-L1 cells. RT-PCR data was normalized to day 0, hour 12, and day 2.
Animals 13 00609 g002
Figure 3. The effect of CDC10 knockdown on the proliferation of bovine intramuscular preadipocyte (BIMP) and 3T3-L1 cells was detected by RT-PCR and Western blot assay. BIMP and 3T3-L1 cells were transfected with CDC10-siRNA for 48 h during proliferation. (A) Detection of CDC10 interference efficiency in BIMP. (B) Detection of CDC10 interference efficiency in 3T3-L1 cells. (C,D) After interference with CDC10-siRNA for 48 h, the expression levels of CDC10, CyclinD1, and CyclinB1 in BIMP and 3T3-L1 cells were determined by RT-PCR and normalized to the β-actin level. (E,F) Protein levels were assessed by Western blot analysis. (G,H) Quantitative analysis of CDC10, CyclinD1, and CyclinB1 proteins in BIMP and 3T3-L1 cells. Values are expressed as mean ± SEM (n = 3). * p < 0.05, ** p < 0.01. RT-PCR data was normalized to control groups of CDC10.
Animals 13 00609 g003
Figure 4. The effect of CDC10 knockdown on the proliferation of bovine intramuscular preadipocyte (BIMP) and 3T3-L1 cells was detected by EdU and flow cytometry assay. BIMP and 3T3-L1 cells were transfected with CDC10-siRNA for 48 h during proliferation. (A,B) The proliferations of BIMP and 3T3-L1 cells were examined by EdU immunofluorescent staining. Green color represents EdU staining and blue color represents cell nuclei stained with Hoechst 33342. (C,D) The percentage of EdU-positive cells were quantified. (EH) Cell cycle phase analysis of BIMP and 3T3-L1 cells by flow cytometry and their statistical results. Values are expressed as mean ± SEM (n = 3).
Animals 13 00609 g004
Figure 5. The effect of CDC10 overexpression on the proliferation of bovine intramuscular preadipocyte (BIMP) and 3T3-L1 cells was detected by RT-PCR and Western blot assay. BIMP and 3T3-L1 cells were transfected with lentivirus for 96 h during proliferation. (A) Determination of lentivirus titer. (B) Quantitative detection of the overexpression efficiency of CDC10 in BIMP and 3T3-L1 cells. (C,D) After overexperssion with lentivirus for 96 h, the expression levels of CDC10, CyclinD1, and CyclinB1 in BIMP and 3T3-L1 cells were determined by RT-PCR and normalized to the β-actin level. (E,F) Protein levels were assessed by Western blot analysis (small band of CDC10 in (E) is a non-specific band). (G,H) Quantitative analysis of CDC10, CyclinD1, and CyclinB1 proteins in BIMP and 3T3-L1 cells. Values are expressed as mean ± SEM (n = 3). ** p < 0.01. RT-PCR data was normalized to control groups of CDC10.
Animals 13 00609 g005
Figure 6. The effect of CDC10 overexpression on the proliferation of bovine intramuscular preadipocyte (BIMP) and 3T3-L1 cells was detected by EdU and flow cytometry assay. BIMP and 3T3-L1 cells were transfected with lentivirus for 96 h during proliferation. (A,B) The proliferations of BIMP and 3T3-L1 cells were examined by EdU immunofluorescent staining. Green color represents EdU staining and blue color represents cell nuclei stained with Hoechst 33342. (C,D) The percentage of EdU-positive cells were quantified. (EH) Cell cycle phase analysis of BIMP and 3T3-L1 cells by flow cytometry and their statistical results. Values are expressed as mean ± SEM (n = 3).
Animals 13 00609 g006
Figure 7. The effect of CDC10 knockdown on the differentiation of bovine intramuscular preadipocyte (BIMP) and 3T3-L1 cells was detected by Oil Red O staining. BIMP and 3T3-L1 cells were transfected with CDC10-siRNA for 9 d during differentiation. (A,B) Oil Red O staining. (C,D) Oil Red O relative absorbance. Values are expressed as mean ± SEM (n = 3). ** p < 0.01.
Animals 13 00609 g007
Figure 8. The effect of CDC10 knockdown on the differentiation of bovine intramuscular preadipocyte (BIMP) and 3T3-L1 cells was detected by RT-PCR and Western blot assay. BIMP and 3T3-L1 cells were transfected with CDC10-siRNA for 9 d during differentiation. (A,B) After interference with CDC10-siRNA for 9 d, the expression levels of CDC10, PPARγ, C/EBPα, FABP4, FASN, HSL, and ATGL were determined by RT-PCR and normalized to the β-actin level. (C,D) Protein levels were assessed by Western blot analysis. (E,F) Quantitative analysis of CDC10, PPARγ, and C/EBPα proteins in BIMP and 3T3-L1 cells. Values are expressed as mean ± SEM (n = 3). * p < 0.05, ** p < 0.01. RT-PCR data was normalized to control groups of CDC10.
Animals 13 00609 g008
Figure 9. The effect of CDC10 overexpression on the differentiation of bovine intramuscular preadipocyte (BIMP) and 3T3-L1 cells was detected by Oil Red O staining. BIMP and 3T3-L1 cells were transfected with lentivirus for 9 d during differentiation. (A,B) Oil Red O staining. (C,D) Oil Red O relative absorbance. Values are expressed as mean ± SEM (n = 3). ** p < 0.01.
Animals 13 00609 g009
Figure 10. The effect of CDC10 overexpression on the differentiation of bovine intramuscular preadipocyte (BIMP) and 3T3-L1 cells was detected by RT-PCR and Western blot assay. BIMP and 3T3-L1 cells were transfected with lentivirus for 9 d during differentiation. (A,B) After overexpression with lentivirus for 9 d, the expression levels of CDC10, PPARγ, C/EBPα, FABP4, FASN, HSL, and ATGL were determined by RT-PCR and normalized to the β-actin level. (C,D) Protein levels were assessed by Western blot analysis. (E,F) Quantitative analysis of CDC10, PPARγ, and C/EBPα proteins in BIMP and 3T3-L1 cells. Values are expressed as mean ± SEM (n = 3). * p < 0.05, ** p < 0.01. RT-PCR data was normalized to control groups of CDC10.
Animals 13 00609 g010
Table 1. Bovine and murine CDC10 siRNA target sequences.
NameTarget Sequence (5′-3′)
si-B-CDC10-01CAGAGGAATGCCAACAGTT
si-B-CDC10-02CCTGATAACAGAGTGCAAT
si-B-CDC10-03GCTGTGGTAGGTAGTAATA
si-M-CDC10-01GCTTTGCCAACCTCCCAAA
si-M-CDC10-02CCAGAGTATCCAGGACCTT
si-M-CDC10-03GGACATGGACTTAAACCAT
B: Bos taurus; M: Mus musculus.
Table 2. Primers for real-time PCR.
NamePrimer Sequence-F (5′-3′)Primer Sequence-R (5′-3′)
B-CDC10TCTGAAGCTGAGCTCCAAAAATTGGTCAAACGGATCCA
B-CyclinD1CTGGTCCTGGTGAACAAACTACAGAGGGCAACGAAGGT
B-CyclinB1GGATACCTATGTGCCCAAGAAGGACGGCGACCCAGACTAAA
B-PPARγTGGAGACCGCCCAGGTTTGCAGCTGGGAGGACTCGGGGTG
B-C/EBPαTGCGCAAGAGCCGGGACAAGACCAGGGAGCTCTCGGGCAG
B-FABP4TCCTTCAAATTGGGCCAGGAACCCTTGGCTTATGCTCTCTCA
B-HSLGAGTTTGAGCGGATCATTCATGAGGCCATGTTTGCTAGAG
B-ATGLTCTGCCTGCTGATTGCTATGGGCCTGGATAAGCTCCTCTT
B-FASNTAAGGTTCAAATTGCTGCGTTCCAGAGCGAAGGAGAGATT
B-β-actinACCACACCTTCTACAACGAGGAACATGATCTGGGTCATCTTC
M-CDC10CTTACACCAGAGGAATGCCAATTTTCAACTTCAGCCACACC
M-CyclinD1ATGTTCGTGGCCTCTAAGATGAAGCAGAAGCAGTTCCATTTGCAGCAG
M-CyclinB1AAGGTGCCTGTGTGTGAACCGTCAGCCCCATCATCTGCG
M-PPARγTTCGCTGATGCACTGCCTATGGAATGCGAGTGGTCTTCCA
M-CEBPαGTGTGCACGTCTATGCTAAACCAGCCGTTAGTGAAGAGTCTCAGTTTG
M-FABP4TGAAATCACCGCAGACGACAACACATTCCACCACCAGCTT
M-HSLTGCCCAGGATTGGATGGTTTGTGAGAACGCTGAGGCTTTG
M-ATGLGGAGGAATGGCCTACTGAACCATCCTCTTCCTGGGGGACAA
M-FASNTTGGCCTACACCCAGAGCTATTGTGGTAGAAGGACACGGC
M-β-actinGGCTGTATTCCCCTCCATCGCCAGTTGGTAACAATGCCATGT
B: Bos taurus; M: Mus musculu.
Disclaimer/Publisher’s Note: The statements, opinions and data contained in all publications are solely those of the individual author(s) and contributor(s) and not of MDPI and/or the editor(s). MDPI and/or the editor(s) disclaim responsibility for any injury to people or property resulting from any ideas, methods, instructions or products referred to in the content.