
A First Investigation into the Use of Differential Somatic Cell Count as a Predictor of Udder Health in Sheep

 , , , ,
Abstract
:Simple Summary
Abstract
1. Introduction
2. Materials and Methods
2.1. Milk Sample Collection
2.2. Analysis of SCC and DSCC
2.3. Statistical Analysis
3. Results
4. Discussion
5. Conclusions
Author Contributions
Funding
Institutional Review Board Statement
Informed Consent Statement
Data Availability Statement
Conflicts of Interest
References
- Hagnestam-Nielsen, C.; Østergaard, S. Economic impact of clinical mastitis in a dairy herd assessed by stochastic simulation using different methods to model yield losses. Animal 2009, 3, 315–328. [Google Scholar] [CrossRef] [PubMed]
- Riggio, V.; Pesce, L.L.; Morreale, S.; Portolano, B. Receiver-operating characteristic curves for somatic cell scores and California mastitis test in Valle del Belice dairy sheep. Vet. J. 2013, 196, 528–532. [Google Scholar] [CrossRef] [PubMed]
- Rosati, R.; Militello, G.; Boselli, C.; Giangolini, G.; Amatiste, S.; Brajon, G.; Gazzoni, S.; Casini, M.; Scatassa, M.L.; Bono, P.; et al. Cellule somatiche nel latte ovino e caprino: Definizione del valore medio nazionale e del valore fisiologico. Sci. Tecnica Lattiero Casearia 2005, 56, 161–181. [Google Scholar]
- Rupp, R.; Boichard, D. Genetics of resistance to mastitis in dairy cattle. Vet. Res. 2003, 34, 671–688. [Google Scholar] [CrossRef]
- Tolone, M.; Larrondo, C.; Yáñez, J.M.; Newman, S.; Sardina, M.T.; Portolano, B. Assessment of genetic variation for pathogen-specific mastitis resistance in Valle del Belice dairy sheep. BMC Vet. Res. 2016, 12, 158. [Google Scholar] [CrossRef] [PubMed]
- Narayana, S.G.; Schenkel, F.; Miglior, F.; Chud, T.; Abdalla, E.A.; Naqvi, S.A.; Malchiodi, F.; Barkema, H.W. Genetic analysis of pathogen-specific intramammary infections in dairy cows. J. Dairy Sci. 2021, 104, 1982–1992. [Google Scholar] [CrossRef]
- Zecconi, A.; Zaghen, F.; Meroni, G.; Sora, V.; Martino, P.A.; Laterza, G.; Zanini, L. Early Milk Total and Differential Cell Counts as a Diagnostic Tool to Improve Antimicrobial Therapy Protocols. Animals 2023, 13, 1143. [Google Scholar] [CrossRef]
- Riggio, V.; Portolano, B.; Bovenhuis, H.; Bishop, S.C. Genetic parameters for somatic cell score according to udder infection status in Valle del Belice dairy sheep and impact of imperfect diagnosis of infection. Genet. Sel. Evol. 2010, 42, 1–9. [Google Scholar] [CrossRef]
- Tolone, M.; Riggio, V.; Portolano, B. Estimation of genetic and phenotypic parameters for bacteriological status of the udder, somatic cell score, and milk yield in dairy sheep using a threshold animal model. Livest. Sci. 2013, 151, 134–139. [Google Scholar] [CrossRef]
- International Dairy Federation. IDF 2013. Guidelines for the Use and Interpretation of Bovine Milk Somatic Cell Counts (SCC) in the Dairy Industry; FIL/IDF: Brussels, Belgium, 2013. [Google Scholar]
- Pengov, A. The role of coagulase-negative Staphylococcus spp. and associated somatic cell counts in the ovine mammary gland. J. Dairy Sci. 2001, 84, 572–574. [Google Scholar] [CrossRef]
- Maurer, J.; Schaeren, W. Udder health and somatic cell counts in ewes. Agrarforschung 2007, 14, 162–167. [Google Scholar]
- Bergonier, D.; Berthelot, X. New advances in epizootiology and control of ewe mastitis. Livest. Prod. Sci. 2003, 79, 1–16. [Google Scholar] [CrossRef]
- Paape, M.J.; Wiggans, G.R.; Bannerman, D.D.; Thomas, D.L.; Sanders, A.H.; Contreras, A.; Moroni, P.; Miller, R.H. Monitoring goat and sheep milk somatic cell counts. Small Rumin. Res. 2007, 68, 114–125. [Google Scholar] [CrossRef]
- Schwarz, D.; Diesterbeck, U.S.; König, S.; Brügemann, K.; Schlez, K.; Zschöck, M.; Wolter, W.; Czerny, C.P. Flow cytometric differential cell counts in milk for the evaluation of inflammatory reactions in clinically healthy and subclinically infected bovine mammary glands. J. Dairy Sci. 2011, 94, 5033–5044. [Google Scholar] [CrossRef]
- Stocco, G.; Summer, A.; Cipolat-Gotet, C.; Zanini, L.; Vairani, D.; Dadousis, C.; Zecconi, A. Differential somatic cell count as a novel indicator of milk quality in dairy cows. Animals 2020, 10, 753. [Google Scholar] [CrossRef] [PubMed]
- Damm, M.; Holm, C.; Blaabjerg, M.; Bro, M.N.; Schwarz, D. Differential somatic cell count—A novel method for routine mastitis screening in the frame of Dairy Herd Improvement testing programs. J. Dairy Sci. 2017, 100, 4926–4940. [Google Scholar] [CrossRef]
- Bobbo, T.; Penasa, M.; Cassandro, M. Short communication: Genetic aspects of milk differential somatic cell count in Holstein cows: A preliminary analysis. J. Dairy Sci. 2019, 102, 4275–4279. [Google Scholar] [CrossRef] [PubMed]
- Schwarz, D.; Lipkens, Z.; Piepers, S.; De Vliegher, S. Investigation of differential somatic cell count as a potential new supplementary indicator to somatic cell count for identification of intramammary infection in dairy cows at the end of the lactation period. Prev. Vet. Med. 2019, 172, 104803. [Google Scholar] [CrossRef]
- Kirkeby, C.; Toft, N.; Schwarz, D.; Farre, M.; Nielsen, S.S.; Zervens, L.; Hechinger, S.; Halasa, T. Differential somatic cell count as an additional indicator for intramammary infections in dairy cows. J. Dairy Sci. 2020, 103, 1759–1775. [Google Scholar] [CrossRef]
- Schwarz, D.; Kleinhans, S.; Reimann, G.; Stückler, P.; Reith, F.; Ilves, K.; Pedastsaar, K.; Yan, L.; Zhang, Z.; Valdivieso, M.; et al. Investigation of dairy cow performance in different udder health groups defined based on a combination of somatic cell count and differential somatic cell count. Prev. Vet. Med. 2020, 183, 105123. [Google Scholar] [CrossRef]
- López-Ratón, M.; Rodríguez-Álvarez, M.X.; Cadarso-Suárez, C.; Gude-Sampedro, F. OptimalCutpoints: An R package for selecting optimal cutpoints in diagnostic tests. J. Stat. Soft. 2014, 61, 1–36. [Google Scholar] [CrossRef]
- Bobbo, T.; Zidi, A.; Cassandro, M. Combining total and differential somatic cell count to screen for mastitis. Acta Fytotech. Zootech. 2020, 23, 88–96. [Google Scholar] [CrossRef]
- Tvarožková, K.; Vašíček, J.; Uhrinčať, M.; Mačuhová, L.; Hleba, L.; Tančin, V. The presence of pathogens in milk of ewes in relation to the somatic cell count and subpopulations of leukocytes. Czech J. Anim. Sci. 2021, 66, 315–322. [Google Scholar] [CrossRef]
- Contreras, A.; Sierra, D.; S’anchez, A.; Corrales, J.C.; Marcoc, J.C.; Paape, M.J.; Gonzalo, C. Mastitis in small ruminants. Small Rumin. Res. 2007, 68, 145–153. [Google Scholar] [CrossRef]
- Gonzalo, C.; Ariznabarreta, A.; Carriedo, J.; San Primitivo, F. Mammary pathogens and their relationship to somatic cell count and milk yield losses in dairy ewes. J. Dairy Sci. 2002, 85, 1460–1467. [Google Scholar] [CrossRef] [PubMed]
- Ruegg, P.L. Mastitis in small ruminants. In American Association of Bovine Practitioners Conference Proceedings; V.M. Publishing Company: Mooresville, NC, USA, 2011; pp. 111–119. [Google Scholar]
- Dal Prà, A.; Biscarini, F.; Cavani, G.L.; Bacchelli, S.; Iotti, A.; Borghi, S.; Nocetti, M.; Moroni, P. Relationship between total and differential quarter somatic cell counts at dry-off and early lactation. PLoS ONE 2022, 17, e0275755. [Google Scholar] [CrossRef] [PubMed]
- Cuccuru, C.; Moroni, P.; Zecconi, A.; Casu, S.; Caria, A.; Contini, A. Milk differential cell counts in relation to total counts in Sardinian ewes. Small Rumin. Res. 1997, 25, 169–173. [Google Scholar] [CrossRef]
- Kaskous, S.; Farschtschi, S.; Pfaffl, M.W. Physiological Aspects of Milk Somatic Cell Count in Small Ruminants—A Review. Dairy 2023, 4, 26–42. [Google Scholar] [CrossRef]
- Bobbo, T.; Penasa, M.; Cassandro, M. Combining total and differential somatic cell count to better assess the association of udder health status with milk yield, composition and coagulation properties in cattle. Ital. J. Anim. Sci. 2020, 19, 697–703. [Google Scholar] [CrossRef]

| SCC Class (×1000) | n | Min | 1st Qu. 1 | 3rd Qu. 2 | Max | DSCC (%) 3 | SE |
|---|---|---|---|---|---|---|---|
| 50 < SCC ≤ 250 | 2690 | 7.3 | 47.8 | 75.3 | 97.6 | 61.13 a | 0.34 |
| 250 < SCC ≤ 500 | 908 | 11.7 | 59.9 | 79.5 | 95.3 | 68.27 b | 0.51 |
| 500 < SCC ≤ 750 | 448 | 27.7 | 70.8 | 83.6 | 95.3 | 75.20 c | 0.59 |
| 750 < SCC ≤ 1000 | 272 | 19.70 | 77.2 | 85.6 | 93.0 | 80.14 d | 0.58 |
| 1000 < SCC ≤ 1500 | 400 | 46.60 | 80.2 | 87.4 | 95.60 | 83.01 e | 0.36 |
| SCC > 1500 | 1156 | 6.30 | 83.5 | 88.8 | 97.80 | 85.75 f | 0.17 |
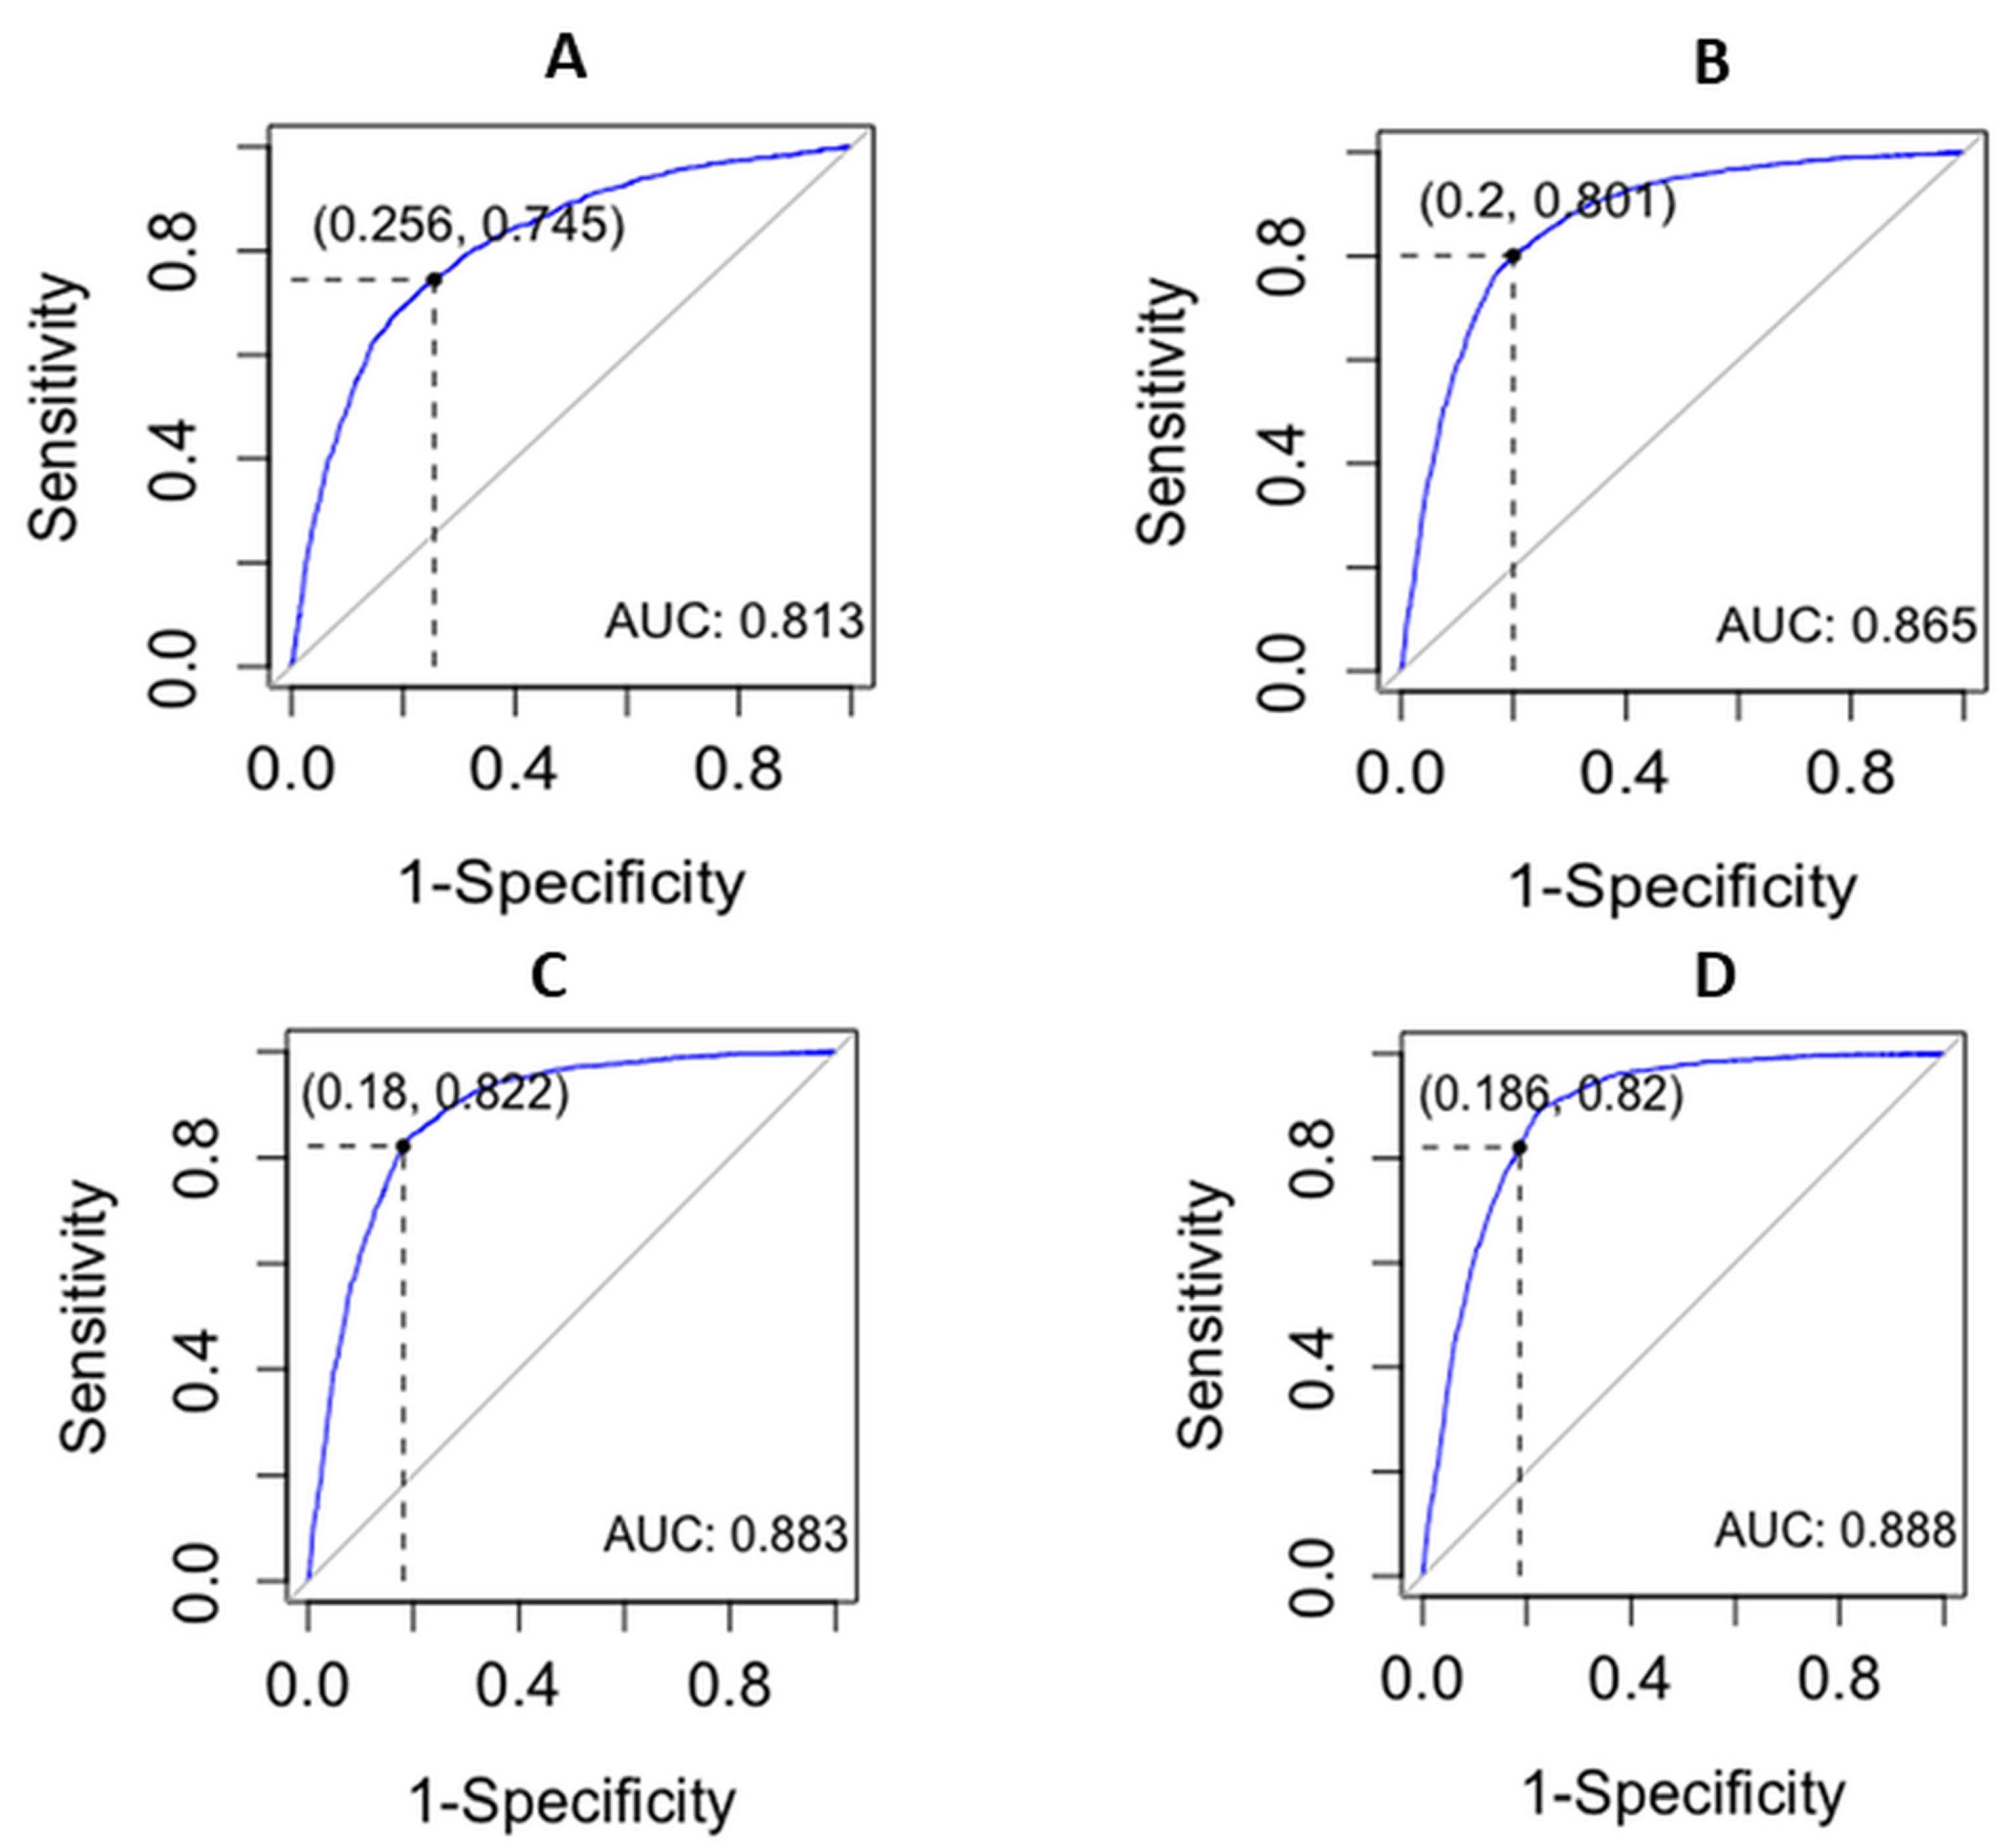
| SCC (Cells/mL) | 0 vs. 1 1 | Threshold % | Se | Sp | PPV | NPV | AUC |
|---|---|---|---|---|---|---|---|
| 265K | 2770–3104 | 76.1 | 0.72 (0.71–0.74) | 0.77 (0.75–0.79) | 0.77 (0.76–0.79) | 0.72 (0.70–0.74) | 0.81 (0.80–0.82) |
| 500K | 3598–2276 | 78.7 | 0.80 (0.78–0.82) | 0.80 (0.79–0.81) | 0.71 (0.69–0.73) | 0.87 (0.85–0.88) | 0.86 (0.85–0.87) |
| 645K | 3898–1976 | 79.8 | 0.84 (0.82–0.85) | 0.81 (0.80–0.82) | 0.69 (0.67–0.71) | 0.91 (0.90–0.91) | 0.88 (0.87–0.89) |
| 1M | 4318–1556 | 79.8 | 0.90 (0.88–0.91) | 0.77 (0.76–0.78) | 0.58 (0.57–0.62) | 0.95 (0.94–0.96) | 0.89 (0.88–0.90) |
Disclaimer/Publisher’s Note: The statements, opinions and data contained in all publications are solely those of the individual author(s) and contributor(s) and not of MDPI and/or the editor(s). MDPI and/or the editor(s) disclaim responsibility for any injury to people or property resulting from any ideas, methods, instructions or products referred to in the content. |
© 2023 by the authors. Licensee MDPI, Basel, Switzerland. This article is an open access article distributed under the terms and conditions of the Creative Commons Attribution (CC BY) license (https://creativecommons.org/licenses/by/4.0/).
Share and Cite
Tolone, M.; Mastrangelo, S.; Scatassa, M.L.; Sardina, M.T.; Riggio, S.; Moscarelli, A.; Sutera, A.M.; Portolano, B.; Negrini, R. A First Investigation into the Use of Differential Somatic Cell Count as a Predictor of Udder Health in Sheep. Animals 2023, 13, 3806. https://doi.org/10.3390/ani13243806
Tolone M, Mastrangelo S, Scatassa ML, Sardina MT, Riggio S, Moscarelli A, Sutera AM, Portolano B, Negrini R. A First Investigation into the Use of Differential Somatic Cell Count as a Predictor of Udder Health in Sheep. Animals. 2023; 13(24):3806. https://doi.org/10.3390/ani13243806
Chicago/Turabian StyleTolone, Marco, Salvatore Mastrangelo, Maria Luisa Scatassa, Maria Teresa Sardina, Silvia Riggio, Angelo Moscarelli, Anna Maria Sutera, Baldassare Portolano, and Riccardo Negrini. 2023. "A First Investigation into the Use of Differential Somatic Cell Count as a Predictor of Udder Health in Sheep" Animals 13, no. 24: 3806. https://doi.org/10.3390/ani13243806
APA StyleTolone, M., Mastrangelo, S., Scatassa, M. L., Sardina, M. T., Riggio, S., Moscarelli, A., Sutera, A. M., Portolano, B., & Negrini, R. (2023). A First Investigation into the Use of Differential Somatic Cell Count as a Predictor of Udder Health in Sheep. Animals, 13(24), 3806. https://doi.org/10.3390/ani13243806