
Summer Biomass Variability and Spatial Interactions between European Sprat (Sprattus sprattus) and Moon Jellyfish (Aurelia aurita) in the Western Part of the Black Sea


Abstract
:Simple Summary
Abstract
1. Introduction
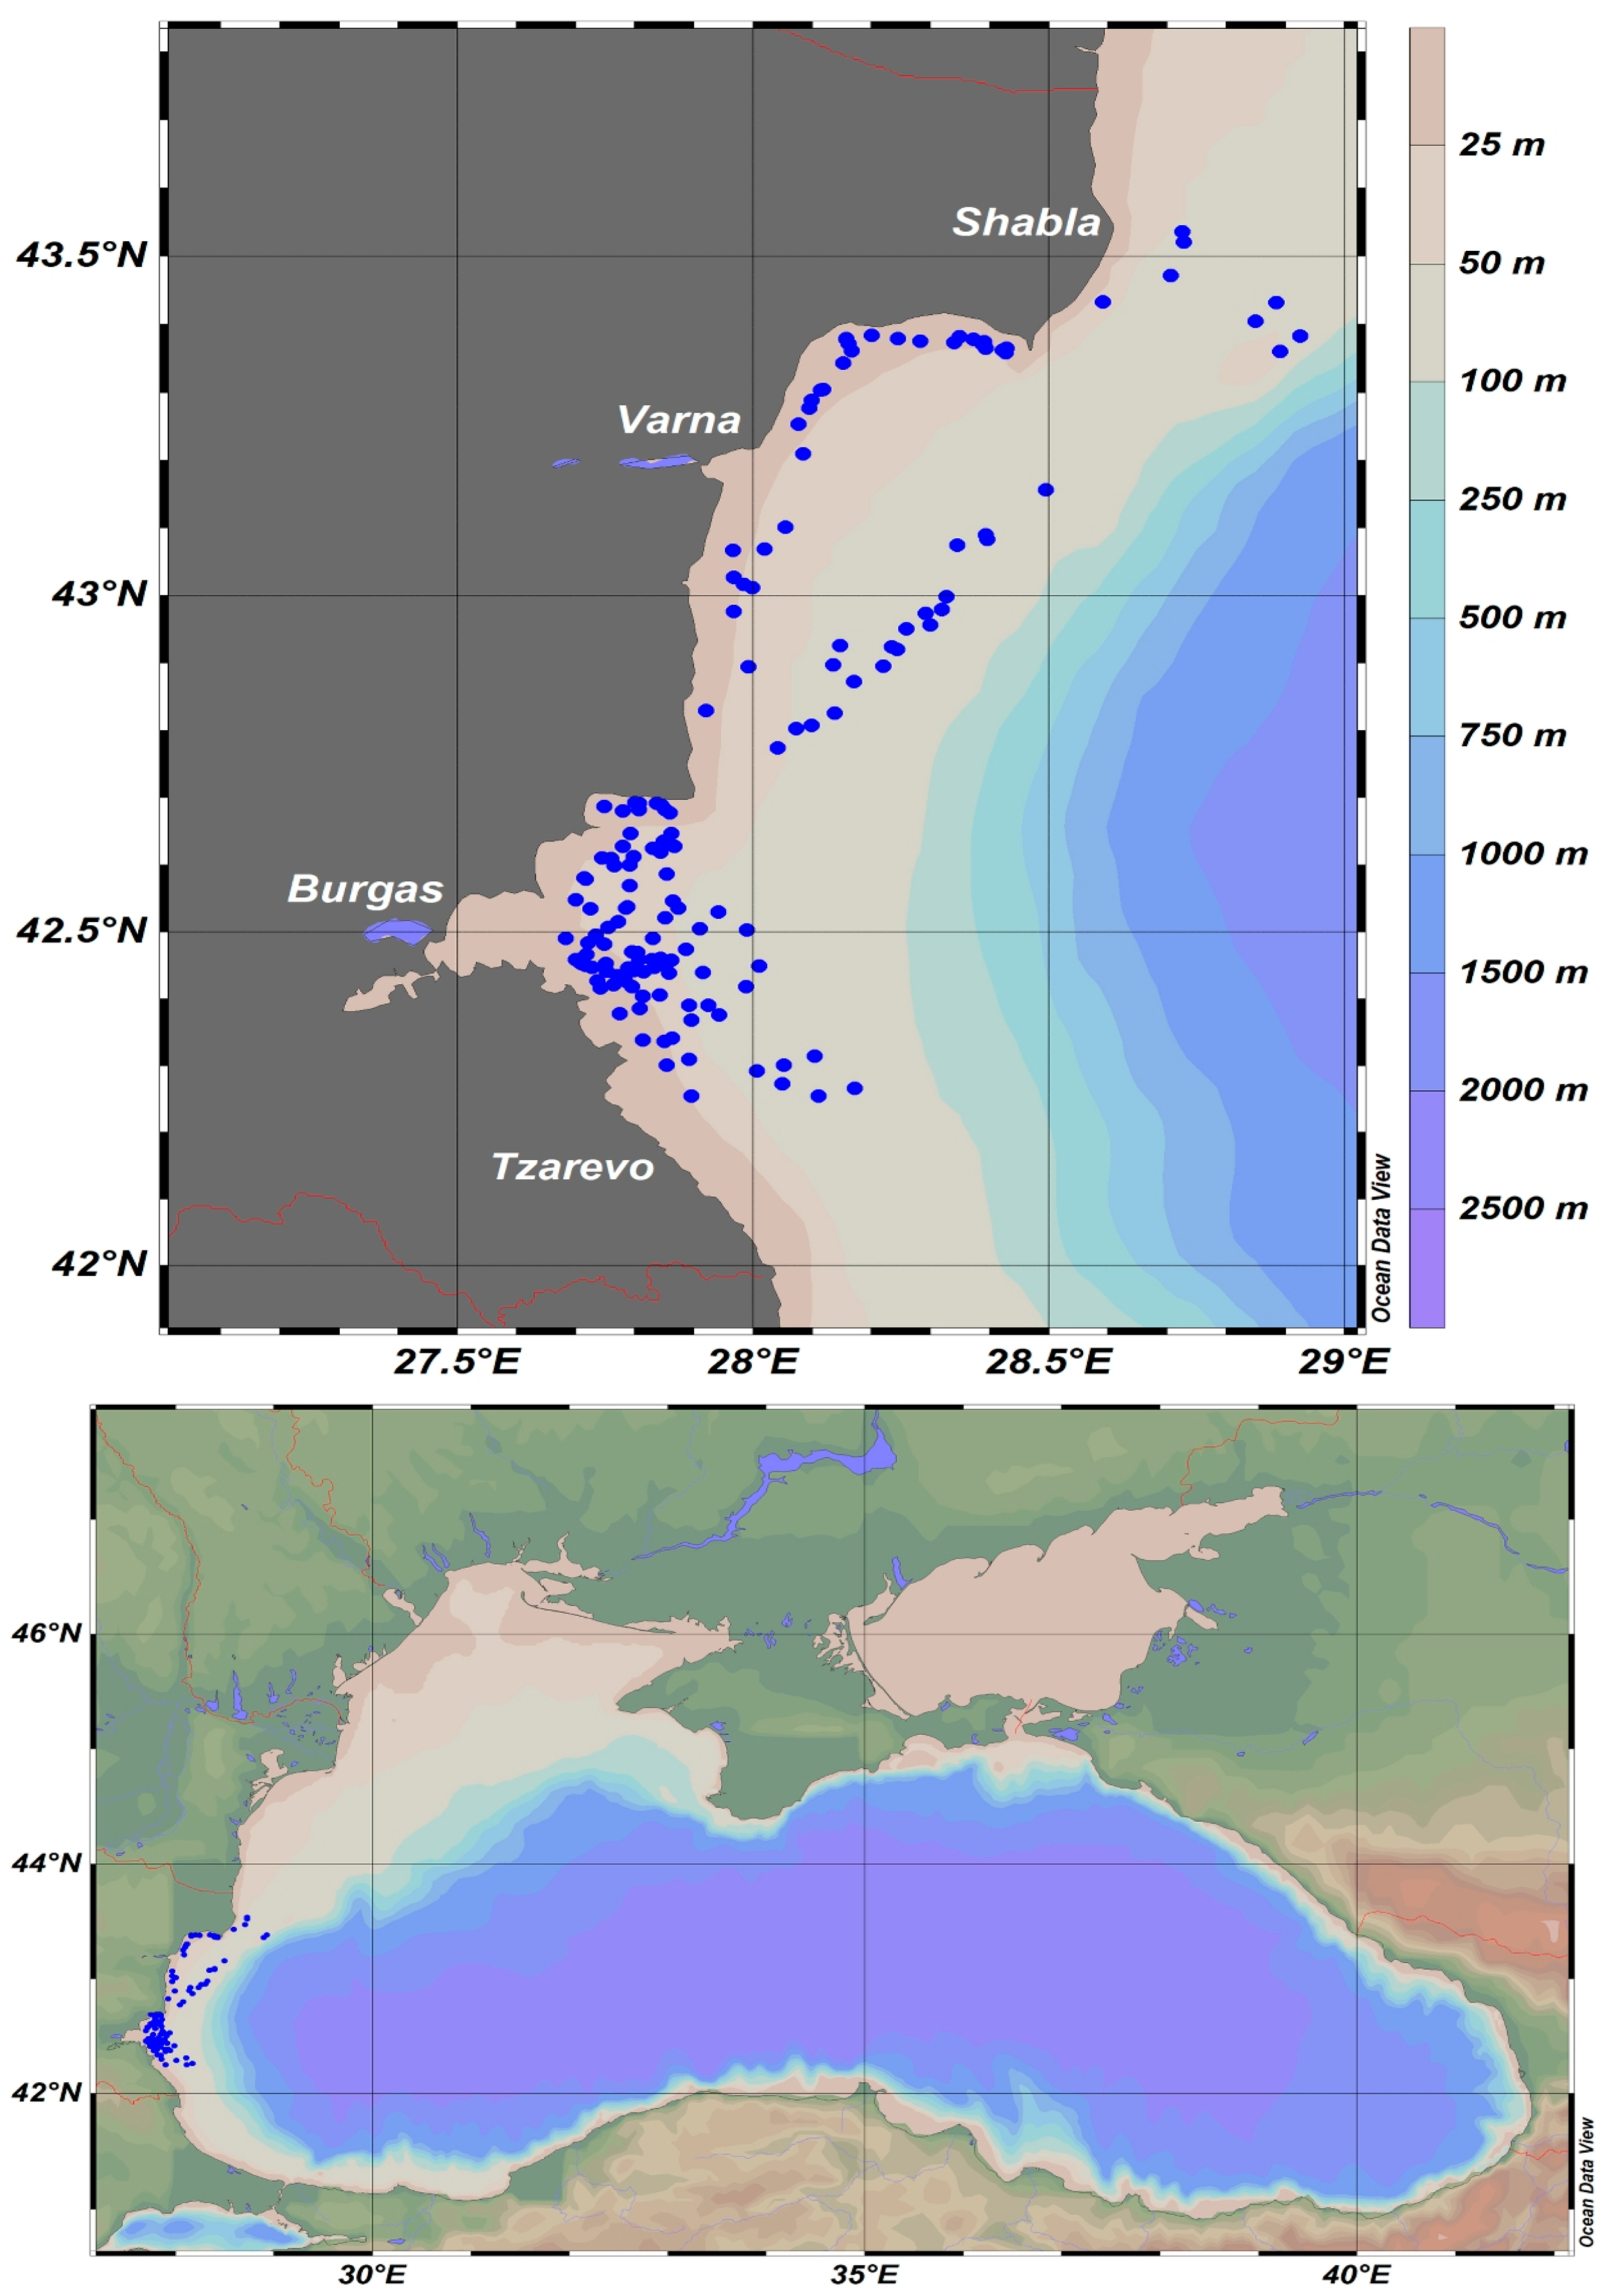
2. Materials and Methods
3. Results
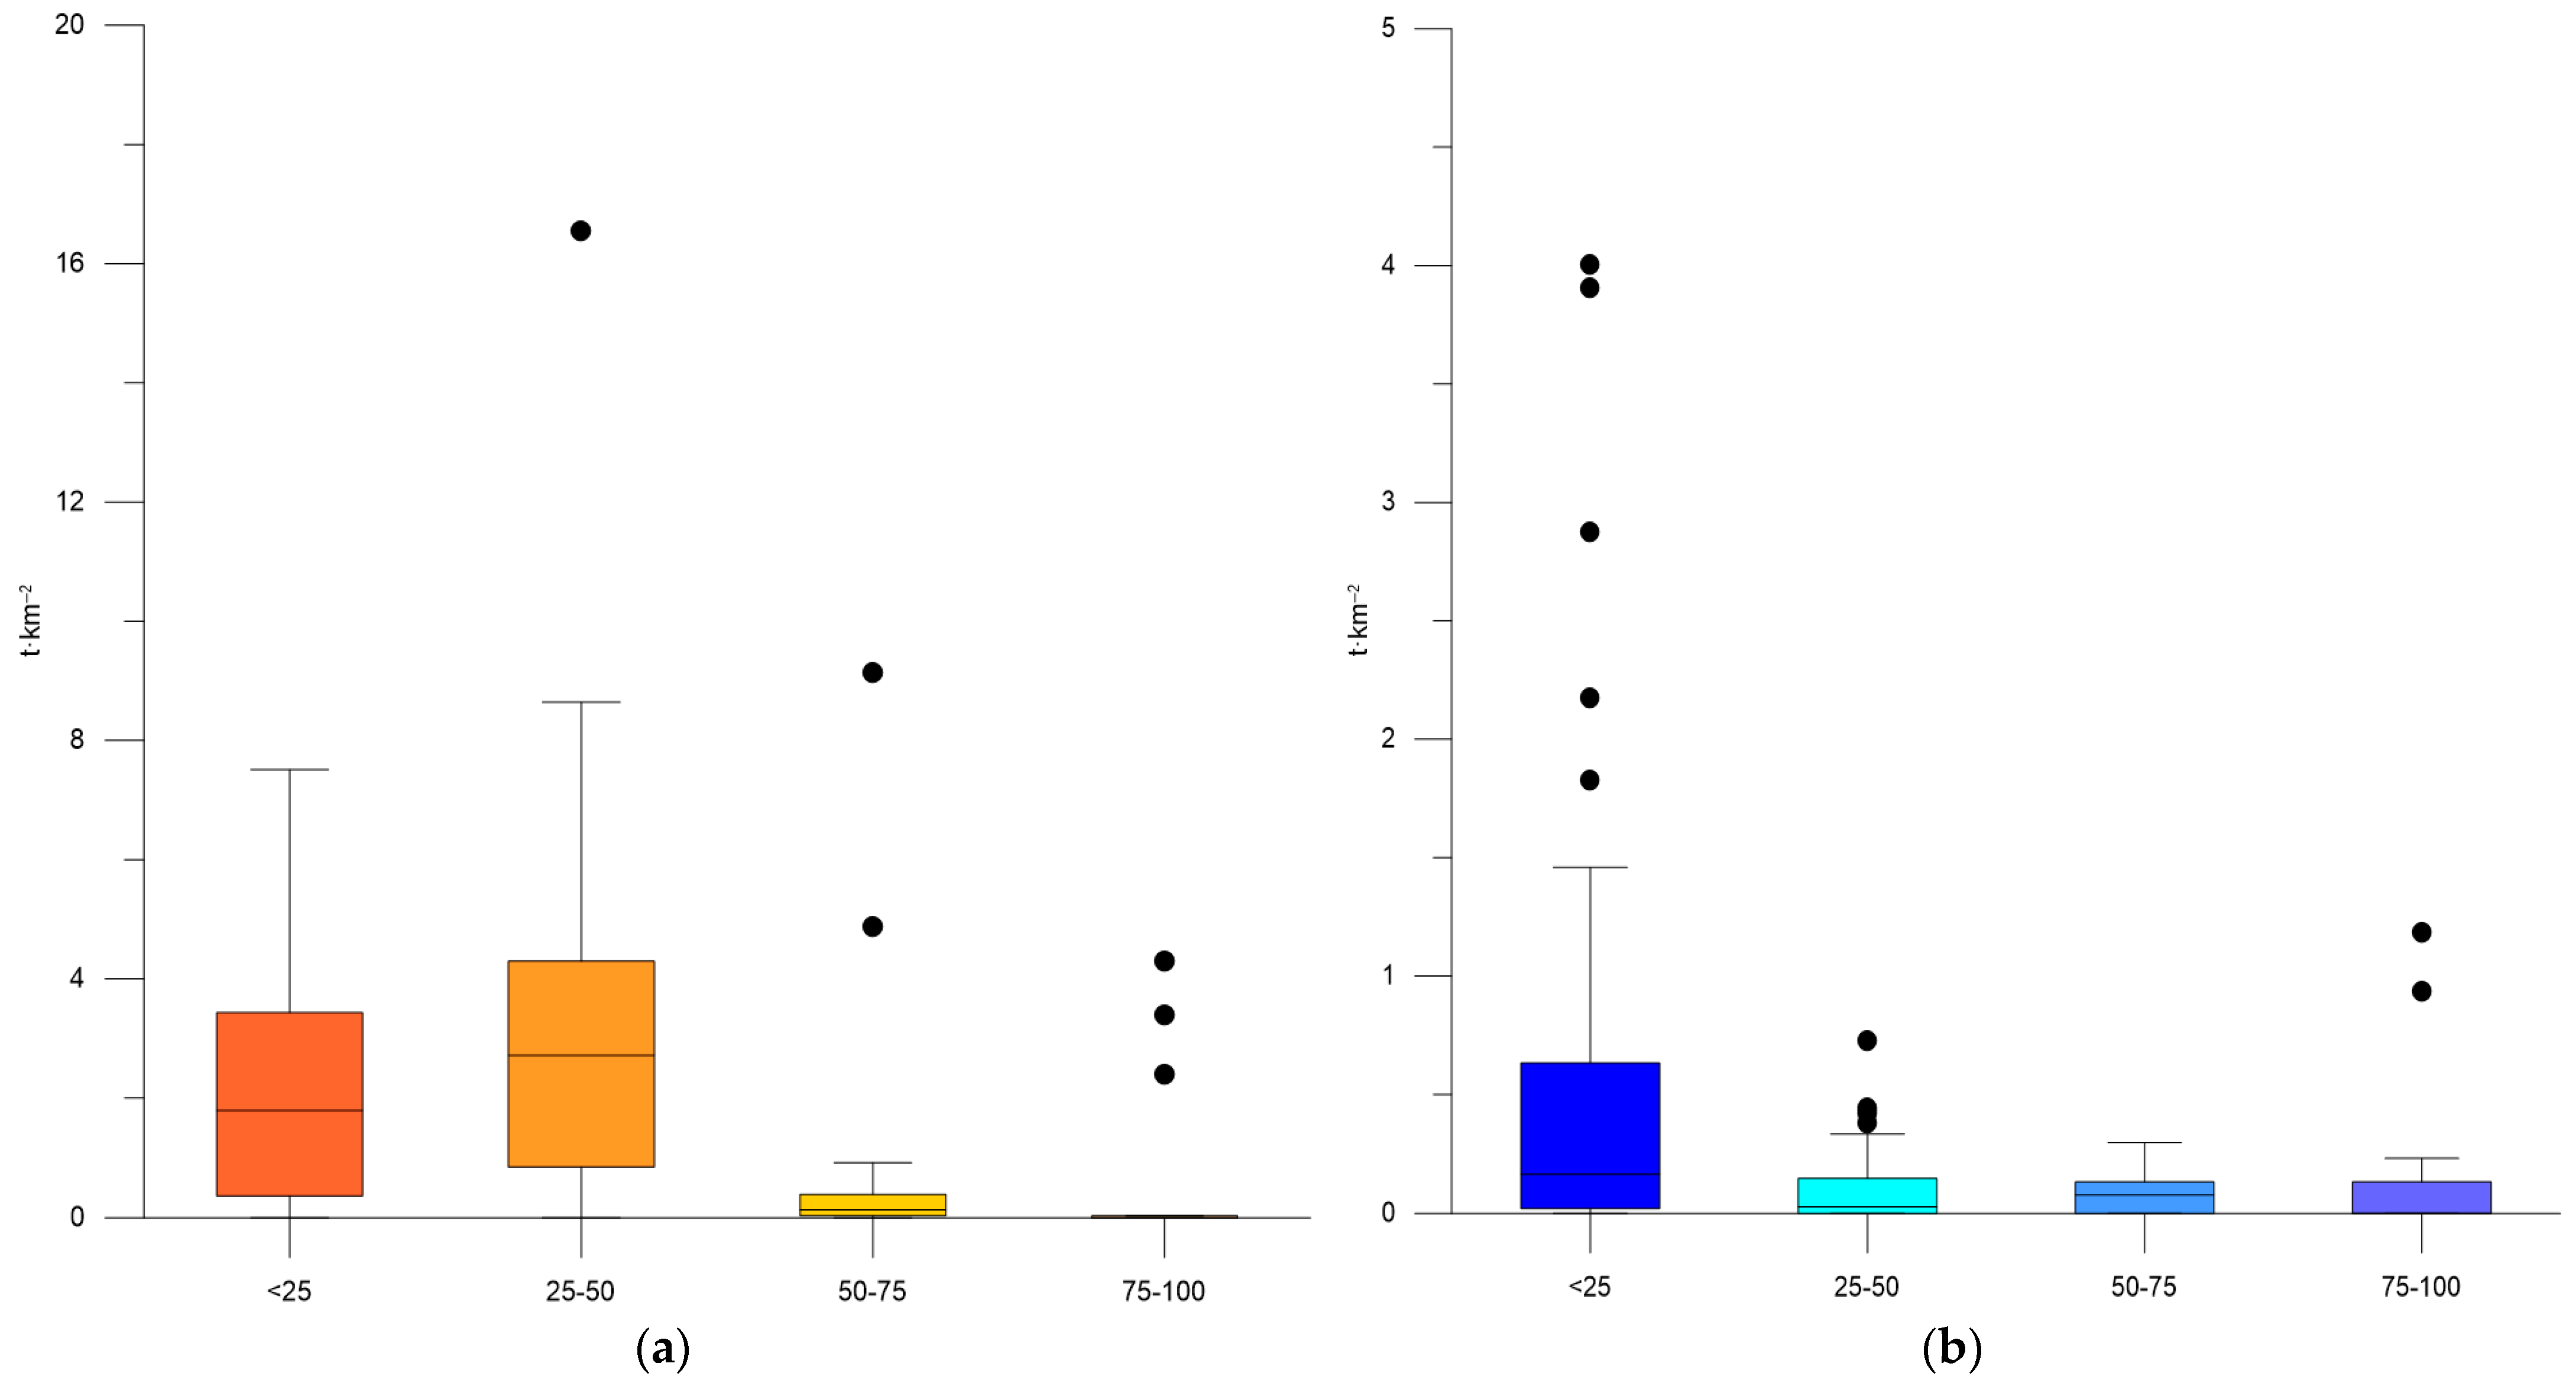
3.1. Variability of Biomass of Sprat and Moon Jellyfish
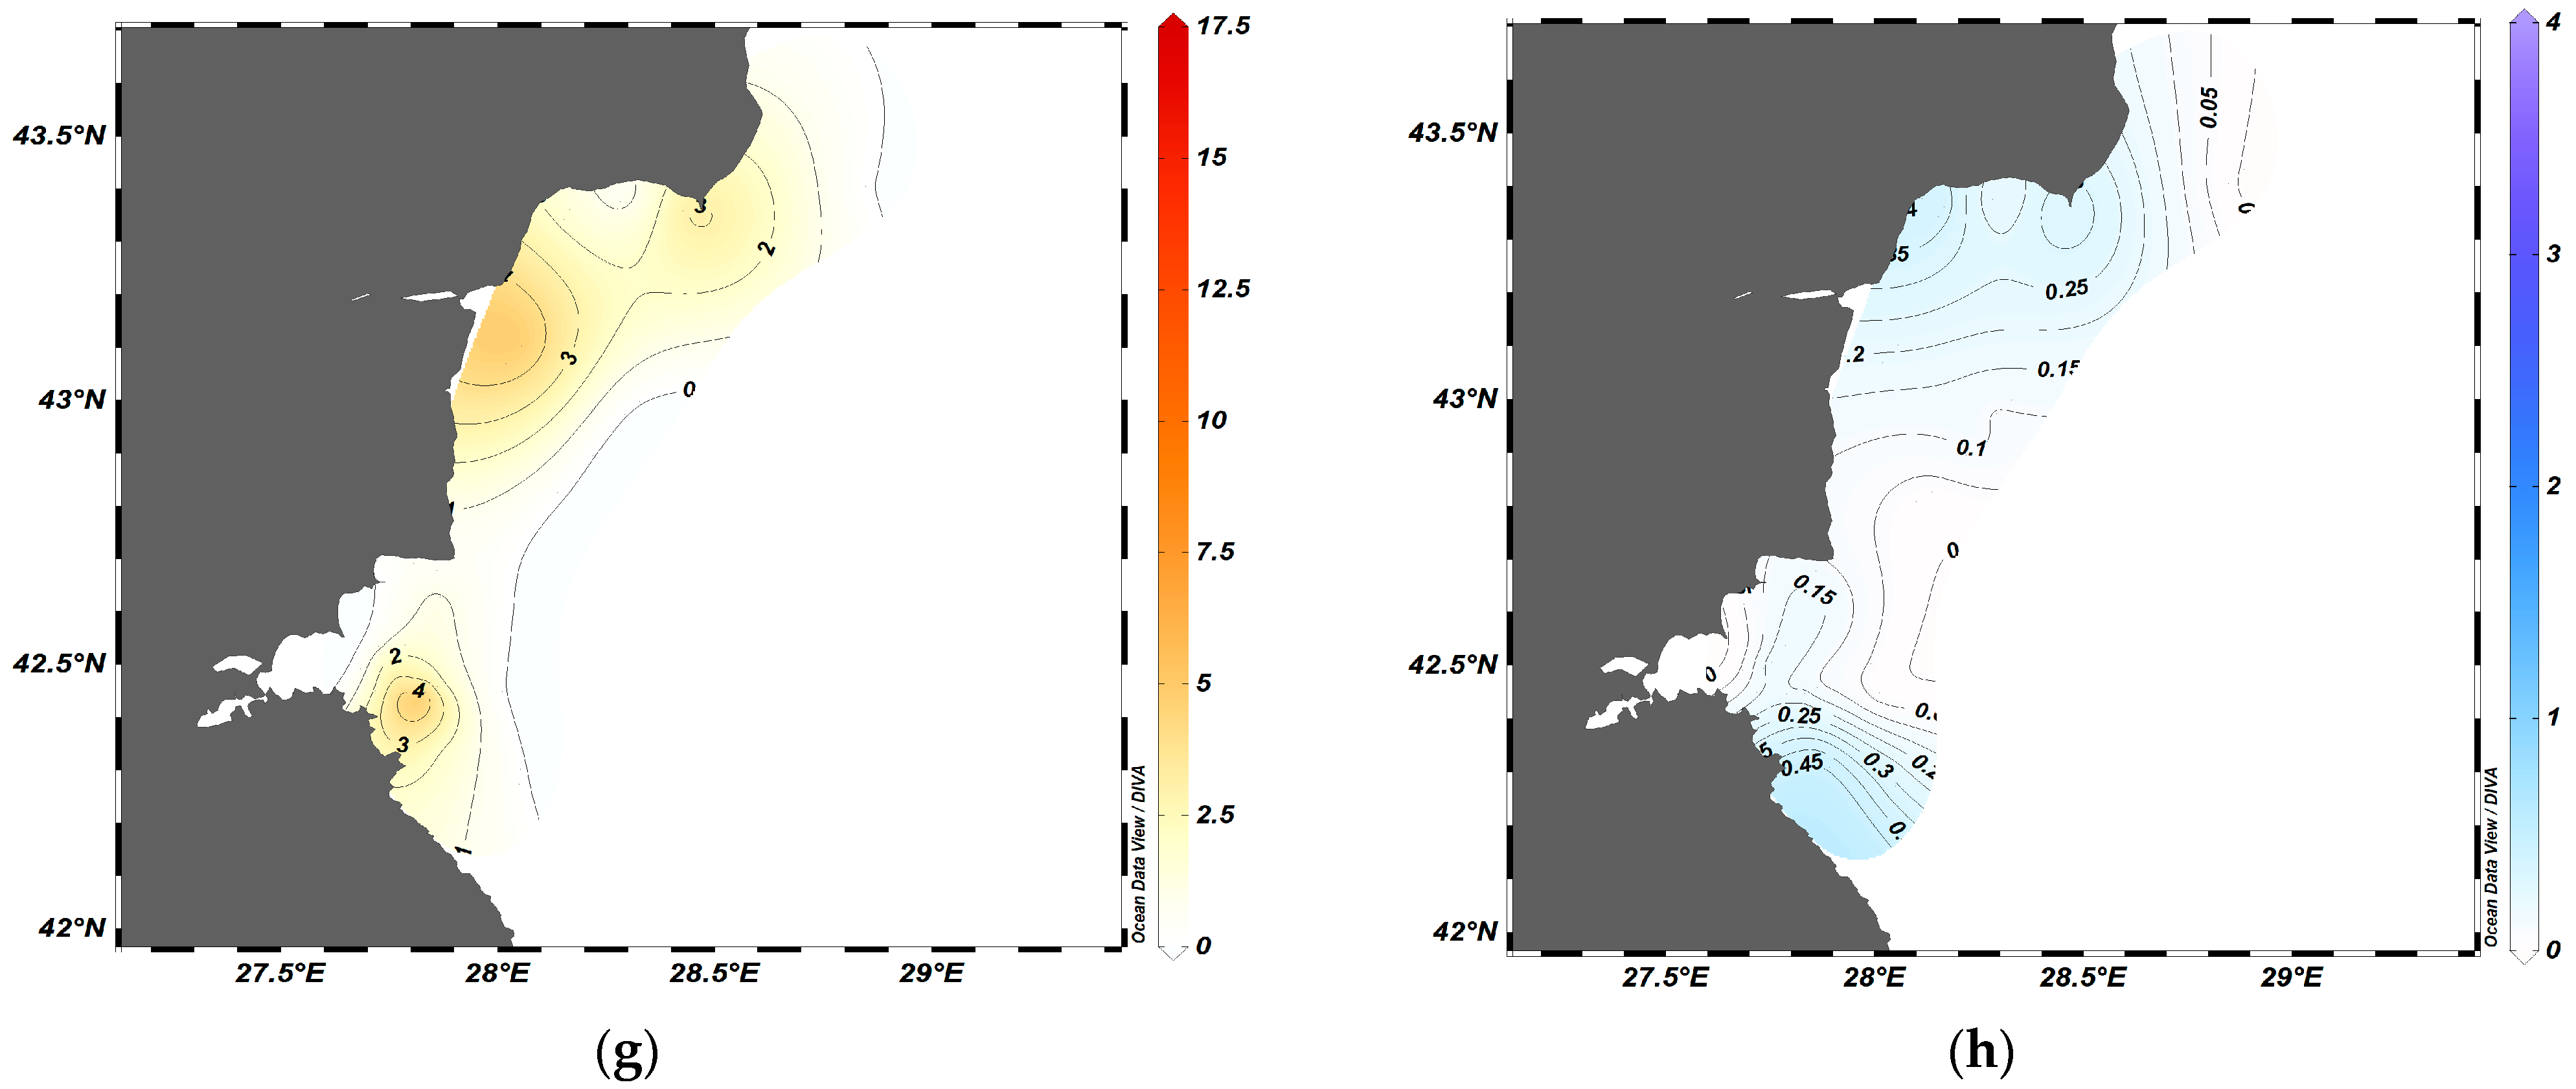
3.2. Spatial Dynamics of S. sprattus and A. aurita
3.3. Correlation Analysis
4. Discussion
5. Conclusions
Author Contributions
Funding
Institutional Review Board Statement
Informed Consent Statement
Data Availability Statement
Acknowledgments
Conflicts of Interest
References
- Robinson, K.L.; Ruzicka, J.J.; Decker, M.B.; Brodeur, R.D.; Hernandez, F.J.; Quiñones, J.; Acha, E.M.; Uye, S.-I.; Mianzan, H.; Graham, W.M. Jellyfish, forage fish, and the world’s major fisheries. Oceanography 2014, 27, 104–115. [Google Scholar] [CrossRef]
- Purcell, J.E.; Arai, M.N. Interactions of pelagic cnidarians and ctenophores with fish: A review. Hydrobiologia 2001, 451, 27–44. [Google Scholar] [CrossRef]
- Brodeur, R.D.; Suchman, C.L.; Reese, D.C.; Miller, T.W.; Daly, E.A. Spatial overlap and trophic interactions between pelagic fish and large jellyfish in the northern California Current. Mar. Biol. 2008, 154, 649–659. [Google Scholar] [CrossRef]
- D’Ambra, I.; Graham, W.M.; Carmichael, R.H.; Hernandez, F.J. Fish rely on scyphozoan hosts as a primary food source: Evidence from stable isotope analysis. Mar. Biol. 2015, 162, 247–252. [Google Scholar] [CrossRef]
- Tilves, U.; Sabatés, A.; Blázquez, M.; Raya, V.; Fuentes, V. Associations between fish and jellyfish in the NW Mediterranean. Mar. Biol. 2018, 165, 127. [Google Scholar] [CrossRef]
- Parsons, T.R.; Lalli, C.M. Jellyfish population explosions: Revisiting a hypothesis of possible causes. La Mer 2002, 40, 111–121. [Google Scholar]
- Lynam, C.P.; Gibbons, M.J.; Axelsen, B.E.; Sparks, C.A.J.; Coetzee, J.; Heywood, B.G.; Brierley, A.S. Jellyfish overtake fish in a heavily fished ecosystem. Curr. Biol. 2006, 16, 492–493. [Google Scholar] [CrossRef]
- Richardson, A.J.; Bakun, A.; Hays, G.C.; Gibbons, M.J. The jellyfish joyride: Causes, consequences, and management responses to a more gelatinous future. Trends Ecol. Evol. 2009, 24, 312–322. [Google Scholar] [CrossRef]
- Robinson, K.L.; Graham, W.M. Long-term change in the abundances of northern Gulf of Mexico scyphomedusae Chrysaora sp. and Aurelia spp. with links to climate variability. Limnol. Oceanogr. 2013, 58, 235–253. [Google Scholar] [CrossRef]
- Purcell, J. A review of cnidarian and ctenophores feeding on competitors in the plankton. Hydrobiologia 1991, 216/217, 335–342. [Google Scholar] [CrossRef]
- Boero, F. Review of Jellyfish Blooms in the Mediterranean and Black Sea; Studies and Reviews No. 92; General Fisheries Commission for the Mediterranean: Rome, Italy; FAO: Rome, Italy, 2013; 53p, ISBN 978-92-5-107457-2. [Google Scholar]
- Shiganova, T.; Alekseenko, E.; Moskalenko, L.; Nival, P. Modeling assessment of interactions in the black sea of the invasive ctenophores Mnemiopsis leidyi and Beroe ovata. Ecol. Model. 2018, 376, 1–14. [Google Scholar] [CrossRef]
- Tang, C.; Sun, S.; Zhang, F. Intraguild predation by polyps of three scyphozoan jellyfish: Nemopilema nomurai, Aurelia coerulea, and Rhopilema esculentum. J. Ocean. Limnol. 2020, 38, 1755–1761. [Google Scholar] [CrossRef]
- TDA (2009) Transboundary Diagnostic Analysis (1996–2006); Publications of the Commission on the Protection of the Black Sea against Pollution BSC: Istanbul, Turkey, 2007; p. 269.
- Shiganova, T.A.; Ozturk, B. Trend on increasing Mediterranean species arrival into the Black Sea. In CIESM Workshop Monographs, No 39; Climate Forcing and Its Impact on the Black Sea Biota; Briand, F., Ed.; CIESM: Monte Carlo, Monaco, 2010; pp. 75–93. [Google Scholar]
- Llope, M.; Daskalov, G.M.; Rouyer, T.A.; Mihneva, V.; Chan, K.; Grishin, A.N.; Stenseth, N.C. Overfishing of top predators eroded the resilience of the Black Sea system, regardless of the climate and anthropogenic conditions. Glob. Change Biol. 2011, 17, 1251–1265. [Google Scholar] [CrossRef]
- Oguz, T. Controls of multiple stressors on black sea fishery. Mar. Sci. 2017, 4, 110. [Google Scholar] [CrossRef]
- Shlyakhov, V.; Daskalov, G. Marine living resources. In State of the Environment of the Black Sea (2001–2006/7); Oguz, T., Ed.; Publications of the Commission on the Protection of the Black Sea against Pollution (BSC): Istanbul, Turkey, 2008; Volume 3, 448p. [Google Scholar]
- FAO. The State of Mediterranean and Black Sea Fisheries; General Fisheries Commission for the Mediterranean region Rome: Rome, Italy, 2022. [Google Scholar] [CrossRef]
- Pereladov, M.V. Some observations of changes in the biocenoses of the Sudak Bay of the Black Sea. Tez. III. In Proceedings of the All-Union Conference in Marine Biology; CHI: Sevastopol, Russia, 1988; pp. 237–238. (In Russian) [Google Scholar]
- Konsulov, A.; Kamburska, L. Ecological determination of the new ctenophore—Beroe ovata invasion in the Black Sea. Okeanologia 1998, 2, 195–198. [Google Scholar]
- Daskalov, G.M.; Grishin, A.; Rodionov, S.; Mihneva, V. Trophic cascades triggered by overfishing reveal possible mechanisms of ecosystem regime shifts. Proc. Natl. Acad. Sci. USA 2007, 104, 10518–10523. [Google Scholar] [CrossRef]
- Oguz, T.; Akoglu, E.; Salihoglu, B. Current state of overfishing and its regional differences in the Black Sea. Ocean Coast. Manag. 2012, 58, 47–56. [Google Scholar] [CrossRef]
- Daskalov, G.; Boicenko, L.; Grishin, A.; Lazar, L.; Mihneva, V.; Shlyahov, V.; Zengin, M. Architecture of collapse: Regime shift and recovery in a hierarchically structured marine ecosystem. Glob. Change Biol. 2016, 23, 1486–1498. [Google Scholar] [CrossRef]
- Opdal, A.F.; Brodeur, R.D.; Cieciel, K.; Daskalov, G.M.; Mihneva, V.; Ruzicka, J.J.; Verheye, H.M.; Aksnes, D.L. Unclear associations between small pelagic fish and jellyfish in several major marine ecosystems. Sci. Rep. 2019, 9, 2997. [Google Scholar] [CrossRef]
- Gomou, M.; Kuprianov, A. Estimation of the abundance and distribution of the medusae Aurelia aurita in the eastern part of the Black Sea. In Pelagic Ecosystem of the Black Sea; Nauka: Moscow, Russia, 1980; pp. 191–198. [Google Scholar]
- Zaicev, Y.P.; Polistuk, L.N. An outbreak of the jellyfish A. aurita in the Black Sea. Sea Ecol. 1984, 17, 35–40. (In Russian) [Google Scholar]
- Vinogradov, M.Y.; Shushkina, E.A.; Musayeva, E.I.; Sorokin, P.Y. A newly acclimatized species in the Black Sea: The ctenophore Mnemiopsis (Ctenophora: Lobata). Oceanology 1989, 29, 220–224. (In Russian) [Google Scholar]
- Vinogradov, M.; Shushkina, E. The temporal changes in the structure of the zoocenosis in open sea regions of the Black Sea. Oceanology 1992, 32, 709–717. [Google Scholar]
- Shiganova, T. Mnemiopsis leidyi abundance in the Black Sea and its impact on the pelagic community. In Sensitivity to Change: Black Sea, Baltic Sea, and North Sea; Özsoy, E., Mikaelyan, A., Eds.; Springer: Dordrecht, The Netherlands, 1997; pp. 117–129. [Google Scholar]
- Shiganova, T. Invasion of the Black Sea by ctenophore Mnemiopsis leidyi and recent changes in pelagic community structure. Fish. Ocean. 1998, 7, 305–310. [Google Scholar] [CrossRef]
- Niermann, U. Mnemiopsis leidyi: Distribution and Effect on the Black Sea Ecosystem during the First Years of Invasion in Comparison with Other Gelatinous Blooms. In Aquatic Invasions in the Black, Caspian and Mediterranean Seas; Dumont, H., Shiganova, T., Niermann, U., Eds.; Springer: Dordrecht, The Netherlands, 2004; pp. 3–31. [Google Scholar] [CrossRef]
- Bilio, M.; Niermann, U. Is the comb jelly really to blame for it all? Mnemiopsis leidyi and the ecological concerns about the Caspian Sea. Mar. Ecol. Prog. Ser. 2004, 269, 173–183. [Google Scholar] [CrossRef]
- Mutlu, E.; Bingel, F.; Gucu, A.; Melnikov, V.; Niermann, U.; Ostr, N.; Zaika, V. Distribution of the new invader Mnemiopsis sp. and the resident A. aurita and Pleurobrachia pileus populations in the Black Sea during 1991–1993. ICES J. Mar. Sci. 1994, 51, 407–421. [Google Scholar] [CrossRef]
- Kovalev, V.; Piontkovski, S. Interannual changes in the biomass of the Black Sea gelatinous zooplankton. J. Plankton Res. 1998, 20, 1377–1385. [Google Scholar] [CrossRef]
- Kamburska, L.; Schrimpf, W.; Djavidni, S.; Shiganova, T.; Stefanova, K. Addressing the Ecological Issue of the Invasive Species Special Focus on the Ctenophore Mnemiopsis Leidy (Agassiz, 1865) in the Black Sea; DG Joint Research Centre, Institute for Environment and Sustainability; Office for Official Publications of the European Communities: Luxembourg, 2006; 59p, ISSN 1018–55932006. [Google Scholar]
- Vereshchaka, A.L.; Anokhina, L.L.; Lukasheva, T.A.; Lunina, A.A. Long-term studies reveal major environmental factors driving zooplankton dynamics and periodicities in the Black Sea coastal zooplankton. PeerJ 2019, 7, e7588. [Google Scholar] [CrossRef]
- Vereshchaka, A.L.; Shatravin, A.V.; Lunina, A.A. Shifting seasonal timing of peak abundance of two invading ctenophore populations in the Black Sea during the period 1991–2017. ICES J. Mar. Sci. 2022, 79, 954–962. [Google Scholar] [CrossRef]
- GFCM: Report of the Seventh Meeting of the Subregional Group on Stock Assessment in the Black Sea (SGSABS), 12–16 July 2021. Available online: https://www.fao.org/gfcm/technical-meetings/detail/en/c/1442355/ (accessed on 20 November 2023).
- Anninsky, B.E.; Finenko, G.A.; Datsyk, N.A. The trophodynamic role of gelatinous predators in planktonic communities of the coastal regions of the Black Sea. In Morskie biologicheskie issledovaniya: Dostizheniya i perspektivy: V 3–kh t.:sb. materialov Vseros. nauch. –prakt. konf. s mezhdunar. uchastiem, priuroch. k 145–letiyu Sevastopol’skoi biologicheskoi stantsii (Sevastopol, September 19–24, 2016/A.V.); Gaevskaya, A.V., Ed.; EKOSI-Gidrofizika: Sevastopol, Russia, 2016; Volume 2, pp. 221–224. (In Russian) [Google Scholar]
- Anninsky, B.E.; Ignatyev, S.M.; Finenko, G.A.; Datsyk, N.A. Gelatinous macroplankton of the open pelagial and shelf of the Black Sea: Distribution in autumn 2016 and interannual changes in biomass and abundance. Mar. Biol. J. 2019, 4, 3–14. [Google Scholar] [CrossRef]
- Harcota, G.; Bisinicu, E.; Tabarcea, C.; Țotiou, A.; Filimon, A.; Abaza, V.; Boicenco, L.; Timofte, F. Distribution, and abundance of the macrozooplankton community in the Black Sea in 2021. Acad. Rom. Sci. Ann. Ser. Biol. Sci. 2022, 11, 57–67. [Google Scholar] [CrossRef]
- Finenko, G.A.; Datsyk, N.A.; Anninsky, B.E.; Zagorodnyaya, Y.A. Trophic relationships in the zooplankton–gelatinous zooplankton food chain in the shelf areas of the Crimean coast of the Black Sea. Mar. Biol. J. 2022, 7, 93–106. [Google Scholar] [CrossRef]
- Mutlu, E. Distribution and abundance of moon jellyfish (Aurelia aurita) and its zooplankton food in the Black Sea. Mar. Biol. 2001, 138, 329–339. [Google Scholar] [CrossRef]
- Bat, L.; Satilimus, H.; Birinci-Ozdemir, Z.; Sahin, F.; Ustin, F. Distribution and population dynamics of Aurelia aurita (Cnidaria; Scyphozoa) in the southern Black Sea. Northwestern J. Zool. 2009, 5, 225–241. [Google Scholar]
- Ivanov, L.; Beverton, R.J.H. The fisheries resources of the Mediterranean. Part II: Black Sea. FAO Stud. Rev. 1985, 60, 135. [Google Scholar]
- Lipskaia, N. Daily and seasonal feeding of Black Sea sprat (Sprattus sprattus phalericus Risso). Proc. Sevastopol Boil. Stn. RAN 1960, 8, 190–203. (In Russian) [Google Scholar]
- Glushtenko, T.I. Feeding and estimation of the Black Sea sprat in 2009–2010. In The Main Results of Complex Research in the Azov–Black Sea Basin and the World Ocean; Petrenko, O.A., Ed.; YugNIRO: Kerch, Ukraine, 2011; 237p. [Google Scholar]
- Mihneva, V.; Raykov, V.; Grishin, A.; Stefanova, K. Sprat feeding in front of the Bulgarian Black Sea coast. In Proceedings of the 12th International Conference on the Mediterranean Coastal Environment, MEDCOAST 2015, Varna, Bulgaria, 6–10 October 2015; Volume 1, pp. 431–442. [Google Scholar]
- Bișinicu, E.; Harcotă, G.E.; Țoțoiu, A.; Timofte, F.; Radu, G. Romanian Black Sea Zooplankton and Its Role in the Diet of Sprattus in 2016–2017. Rev. Cercet. Mar. Rev. Rech. Mar. Mar. Res. J. 2017, 47, 185–193. [Google Scholar]
- Finenko, G.A.; Anninsky, B.E.; Datzyk, N.A. Spatial Distribution, Population Structure, and Predatory Impact of Gelatinous Predators on Zooplankton Community in Inshore Waters off Crimean Coast of the Black Sea. J. Sib. Fed. Univ. Biol. 2021, 14, 168–181. [Google Scholar] [CrossRef]
- Totoiu, A.; Galatchi, M.; Radu, G. Dynamics of the Romanian sprat (Sprattus sprattus, Linnaeus 1758) fishery between evolution of the fishing effort and the state of the environmental conditions. Turk. J. Fish. Aquat. Sci. 2016, 16, 371–384. [Google Scholar] [CrossRef]
- Țoțoiu, A.; Galațchi, M.; Danilov, S.; Radu, G. Evolution of the Sprat (Sprattus sprattus, Linnaeus 1758) Population at the Romanian Littoral during 2008–2016. Cercet. Mar. 2017, 47, 205–221. [Google Scholar]
- Raykov, V.; Yankova, M.; Ivanova, P.; Mihneva, V.; Dimitrov, D.; Stefanova, K.; Stefanova, E.; Kotsev, I.; Dzembekova, N.; Zlateva, I. Pelagic Trawl Surveys in the Bulgarian Marine Area 2017–2019; Prof. Marin Drinov Publishing House of BAS: Sofia, Bulgaria, 2020; 278p, ISBN 978-619-245-070-0. [Google Scholar] [CrossRef]
- Sparre, P.; Venema, S.C. Introduction to Fish Stock Assessment. Part 1: Manual; FAO Fisheries Technical Paper; FAO: Rome, Italy, 1998; p. 306. [Google Scholar]
- Behrends, G.; Schneider, G. Impact of A. aurita medusae (Cnidaria, Scyphozoa) on the standing stock and community composition of mesozooplankton in Kiel Bight (western Baltic Sea). Mar. Ecol. Prog. Ser. 1995, 127, 39–45. [Google Scholar] [CrossRef]
- Schneider, B.; Behrends, G. Top–down control of a nertitic plankton system by A. aurita medusae: A summary. Ophelia 1998, 48, 71–82. [Google Scholar] [CrossRef]
- Daskalov, G.M. Overfishing drives a trophic cascade in the Black Sea. Mar. Ecol. Prog. Ser. 2002, 225, 53–63. [Google Scholar] [CrossRef]
- Møller, L.F.; Riisgård, H.U. Impact of jellyfish and mussels on algal blooms caused by seasonal oxygen depletion and nutrient release from the sediment in a Danish fjord. J. Exp. Mar. Biol. Ecol. 2007, 351, 92–105. [Google Scholar] [CrossRef]
- Malej, A.; Turk, V.; Lucic, D.; Benovic, A. Direct and indirect trophic interactions of Aurelia sp. (Scyphozoa) in a stratified marine environment (Mljet Lakes, Adriatic Sea). Mar. Biol. 2007, 151, 827–841. [Google Scholar] [CrossRef]
- Pitt, K.; Kingsford, M.; Rissik, D.; Koop, K. Jellyfish modified the responses of planktonic assemblages to nutrient pulses. Mar. Ecol. Prog. Ser. 2007, 351, 1–13. [Google Scholar] [CrossRef]
- Hosia, A.; Augustin, C.; Dinasquet, J.; Granhag, L.; Paulsen, M.; Riemann, L.; Rintala, J.; Setälä, O.; Talvitie, J.; Titelman, J. Autumnal bottom-up and top-down impacts of Cyanea capillata: A mesocosm study. J. Plankton Res. 2015, 37, 1042–1055. [Google Scholar] [CrossRef]
- Jaspers, C.; Acuña, J.; Brodeur, R. Interactions of gelatinous zooplankton within marine food webs. J. Plankton Res. 2015, 37, 985–988. [Google Scholar] [CrossRef]
- Baxter, E.J.; Sturt, M.M.; Ruane, N.M.; Doyle, T.K.; McAllen, R.; Harman, L.; Rodger, H.D. Gill damage to Atlantic salmon (Salmon salar) caused by the common jellyfish (Aurelia aurita) under experimental challenge. PLoS ONE 2011, 6, e18529. [Google Scholar] [CrossRef]
- Bosch-Belmar, M.; Milisenda, G.; Basso, L.; Doyle, T.K.; Leone, A.; Stefano Piraino, S. Jellyfish Impacts on Marine Aquaculture and Fisheries. Rev. Fish. Sci. Aquac. 2021, 29, 242–259. [Google Scholar] [CrossRef]
- Shiganova, T.A.; Bulgakova, Y.V. Effects of gelatinous plankton on Black Sea and Sea of Azov fish and their food resources. ICES J. Mar. Sci. 2000, 57, 641–648. [Google Scholar] [CrossRef]
- Oguz, T.; Salihoglu, B.; Fach, B. A coupled plankton–anchovy population dynamics model assessing nonlinear controls of anchovy and gelatinous biomass in the Black Sea. Mar. Ecol. Prog. Ser. 2008, 369, 229–256. [Google Scholar] [CrossRef]
- Haraldsson, M.; Tönnesson, K.; Tiselius, P.; Thingstad, T.F.; Aksnes, D.L. Relationship between fish and jellyfish as a function of eutrophication and water clarity. Mar. Ecol. Prog. Ser. 2012, 471, 73–85. [Google Scholar] [CrossRef]
- Flynn, B.A.; Richardson, A.J.; Brierley, A.S.; Boyer, D.C.; Axelsen, B.E.; Scott, L.; Moroff, N.E.; Kainge, P.I.; Tjizoo, B.M.; Gibbons, M.J. Temporal and spatial patterns in the abundance of jellyfish in the northern Benguela upwelling ecosystem and their link to thwarted pelagic fishery recovery. Afr. J. Mar. Sci. 2012, 34, 131–146. [Google Scholar] [CrossRef]
- Decker, M.B.; Robinson, K.L.; Dorj, S.; Cieciel, K.D.; Barceló, C.; Ruzicka, J.J.; Brodeur, R.D. Jellyfish and forage fish spatial overlap on the eastern Bering Sea shelf during periods of high and low jellyfish biomass. Mar. Ecol. Prog. Ser. 2018, 591, 57–69. [Google Scholar] [CrossRef]
- Radu, G.; Maximov, V.; Anton, E.; Cristea, M.; Tiganov, G.; Totoiu, A.; Spanu, A. State of the Fishery Resources in the Romanian Marine Area. In Proceedings of the 4th Biennial Black Sea Scientific Conference, “Black Sea—Challenges towards Good Environmental Status”, Constanta, Romania, 28–30 October 2013; Volume 43, pp. 268–295. [Google Scholar]
- Prodanov, K.; Mikhailov, K.; Daskalov, G.; Maxim, C.; Chashchin, A.; Arkhipov, A.; Shlyakhov, V.; Ozdamar, E. Environmental Management of Fish Resources in the Black Sea and Their Rational Exploitation; Studies and Reviews No. 68; GFCM: Rome, Italy; FAO: Rome, Italy, 1997. [Google Scholar]
- Daskalov, G. Long-term changes in fish abundance and environmental indices in Black Sea. Mar. Ecol. Prog. Ser. 2003, 255, 259–270. [Google Scholar] [CrossRef]
- Scientific, Technical and Economic Committee for Fisheries (STECF) 14-14: Black Sea Assessments. Available online: https://stecf.jrc.ec.europa.eu/reports/medbs/-/asset_publisher/y1bW/document/id/903145?inheritRedirect=false&redirect=https%3A%2F%2Fstecf.jrc.ec.europa.eu%2Freports%2Fmedbs%3Fp_p_id%3D101_INSTANCE_y1bW%26p_p_lifecycle%3D0%26p_p_state%3Dnormal%26p_p_mode%3Dview%26p_p_col_id%3Dcolumn-2%26p_p_col_pos%3D1%26p_p_col_count%3D2%26_101_INSTANCE_y1bW_cur%3D3%26_101_INSTANCE_y1bW_keywords%3D%26_101_INSTANCE_y1bW_advancedSearch%3Dfalse%26_101_INSTANCE_y1bW_delta%3D20%26p_r_p_564233524_resetCur%3Dfalse%26_101_INSTANCE_y1bW_andOperator%3Dtrue (accessed on 20 November 2023).
- Shlyakhov, V.A.; Shlyakhova, O.V. Dynamics of trawl catch structure of Black Sea sprat on the Black Sea Ukrainian shelf and impact of natural factors and fishery on them. Trudy YugNIRO 2011, 49, 12–33. (In Russian) [Google Scholar]
- Zuev, G.; Skuratovskaya, E. Long-term dynamics of reproductive potential and fishing of European sprat Sprattus sprattus (Linnaeus, 1758) (Pisces: Clupeidae) in the Black Sea. Thalassas 2022, 38, 761–771. [Google Scholar] [CrossRef]
- Cadrin, S.X. Defining spatial structure for fishery stock assessment. Fish. Res. 2020, 221, 105397. [Google Scholar] [CrossRef]
- Zlateva, I.; Raykov, V.; Slabakova, V.; Stefanova, E.; Stefanova, K. Habitat suitability models of five keynote Bulgarian Black Sea fish species to specific abiotic and biotic factors. Oceanologia 2022, 64, 665–674. [Google Scholar] [CrossRef]
- Matveev, I.V.; Adonin, L.S.; Shaposhnikova, T.G.; Podgornaya, O.I. Aurelia aurita—Cnidarian, with a prominent medusiod stage. J. Exp. Zool. B Mol. Dev. Evol. 2012, 318B, 1–12. [Google Scholar] [CrossRef]
- Zagorodnyaya, Y. Oithona brevicornis in the Sevastopol Bay: Is it a single event or a new invader in the Black Sea fauna? Morskoy Ekol. J. Mar. Ecol. J. 2002, 61, 43. [Google Scholar]
- Temnykh, A.; Nishida, S. New record of the planktoniccopepod Oithona davisae Ferrari and Orsi in the Black Seawith notes on the identity of “Oithona brevicornis”. Aquat. Invasions 2012, 7, 425–431. [Google Scholar] [CrossRef]
- Mihneva, V.; Stefanova, K. Non-native copepod Oithona davisae in Western Black Sea: Seasonal and annual abundance variability. Bioinvasion Rec. 2013, 2, 119–124. [Google Scholar] [CrossRef]
- Gubanova, A.D.; Garbazey, O.A.; Popova, E.V.; Altukhov, D.A.; Mukhanov, V.S. Oithona davisae: Naturalization in the Black Sea, interannual and seasonal dynamics, and effects on the structure of the planktonic copepod community. Oceanology 2019, 59, 912–919. [Google Scholar] [CrossRef]
- Ishii, H.; Tanaka, F. Food and feeding of Aurelia aurita in Tokyo Bay with an analysis of stomach contents and measurement of digestion times. In Jellyfish Blooms: Ecological and Societal Importance; Developments in Hydrobiology Series; Purcell, J.E., Graham, W.M., Dumont, H.J., Eds.; Springer: Dordrecht, The Netherlands, 2001; p. 155. [Google Scholar] [CrossRef]
- Bisinicu, E.; Totoiu, A.; Timofte, F.; Harcota, G.; Oprea, L. Interrelations between the mesozooplankton community and Sprattus sprattus from the Romanian Black Sea Area. Sci. Pap. Ser. D Anim. Sci. 2020, 2, 539–544. [Google Scholar]
- Saglam, H.; Yıldız, I. Temporal and ontogenetic variation in the diet of three small pe-lagic fish in the Black Sea of Turkey. Mar. Biodivers. 2019, 49, 1799–1812. [Google Scholar] [CrossRef]
- Samhouri, J.F.; Levin, P.S.; Harvey, C.J. Quantitative evaluation of marine ecosystem indicator performance using food web models. Ecosystems 2009, 12, 1283–1298. [Google Scholar] [CrossRef]
- Samhouri, J.F.; Levin, P.S.; Ainsworth, C.H. Identifying thresholds for ecosystem–based management. PLoS ONE 2010, 5, e8907. [Google Scholar] [CrossRef]


| Variable | Categories | Trawl Counts | % |
|---|---|---|---|
| year | VI.2019 | 37 | 24.183 |
| VII.2020 | 38 | 24.837 | |
| VII.2021 | 41 | 26.797 | |
| VII.2022 | 37 | 24.183 | |
| depth stratum | 1 (<25 m) | 43 | 28.105 |
| 2 (25–50 m) | 81 | 52.941 | |
| 3 (50–75 m) | 16 | 10.458 | |
| 4 (75–100 m) | 13 | 8.497 |
| Species | Average Biomass t·km−2 | SE | Stock Biomass |
|---|---|---|---|
| VI.2019 | |||
| S. sprattus A. aurita | 3.283 | 0.414 | 26,298 |
| 0.57 | 0.161 | 4562 | |
| VII.2020 | |||
| S. sprattus A. aurita | 1.336 | 0.221 | 10,698 |
| 0.174 | 0.092 | 1396 | |
| VII.2021 | |||
| S. sprattus A. aurita | 3.64 | 0.52 | 29,177 |
| 0.086 | 0.012 | 689 | |
| VII.2022 | |||
| S. sprattus A. aurita | 1.442 | 0.294 | 11,553 |
| 0.17 | 0.021 | 1361 | |
| Average of summers 2019–2022 | |||
| S. sprattus | 2.394 | 0.207 | 19,431.69 |
| A. aurita | 0.243 | 0.047 | 2001.75 |
| Source of Variation | SS | df | MS | F | p-Value | F Crit |
|---|---|---|---|---|---|---|
| Between Groups | 24.735 | 3 | 8.245 | 20.486 | 7.57 × 10⁻¹¹ | 2.678 |
| Within Groups | 49.907 | 124 | 0.403 | |||
| Total | 127 |
| Year | Depth Stratum | S. sprattus Biomass (t·km−2) ± SD | Min–Max Biomass of S. sprattus | A. aurita Biomass (t·km−2) ± SD | Min–Max Biomass of A. aurita |
|---|---|---|---|---|---|
| VI.2019 | <25 | 1.991 ± 1.630 | 0–4.498 | 1.217 ± 1.329 | 0–4.004 |
| 25–50 | 4.428 ± 2.205 | 0–8.644 | 0.086 ± 0.148 | 0–0.435 | |
| 50–75 | 7.008 ± 3.029 | 4.866–9.15 | 0.076 ± 0.108 | 0–1.152 | |
| 75–100 | 2.150 ± 1.075 | 0–4.30 | 0.605 ± 0.541 | 0.064–1.186 | |
| VII.2020 | <25 | 1.419 ± 1.469 | 0–3.523 | 0.489 ± 1.014 | 0.002–2.877 |
| 25–50 | 1.327 ± 1.299 | 0–4.509 | 0.071 ± 0.171 | 0–0.729 | |
| 50–75 | 0.076 ± 0.092 | 0–0.179 | 0 | 0 | |
| 75–100 | 1.933 ± 1.767 | 0–3.400 | 0 | 0 | |
| VII.2021 | <25 | 3.045 ± 3.175 | 0.01–7.509 | 0.103 ± 0.052 | 0.02–0.147 |
| 25–50 | 4.322 ± 3.242 | 0.508–16.551 | 0.076 ± 0.088 | 0–0.303 | |
| 50–75 | 0.388 ± 0.465 | 0.118–0.926 | 0.124 ± 0.097 | 0.118–0.132 | |
| 75–100 | 0.0002 ± 0.0003 | 0–0.001 | 0.032 ± 0.056 | 0–0.097 | |
| VII.2022 | <25 | 2.013 ± 1.552 | 0.379–4.85 | 0.238 ± 0.101 | 0.095–0.411 |
| 25–50 | 2.012 ± 2.111 | 0.104–7.592 | 0.172 ± 0.133 | 0.029–0.445 | |
| 50–75 | 0.127 ± 0.137 | 0–0.394 | 0.119 ± 0.114 | 0–0.299 | |
| 75–100 | 0.011 ± 0.019 | 0–0.033 | 0.044 ± 0.077 | 0–0.133 | |
| Average for 2019–2022 | <25 | 2.056 ± 1.954 | 0–7.509 | 0.590 ± 0.99 | 0–4.004 |
| 25–50 | 3.103 ± 2.753 | 0–16.551 | 0.095 ± 0.138 | 0–0.729 | |
| 50–75 | 1.026 ± 2.473 | 0–9.150 | 0.092 ± 0.096 | 0–0.299 | |
| 75–100 | 0.779 ± 1.525 | 0–4.300 | 0.204 ± 0.391 | 0–1.186 |
| 1. Scenario 1: Occurrence of A. aurita aggregations with biomass of 3–4 t·km−2 (2019–2020). | ||
| Variables | A. aurita Biomass | S. sprattus Biomass |
| A. aurita biomass | 1 | |
| S. sprattus biomass | −0.301 (p = 0.009) | 1 |
| Depth | −0.253 (p = 0.028) | −0.12 (p = 0.305) |
| 2. Scenario 2: Scattered presence of A. aurita by generally low jellyfish biomass of < 0.4 t·km−2 (2021–2022). | ||
| Variables | A. aurita Biomass | S. sprattus Biomass |
| A. aurita biomass | 1 | |
| S. sprattus biomass | 0.168 (p = 0.165) | 1 |
| Depth | −0.362 (p = 0.002) | −0.622 (p < 0.0001) |
Disclaimer/Publisher’s Note: The statements, opinions and data contained in all publications are solely those of the individual author(s) and contributor(s) and not of MDPI and/or the editor(s). MDPI and/or the editor(s) disclaim responsibility for any injury to people or property resulting from any ideas, methods, instructions or products referred to in the content. |
© 2023 by the authors. Licensee MDPI, Basel, Switzerland. This article is an open access article distributed under the terms and conditions of the Creative Commons Attribution (CC BY) license (https://creativecommons.org/licenses/by/4.0/).
Share and Cite
Mihneva, V.; Raykov, V.; Dimitrov, D.P. Summer Biomass Variability and Spatial Interactions between European Sprat (Sprattus sprattus) and Moon Jellyfish (Aurelia aurita) in the Western Part of the Black Sea. Animals 2023, 13, 3691. https://doi.org/10.3390/ani13233691
Mihneva V, Raykov V, Dimitrov DP. Summer Biomass Variability and Spatial Interactions between European Sprat (Sprattus sprattus) and Moon Jellyfish (Aurelia aurita) in the Western Part of the Black Sea. Animals. 2023; 13(23):3691. https://doi.org/10.3390/ani13233691
Chicago/Turabian StyleMihneva, Vesselina, Violin Raykov, and Dimitar Petkov Dimitrov. 2023. "Summer Biomass Variability and Spatial Interactions between European Sprat (Sprattus sprattus) and Moon Jellyfish (Aurelia aurita) in the Western Part of the Black Sea" Animals 13, no. 23: 3691. https://doi.org/10.3390/ani13233691
APA StyleMihneva, V., Raykov, V., & Dimitrov, D. P. (2023). Summer Biomass Variability and Spatial Interactions between European Sprat (Sprattus sprattus) and Moon Jellyfish (Aurelia aurita) in the Western Part of the Black Sea. Animals, 13(23), 3691. https://doi.org/10.3390/ani13233691