Article

Exploring the Impact of Insertion/Deletion in FTO and PLIN1 Genes on Morphometric Traits in Sheep

College of Animal Science and Technology, Henan University of Science and Technology, Luoyang 471023, China
*
Author to whom correspondence should be addressed.
Animals 2023, 13(19), 3032; https://doi.org/10.3390/ani13193032
Submission received: 4 August 2023 / Revised: 7 September 2023 / Accepted: 12 September 2023 / Published: 27 September 2023
(This article belongs to the Section Animal Genetics and Genomics)

Abstract

:

Simple Summary

Fat mass and obesity-associated (FTO) and perilipin1 (PLIN1) genes have been associated with fat mass deposition. These genes have also been found to regulate economic traits (e.g., morphometric traits) in animals. In this study, the researchers analyzed insertion–deletion (InDel) variations in the FTO and PLIN1 genes and their association with morphometric traits in three sheep breeds (Hu sheep, Dupor sheep, and Small Tail Han sheep). A total of six InDels (FTO-2, FTO-3, FTO-4, FTO-5, FTO-6, and PLIN1) were identified in the FTO and PLIN1 genes in the three breeds of sheep. Genetic variations of these InDels were evaluated on the basis of their polymorphism information content (PIC). The FTO-6 and PLIN1 genes showed low levels of polymorphism (0 < PIC < 0.25), while the other four InDels were moderately polymorphic (0.25 < PIC < 0.50) in the three breeds of sheep. The results of the association analysis revealed that four InDels from the FTO and PLIN1 genes were significantly associated with the morphometric traits in the three sheep breeds, such as body weight, body height, chest width, chest depth, cannon circumference, head length, coccyx length, forehead width, and back height. Based on these findings, the FTO and PLIN1 genes can serve as genetic markers to select sheep with desirable morphometric traits.

Abstract

This study aimed to identify InDels from the FTO and PLIN1 genes and to analyze their association with morphometric traits in Hu sheep (HS), Dupor sheep (DS), and Small Tail Han sheep (STHS). The FTO and PLIN1 genes were genotyped using the insertion/deletion (InDel) method. A one-way ANOVA with SPSS 26.0 software (IBM Corp, Armonk, NY, USA) was used to assess the effect of the InDel FTO and PLIN1 genes on morphometric traits. The results revealed significant associations between certain InDels and the morphometric traits in different breeds of sheep. Specifically, FTO-2 was significantly associated with cannon circumference (CaC) in HS rams and body height (BoH) in HS ewes (p < 0.05). FTO-2 was also significantly associated with chest width (ChW), CaC, head length (HeL), and coccyx length (CoL) in the STHS breed (p < 0.05). FTO-3 showed significant associations with BoH in HS rams and BoH, back height (BaH), ChW, and chest depth (ChD) in HS ewes (p < 0.05). FTO-3 was also significantly associated with ChW in the DS and STHS breeds (p < 0.05). FTO-5 was significantly associated with body weight (BoW) in the DS breed and BoH in the STHS breed (p < 0.05). Furthermore, PLIN1 was significantly related to BoW in the DS breed and was significantly associated with CoL and forehead width (FoW) in the STHS breed (p < 0.05). In conclusion, the study suggested that InDels in the FTO and PLIN1 genes could provide practical information to improve morphometric traits in sheep breeding.

1. Introduction

Hu sheep (HS), Dupor sheep (DS), and Small Tail Han sheep (STHS) are common types in the sheep farming industry in China. HS sheep have excellent reproductive performance, are adapted to factory feeding under housed conditions, and are resistant to heat and humidity. DS are precocious; they have early growth, high carcass leanness, and tender meat; and they are resistant to rough feeding and suitable for the arid and barren ecological environment. STHS are ideal for fat lamb production because of their fast growth and early sexual maturity. To better meet the needs of consumers and improve the selection of sheep, researchers need to effectively produce larger and heavier breeds of sheep with the lowest feed consumption in the shortest possible time. Marker-assisted selection has become an efficient, rapid, and reliable breeding method, which is widely used in livestock breeding research [1]. InDel is a new molecular marker that is different from SNPs; it has good stability, high polymorphism, and a simple typing system, which can improve the intensity and efficiency of selection [2,3,4,5]. By identifying the target trait to be studied, selecting multiple related genes for linkage and correlation analysis, and investigating whether the mutation is associated with the phenotype, selection accuracy is greatly improved, and sheep breeds with excellent production performance can be produced.
Among the many genes known to influence morphometric traits, the FTO (fat mass and obesity-associated) and PLIN1 (perilipin 1) genes have gained attention due to their involvement in adipogenesis and lipid metabolism in the PPAR signaling pathway [6]. Both genes have been extensively studied in humans and other mammalian species, but their role in sheep remains relatively unexplored. The FTO gene in sheep is located on chromosome 14 and has nine exons and eight introns. Previous studies have indicated that FTO not only regulated obesity but was also significantly associated (p < 0.05) with economic traits in pigs, sheep, and cattle [7,8,9]. Wang et al. [9] reported that ten InDels of FTO were identified in Tong sheep; eight InDels showed a significant correlation with growth traits; and four InDels were significantly associated with fat-tailed traits (p < 0.05). The PLIN1 gene in sheep is located on chromosome 18 and has nine exons and eight introns. The SNP of PLIN was also associated with body fat weight, low body mass index, and the total cholesterol level [10]. Furthermore, PLIN can also affect growth traits and carcass traits in animals. Zhang et al. [11] reported that PLIN had a significant effect on carcass traits in Chinese ducks and could be used as a candidate gene to select Chinese ducks for meat quality traits. Gol et al. [12] showed that PLIN significantly affected the lean percentage in pigs, suggesting that PLIN may be used as a genetic marker for lean pork growth. Zappaterra et al. [13] found that the SNP of the PLIN gene rs327694326 was associated with the contents of oleic acid and cis-cowpox fatty acids in the back fat tissue of large white pigs, suggesting that PLIN may be used as a genetic marker for the quality of pork meat. Raza et al. [14] showed that five SNPs of the PLIN1 gene were identified in 510 Qinchuan cattle, including g.3580T > C, g.3898G > A, g.8333G > A, g.10517T > C, and g.10538G > T, and that these five SNPs were significantly associated with the depth of back fat, intramuscular fat, and chest depth in Qinchuan cattle (p < 0.05).
In the present study, we analyzed the polymorphisms of the FTO and PLIN1 genes and their association with the morphometric traits of the HS, DS, and STHS breeds of sheep using InDel technology based on previous studies of polymorphisms for these genes in other breeds of sheep. The results may provide useful markers for the molecular breeding of sheep.

2. Materials and Methods

2.1. Ethical Treatment

All the experimental procedures in this study were approved by the Institutional Animal Care and Use Committee of the College of Animal Science, Henan University of Science and Technology (HAUST#2021-9-22), and this study was carried out in strict compliance with the guidelines of the Guide to Animal Welfare in China.

2.2. Experimental Animals and Morphometric Trait Data Collection

This study took three breeds of sheep (HS, DS, and STHS) as the research objects. All the individuals within the same sheep breed were healthy, unrelated, and managed under the same conditions. One hundred and ninety-two HS (110 female and 82 male), 86 DS (female), and 96 STHS (female) blood samples of three sheep breeds and dates of morphometric traits were collected at the age of six months (they were born at the same time) from native sheep meat breeding farms in Henan province. Table 1 gives sample details. Genomic DNA from 374 sheep was extracted from jugular vein blood samples by the blood genomic DNA extraction kit method (Biomed, Beijing, China) and stored at −80 °C. The morphometric traits of three sheep breeds at six months of age were measured using standard measurement methods by the same breeder in the sheep breeding farm, including body height (BoH), back height (BaH), buttock height (BuH), body length (BoL), chest circumference (ChC), chest depth (ChD), chest width (ChW), cannon circumference (CaC), waist angle width (WaW), buttock width (BuW), body weight (BoW), coccyx height (CoH), coccyx length (CoL), forelimb height (FoH), head depth (HeD), head length (HeL), neck length (NeL), abdominal circumference (AbC), forehead width (FoW), and leg hip circumference (LhC) [15].

2.3. Primer Designing, PCR Amplification, and Indel Genotyping

Based on the potential InDel sites of FTO and PLIN1 published on the NCBI website (https://www.ncbi.nlm.nih.gov/ (accessed on 2 May 2022)), 11 specific primers were designed using Primer Premier Software (version 5.0; Premier Biosoft International, Palo Alto, CA, USA) according to the sequence of 300–500 bp before and after the InDel loci with NC_056067.1 and NC_056071.1 as reference genomes, respectively. This study aimed to identify the InDels using PCR and agarose gel electrophoresis methods. Sites with variant base numbers less than 6 bp were not detected by agarose gel electrophoresis, while sites with variant base numbers greater than 6 bp were selected. The primers were verified by the BLAST program on the NCBI website (https://blast.ncbi.nlm.nih.gov/Blast.cgi (accessed on 2 May 2022)). Primer information, product size, and InDel sizes are shown in Table 2. Three DNA pools consisting of 20 DNA samples randomly selected from three sheep breeds were constructed. The primers (Tsingke Biotechnology Co., Ltd., Beijing, China) were diluted to 10 ng/µL according to the instructions.
Polymerase chain reaction (PCR) was performed in a 10 μL reaction volume consisting of 1.0 μL of DNA, 5 μL of 2 × Taq PCR Master Mix (Dingguo Changsheng Biotechnology Co., Ltd., Beijing, China), 0.8 μL of each primer, and 2.4 μL of double-distilled water (ddH2O) to make up the volume. The PCR amplification procedure was as follows: pre-denaturation at 95 °C for 5 min, followed by 10 cycles of denaturation at 95 °C for 40 s; annealing at 60 °C for 30 s (started at 60 °C and decreased by 1 °C per cycle); extension at 72 °C for 45 s; 25 cycles of denaturation at 95 °C for 40 s; annealing temperature for 30 s, extension at 72 °C for 45 s; and final extension at 72 °C for 5 min. All available individuals were genotyped using 3.0% agarose gel electrophoresis. Genotyping was performed by observing the bands in which one band was the II (insertion/insertion) type or DD (deletion/deletion) and the ID (insertion/deletion) type. The amplified samples were sent to Tsingke Biotechnology Co., Ltd. (Beijing, China) for sequencing. Sequence alignment and InDel identification were performed using the MegAlign program (version 5.0; DNAstar, Madison, WI, USA). Chromas software (version 2.2.2; Technelysium, Queensland, Australia) was used to perform the sequence analyses.

2.4. Population Genetic Analyses

All individual genotypes at each InDel were statistically analyzed using Microsoft Excel (Microsoft Office 365, Redmond, WA, USA). The population genetic parameters of the InDel variants, such as gene frequencies, allele frequencies, homozygosity (Ho), heterozygosity (He), effective allele numbers (Ne), and polymorphism information content (PIC), were calculated by POPGENE (version 1.32) [16]. The existence of the Hardy–Weinberg equilibrium (HWE) for InDels was tested using the online SHEsis website (http://analysis.bio-x.cn/myAnalysis.php (accessed on 10 January 2023)) [17]. Linkage disequilibrium (LD) and haplotype analysis were performed using the SHEsis online website [18].

2.5. Statistical Analysis

All the data were in a normal distribution, which indicated suitability for subsequent analysis. Associations between the FTO and PLIN1 InDel genotypes and morphometric traits were evaluated with a one-way analysis of variance (=three genotypes and sample size greater than 3) and independent sample t-test (=two genotypes) in SPSS Statistics (Version 26.0; IBM Corp, Armonk, NY, USA). When the analysis of variance performed on each group of genotypes indicated a significant (p < 0.05) difference, statistical differences between the two genotypes were subsequently evaluated with the Bonferroni correction test. All results were expressed as mean ± standard error (SE). The model was used as follows:
Yij = μ + Gi + eij.
Yij: phenotypic values of morphometric traits; µ: the overall population mean of each trait; Gi: the effect of the genotype; eij: the random residual error. The age, sampling season, and rearing environment were consistent, and their effects were not considered in this model. Differences were considered significant at p ≤ 0.05.

3. Results

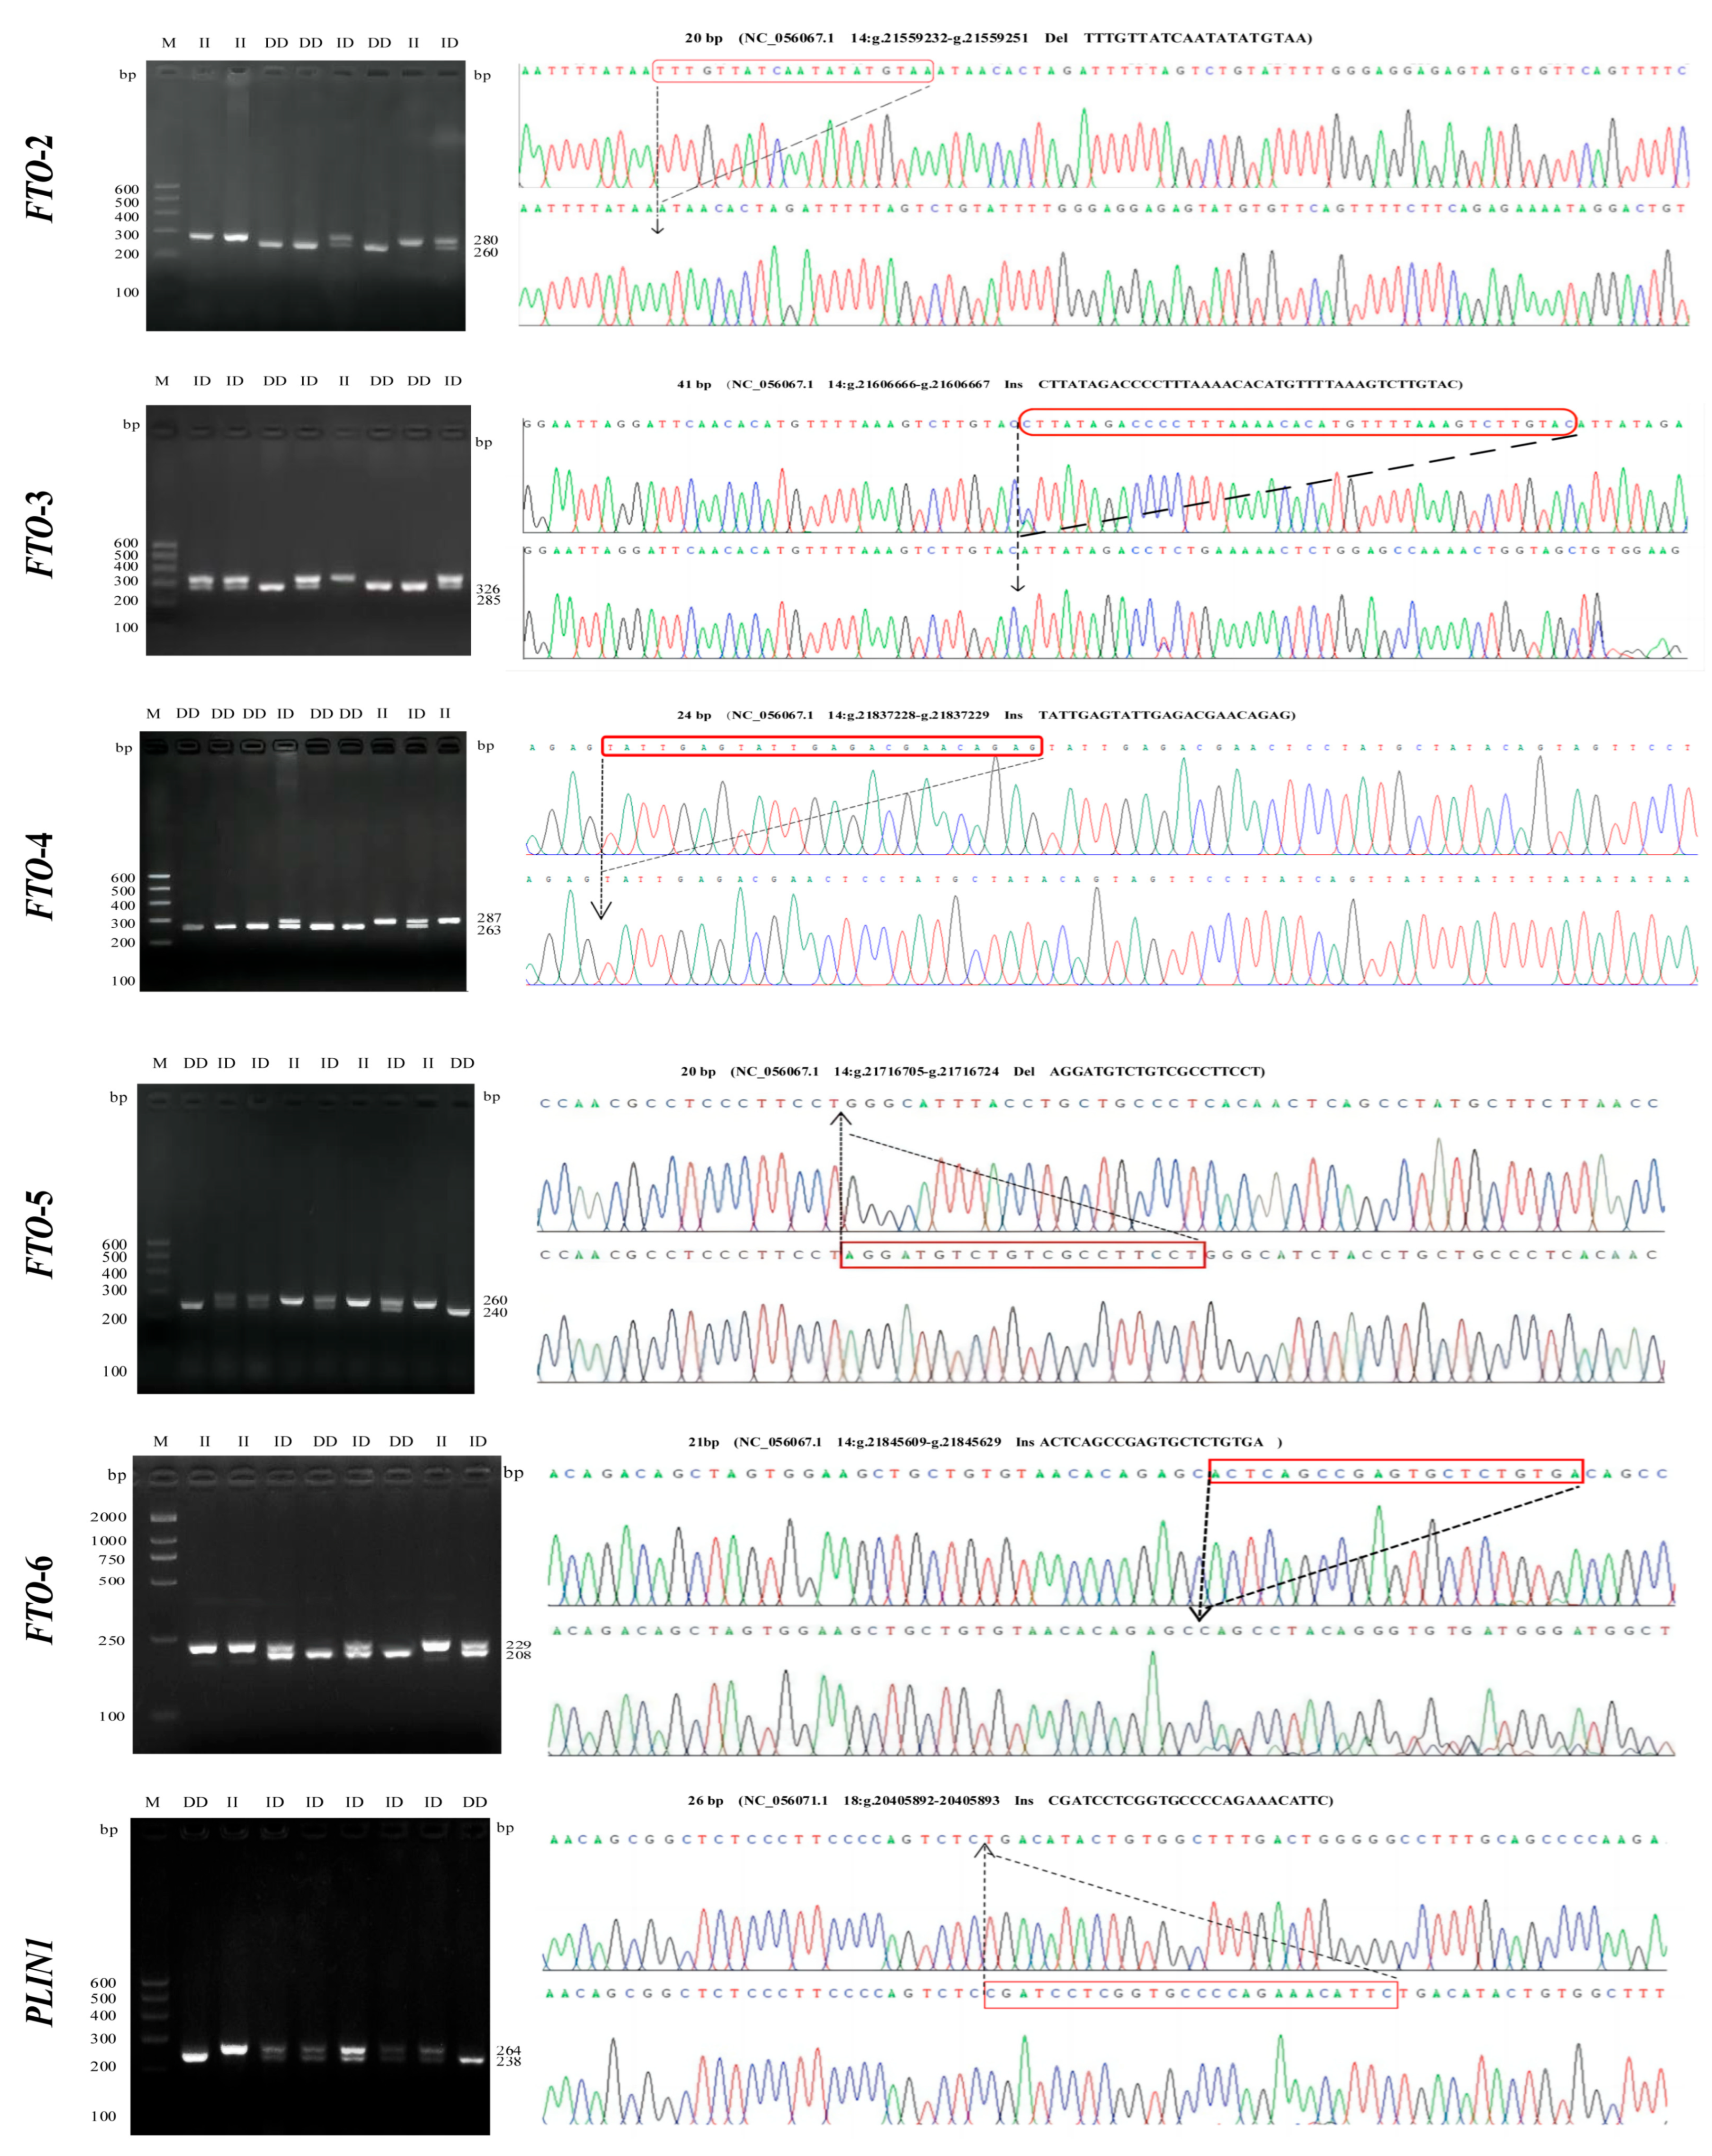
3.1. Identification of InDel Variants in the FTO and PLIN1 Genes

After the PCR amplification and sequencing of 11 potential InDel loci, a total of six InDels of the FTO and PLIN1 genes (FTO-2, FTO-3, FTO-4, FTO-5, FTO-6, and PLIN1) were identified in three breeds of sheep. Each InDel locus was present in two or three genotypes: the insertion/insertion genotype (II), insertion/deletion (ID) genotype, and deletion/deletion (DD) genotype (Figure 1). Sequencing revealed a 20 bp deletion (TTTGTTATCAATATATATGTAA) in the FTO-2 gene, located at NC_056067.1 g.21559232-g.21559251. A 41 bp insertion (CTTATAGACCCCTTTAAAACACATGTTTTAAAGTCTTGTAC) was identified in the FTO-3 gene, located at NC_056067.1 g.21606666-g.21606667. A 24 bp insertion (TATTGAGTATTGAGACGAACAGAG) was identified in the FTO-4 gene, located at NC_056067.1 g.21837228-g.21837229. A 20 bp deletion (AGGATGTCTGTCGCCTTCCT) was detected in the FTO-5 gene, located at NC_056067.1 g.21716705-g.21716724. A 21 bp insertion (ACTCAGCCGAGTGCTCTGTGA) was identified in the FTO-6 gene, located at NC_056067.1 g.21845609-g.21845629. Furthermore, a 26 bp segment was missing in the PLIN1 gene, which was located at NC_056071.1 g.20405892-g.20405893, and the missing sequence was CGATCCTCGGTGCCCCAGAAACATTC (Figure 1). These results were identical to those predicted for the InDel locus (on chromosome 14) of the FTO gene (NC_056067.1) and the InDel locus (on chromosome 18) of the PLIN1 gene (NC_056071.1) in the NCBI database for sheep. Three genotypes (II, ID, and DD) were identified in the FTO-2, FTO-3, FTO-4, FTO-5, and FTO-6 genes in the HS, DS, and STHS breeds, except that only the ID and DD genotypes were identified in the FTO-2 gene in the DS breed. Additionally, three genotypes were identified in the PLIN1 gene in the STHS breed, and the ID and DD genotypes were identified in the PLIN1 gene in the HS and DS breeds (Figure 2).

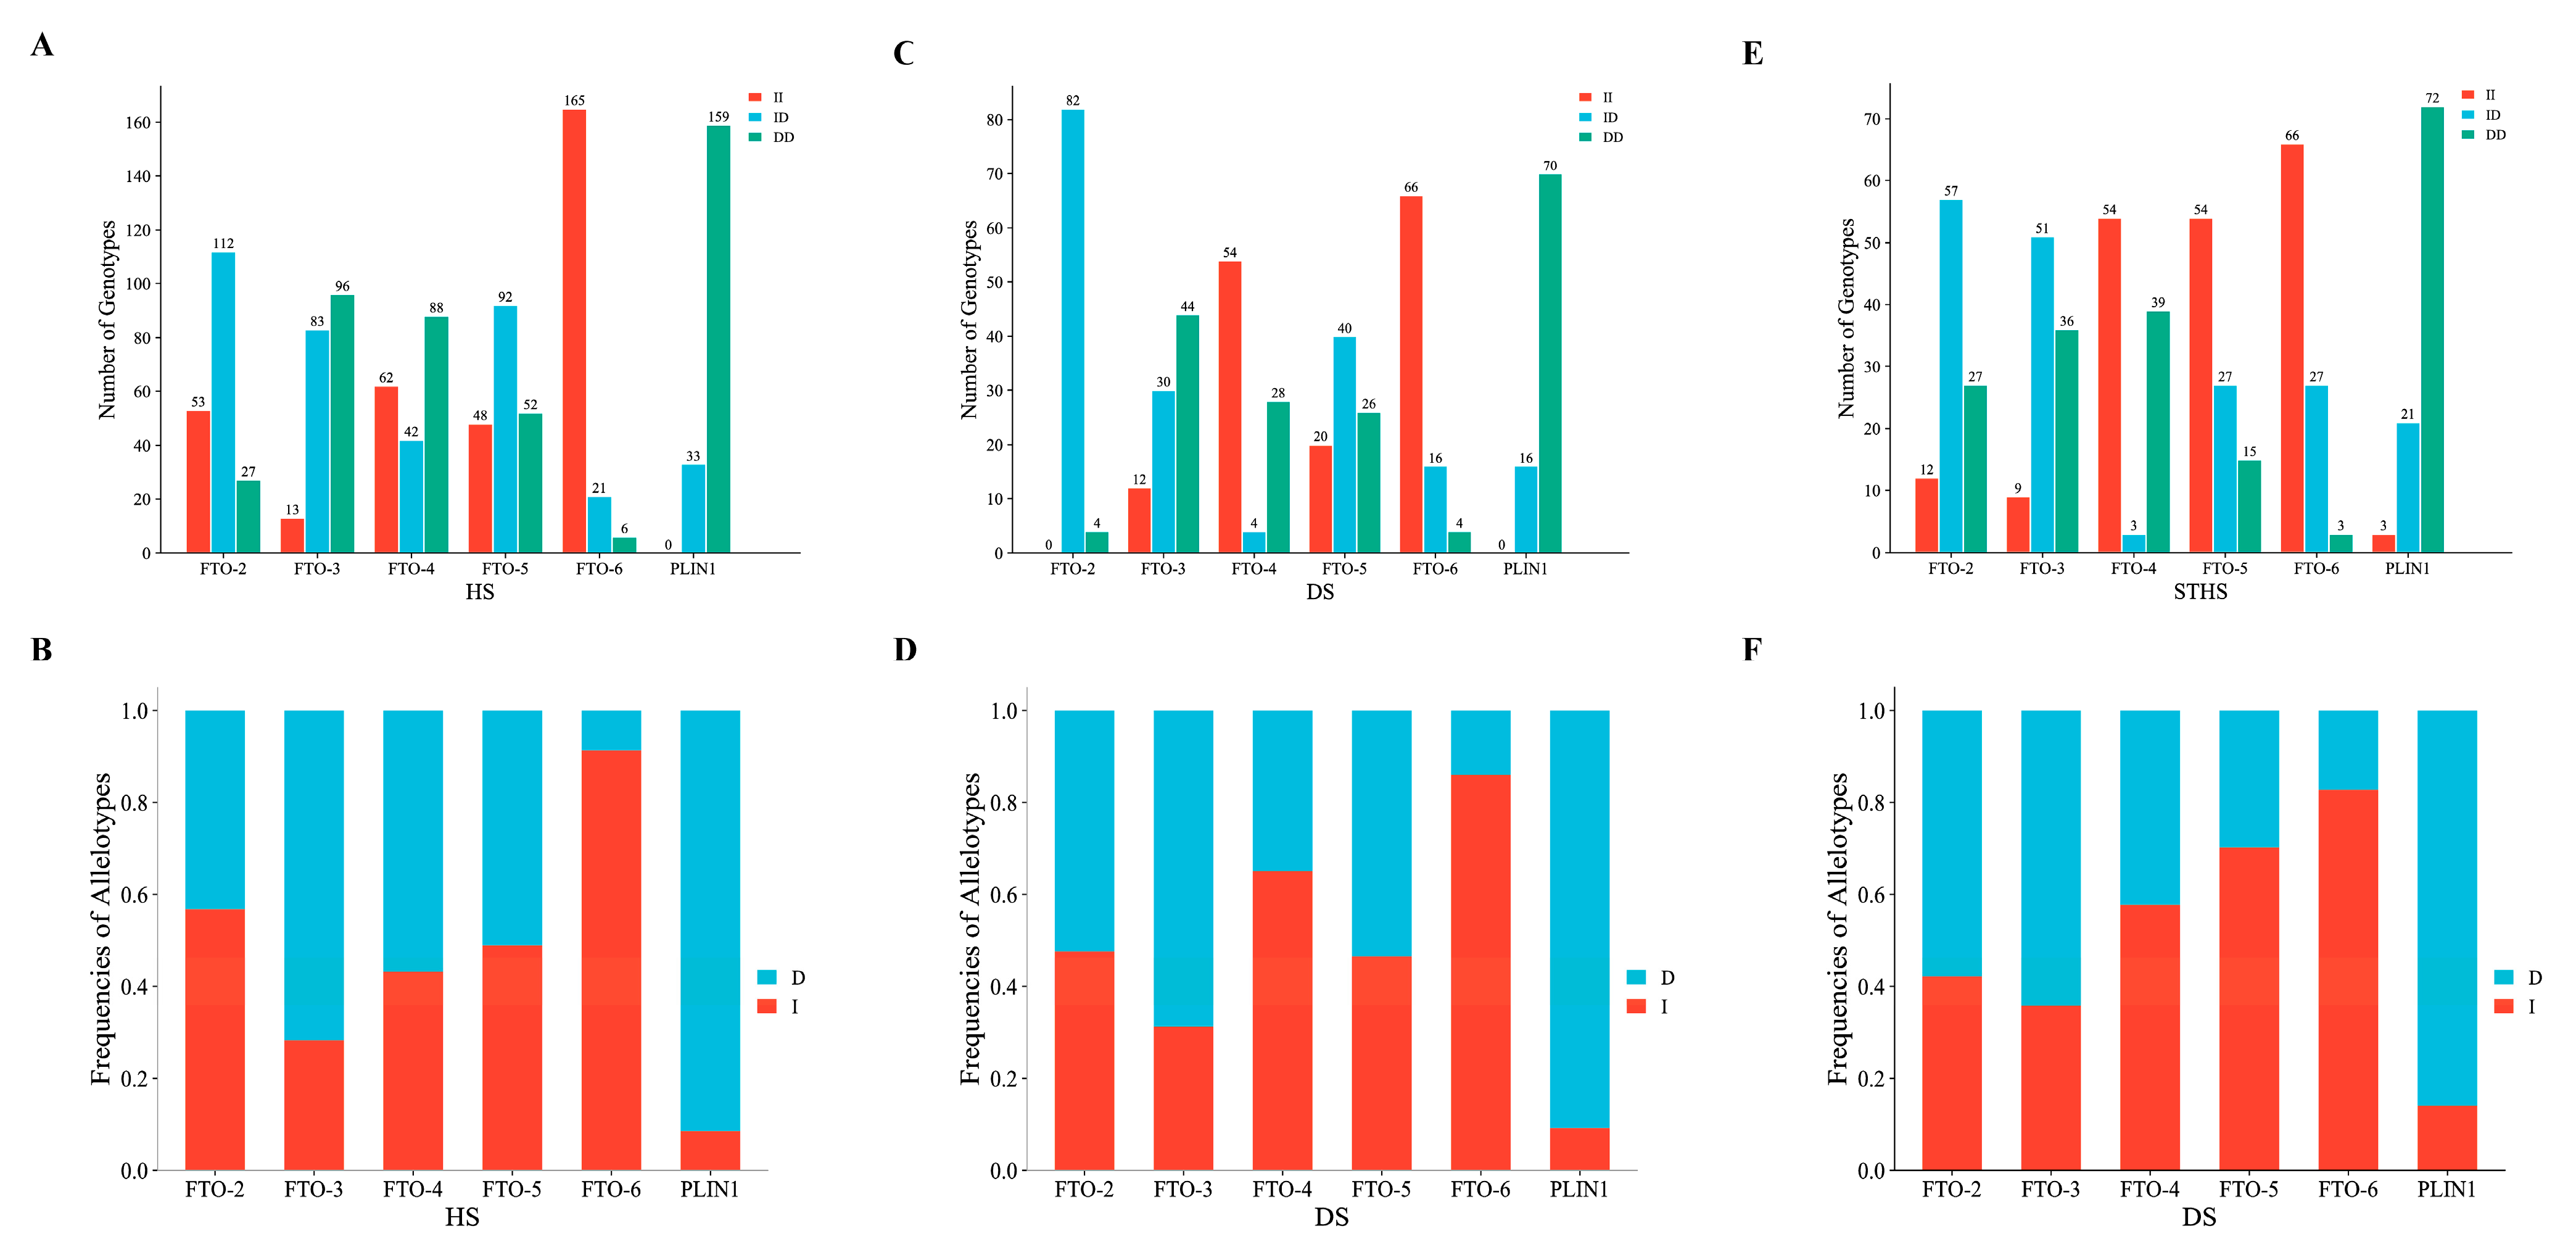
3.2. Estimation of Genetic Parameters for the InDels of the FTO and PLIN1 Genes

The population genetic parameters were estimated for the FTO and PLIN1 genes (Table 3). In the HS population, the I allele was the dominant allele in FTO-2 and FTO-6, and the D allele was the dominant allele in FTO-3, FTO-4, FTO-5, and PLIN1. In the DS population, the I allele was the dominant allele in the FTO-4 and FTO-6, and the D allele was the dominant allele in FTO-2, FTO-3, FTO-5, and PLIN1. In the STHS population, the I allele was the dominant allele in FTO-4, FTO-5, and FTO-6, and the D allele was the dominant allele in FTO-2, FTO-3, and PLIN1 (Figure 2). Based on PIC, FTO-6 and PLIN1 had low polymorphism (0 < PIC < 0.25). The other three InDels were moderately polymorphic (0.25 < PIC < 0.50). A related study of the Tong sheep breed showed results similar to those of the present study. All 10 InDels detected were moderately polymorphic (0.25 < PIC < 0.50), which may be related to environmental factors and genetic differences between the breeds. Except for FTO-2 in the three populations, FTO-4 in the HS population, FTO-5 in the STHS population, FTO-6 in the HS and DS populations, which deviated from HWE (p < 0.05), the remaining groups were in HWE (p > 0.05). The homozygosity of the six InDels (FTO-2, FTO-3, FTO-4, FTO-5, FTO-6, and PLIN1) was higher than the heterozygosity, indicating a small degree of genetic variation. The maximum number of effective alleles in FTO-5 was 1.999 in the HS breed, which suggested that the genetic drift was minimal, and the alleles were evenly distributed in the population.

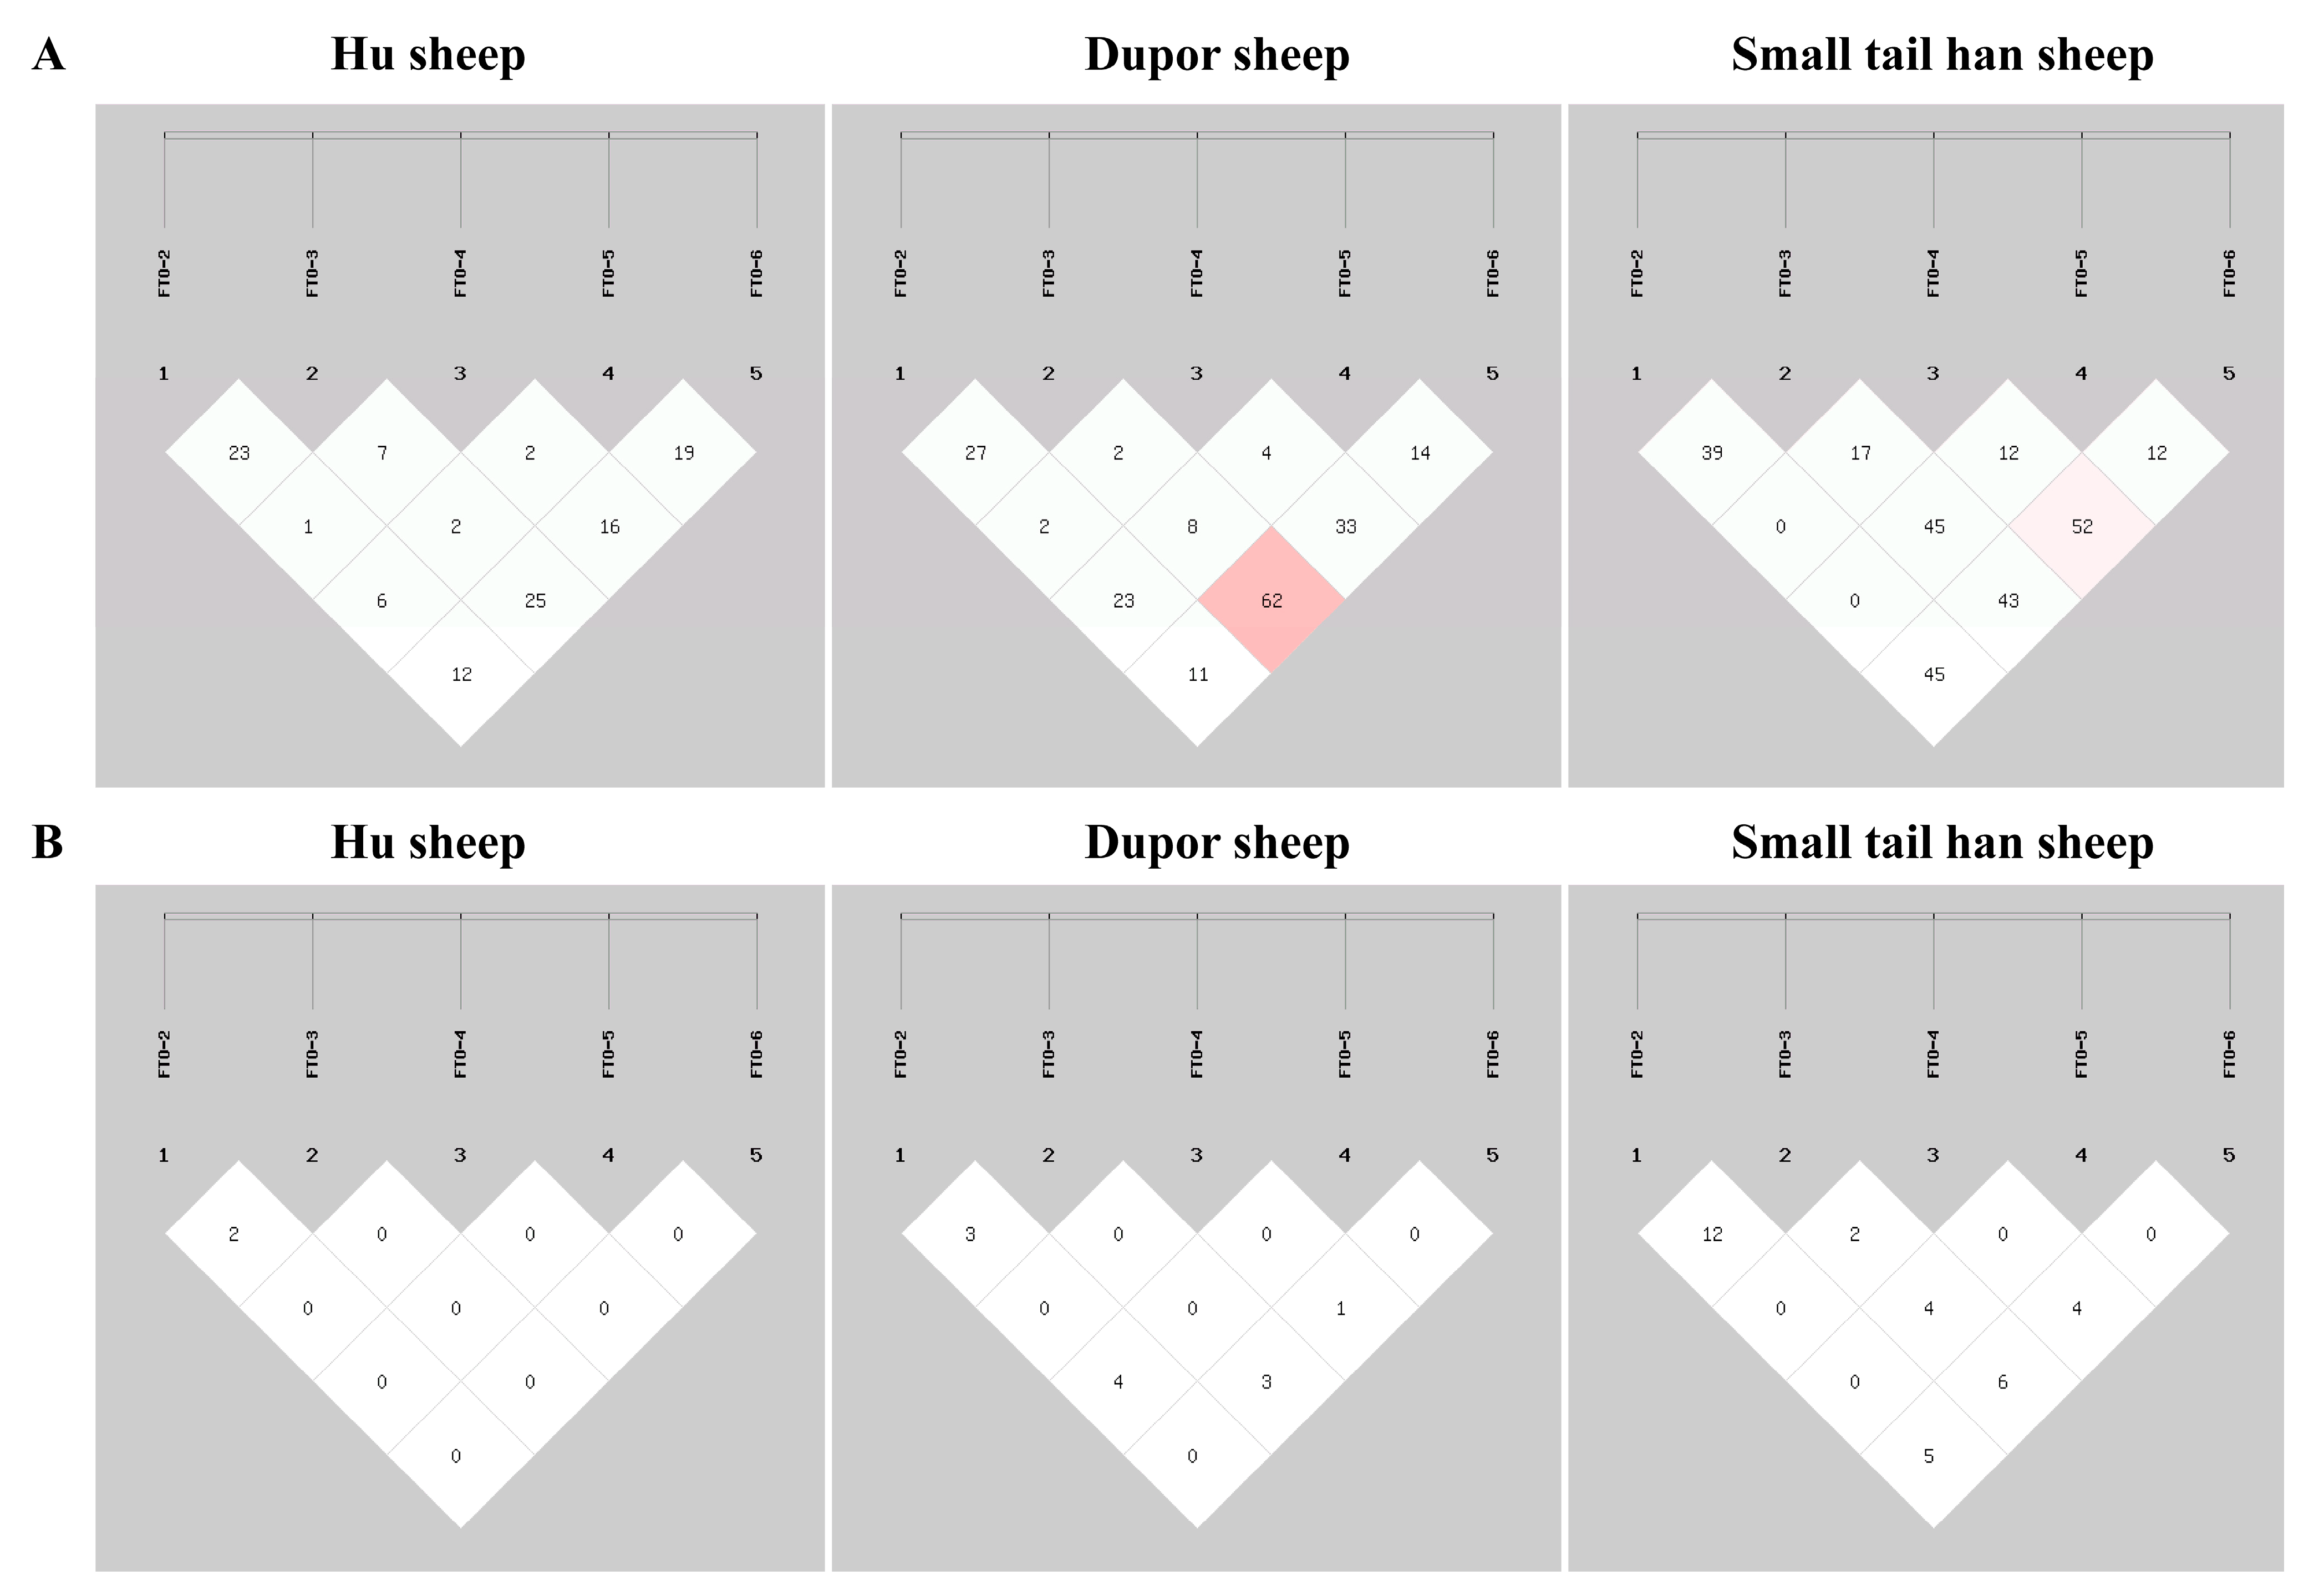
3.3. Linkage Disequilibrium Analysis for InDels in the FTO Gene

The linkage disequilibrium analysis of the five FTO InDels using the SHEsis online website showed that the five InDels are not strongly linked in the HS, DS, and STHS breeds (D > 0.88 or r2 > 0.33 indicates strong linkage disequilibrium), as shown in Figure 3. It indicated that these loci tend to be inherited independently [19]; so, only a single InDel locus was used for association with the growth traits of the three sheep breeds without haplotype analysis.

3.4. Association of InDels in the FTO and PLIN1 Genes with Morphometric Traits

The results of the association analyses of the FTO and PLIN1 polymorphisms and morphometric traits in the three sheep breeds are shown in Table 4. FTO-2 was significantly associated with CaC in HS rams (p < 0.05). Individuals with the ID genotype had higher CaC. FTO-2 was significantly associated with BoH in HS ewes (p < 0.05). Individuals with the DD genotype had higher BoH. FTO-2 was significantly associated with ChW, CaC, HeL, and CoL in the STHS breed (p < 0.05). Individuals with the II genotype had higher ChW, CaC, HeL, and CoL. FTO-3 showed a significant association with BoH in HS rams (p < 0.05). Individuals with the ID genotype had higher BoH. FTO-3 was also significantly associated with BoH, BaH, ChW, and ChD in HS ewes (p < 0.05). Individuals with the II genotype had higher BoH, BaH, ChW, and ChD. FTO-3 showed a significant association with ChW in the DS and STHS breeds (p < 0.05). Individuals with the ID genotype had higher ChW in the DS breed, while individuals with the DD genotype had higher ChW in the STHS breed. FTO-5 was significantly associated with BoW in the DS breed (p < 0.05). Individuals with the II genotype had higher BoW. FTO-5 was also significantly associated with BoH in the STHS breed (p < 0.05). Individuals with the ID genotype had higher BoH. PLIN1 was significantly related to BoW in the DS breed (p < 0.05). Individuals with the ID genotype had higher BoW. PLIN1 was also significantly associated with CoL and FoW in the STHS breed (p < 0.05). Individuals with the ID genotype had higher CoL and FoW. No significant differences were observed between the rest of the InDels for the other morphometric traits (p > 0.05, Tables S1–S3). The FTO and PLIN1 genes are expected to be genetic selection markers for morphometric traits in sheep.

4. Discussion

The economic value of livestock is heavily influenced by their growth and slaughter characteristics, and the early selection of individuals with superior phenotypes based on their genotype can greatly enhance population efficiency. In this study, the association between FTO and PLIN1 polymorphisms and morphometric traits in 374 sheep individuals was examined. Six InDels in the FTO and PLIN1 genes were identified and found to be correlated with morphometric traits in Hu, Small Tail Han, and Dupor sheep. This discovery offers a potential molecular marker for enhancing sheep breeding.
FTO is the first gene linked to human obesity; it regulates energy metabolism and food intake, leading to obesity in animals [20,21,22]. PLIN1 is a phosphorylatable phosphoprotein associated with lipid droplets; it is involved in lipid catabolism, which is also linked to obesity [23]. Previous studies have shown that FTO and PLIN1 do not only play a role in regulating obesity; they are also significantly associated (p < 0.05) with economically important traits in pigs, sheep, and cattle [7,8,9]. Wu et al. [24] conducted InDel detection and association analysis in seven Chinese sheep breeds, revealing a significant association between GHR-InDel and growth traits (p < 0.05). Yang et al. [25] found significant associations between seven SNPs (g.102G > A, g.255G > A, g.349C > T, g.384A > G, g.386G > A, g.444G > A, g.556G > A) of G0S2 and carcass traits in chickens. Specifically, individuals with the AG genotype at g.444G > A exhibited the highest breast muscle weight, while individuals with the AA genotype at g.556G > A showed the lowest fat weight (p < 0.05). Sun et al. [26] discovered significant associations between the SNPs of AGPAT3 and various milk production traits in Chinese Holstein cows, including test-day milk yield, protein percentage, fat percentage, 305-day milk yield, milk urea nitrogen, and somatic cell score. Huang et al. [27] demonstrated a significant association between a novel InDel of Cry2 and litter size in Australian White sheep. Specifically, individuals with the II genotype had larger litter sizes than those with the ID genotype in P2-Del-6-bp at first parity, while individuals with the ID genotype had larger litter sizes than those with the II genotype in P1-Del-6-bp at third parity (p < 0.05). Liu et al. [28] identified 15 SNPs in the GDF9 gene in Dongxiang blue-shelled chickens and Luhua chickens. Among these, three SNPs (g.17156387C > T, g.17156427A > G, and g.17156703A > C) exhibited significant associations with age at the first egg, the weight of the first egg, egg weight at 300 days of age, and the total number of eggs at 300 days of age in chickens. These studies provide evidence that mutations can induce alterations in domestic animal economic traits.
Identifying the causal variant of a gene can enhance the accuracy of genomic selection and is considered to be an efficient approach for analyzing the associations between genetic polymorphisms and economically important traits [29]. This study primarily focused on the association between mutations at the InDel locus and the morphometric traits in three sheep breeds; the traits varied within the breeds. These results might result from the differences in the genetic backgrounds of the different breeds [30]. Wang et al. [9] observed three genotypes (II, ID, and DD) at ten novel InDels of FTO in Tong sheep, which were similar to those of this study. These results indicate that the frequency of InDels varies across different species and is associated with differentiation, gene penetration, genomic segment size, and effective population size. In our study, there was a significant association (p < 0.05) between the four InDels (FTO-2, FTO-3, FTO-5, PLIN1) we detected in FTO and PLIN1, with morphometric traits in the HS, DS, and STHS breeds. This result was similar to those of previous findings in other species, where mutations in these genes were significantly associated with the animals’ growth traits [7,28,29]. The sheep industry in China has made significant progress in recent years and has primarily focused on fulfilling the daily demands of consumers. However, there is a need for additional valuable molecular genetic markers to enhance sheep growth and meat quality traits in China.

5. Conclusions

In summary, we identified six InDels from three sheep populations, including five InDels in FTO and one InDel in PLIN1. Three InDels in FTO were associated with HS, DS, and STHS growth traits, and an InDel in PLIN1 was associated with DS and STHS morphometric traits. Our findings implied that the InDels of the FTO and PLIN1 genes could be used as molecular markers for sheep breeding.

Supplementary Materials

The following supporting information can be downloaded at: https://www.mdpi.com/article/10.3390/ani13193032/s1. Table S1: Relationship between InDels of FTO and PLIN1 and morphometric traits in HS rams. Table S2: Relationship between InDels of FTO and PLIN1 and morphometric traits in HS ewes. Table S3: Relationship between InDels of FTO and PLIN1 and morphometric traits in DS. Table S4: Relationship between InDels of FTO and PLIN1 and morphometric traits in STHS.

Author Contributions

Investigation, X.W.; methodology, H.F. and L.W.; software, X.L.; formal analysis, F.Z.; data curation, M.C. and X.W.; writing—original draft preparation, J.L. and X.W.; writing—review and editing, J.L., X.W. and Y.H.; project administration, J.B. All authors have read and agreed to the published version of the manuscript.

Funding

This work was partly supported by the National Natural Science Foundation of China (No. 31201777).

Institutional Review Board Statement

The animal study protocol was approved by the Institutional Animal Care and Use Committee of the College of Animal Science, Henan University of Science and Technology (HAUST#2021-9-22), and the management and experimental procedures of the experiment animals were conducted in strict accordance with the guidelines of the Guide to Animal Welfare in China.

Informed Consent Statement

Not applicable.

Data Availability Statement

All data from this study are included in Supplementary Materials.

Acknowledgments

The authors are grateful to the College of Animal Science and Technology, Henan University of Science and Technology, for the use of experimental facilities and to the technicians in the sheep breeding farm for the technical support of measured morphometric traits.

Conflicts of Interest

The authors declare that they have no competing financial interest.

References

  1. Gebreselassie, G.; Berihulay, H.; Jiang, L.; Ma, Y. Review on genomic regions and candidate genes associated with economically important production and reproduction traits in sheep (Ovies aries). Animals 2020, 10, 33. [Google Scholar] [CrossRef]
  2. Ren, T.; Zhang, Z.; Fu, R.; Yang, Y.; Li, W.; Liang, J.; Mo, G.; Luo, W.; Zhang, X. A 51 bp indel polymorphism within the PTH1R gene is significantly associated with chicken growth and carcass traits. Anim. Genet. 2020, 51, 568–578. [Google Scholar] [CrossRef] [PubMed]
  3. Chen, P.; Zhao, H.; Wu, M.; He, S.; Yuan, T.; Yi, X.; Liu, S.; Pan, Y.; Li, Q.; Wang, S.; et al. A novel 17 bp InDel polymorphism within the PPARGC1A gene is significantly associated with growth traits in sheep. Anim. Biotechnol. 2022, 33, 312–320. [Google Scholar] [CrossRef] [PubMed]
  4. Li, W.Y.; Liu, Y.; Gao, C.F.; Lan, X.Y.; Wu, X.F. A novel duplicated insertion/deletion (InDel) of the CPT1a gene and its effects on growth traits in goat. Anim. Biotechnol. 2021, 32, 343–351. [Google Scholar] [CrossRef]
  5. Li, J.; Zhang, S.; Shen, C.; Niu, Z.; Yang, H.; Zhang, K.; Liu, Z.; Wang, Y.; Lan, X. Indel mutations within the bovine HSD17B3 gene are significantly associated with ovary morphological traits and mature follicle number. J. Steroid Biochem. Mol. Biol. 2021, 209, 105833. [Google Scholar] [CrossRef]
  6. Frayling, T.M.; Timpson, N.J.; Weedon, M.N.; Zeggini, E.; Freathy, R.M.; Lindgren, C.M.; Perry, J.R.; Elliott, K.S.; Lango, H.; Rayner, N.W.; et al. A common variant in the FTO gene is associated with body mass index and predisposes to childhood and adult obesity. Science 2007, 316, 889–894. [Google Scholar] [CrossRef] [PubMed]
  7. Jevsinek Skok, D.; Kunej, T.; Kovac, M.; Malovrh, S.; Potocnik, K.; Petric, N.; Zgur, S.; Dovc, P.; Horvat, S. FTO gene variants are associated with growth and carcass traits in cattle. Anim. Genet. 2016, 47, 219–222. [Google Scholar] [CrossRef]
  8. Zhao, Y.; Zhang, D.; Zhang, X.; Li, F.; Xu, D.; Zhao, L.; Li, X.; Zhang, Y.; Wang, J.; Yang, X.; et al. Expression features of the ovine FTO gene and association between FTO polymorphism and tail fat deposition related-traits in Hu sheep. Gene 2022, 826, 146451. [Google Scholar] [CrossRef]
  9. Wang, S.; Liu, S.; Yuan, T.; Sun, X. Genetic effects of FTO gene insertion/deletion (InDel) on fat-tail measurements and growth traits in Tong sheep. Anim. Biotechnol. 2021, 32, 229–239. [Google Scholar] [CrossRef]
  10. Bialesova, L.; Kulyté, A.; Petrus, P.; Sinha, I.; Laurencikiene, J.; Zhao, C.; Wright, K.D.; Arner, P.; Dahlman, I. Epigenetic regulation of PLIN 1 in obese women and its relation to lipolysis. Sci. Rep. 2017, 7, 10152. [Google Scholar] [CrossRef]
  11. Zhang, H.L.; Fan, H.J.; Liu, X.L.; Wu, Y.; Hou, S.S. Molecular cloning of the perilipin gene and its association with carcass and fat traits in Chinese ducks. Genet. Mol. Res. 2013, 12, 1582–1592. [Google Scholar] [CrossRef] [PubMed]
  12. Gol, S.; Ros-Freixedes, R.; Zambonelli, P.; Tor, M.; Pena, R.N.; Braglia, S.; Zappaterra, M.; Estany, J.; Davoli, R. Relationship between perilipin genes polymorphisms and growth, carcass and meat quality traits in pigs. J. Anim. Breed. Genet. 2016, 133, 24–30. [Google Scholar] [CrossRef]
  13. Zappaterra, M.; Mazzoni, M.; Zambonelli, P.; Davoli, R. Investigation of the Perilipin 5 gene expression and association study of its sequence polymorphism with meat and carcass quality traits in different pig breeds. Animal 2018, 12, 1135–1143. [Google Scholar] [CrossRef] [PubMed]
  14. Raza, S.H.A.; Shijun, L.; Khan, R.; Schreurs, N.M.; Manzari, Z.; Abd El-Aziz, A.H.; Ullah, I.; Kaster, N.; Shah, M.A.; Zan, L. Polymorphism of the PLIN1 gene and its association with body measures and ultrasound carcass traits in Qinchuan beef cattle. Genome 2020, 63, 483–492. [Google Scholar] [CrossRef] [PubMed]
  15. Gilbert, R.P.; Bailey, D.R.; Shannon, N.H. Body dimensions and carcass measurements of cattle selected for postweaning gain fed two different diets. J. Anim. Sci. 1993, 71, 1688–1698. [Google Scholar] [CrossRef]
  16. Yeh, F.C.; Boyle, T. Population genetic analysis of codominant and dominant markers and quantitative traits. Belg. J. Bot. 1997, 129, 157. [Google Scholar]
  17. Shi, Y.Y.; He, L. SHEsis, a powerful software platform for analyses of linkage disequilibrium, haplotype construction, and genetic association at polymorphism loci. Cell Res. 2005, 15, 97–98. [Google Scholar] [CrossRef]
  18. Barrett, J.C.; Fry, B.; Maller, J.; Daly, M.J. Haploview: Analysis and visualization of LD and haplotype maps. Bioinformatics 2005, 21, 263–265. [Google Scholar] [CrossRef]
  19. Gong, X.; Chen, P.; Ma, P.; Gao, J.; Yang, J.; Guo, H.; Yan, C.; Zhang, B.; He, Y. MICA polymorphisms associated with antithyroid drug-induced agranulocytosis in the Chinese Han population. Immun. Inflamm. Dis. 2020, 8, 695–703. [Google Scholar] [CrossRef]
  20. Loos, R.J.; Bouchard, C. FTO: The first gene contributing to common forms of human obesity. Obes. Rev. 2008, 9, 246–250. [Google Scholar] [CrossRef]
  21. Olszewski, P.K.; Fredriksson, R.; Olszewska, A.M.; Stephansson, O.; Alsiö, J.; Radomska, K.J.; Levine, A.S.; Schiöth, H.B. Hypothalamic FTO is associated with the regulation of energy intake not feeding reward. BMC Neurosci. 2009, 10, 129. [Google Scholar] [CrossRef] [PubMed]
  22. Gerken, T.; Girard, C.A.; Tung, Y.C.; Webby, C.J.; Saudek, V.; Hewitson, K.S.; Yeo, G.S.; McDonough, M.A.; Cunliffe, S.; McNeill, L.A.; et al. The obesity-associated FTO gene encodes a 2-oxoglutarate-dependent nucleic acid demethylase. Science 2007, 318, 1469–1472. [Google Scholar] [CrossRef] [PubMed]
  23. Brasaemle, D.L.; Subramanian, V.; Garcia, A.; Marcinkiewicz, A.; Rothenberg, A. Perilipin A and the control of triacylglycerol metabolism. Mol. Cell. Biochem. 2009, 326, 15–21. [Google Scholar] [CrossRef] [PubMed]
  24. Wu, M.; Zhao, H.; Tang, X.; Li, Q.; Yi, X.; Liu, S.; Sun, X. Novel InDels of GHR, GHRH, GHRHR and their association with growth traits in seven Chinese sheep breeds. Animals 2020, 10, 1883. [Google Scholar] [CrossRef] [PubMed]
  25. Yang, X.; Xian, Y.; Li, Z.; Wang, Z.; Nie, Q. G0S2 Gene polymorphism and its relationship with carcass traits in chicken. Animals 2022, 12, 916. [Google Scholar] [CrossRef]
  26. Sun, X.; Liang, Y.; Gao, Q.; Guo, J.; Tang, C.; Shi, K.; Yang, Z.; Mao, Y. AGPAT3 Gene polymorphisms are associated with milk production traits in Chinese Holstein cows. J. Dairy Res. 2021, 88, 247–252. [Google Scholar] [CrossRef]
  27. Huang, Y.; Su, P.; Akhatayeva, Z.; Pan, C.; Zhang, Q.; Lan, X. Novel InDel variations of the Cry2 gene are associated with litter size in Australian White sheep. Theriogenology 2022, 179, 155–161. [Google Scholar] [CrossRef]
  28. Liu, L.; Cui, Z.; Xiao, Q.; Zhang, H.; Zhao, X.; Wang, Y.; Yin, H.; Li, D.; Zhu, Q. Polymorphisms in the chicken growth differentiation factor 9 gene associated with reproductive traits. Biomed Res. Int. 2018, 2018, 9345473. [Google Scholar] [CrossRef]
  29. Khan, R.; Raza, S.H.A.; Guo, H.; Xiaoyu, W.; Sen, W.; Suhail, S.M.; Rahman, A.; Ullah, I.; Abd El-Aziz, A.H.; Manzari, Z.; et al. Genetic variants in the TORC2 gene promoter and their association with body measurement and carcass quality traits in Qinchuan cattle. PLoS ONE 2020, 15, e0227254. [Google Scholar] [CrossRef]
  30. Lin, X.; Li, B.; Chen, Y.; Chen, H.; Liu, M. KAT2B Gene Polymorphisms Are Associated with Body Measure Traits in Four Chinese Cattle Breeds. Animals 2022, 12, 1954. [Google Scholar] [CrossRef]
Figure 1. Electrophoresis pattern and sequence maps of six InDels in the FTO and PLIN1 genes.
Animals 13 03032 g001
Figure 2. The number of genotypes and frequencies of allelotypes in the FTO and PLIN1 genes. (A) The number of genotypes in the FTO and PLIN1 genes of Hu sheep. (B) Frequency of allelotypes in the FTO and PLIN1 genes of Hu sheep. (C) The number of genotypes in the FTO and PLIN1 genes of Dupor sheep. (D) Frequency of allelotypes in the FTO and PLIN1 genes of Dupor sheep. (E) The number of genotypes in the FTO and PLIN1 genes of Small Tail Han sheep. (F) Frequency of allelotypes in the FTO and PLIN1 genes of Small Tail Han sheep.
Animals 13 03032 g002
Figure 3. Linkage analysis of five InDels of FTO in three populations. (A) D’ analysis of three sheep breeds in five FTO InDels; (B) r2 analysis of three sheep breeds in five FTO InDels.
Animals 13 03032 g003
Table 1. Sampling source information of three sheep breeds in this study.
BreedAbbreviationSampling SourceNumberSample Tissue
HuHSLuoyang city192Venous blood
DuporDSLuoyang city86Venous blood
Small Tail HanSTHSPuyang city96Venous blood
Table 2. Primer information, product size, and InDel sizes of the sheep FTO and PLIN1 genes. F for forward primer, R for reverse primer.
GenePrimer Sequence (5′-3′)Product Size (bp)InDel Sizes (bp)
FTO-1F: TAAGTTTACTAAGCCGAGGAGC
R: TTTAGTCTGTATTTTGGGAGGA
26037
FTO-2F: TTATTGGAGTTTATTGGAGTTAC
R: GTCTGTGAGCCTATTTCTGTC
28020
FTO-3F: CCACAACTCAGCAGCTACCAGT
R: CTCAGCAATCATCAGCATCAGG
32641
FTO-4F: AAGGAGGTAAAGGAGAAAACT
R: TACAGCAAAATGAATCTGACA
28724
FTO-5F: CCAAGGAGAAAGCTGCTGTAGTC
R: GGATTTCAAAGAGATTTCACCGTTG
26020
FTO-6F: CCATCCCATCCCACCCTGTA
R: GCTGCCTTGCGGACCTTT
20821
FTO-7F: CTGCATGTGCCTCGAGTCTT
R: GGTCAGAGAGTTGGTGTCATGG
22524
FTO-8F: TCTTCACGGTTCATGGTAGGC
R: CACTAGTGGGAATGAAGGGGAC
31648
FTO-9F: TGTGGAATTCATTCTTGTCGCT
R: AGGGAGAGATGCTAAGGTCCA
30415
FTO-10F: TGGGACAGTACAGTCTTGTGTT
R: TCTGGATCAACCTCCACTGTT
34241
PLIN1F: GCAGCAGGTAGGAAGGATGG
R: TCACTGACAACGTGGTGGAC
23826
Table 3. Allele frequencies and estimates of population parameters for InDels in the FTO and PLIN1 genes.
BreedNameLociAllele FrequencyGenetic ParameterHWE (P)
IDHoHePICNe
HSFTO-2
(P2-Del-20 bp)
NC_056067.1 Chr:14
g.21559232-g.21559251
0.5680.4320.5090.4910.3701.9640.009
FTO-3
(P3-Ins-41 bp)
NC_056067.1 Chr:14
g.21606666-g.21606667
0.2840.7160.5930.4070.3241.6850.381
FTO-4
(P4-Ins-24 bp)
NC_056067.1 Chr:14
g.21837228-g.21837229
0.4320.5680.5090.4910.3701.9640.000
FTO-5
(P5-Del-20 bp)
NC_056067.1 Chr:14
g.21716705-g.21716724
0.4900.5100.5000.5000.3751.9990.568
FTO-6
(P6-Ins-21 bp)
NC_056067.1 Chr:14
g.21845609-g.21845629
0.9140.0860.8430.1570.1451.1860.000
PLIN1
(P1-Ins-26 bp)
NC_056071.1 Chr:14
g.20405892-g.20405893
0.0860.9140.8430.1570.1451.1860.193
DSFTO-2
(P2-Del-20 bp)
NC_056067.1 Chr:14
g.21559232-g.21559251
0.4770.5230.5010.4990.3741.9960.000
FTO-3
(P3-Ins-41 bp)
NC_056067.1 Chr:14
g.21606666-g.21606667
0.3140.6860.5690.4310.3381.7570.078
FTO-4
(P4-Ins-24 bp)
NC_056067.1 Chr:14
g.21837228-g.21837229
0.6510.3490.5460.4540.3511.8331.000
FTO-5
(P5-Del-20 bp)
NC_056067.1 Chr:14
g.21716705-g.21716724
0.4650.5350.5020.4980.3741.9900.545
FTO-6
(P6-Ins-21 bp)
NC_056067.1 Chr:14
g.21845609-g.21845629
0.8600.1400.7600.2400.2111.3160.037
PLIN1
(P1-Ins-26 bp)
NC_056071.1 Chr:14
g.20405892-g.20405893
0.0930.9070.8310.1690.1551.2030.342
STHSFTO-2
(P2-Del-20 bp)
NC_056067.1 Chr:14
g.21559232-g.21559251
0.4220.5780.5120.4880.3691.9520.033
FTO-3
(P3-Ins-41 bp)
NC_056067.1 Chr:14
g.21606666-g.21606667
0.3590.6410.5400.4600.3541.8530.132
FTO-4
(P4-Ins-24 bp)
NC_056067.1 Chr:14
g.21837228-g.21837229
0.5780.4220.5120.4880.3691.9521.000
FTO-5
(P5-Del-20 bp)
NC_056067.1 Chr:14
g.21716705-g.21716724
0.7030.2970.5830.4170.3301.7170.001
FTO-6
(P6-Ins-21 bp)
NC_056067.1 Chr:14
g.21845609-g.21845629
0.8280.1720.7150.2850.2441.3980.906
PLIN1
(P1-Ins-26 bp)
NC_056071.1 Chr:14
g.20405892-g.20405893
0.1410.8590.7580.2420.2121.3190.352
Notes: STHS, Small Tail Han sheep; HS, Hu sheep; DS, Dupor; I, insertion; D, deletion; Ho, homozygosity; He, heterozygosity; PIC, polymorphism information content; Ne, effective allele numbers; HWE, Hardy–Weinberg equilibrium.
Table 4. Association of InDels in the FTO and PLIN1 genes with growth traits.
LociBreedsGrowth Traits (cm)Observed Genotypes (Mean ± SE)ANOVA
p Values
Unadjusted p ValuesAdjusted
p Values
IIIDDD
FTO-2HS ramCannon circumference7.005 ± 0.168 ab7.331 ± 0.112 a6.480 ± 0.237 bp = 0.007p = 0.008p = 0.003
HS eweBody height67.359 ± 0.814 b68.369 ± 0.607 ab71.059 ± 1.362 ap = 0.041p = 0.037p = 0.012
STHSChest width33.750 ± 1.548 a26.895 ± 1.095 b27.333 ± 1.481 abp = 0.033p = 0.031p = 0.010
STHSCannon circumference11.500 ± 0.646 a9.579 ± 0.289 b9.222 ± 0.465 bp = 0.020p = 0.021p = 0.007
STHSHead length23.750 ± 1.250 a19.368 ± 0.693 b20.778 ± 0.722 abp = 0.022p = 0.022p = 0.007
STHSCoccyx length28.500 ± 2.102 a22.632 ± 0.714 b22.222 ± 1.064 bp = 0.007p = 0.008p = 0.003
FTO-3HS ramBody height54.714 ± 1.149 b58.647 ± 0.529 a58.049 ± 0.571 abp = 0.024p = 0.019p = 0.006
HS eweBody height72.750 ± 2.105 a69.663 ± 0.613 a66.982 ± 0.673 bp = 0.002p = 0.013p = 0.004
HS eweBack height72.167 ± 1.493 a69.643 ± 0.625 a67.364 ± 0.656 bp = 0.008p = 0.039p = 0.013
HS eweChest width26.333 ± 3.451 a22.000 ± 0.747 ab20.200 ± 0.583 bp = 0.010p = 0.016p = 0.005
HS eweChest depth38.333 ± 1.542 a35.490 ± 0.548 ab33.836 ± 0.510 bp = 0.007p = 0.021p = 0.007
DSChest width20.700 ± 2.382 b26.433 ± 0.543 a24.659 ± 0.751 abp = 0.006p = 0.005p = 0.002
STHSChest width29.667 ± 2.963 ab25.765 ± 1.006 b30.417 ± 1.417 ap = 0.030p = 0.032p = 0.011
FTO-5DSBody weight57.780 ± 1.053 a52.935 ± 1.042 b53.873 ± 1.598 abp = 0.039p = 0.037p = 0.012
STHSBody height64.000 ± 2.457 b74.056 ± 2.337 a69.200 ± 4.042 abp = 0.043p = 0.042p = 0.014
PLIN1DSBody weight57.631 ± 1.013 a53.594 ± 0.874 bp = 0.040
STHSCoccyx length26.143 ± 1.682 a22.583 ± 0.645 bp = 0.039
STHSForehead width15.000 ± 0.787 a12.521 ± 0.382 bp = 0.008
Notes: HS ram, Hu sheep ram; HS ewe, Hu sheep ewe; STHS, Small Tail Han sheep; DS, Dupor; SE, standard error; II, insertion/insertion; ID, insertion/deletion; DD, deletion/deletion. a,b Mean values with unlike letters were significantly different, p < 0.05. Bonferroni multiple comparisons were performed only if there was a difference in variance analysis.
Disclaimer/Publisher’s Note: The statements, opinions and data contained in all publications are solely those of the individual author(s) and contributor(s) and not of MDPI and/or the editor(s). MDPI and/or the editor(s) disclaim responsibility for any injury to people or property resulting from any ideas, methods, instructions or products referred to in the content.

