
Fecal Concentrations of Long-Chain Fatty Acids, Sterols, and Unconjugated Bile Acids in Cats with Chronic Enteropathy
 ,
,  , , , ,
Abstract
:Simple Summary
Abstract
1. Introduction
2. Materials and Methods
2.1. Sample Population
2.2. Quantification of Fecal Long-Chain Fatty Acids, Sterols, and Unconjugated Bile Acids
2.2.1. Chemicals and Reagents
2.2.2. Stock Solutions and Calibration Standards
2.2.3. Sample Preparation
2.2.4. Chromatographic System
3. Results
3.1. Study Population
Statistical Analysis
3.2. Fecal Concentrations of Long-Chain Fatty Acids, Sterols, and Unconjugated Bile Acids
3.3. Validation of Gas Chromatography with Mass Spectrometry
4. Discussion
5. Conclusions
Supplementary Materials
Author Contributions
Funding
Institutional Review Board Statement
Informed Consent Statement
Data Availability Statement
Conflicts of Interest
References
- Jergens, A.E.; Crandell, J.; Evans, R.; Ackermann, M.; Miles, K.G.; Wang, C. A clinical index for disease activity in cats with chronic enteropathy. J. Vet. Intern. Med. 2010, 24, 1027–1033. [Google Scholar] [CrossRef]
- Suchodolski, J.S.; Foster, M.L.; Sohail, M.U.; Leutenegger, C.; Queen, E.V.; Steiner, J.M.; Marks, S.L. The fecal microbiome in cats with diarrhea. PLoS ONE 2015, 10, e0127378. [Google Scholar] [CrossRef]
- Marsilio, S.; Pilla, R.; Sarawichitr, B.; Chow, B.; Hill, S.L.; Ackermann, M.R.; Estep, J.S.; Lidbury, J.A.; Steiner, J.M.; Suchodolski, J.S. Characterization of the fecal microbiome in cats with inflammatory bowel disease or alimentary small cell lymphoma. Sci. Rep. 2019, 9, 19208. [Google Scholar] [CrossRef] [PubMed]
- Sung, C.H.; Marsilio, S.; Chow, B.; Zornow, K.A.; Slovak, J.E.; Pilla, R.; Lidbury, J.A.; Steiner, J.M.; Park, S.Y.; Hong, M.P.; et al. Dysbiosis index to evaluate the fecal microbiota in healthy cats and cats with chronic enteropathies. J. Feline Med. Surg. 2022, 24, e1–e12. [Google Scholar] [CrossRef] [PubMed]
- Janeczko, S.; Atwater, D.; Bogel, E.; Greiter-Wilke, A.; Gerold, A.; Baumgart, M.; Bender, H.; McDonough, P.L.; McDonough, S.P.; Goldstein, R.E.; et al. The relationship of mucosal bacteria to duodenal histopathology, cytokine mRNA, and clinical disease activity in cats with inflammatory bowel disease. Vet. Microbiol. 2008, 128, 178–193. [Google Scholar] [CrossRef] [PubMed]
- Inness, V.L.; McCartney, A.L.; Khoo, C.; Gross, K.L.; Gibson, G.R. Molecular characterisation of the gut microflora of healthy and inflammatory bowel disease cats using fluorescence in situ hybridisation with special reference to Desulfovibrio spp. J. Anim. Physiol. Anim. Nutr. 2007, 91, 48–53. [Google Scholar] [CrossRef] [PubMed]
- Marsilio, S.; Chow, B.; Hill, S.L.; Ackermann, M.R.; Estep, J.S.; Sarawichitr, B.; Pilla, R.; Lidbury, J.A.; Steiner, J.M.; Suchodolski, J.S. Untargeted metabolomic analysis in cats with naturally occurring inflammatory bowel disease and alimentary small cell lymphoma. Sci. Rep. 2021, 11, 9198. [Google Scholar] [CrossRef]
- Aw, W.; Fukuda, S. An Integrated Outlook on the Metagenome and Metabolome of Intestinal Diseases. Diseases 2015, 3, 341–359. [Google Scholar] [CrossRef]
- Sinha, R.; Ahn, J.; Sampson, J.N.; Shi, J.; Yu, G.; Xiong, X.; Hayes, R.B.; Goedert, J.J. Fecal microbiota, fecal metabolome, and colorectal cancer interrelations. PLoS ONE 2016, 11, e0152126. [Google Scholar] [CrossRef] [PubMed]
- Minamoto, Y.; Otoni, C.C.; Steelman, S.M.; Büyükleblebici, O.; Steiner, J.M.; Jergens, A.E.; Suchodolski, J.S. Alteration of the fecal microbiota and serum metabolite profiles in dogs with idiopathic inflammatory bowel disease. Gut Microbes 2015, 6, 33–47. [Google Scholar] [CrossRef]
- Zhu, S.; Zhang, J.; Jiang, X.; Wang, W.; Chen, Y.Q. Free fatty acid receptor 4 deletion attenuates colitis by modulating Treg Cells via ZBED6-IL33 pathway. EBioMedicine 2022, 80, 104060. [Google Scholar] [CrossRef]
- Oh, D.Y.; Talukdar, S.; Bae, E.J.; Imamura, T.; Morinaga, H.; Fan, W.; Li, P.; Lu, W.J.; Watkins, S.M.; Olefsky, J.M. GPR120 is an omega-3 fatty acid receptor mediating potent anti-inflammatory and insulin-sensitizing effects. Cell 2010, 142, 687–698. [Google Scholar] [CrossRef] [PubMed]
- Itoh, Y.; Kawamata, Y.; Harada, M.; Kobayashi, M.; Fujii, R.; Fukusumi, S.; Ogi, K.; Hosoya, M.; Tanaka, Y.; Uejima, H.; et al. Free fatty acids regulate insulin secretion from pancreatic beta cells through GPR40. Nature 2003, 422, 173–176. [Google Scholar] [CrossRef] [PubMed]
- Souza, P.R.; Walker, M.E.; Goulding, N.J.; Dalli, J.; Perretti, M.; Norling, L.V. The gpr40 agonist gw9508 enhances neutrophil function to aid bacterial clearance during E. coli infections. Front. Immunol. 2020, 11, 573019. [Google Scholar] [CrossRef]
- Lefebvre, P.; Cariou, B.; Lien, F.; Kuipers, F.; Staels, B. Role of bile acids and bile acid receptors in metabolic regulation. Physiol. Rev. 2009, 89, 147–191. [Google Scholar] [CrossRef]
- Chiang, J.Y. Bile acid metabolism and signaling. Compr. Physiol. 2013, 3, 1191–1212. [Google Scholar] [PubMed]
- Rentschler, L.A.; Hirschberger, L.L.; Stipanuk, M. Response of the kitten to dietary taurine depletion: Effects on renal reabsorption, bile acid conjugation and activities of enzymes involved in taurine synthesis. Comp. Biochem. 1986, 84, 319–325. [Google Scholar] [CrossRef]
- Vital, M.; Rud, T.; Rath, S.; Pieper, D.H.; Schlüter, D. Diversity of bacteria exhibiting bile acid-inducible 7α-dehydroxylation genes in the human gut. Comput. Struct. Biotechnol. J. 2019, 17, 1016–1019. [Google Scholar] [CrossRef]
- Ward, J.B.; Lajczak, N.K.; Kelly, O.B.; O’Dwyer, A.M.; Giddam, A.K.; Ní Gabhann, J.; Franco, P.; Tambuwala, M.M.; Jefferies, C.A.; Keely, S. Ursodeoxycholic acid and lithocholic acid exert anti-inflammatory actions in the colon. Am. J. Physiol.-Gastrointest. Liver Physiol. 2017, 312, G550–G558. [Google Scholar] [CrossRef]
- Kang, J.D.; Myers, C.J.; Harris, S.C.; Kakiyama, G.; Lee, I.-K.; Yun, B.-S.; Matsuzaki, K.; Furukawa, M.; Min, H.-K.; Bajaj, J.S. Bile acid 7α-dehydroxylating gut bacteria secrete antibiotics that inhibit Clostridium difficile: Role of secondary bile acids. Cell. Chem. Biol. 2019, 26, 27–34.e24. [Google Scholar] [CrossRef]
- Weingarden, A.R.; Dosa, P.I.; DeWinter, E.; Steer, C.J.; Shaughnessy, M.K.; Johnson, J.R.; Khoruts, A.; Sadowsky, M.J. Changes in colonic bile acid composition following fecal microbiota transplantation are sufficient to control Clostridium difficile germination and growth. PLoS ONE 2016, 11, e0147210. [Google Scholar] [CrossRef] [PubMed]
- Ma, C.; Vasu, R.; Zhang, H. The role of long-chain fatty acids in inflammatory bowel disease. Mediat. Inflamm. 2019, 2019, 8495913. [Google Scholar] [CrossRef] [PubMed]
- Song, E.M.; Byeon, J.S.; Lee, S.M.; Yoo, H.J.; Kim, S.J.; Lee, S.H.; Chang, K.; Hwang, S.W.; Yang, D.H.; Jeong, J.Y. Fecal fatty acid profiling as a potential new screening biomarker in patients with colorectal cancer. Dig. Dis. Sci. 2018, 63, 1229–1236. [Google Scholar] [CrossRef] [PubMed]
- Blake, A.B.; Guard, B.C.; Honneffer, J.B.; Lidbury, J.A.; Steiner, J.M.; Suchodolski, J.S. Altered microbiota, fecal lactate, and fecal bile acids in dogs with gastrointestinal disease. PLoS ONE 2019, 14, e0224454. [Google Scholar] [CrossRef] [PubMed]
- Zornow, K.A.; Slovak, J.E.; Lidbury, J.A.; Suchodolski, J.S.; Steiner, J.M. Fecal S100A12 concentrations in cats with chronic enteropathies. J. Feline Med. Surg. 2023, 25, 1098612X231164273. [Google Scholar] [CrossRef]
- Keller, S.; Jahreis, G. Determination of underivatised sterols and bile acid trimethyl silyl ether methyl esters by gas chromatography–mass spectrometry–single ion monitoring in faeces. J. Chromatogr. B 2004, 813, 199–207. [Google Scholar] [CrossRef] [PubMed]
- Batta, A.K.; Salen, G.; Batta, P.; Tint, G.S.; Alberts, D.S.; Earnest, D.L. Simultaneous quantitation of fatty acids, sterols and bile acids in human stool by capillary gas–liquid chromatography. J. Chromatogr. B 2002, 775, 153–161. [Google Scholar] [CrossRef]
- Filimoniuk, A.; Daniluk, U.; Samczuk, P.; Wasilewska, N.; Jakimiec, P.; Kucharska, M.; Lebensztejn, D.M.; Ciborowski, M. Metabolomic profiling in children with inflammatory bowel disease. Adv. Med. Sci. 2020, 65, 65–70. [Google Scholar] [CrossRef]
- Antharam, V.C.; McEwen, D.C.; Garrett, T.J.; Dossey, A.T.; Li, E.C.; Kozlov, A.N.; Mesbah, Z.; Wang, G.P. An integrated metabolomic and microbiome analysis identified specific gut microbiota associated with fecal cholesterol and coprostanol in Clostridium difficile infection. PLoS ONE 2016, 11, e0148824. [Google Scholar] [CrossRef] [PubMed]
- Wang, T.Y.; Liu, M.; Portincasa, P.; Wang, D.Q.H. New insights into the molecular mechanism of intestinal fatty acid absorption. Eur. J. Clin. Investig. 2013, 43, 1203–1223. [Google Scholar] [CrossRef]
- Calder, P.C. Long chain fatty acids and gene expression in inflammation and immunity. Curr. Opin. Clin. Nutr. Metab. Care 2013, 16, 425–433. [Google Scholar] [CrossRef]
- Perreault, M.; Zulyniak, M.A.; Badoud, F.; Stephenson, S.; Badawi, A.; Buchholz, A.; Mutch, D.M. A distinct fatty acid profile underlies the reduced inflammatory state of metabolically healthy obese individuals. PLoS ONE 2014, 9, e88539. [Google Scholar] [CrossRef] [PubMed]
- Almendingen, K.; Hostmark, A.T.; Larsen, L.N.; Fausa, O.; Bratlie, J.; Aabakken, L. Relationship between fecal content of fatty acids and cyclooxygenase mrna expression and fatty acid composition in duodenal biopsies, serum lipoproteins, and dietary fat in colectomized familial adenomatous polyposis patients. J. Nutr. Metab. 2010, 2010, 862569. [Google Scholar] [CrossRef]
- Yuan, S.-N.; Wang, M.-X.; Han, J.-L.; Feng, C.-Y.; Wang, M.; Wang, M.; Sun, J.-Y.; Li, N.-Y.; Simal-Gandara, J.; Liu, C. Improved colonic inflammation by nervonic acid via inhibition of NF-κB signaling pathway of DSS-induced colitis mice. Phytomedicine 2023, 112, 154702. [Google Scholar] [CrossRef]
- Zhao, L.; Huang, Y.; Lu, L.; Yang, W.; Huang, T.; Lin, Z.; Lin, C.; Kwan, H.; Wong, H.L.X.; Chen, Y.; et al. Saturated long-chain fatty acid-producing bacteria contribute to enhanced colonic motility in rats. Microbiome 2018, 6, 107. [Google Scholar] [CrossRef] [PubMed]
- Guan, S.; Jia, B.; Chao, K.; Zhu, X.; Tang, J.; Li, M.; Wu, L.; Xing, L.; Liu, K.; Zhang, L. UPLC–QTOF-MS-based plasma lipidomic profiling reveals biomarkers for inflammatory bowel disease diagnosis. J. Proteome Res. 2019, 19, 600–609. [Google Scholar] [CrossRef] [PubMed]
- Walker, H.; Gow, A.; Salavati, S.; Boag, A.; Clements, D.; Ottka, C.; Lohi, H.; Handel, I.; Mellanby, R. Metabolomic serum profiling in dogs with chronic enteropathy. In Proceedings of the ECVIM-CA Online Congress, Online, 1–4 September 2021. [Google Scholar]
- Tallima, H.; El Ridi, R. Arachidonic acid: Physiological roles and potential health benefits–a review. J. Adv. Res. 2018, 11, 33–41. [Google Scholar] [CrossRef]
- Kathrani, A.; Yen, S.; Swann, J.R.; Hall, E.J. The effect of a hydrolyzed protein diet on the fecal microbiota in cats with chronic enteropathy. Sci. Rep. 2022, 12, 1–15. [Google Scholar] [CrossRef]
- Ramadan, Z.; Xu, H.; Laflamme, D.; Czarnecki-Maulden, G.; Li, Q.; Labuda, J.; Bourqui, B. Fecal microbiota of cats with naturally occurring chronic diarrhea assessed using 16s r rna gene 454-pyrosequencing before and after dietary treatment. J. Vet. Intern. Med. 2014, 28, 59–65. [Google Scholar] [CrossRef] [PubMed]
- Wang, S.; Martins, R.; Sullivan, M.C.; Friedman, E.S.; Misic, A.M.; El-Fahmawi, A.; De Martinis, E.C.P.; O’Brien, K.; Chen, Y.; Bradley, C.; et al. Diet-induced remission in chronic enteropathy is associated with altered microbial community structure and synthesis of secondary bile acids. Microbiome 2019, 7, 126. [Google Scholar] [CrossRef]
- Atherly, T.; Rossi, G.; White, R.; Seo, Y.J.; Wang, C.; Ackermann, M.; Breuer, M.; Allenspach, K.; Mochel, J.P.; Jergens, A.E. Glucocorticoid and dietary effects on mucosal microbiota in canine inflammatory bowel disease. PLoS ONE 2019, 14, e0226780. [Google Scholar] [CrossRef] [PubMed]
- Barnes, E.L.; Nestor, M.; Onyewadume, L.; de Silva, P.S.; Korzenik, J.R.; Aguilar, H.; Bailen, L.; Berman, A.; Bhaskar, S.K.; Brown, M. High dietary intake of specific fatty acids increases risk of flares in patients with ulcerative colitis in remission during treatment with aminosalicylates. Clin. Gastroenterol. Hepatol. 2017, 15, 1390–1396.e1391. [Google Scholar] [CrossRef]
- Fritsch, J.; Garces, L.; Quintero, M.A.; Pignac-Kobinger, J.; Santander, A.M.; Fernández, I.; Ban, Y.J.; Kwon, D.; Phillips, M.C.; Knight, K.; et al. Low-fat, high-fiber diet reduces markers of inflammation and dysbiosis and improves quality of life in patients with ulcerative colitis. Clin. Gastroenterol. Hepatol. 2021, 19, 1189–1199.e1130. [Google Scholar] [CrossRef]
- Hrabovský, V.; Zadak, Z.; Bláha, V.; Hyspler, R.; Karlík, T.; Martínek, A.; Mendlová, A. Cholesterol metabolism in active Crohn’s disease. Wien. Klin. Wochenschr. 2009, 121, 270–275. [Google Scholar] [CrossRef] [PubMed]
- de Jong, A.; Plat, J.; Mensink, R.P. Metabolic effects of plant sterols and stanols. J. Nutr. Biochem. 2003, 14, 362–369. [Google Scholar] [CrossRef]
- Wen, S.; He, L.; Zhong, Z.; Zhao, R.; Weng, S.; Mi, H.; Liu, F. Stigmasterol restores the balance of Treg/Th17 cells by activating the butyrate-PPARγ axis in colitis. Front. Immunol. 2021, 12, 741934. [Google Scholar] [CrossRef]
- Kim, K.A.; Lee, I.A.; Gu, W.; Hyam, S.R.; Kim, D.H. β-Sitosterol attenuates high-fat diet-induced intestinal inflammation in mice by inhibiting the binding of lipopolysaccharide to toll-like receptor 4 in the NF-κB pathway. Mol. Nutr. Food Res. 2014, 58, 963–972. [Google Scholar] [CrossRef] [PubMed]
- Reddy, B.S.; Wynder, E.L. Metabolic epidemiology of colon cancer: Fecal bile acids and neutral sterols in colon cancer patients and patients with adenomatous polyps. Cancer 1977, 39, 2533–2539. [Google Scholar] [CrossRef]
- Veiga, P.; Juste, C.; Lepercq, P.; Saunier, K.; Beguet, F.; Gerard, P. Correlation between faecal microbial community structure and cholesterol-to-coprostanol conversion in the human gut. FEMS Microbiol. Lett. 2005, 242, 81–86. [Google Scholar] [CrossRef]
- Gérard, P.; Lepercq, P.; Leclerc, M.; Gavini, F.; Raibaud, P.; Juste, C. Bacteroides sp. strain D8, the first cholesterol-reducing bacterium isolated from human feces. Appl. Environ. Microbiol. 2007, 73, 5742–5749. [Google Scholar] [CrossRef]
- Zhou, Y.; Zhi, F. Lower level of bacteroides in the gut microbiota is associated with inflammatory bowel disease: A meta-analysis. BioMed Res. Int. 2016, 2016, 5828959. [Google Scholar] [CrossRef] [PubMed]
- Jung, D.; Fantin, A.C.; Scheurer, U.; Fried, M.; Kullak-Ublick, G.A. Human ileal bile acid transporter gene ASBT (SLC10A2) is transactivated by the glucocorticoid receptor. Gut 2004, 53, 78–84. [Google Scholar] [CrossRef]
- Li, M.; Wang, Q.; Li, Y.; Cao, S.; Zhang, Y.; Wang, Z.; Liu, G.; Li, J.; Gu, B. Apical sodium-dependent bile acid transporter, drug target for bile acid related diseases and delivery target for prodrugs: Current and future challenges. Pharmacol. Ther. 2020, 212, 107539. [Google Scholar] [CrossRef] [PubMed]
- Jeffery, I.B.; Das, A.; O’Herlihy, E.; Coughlan, S.; Cisek, K.; Moore, M.; Bradley, F.; Carty, T.; Pradhan, M.; Dwibedi, C.; et al. Differences in fecal microbiomes and metabolomes of people with vs without irritable bowel syndrome and bile acid malabsorption. Gastroenterology 2020, 158, 1016–1028.e1018. [Google Scholar] [CrossRef] [PubMed]
- Ticho, A.L.; Malhotra, P.; Dudeja, P.K.; Gill, R.K.; Alrefai, W.A. Intestinal absorption of bile acids in health and disease. Compr. Physiol. 2019, 10, 21–56. [Google Scholar]
- Duboc, H.; Rajca, S.; Rainteau, D.; Benarous, D.; Maubert, M.A.; Quervain, E.; Thomas, G.; Barbu, V.; Humbert, L.; Despras, G.; et al. Connecting dysbiosis, bile-acid dysmetabolism and gut inflammation in inflammatory bowel diseases. Gut 2013, 62, 531–539. [Google Scholar] [CrossRef] [PubMed]
- Macdonald, I.; Singh, G.; Mahony, D.; Meier, C. Effect of pH on bile salt degradation by mixed fecal cultures. Steroids 1978, 32, 245–256. [Google Scholar] [CrossRef]
- Galler, A.I.; Suchodolski, J.S.; Steiner, J.M.; Sung, C.-H.; Hittmair, K.M.; Richter, B.; Burgener, I.A. Microbial dysbiosis and fecal metabolomic perturbations in Yorkshire Terriers with chronic enteropathy. Sci. Rep. 2022, 12, 12977. [Google Scholar] [CrossRef]
- Gnewuch, C.; Liebisch, G.; Langmann, T.; Dieplinger, B.; Mueller, T.; Haltmayer, M.; Dieplinger, H.; Zahn, A.; Stremmel, W.; Rogler, G. Serum bile acid profiling reflects enterohepatic detoxification state and intestinal barrier function in inflammatory bowel disease. World J. Gastroenterol. 2009, 15, 3134. [Google Scholar] [CrossRef]
- Van den Bossche, L.; Hindryckx, P.; Devisscher, L.; Devriese, S.; Van Welden, S.; Holvoet, T.; Vilchez-Vargas, R.; Vital, M.; Pieper, D.H.; Vanden Bussche, J. Ursodeoxycholic acid and its taurine-or glycine-conjugated species reduce colitogenic dysbiosis and equally suppress experimental colitis in mice. Appl. Environ. Microbiol. 2017, 83, e02766-16. [Google Scholar] [CrossRef]
- Liang, Y.; Dong, T.; Chen, M.; He, L.; Wang, T.; Liu, X.; Chang, H.; Mao, J.-H.; Hang, B.; Snijders, A.M. Systematic analysis of impact of sampling regions and storage methods on fecal gut microbiome and metabolome profiles. Msphere 2020, 5, 10–1128. [Google Scholar] [CrossRef] [PubMed]


| Variable | Healthy Control (n = 77) Median [Range] | Cats with CE (n = 56) Median [Range] | p-Value | Adjusted p-Value |
|---|---|---|---|---|
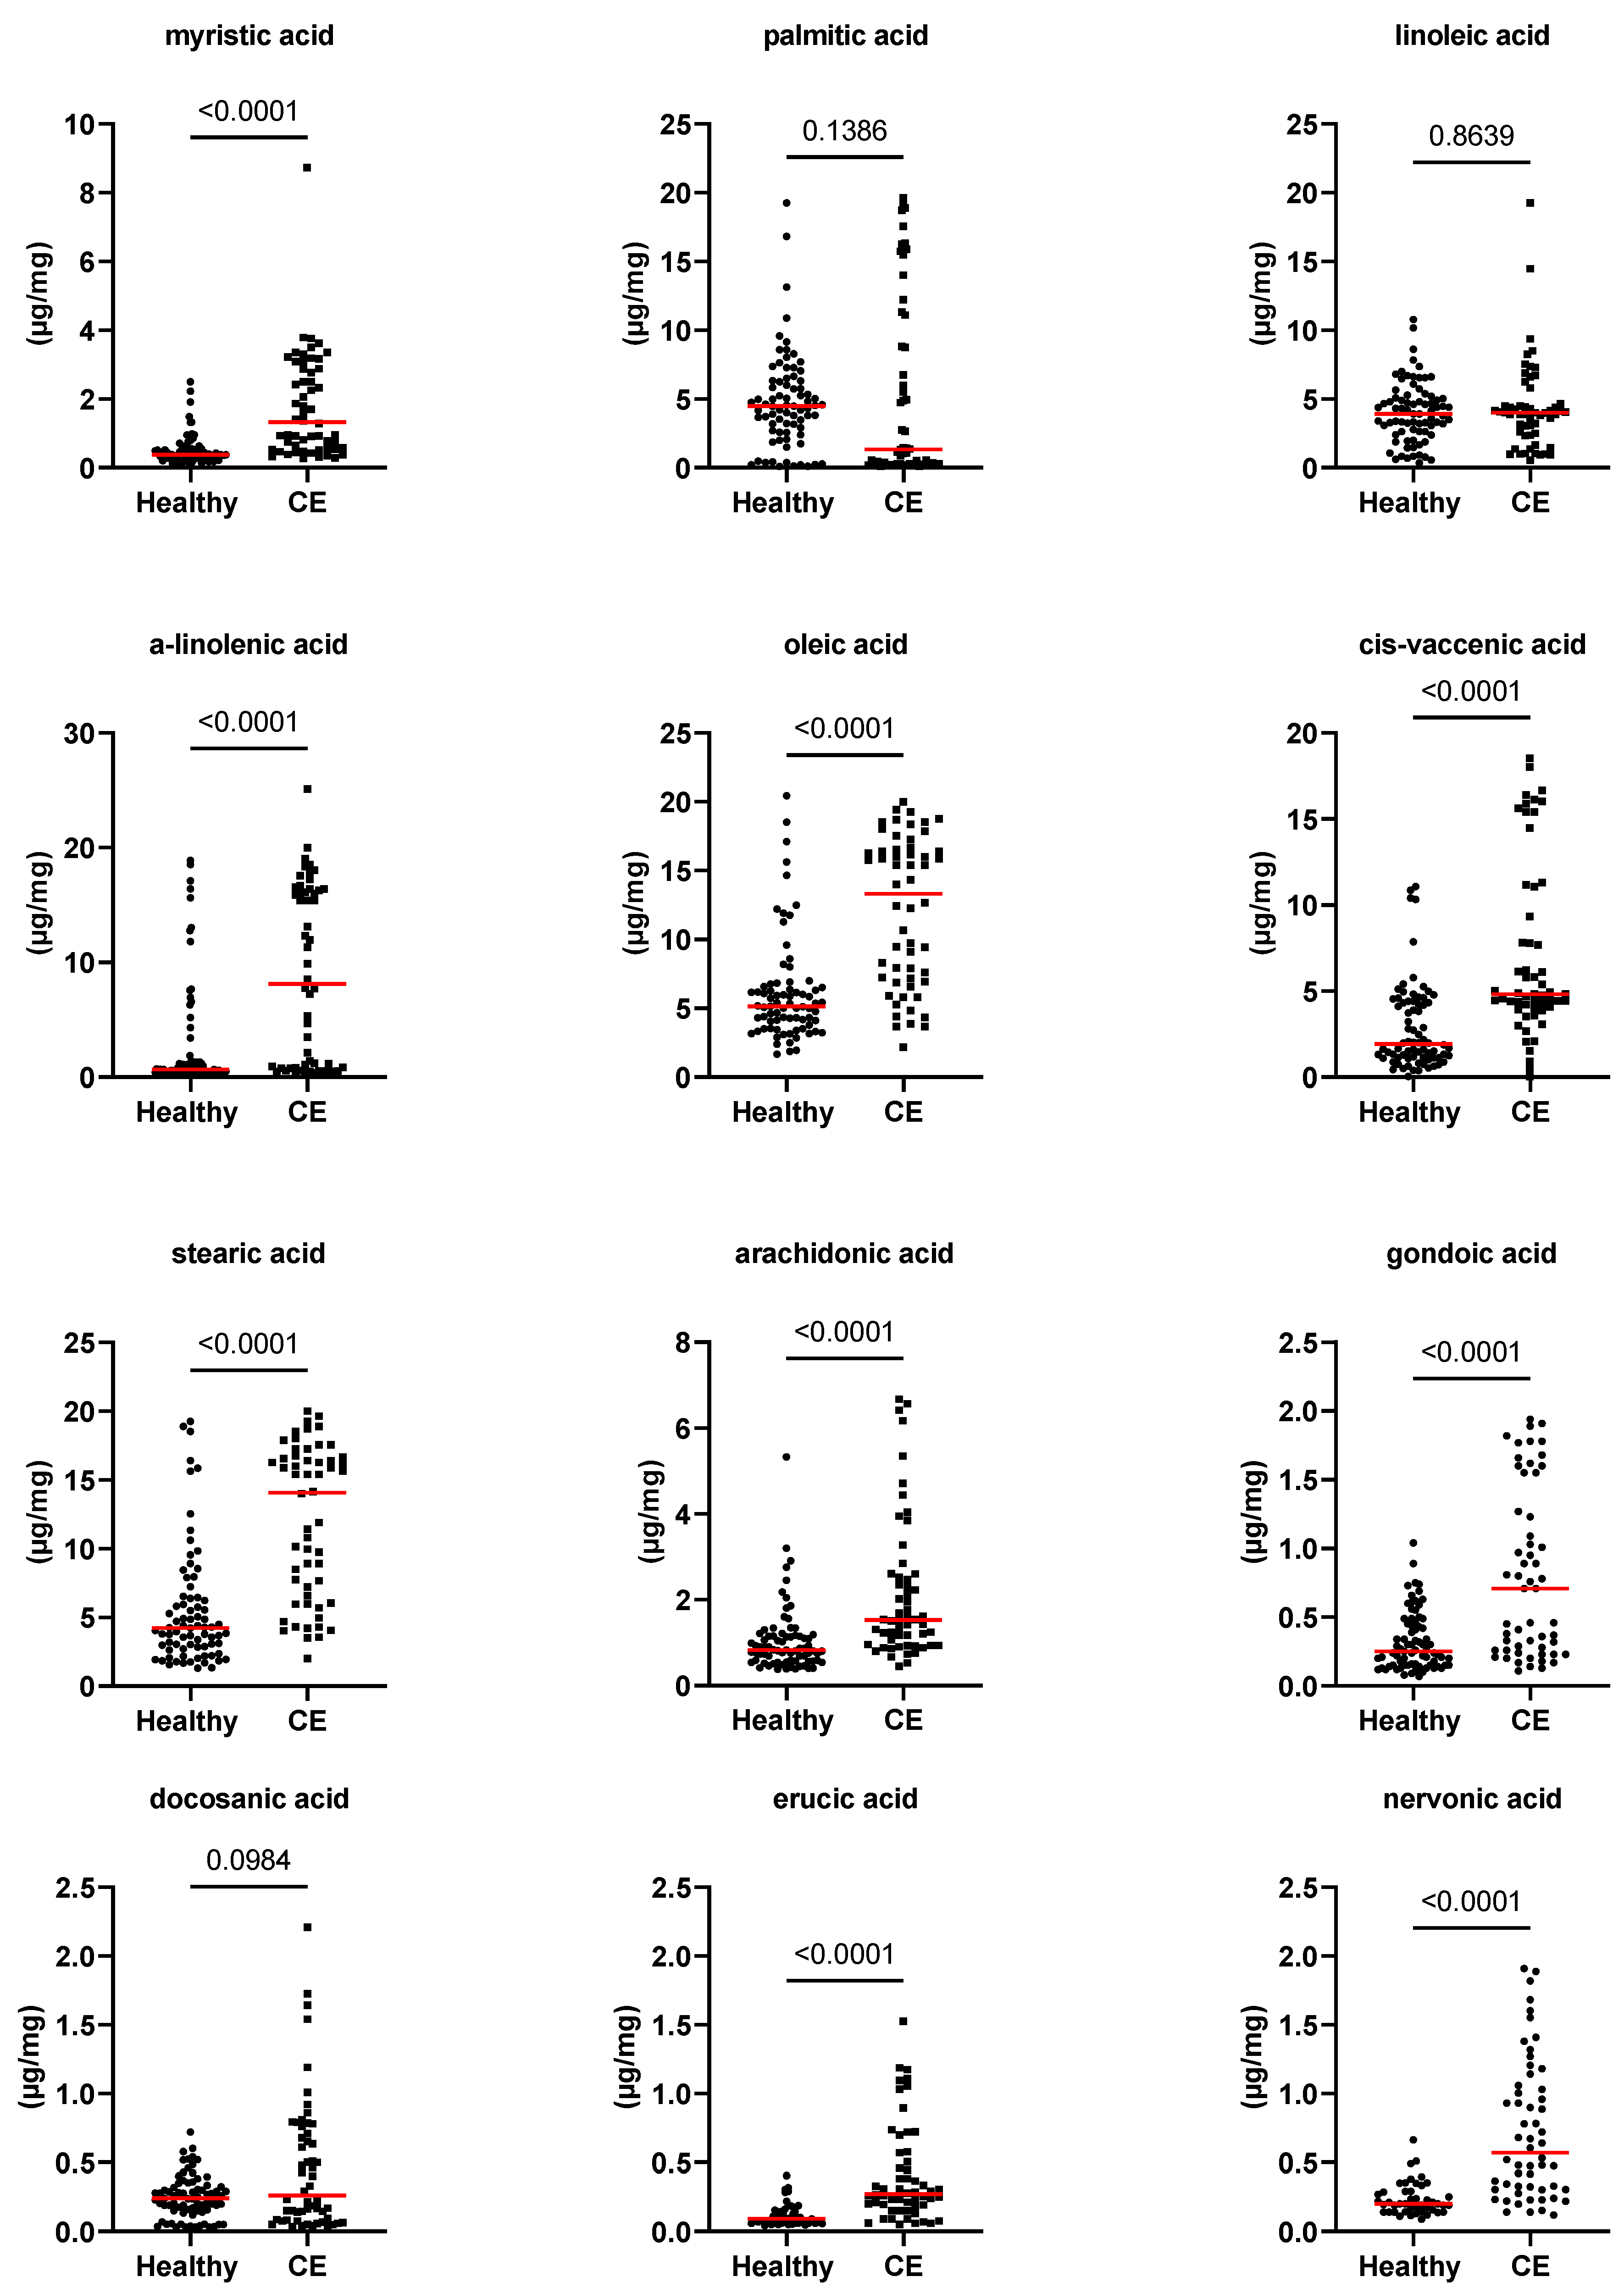
| myristic acid (µg/mg) | 0.4 [0.1–2.5] | 1.3 [0.3–8.7] | <0.0001 | 0.004 |
| palmitic acid (µg/mg) | 4.5 [0.1–19.3] | 1.3 [0.1–19.6] | 0.139 | 1.000 |
| linoleic acid (µg/mg) | 3.9 [0.4–10.8] | 4 [0.5–19.3] | 0.864 | 1.000 |
| alpha-linolenic acid (µg/mg) | 0.7 [0.2–18.9] | 8.2 [0.2–25.1] | <0.0001 | 0.004 |
| oleic acid (µg/mg) | 5.1 [1.7–20.5] | 13.3 [2.2–20] | <0.0001 | 0.004 |
| cis-vaccenic acid (µg/mg) | 2 [0–43.3] | 4.8 [0–18.5] | <0.0001 | 0.004 |
| stearic acid (µg/mg) | 4.2 [1.3–19.3] | 14.1 [2–20] | <0.0001 | 0.004 |
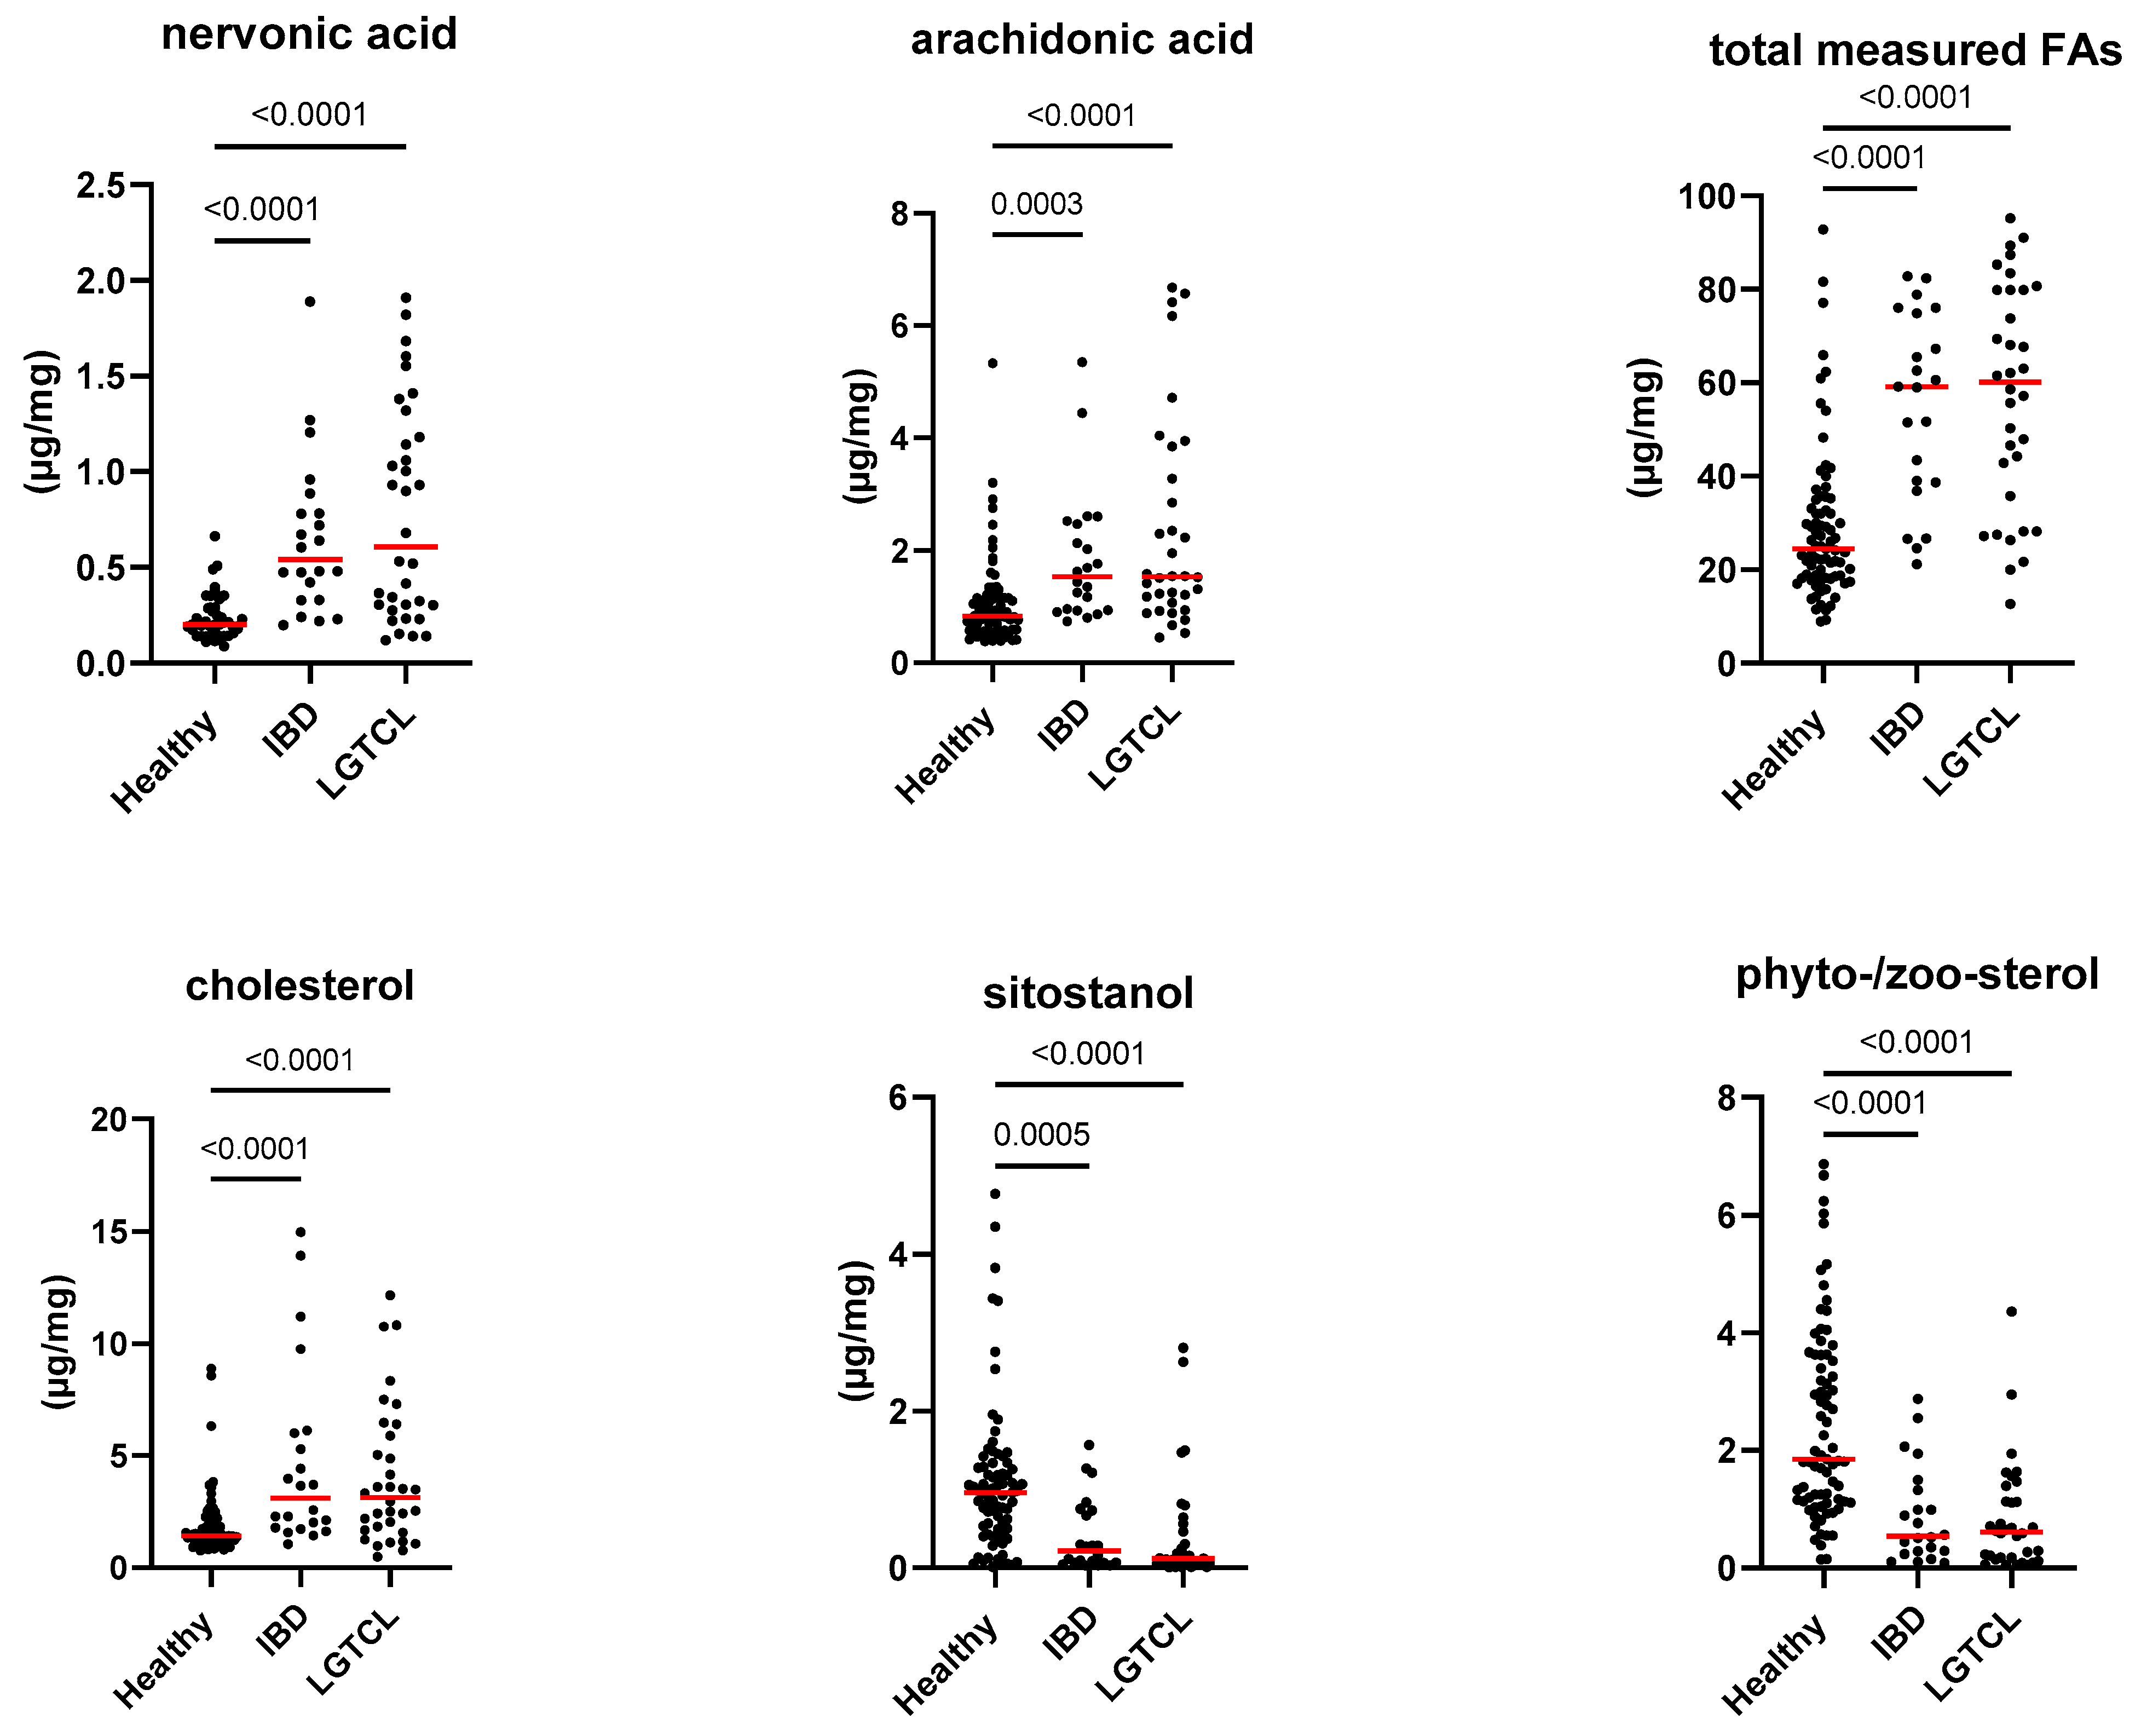
| arachidonic acid (µg/mg) | 0.8 [0.4–5.3] | 1.5 [0.5–6.7] | <0.0001 | 0.004 |
| gondoic acid (µg/mg) | 0.3 [0.1–1] | 0.7 [0.1–1.9] | <0.0001 | 0.004 |
| erucic acid (µg/mg) | 0.1 [0–0.4] | 0.3 [0.1–1.5] | <0.0001 | 0.004 |
| behenic acid (µg/mg) | 0.2 [0–0.7] | 0.3 [0–2.2] | 0.098 | 1.000 |
| nervonic acid (µg/mg) | 0.2 [0–0.7] | 0.6 [0.1–1.9] | <0.0001 | 0.004 |
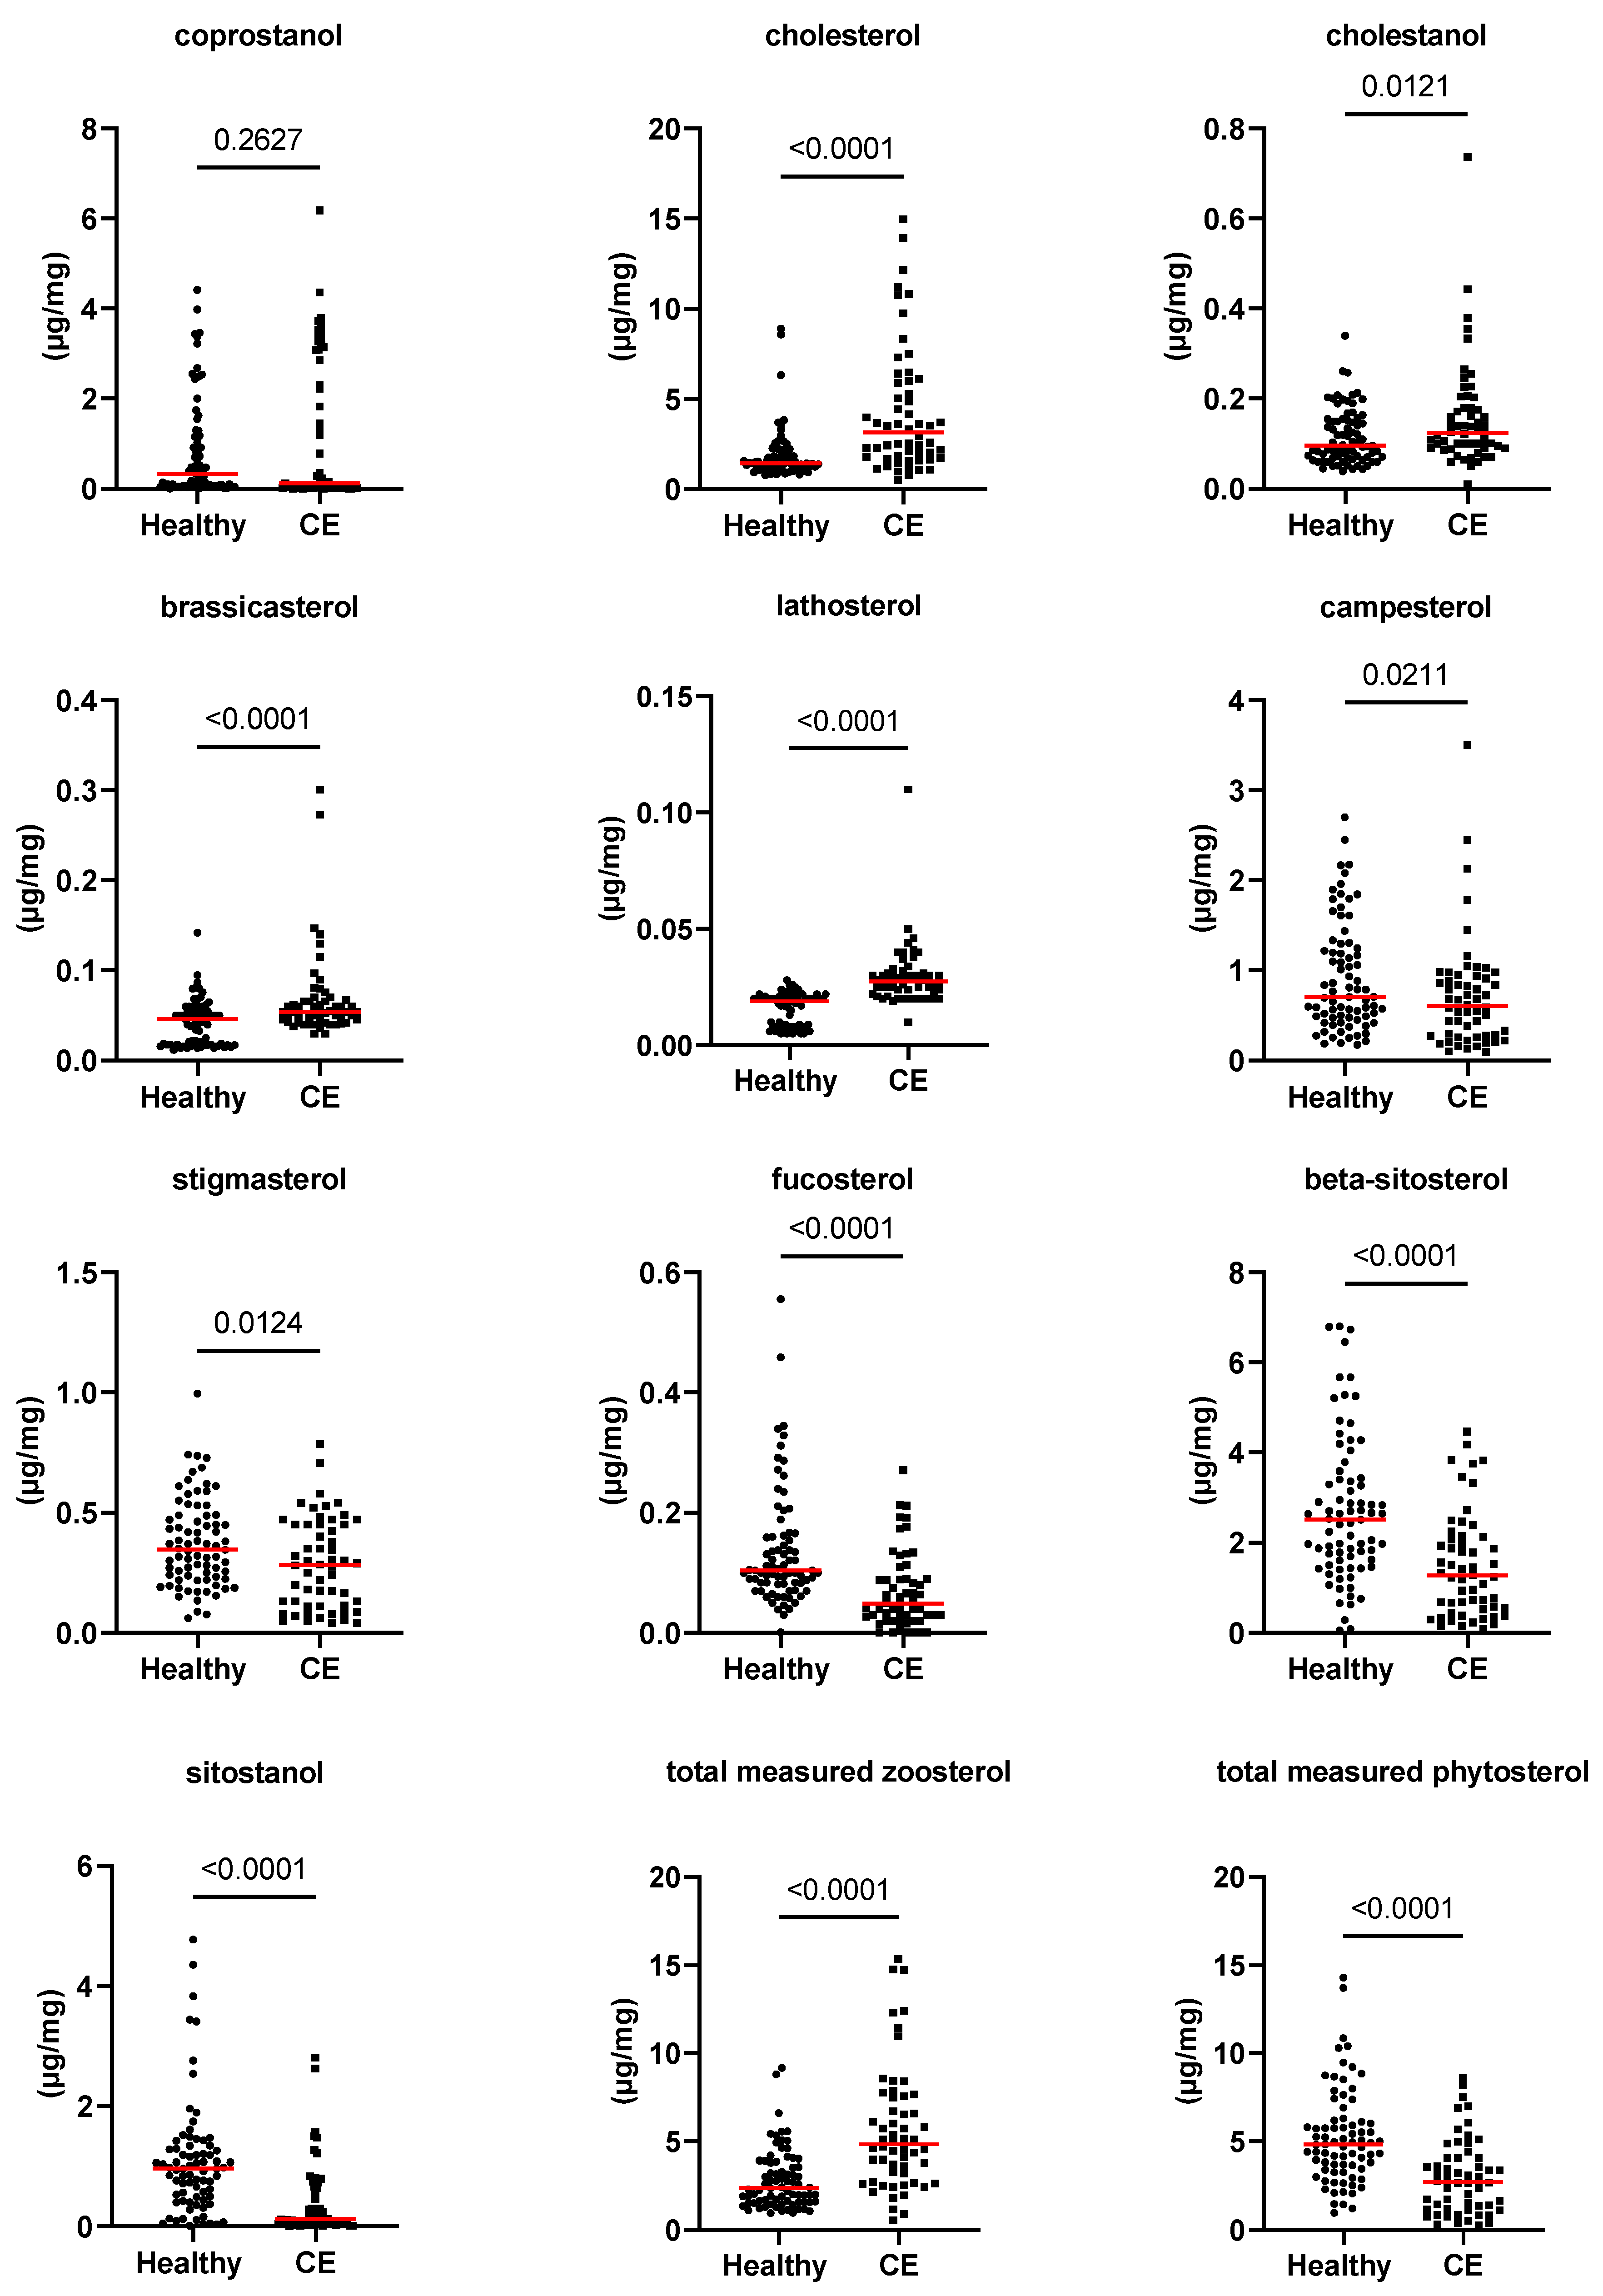
| coprostanol (Z) (µg/mg) | 0.3 [0–4.4] | 0.1 [0–6.2] | 0.263 | 1.000 |
| cholesterol (Z) (µg/mg) | 1.4 [0.8–8.9] | 3.1 [0.5–15] | <0.0001 | 0.004 |
| cholestanol (Z) (µg/mg) | 0.1 [0–0.3] | 0.1 [0–0.7] | 0.012 | 0.456 |
| brassicasterol (P) (µg/mg) | 0.05 [0.01–0.14] | 0.05 [0.03–0.3] | <0.0001 | 0.004 |
| lathosterol (Z) (µg/mg) | 0.02 [0–0.03] | 0.03 [0.01–0.11] | <0.0001 | 0.004 |
| campesterol (P) (µg/mg) | 0.7 [0.2–2.7] | 0.6 [0.1–3.5] | 0.021 | 1.000 |
| stigmasterol (P) (µg/mg) | 0.3 [0.1–1] | 0.3 [0–0.8] | 0.012 | 1.000 |
| beta-sitosterol (P) (µg/mg) | 2.5 [0–6.8] | 1.3 [0.1–4.5] | <0.0001 | 0.004 |
| fucosterol (P) (µg/mg) | 0.1 [0–0.6] | 0 [0–0.3] | <0.0001 | 0.004 |
| sitostanol (P) (µg/mg) | 1 [0–4.8] | 0.1 [0–2.8] | <0.0001 | 0.004 |
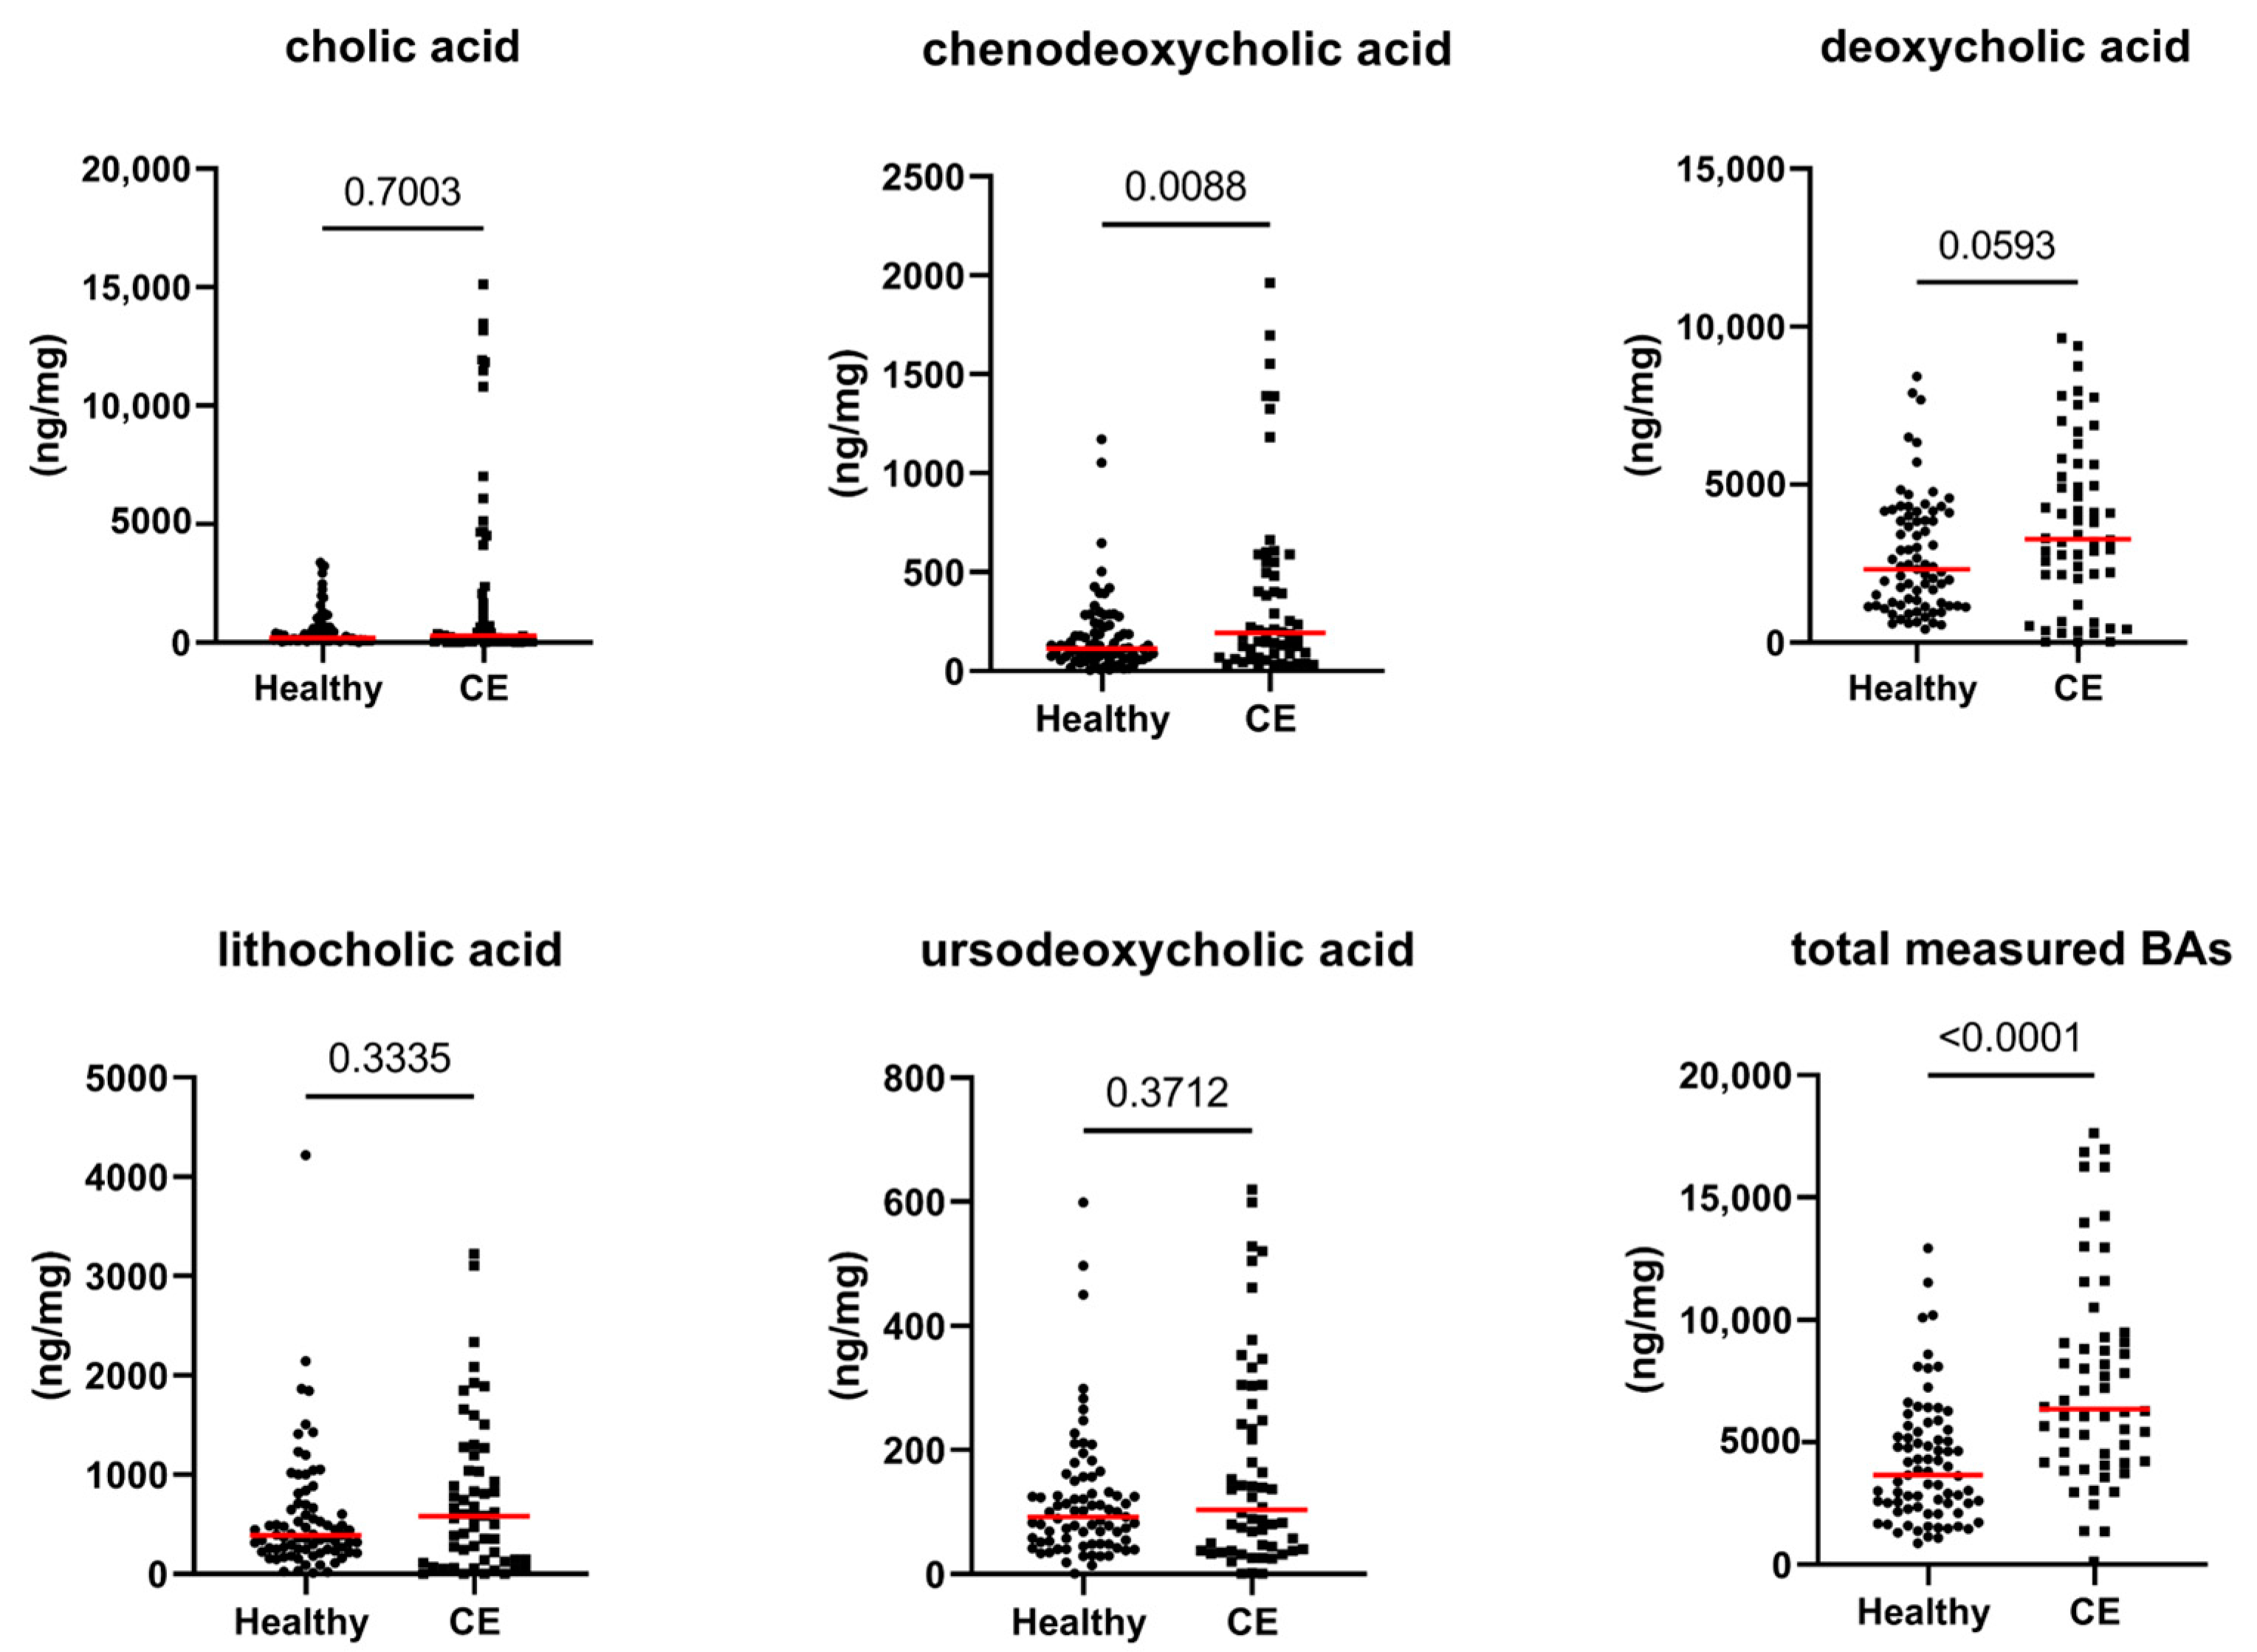
| cholic acid (ng/mg) | 197 [6–3368] | 290 [9–113] | 0.700 | 1.000 |
| chenodeoxycholic acid (ng/mg) | 113 [6–1172] | 192 [20–1961] | 0.009 | 0.342 |
| lithocholic acid (ng/mg) | 389 [11–4218] | 580 [1–3222] | 0.334 | 1.000 |
| deoxycholic acid (ng/mg) | 2315 [419–8420] | 3266 [15–9635] | 0.059 | 1.000 |
| ursodeoxycholic acid (ng/mg) | 92 [1–599] | 103 [1–619] | 0.371 | 1.000 |
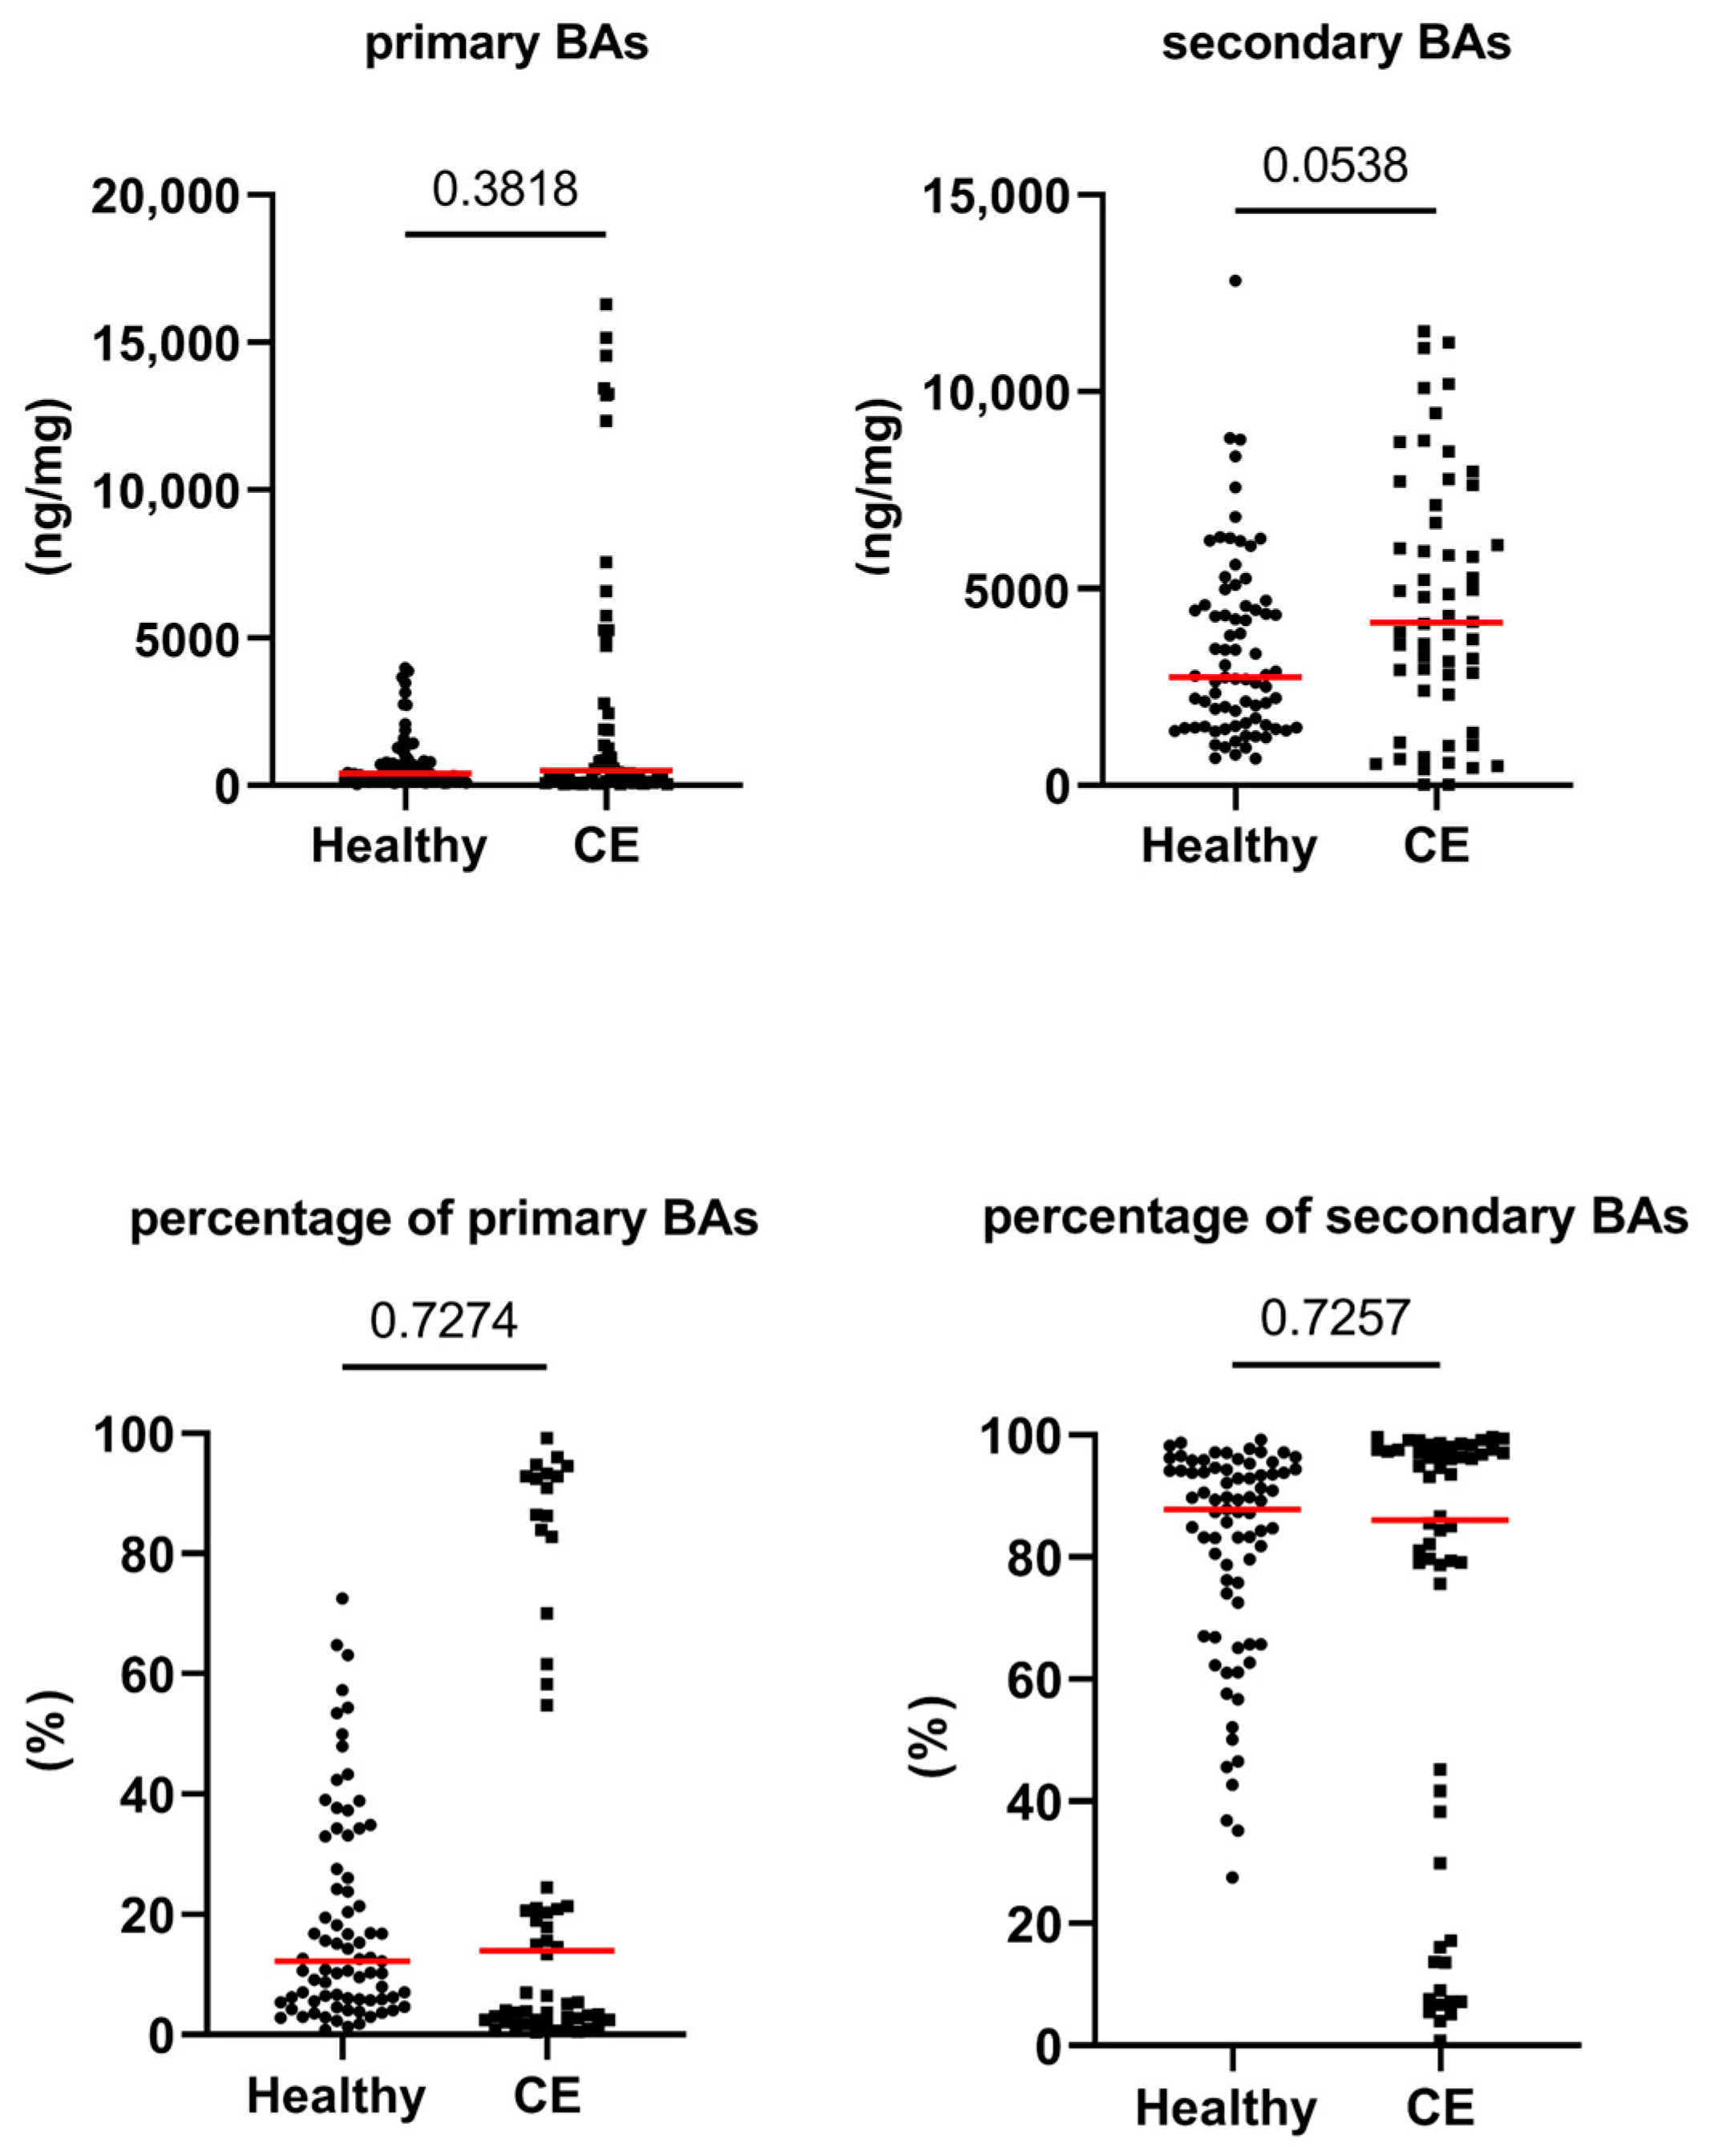
| total primary BAs (ng/mg) | 394 [35–3974] | 503 [39–16,295] | 0.382 | 1.000 |
| total secondary BAs (ng/mg) | 2740 [682–12,822] | 4136 [17–11,534] | 0.054 | 1.000 |
| total measured BAs (ng/mg) | 3664 [867–12,920] | 6353 [125–17,620] | <0.0001 | 0.004 |
| primary BAs (%) | 12 [1–73] | 14 [0–99] | 0.727 | 1.000 |
| secondary BAs (%) | 88 [27–99] | 86 [1–100] | 0.726 | 1.000 |
| total measured FAs (µg/mg) | 24 [9–93] | 59 [13–95] | <0.0001 | 0.004 |
| total measured sterols (µg/mg) | 7 [4–19] | 8 [1–23] | 0.280 | 1.000 |
| phytosterol (µg/mg) | 4.8 [1–14.3] | 2.7 [0.3–8.6] | <0.0001 | 0.004 |
| zoosterol (µg/mg) | 2.4 [1–9.2] | 4.8 [0.5–15.4] | <0.0001 | 0.004 |
| phytosterol/zoosterol | 1.8 [0.1–6.9] | 0.6 [0–4.4] | <0.0001 | 0.004 |
| cholesterol/coprostanol | 4.6 [0.2–959.2] | 26.5 [0.2–8452] | 0.0156 | 0.593 |
Disclaimer/Publisher’s Note: The statements, opinions and data contained in all publications are solely those of the individual author(s) and contributor(s) and not of MDPI and/or the editor(s). MDPI and/or the editor(s) disclaim responsibility for any injury to people or property resulting from any ideas, methods, instructions or products referred to in the content. |
© 2023 by the authors. Licensee MDPI, Basel, Switzerland. This article is an open access article distributed under the terms and conditions of the Creative Commons Attribution (CC BY) license (https://creativecommons.org/licenses/by/4.0/).
Share and Cite
Sung, C.-H.; Pilla, R.; Marsilio, S.; Chow, B.; Zornow, K.A.; Slovak, J.E.; Lidbury, J.A.; Steiner, J.M.; Hill, S.L.; Suchodolski, J.S. Fecal Concentrations of Long-Chain Fatty Acids, Sterols, and Unconjugated Bile Acids in Cats with Chronic Enteropathy. Animals 2023, 13, 2753. https://doi.org/10.3390/ani13172753
Sung C-H, Pilla R, Marsilio S, Chow B, Zornow KA, Slovak JE, Lidbury JA, Steiner JM, Hill SL, Suchodolski JS. Fecal Concentrations of Long-Chain Fatty Acids, Sterols, and Unconjugated Bile Acids in Cats with Chronic Enteropathy. Animals. 2023; 13(17):2753. https://doi.org/10.3390/ani13172753
Chicago/Turabian StyleSung, Chi-Hsuan, Rachel Pilla, Sina Marsilio, Betty Chow, Kailee A. Zornow, Jennifer E. Slovak, Jonathan A. Lidbury, Joerg M. Steiner, Steve L. Hill, and Jan S. Suchodolski. 2023. "Fecal Concentrations of Long-Chain Fatty Acids, Sterols, and Unconjugated Bile Acids in Cats with Chronic Enteropathy" Animals 13, no. 17: 2753. https://doi.org/10.3390/ani13172753
APA StyleSung, C.-H., Pilla, R., Marsilio, S., Chow, B., Zornow, K. A., Slovak, J. E., Lidbury, J. A., Steiner, J. M., Hill, S. L., & Suchodolski, J. S. (2023). Fecal Concentrations of Long-Chain Fatty Acids, Sterols, and Unconjugated Bile Acids in Cats with Chronic Enteropathy. Animals, 13(17), 2753. https://doi.org/10.3390/ani13172753