


Real-Time Monitoring of Grazing Cattle Using LORA-WAN Sensors to Improve Precision in Detecting Animal Welfare Implications via Daily Distance Walked Metrics
 , , , ,
Abstract
:Simple Summary
Abstract
1. Introduction
2. Materials and Methods
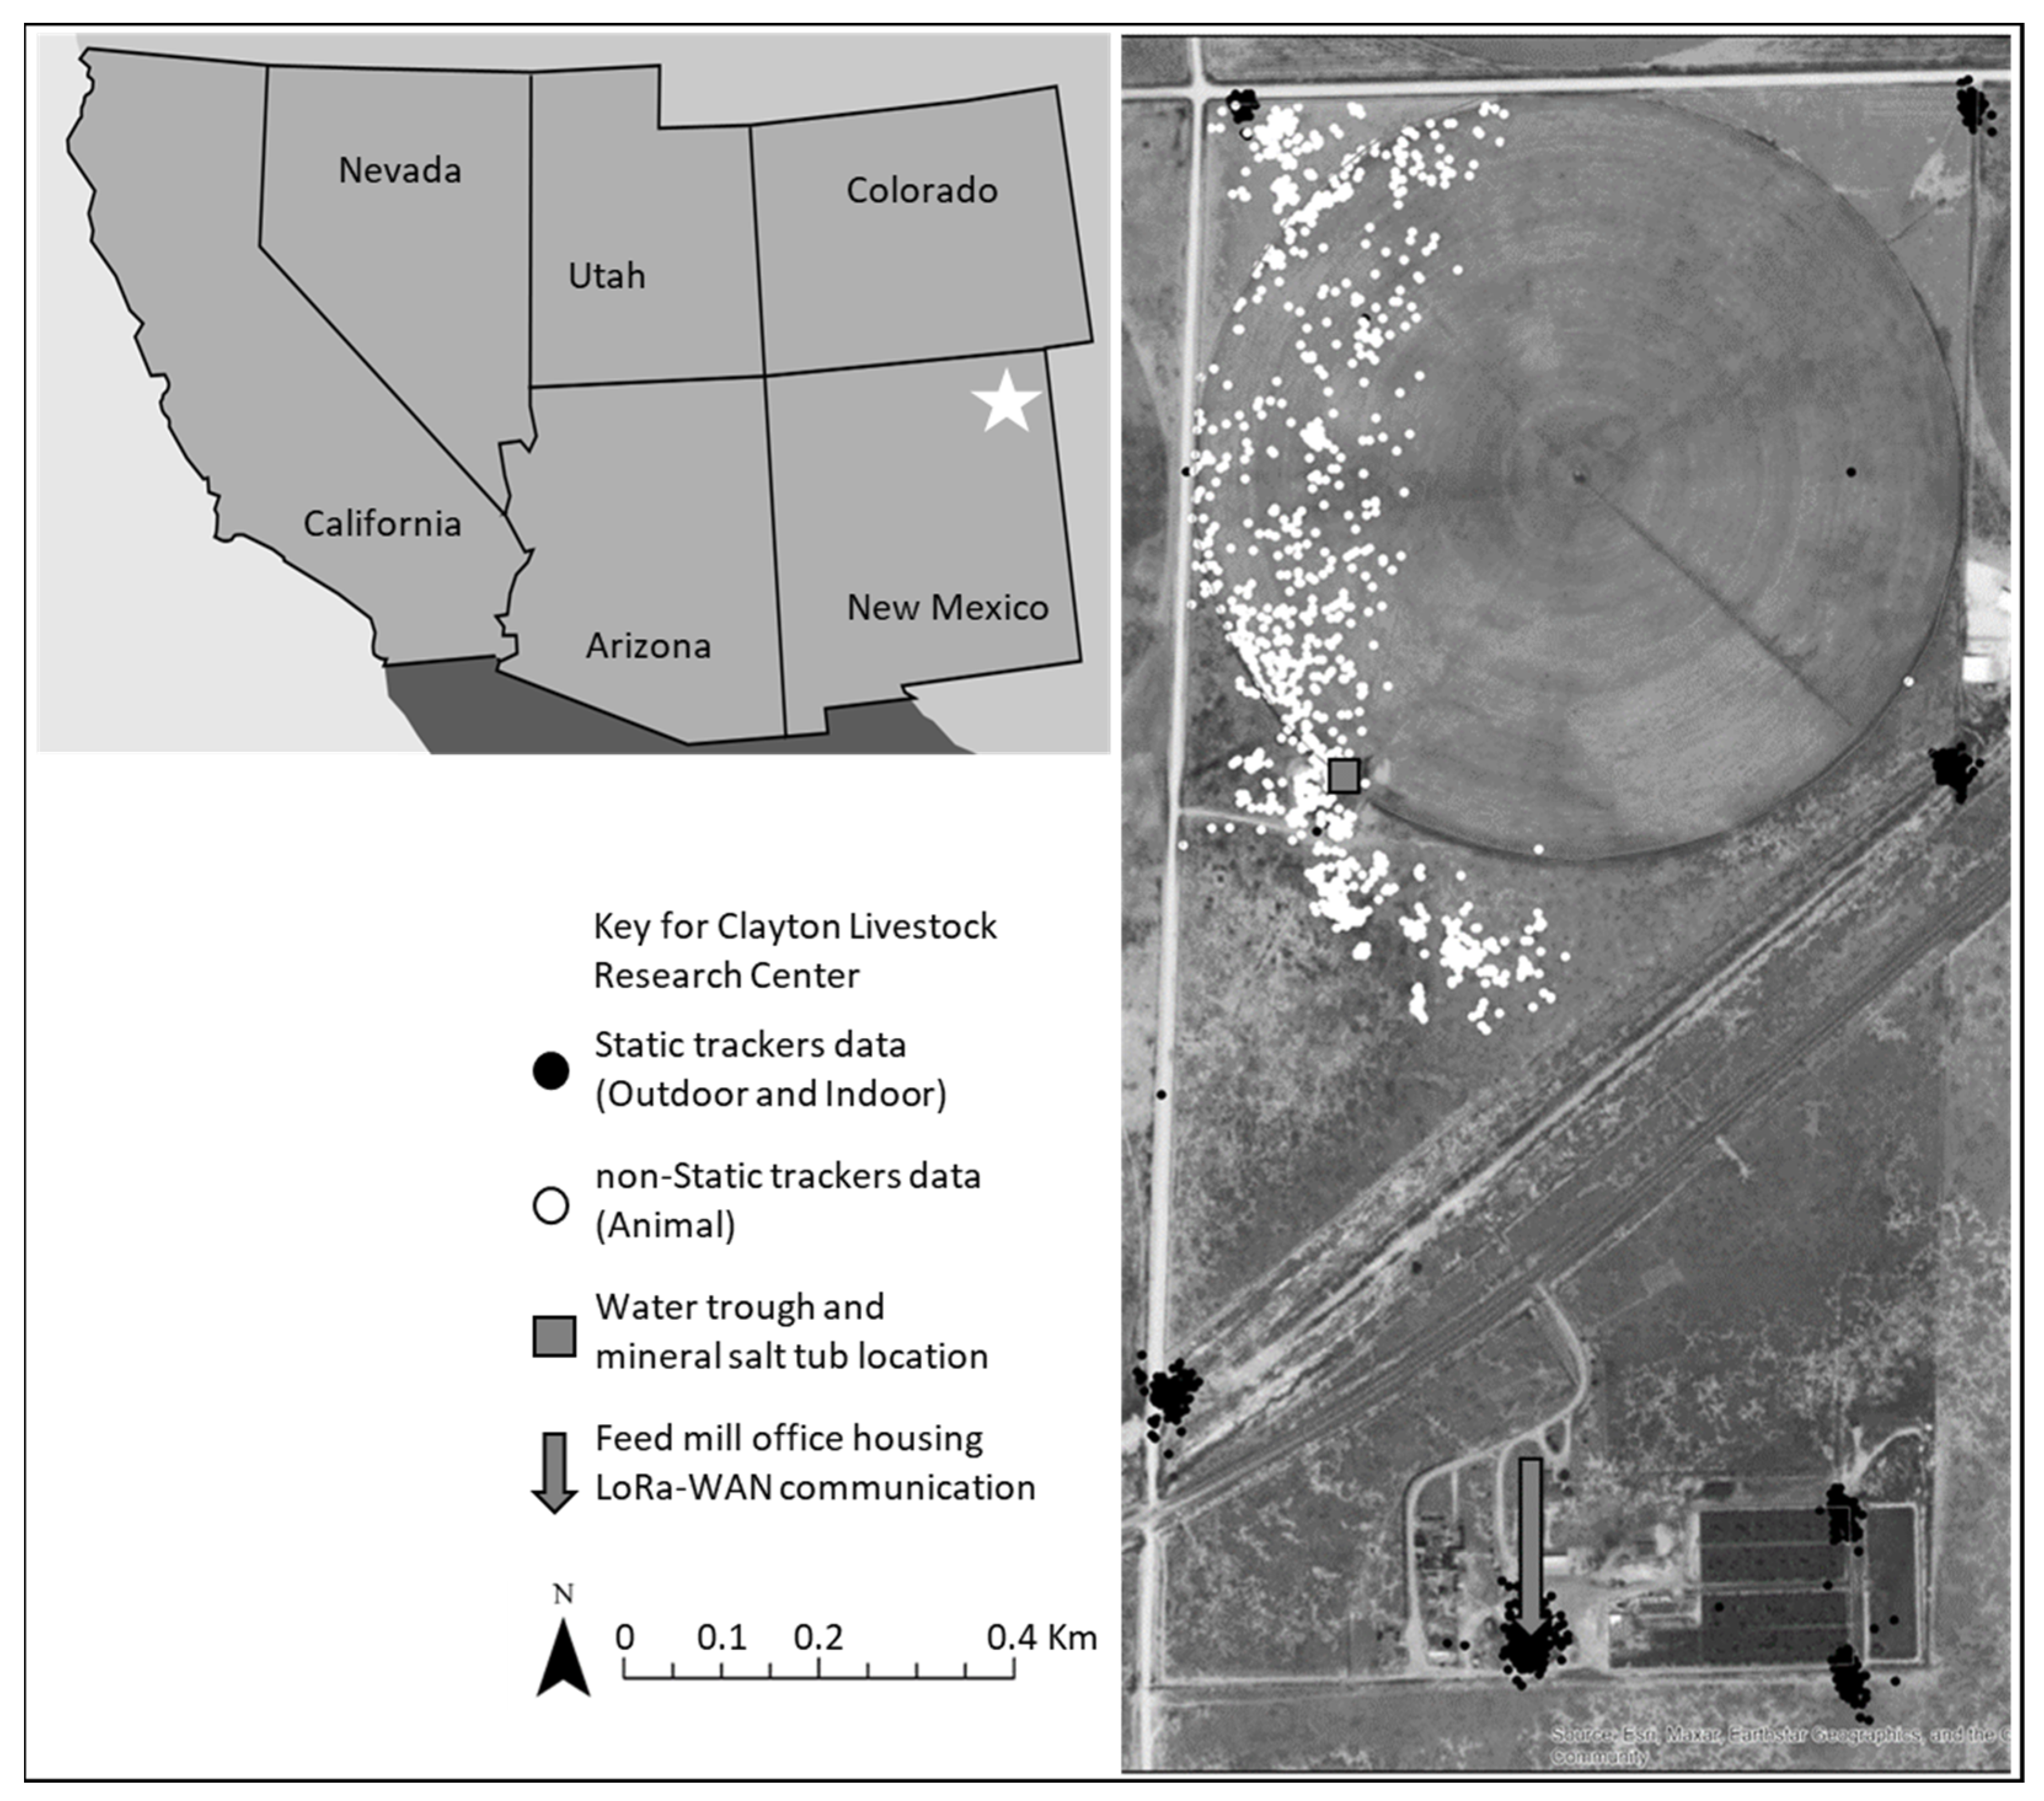
2.1. Experimental Site and LoRa Trackers Configuration
2.2. Study Deployment, Animals
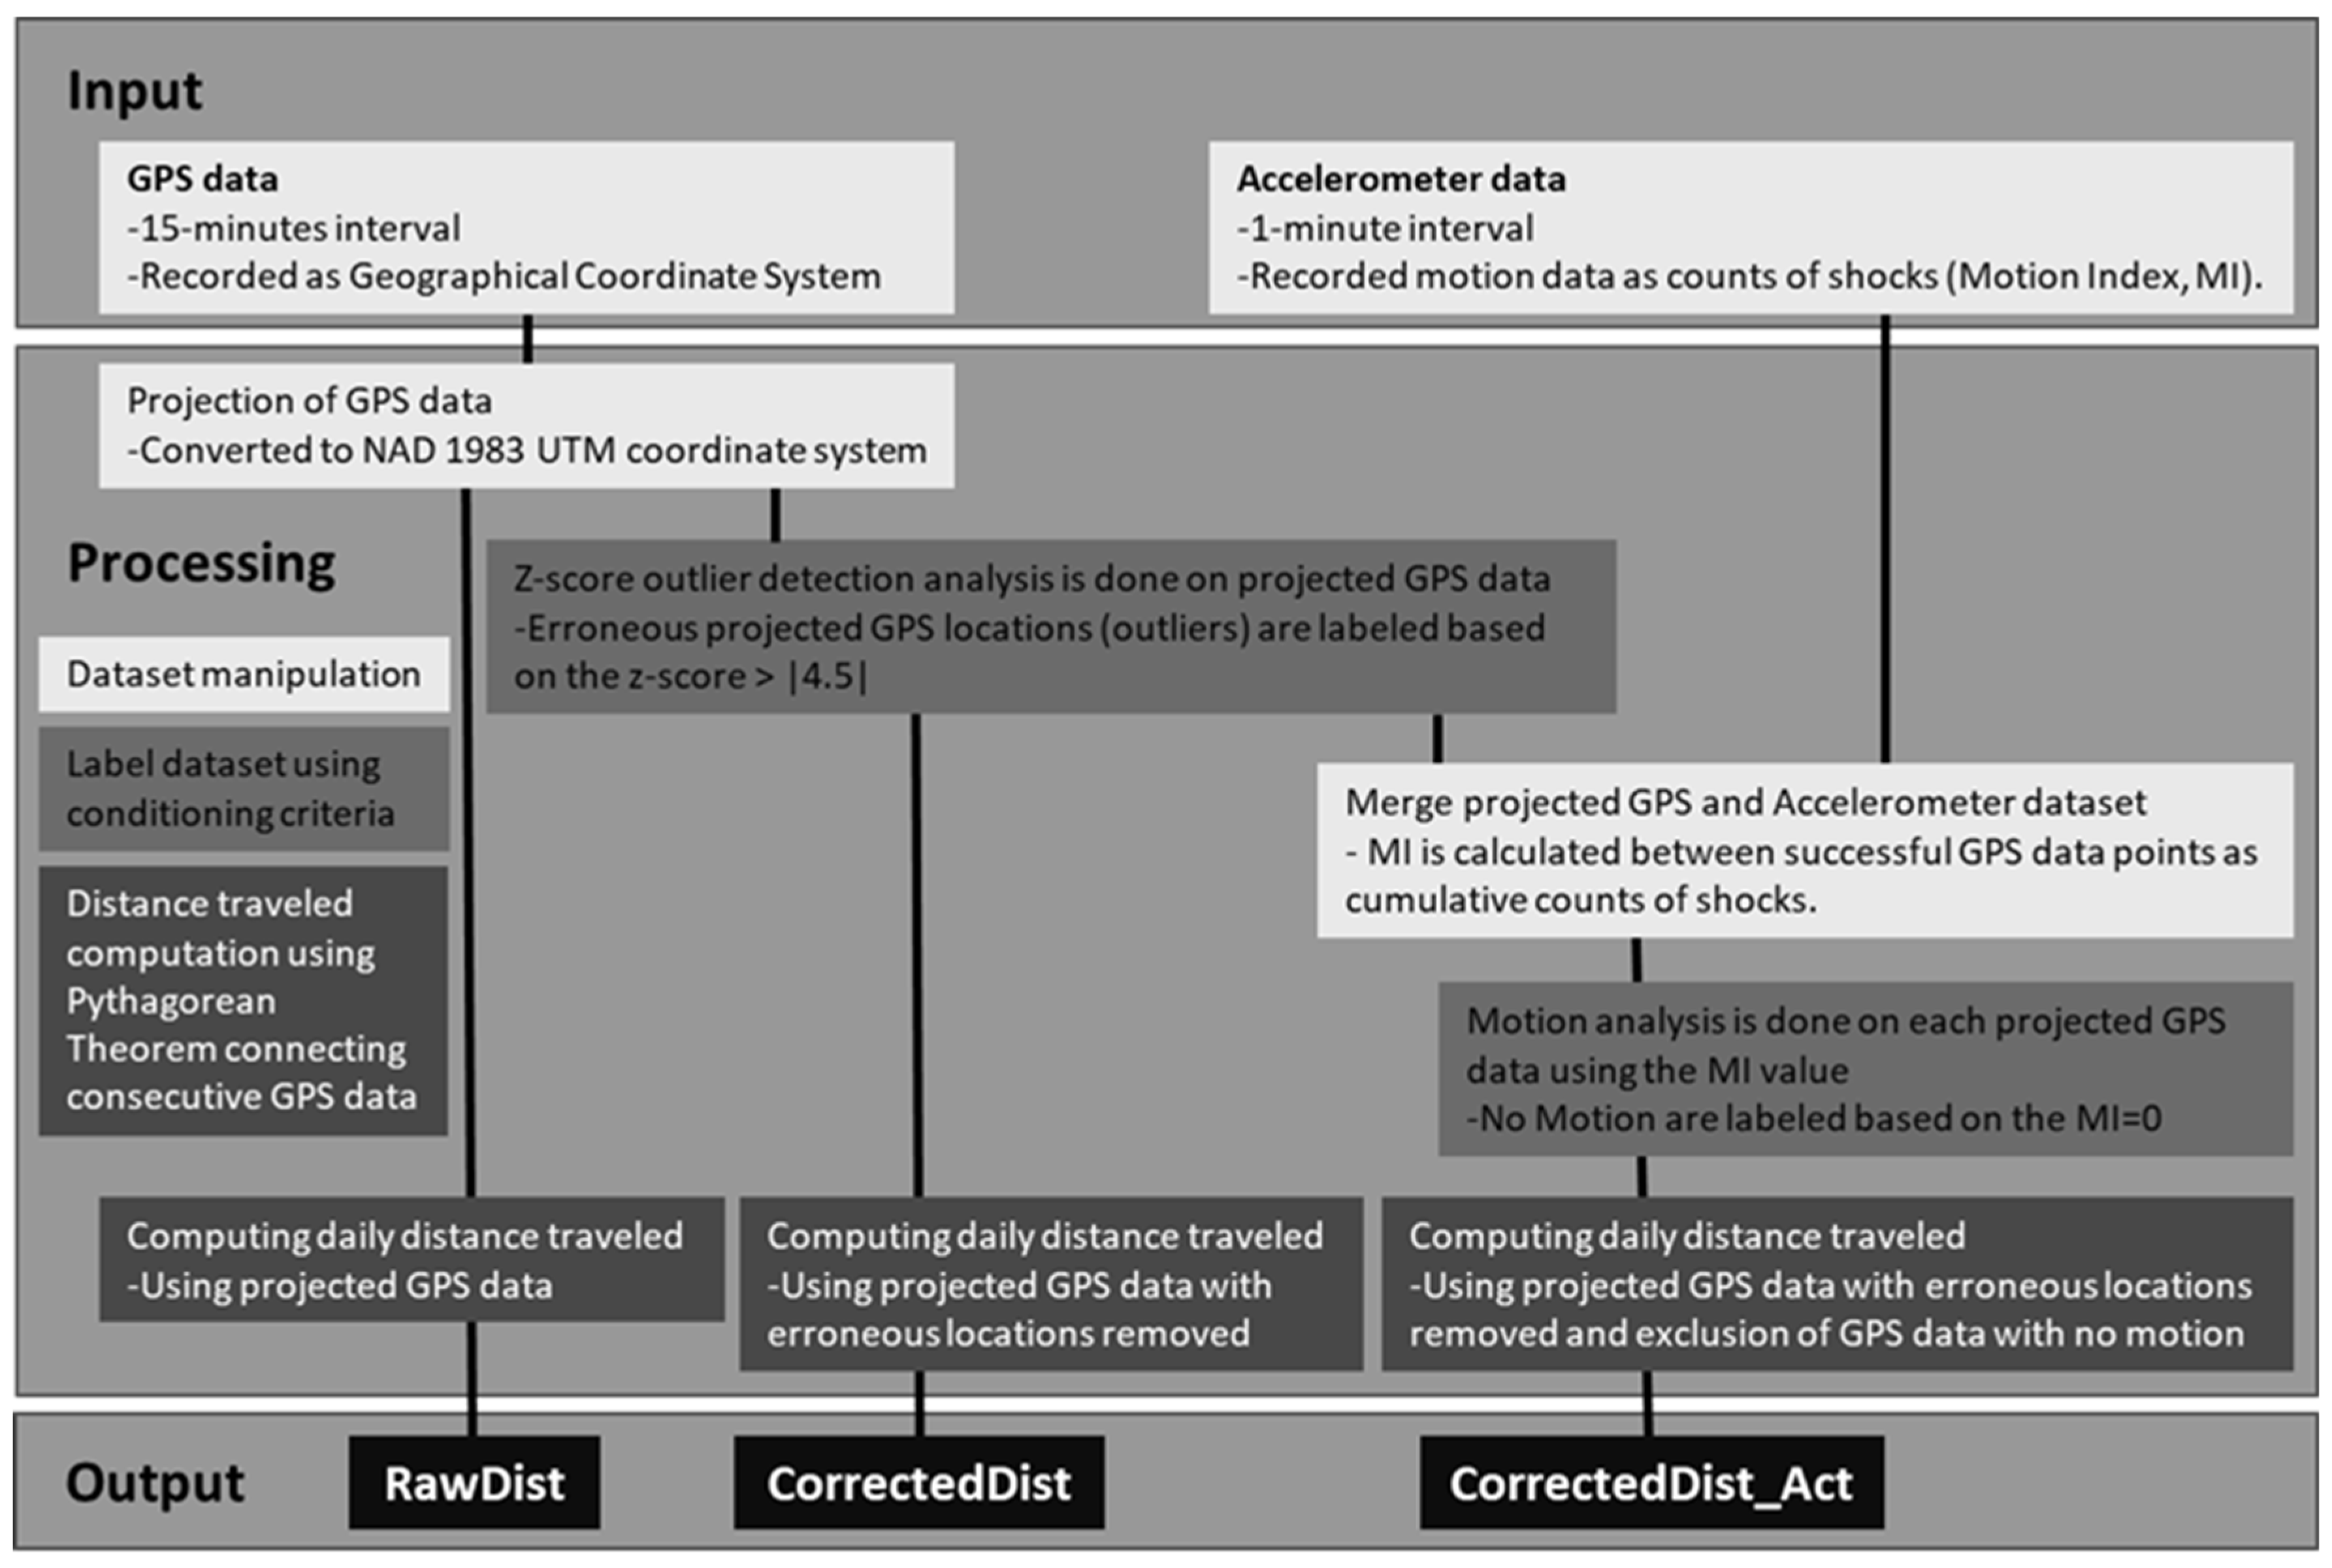
2.3. Data Processing
- Let consecutive GPS position be represented as (x1, y1), (x2, y2), (x3, y3), …, (xn, yn) where n is the total number of daily GPS positions.
- Pythagorean Theorem for calculating the distance between two consecutive GPS positions (xi, yi) and (x(i+1), y(i+1)):
- 3.
- The daily distance traveled within a day was calculated by summing the distance between all consecutive GPS positions within a day:
2.4. Data Analysis
3. Results
4. Discussion
4.1. GPS Accuracy Measurement on Static Trackers
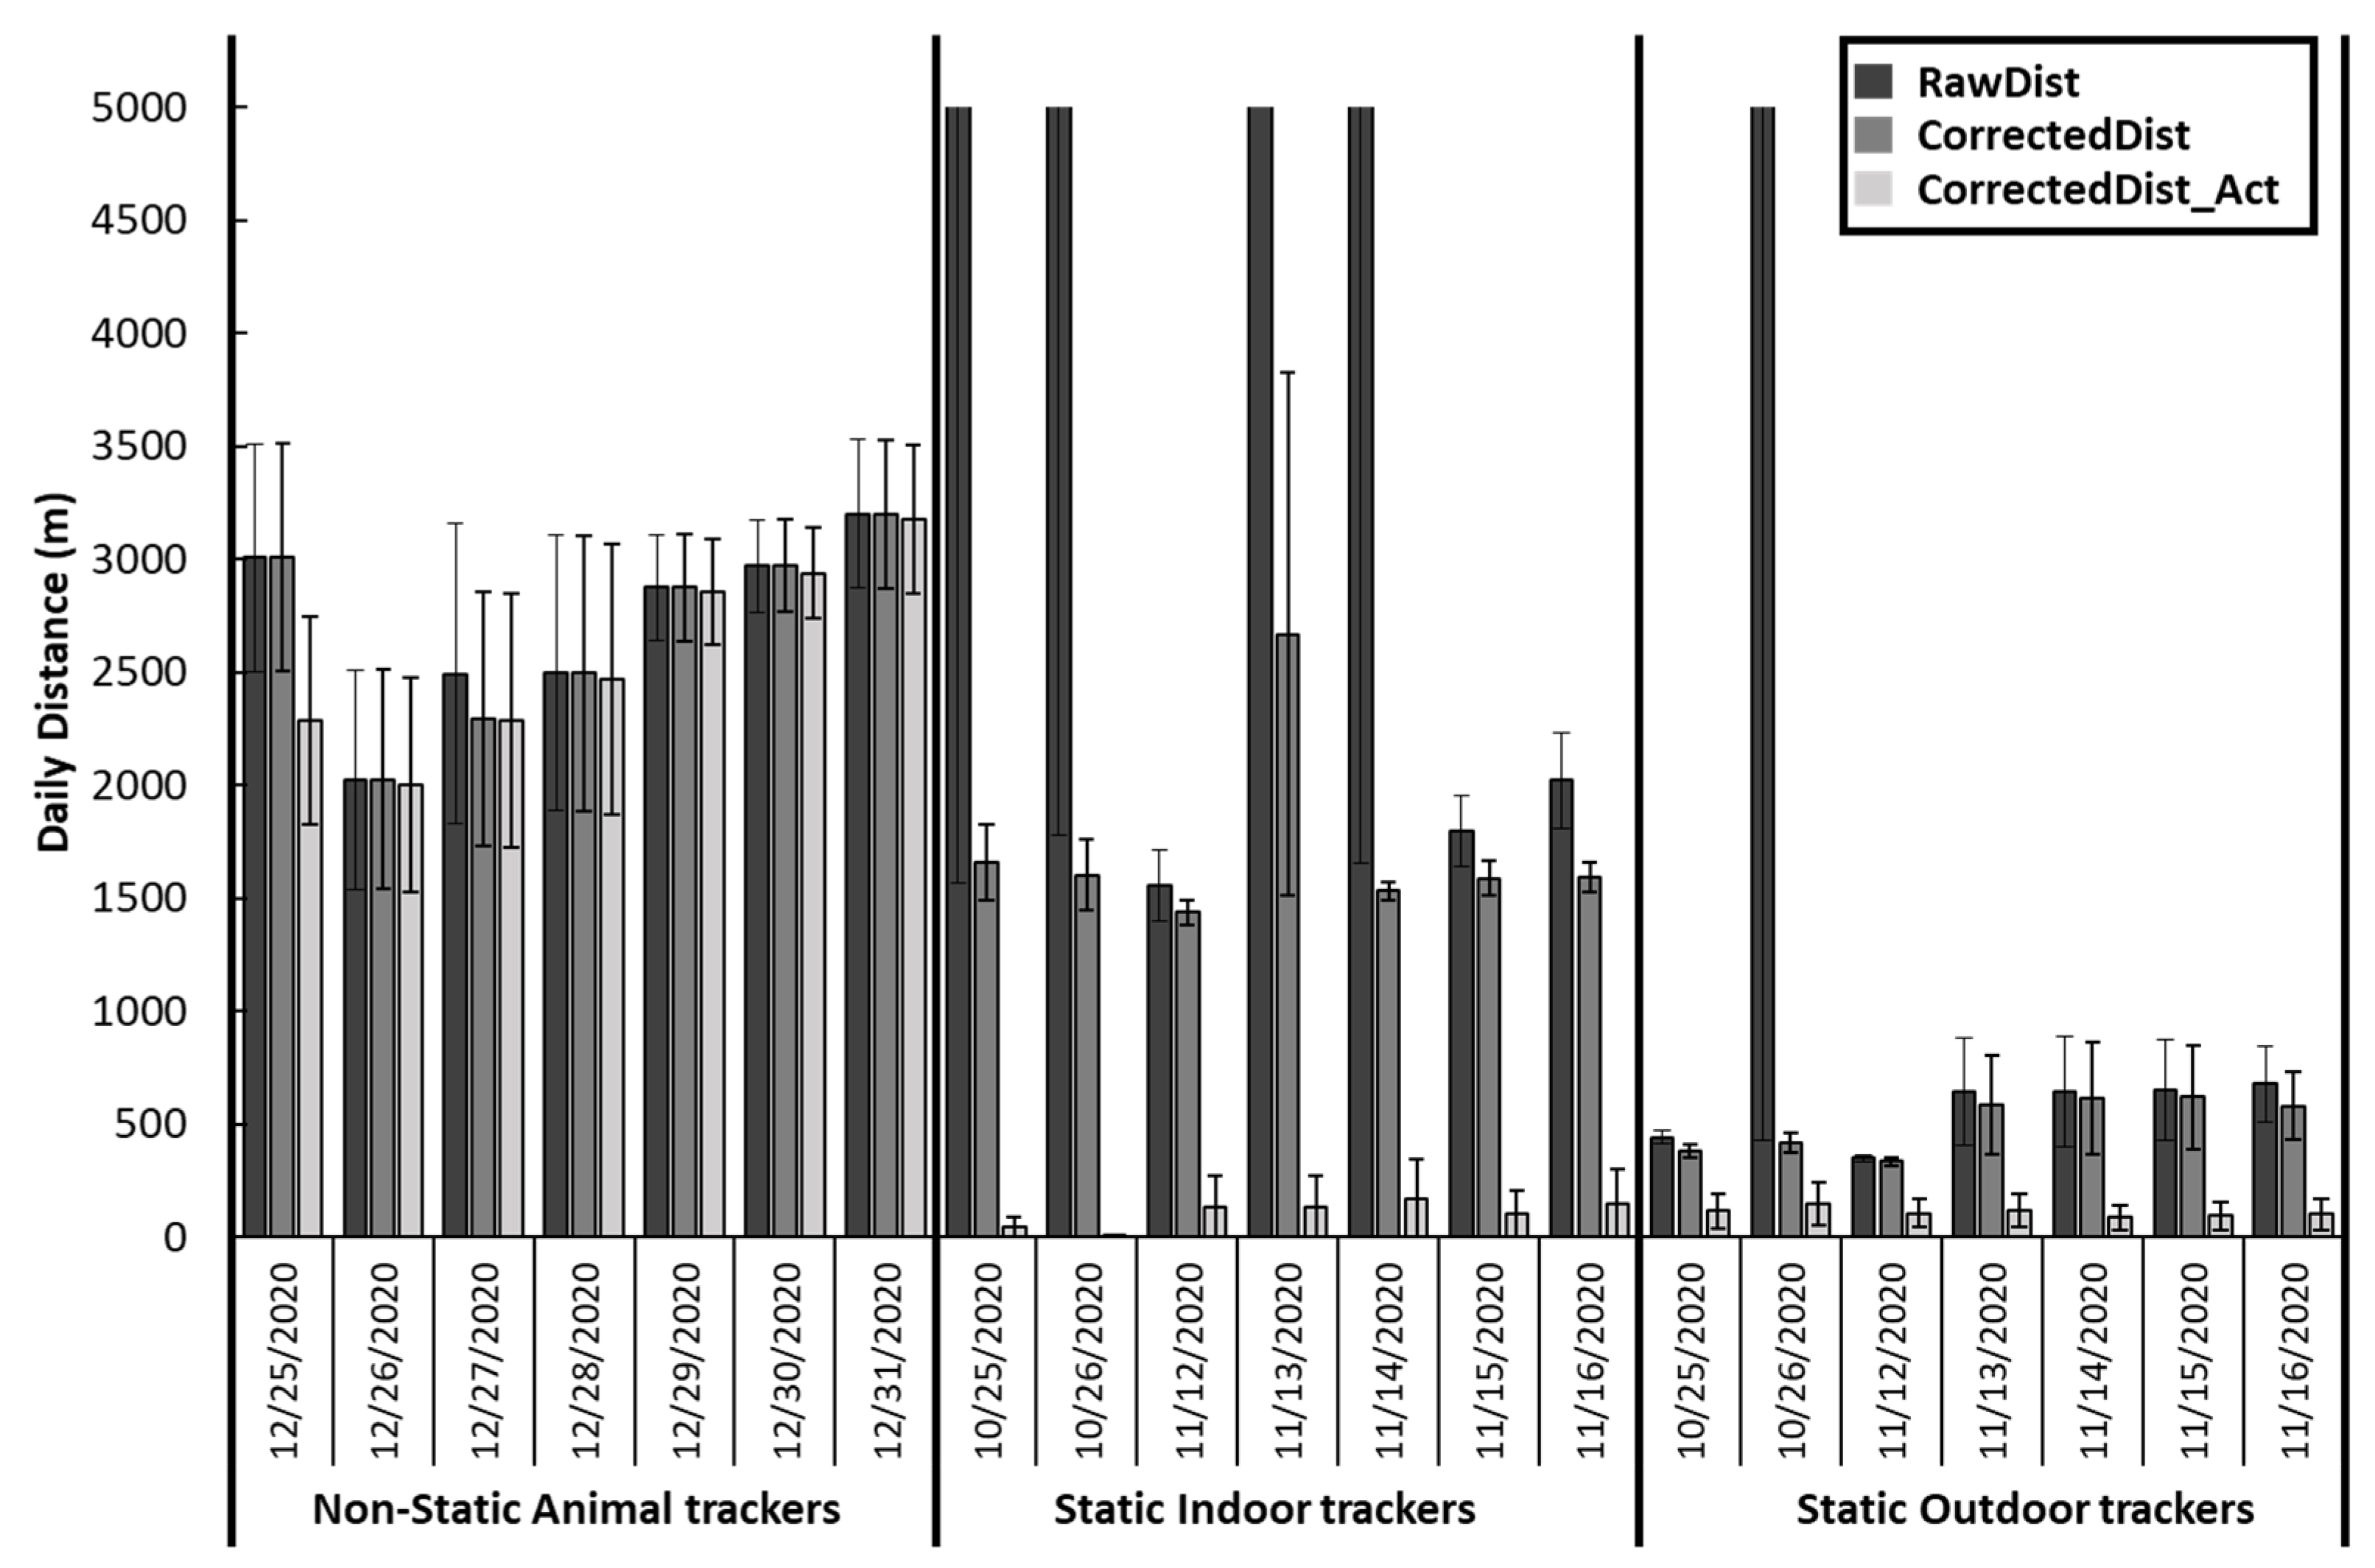
4.2. Daily Distance Traveled Calculated Using RawDist
4.3. Daily Distance Traveled Calculated Using CorrectedDist
4.4. Daily Distance Traveled Calculated Using CorrectedDist_Act
4.5. Limitations of the Daily Distance Traveled Calculations
5. Conclusions
Author Contributions
Funding
Institutional Review Board Statement
Informed Consent Statement
Data Availability Statement
Acknowledgments
Conflicts of Interest
References
- Gregorini, P. Diurnal Grazing Pattern: Its Physiological Basis and Strategic Management. Anim. Prod. Sci. 2012, 52, 416–430. [Google Scholar] [CrossRef]
- Manning, J.K.; Cronin, G.M.; González, L.A.; Hall, E.J.S.; Merchant, A.; Ingram, L.J. The Effects of Global Navigation Satellite System (GNSS) Collars on Cattle (Bos taurus) Behaviour. Appl. Anim. Behav. Sci. 2017, 187, 54–59. [Google Scholar] [CrossRef]
- Nyamuryekung’e, S.; Cibils, A.F.; Estell, R.E.; Vanleeuwen, D.; Spiegal, S.; Steele, C.; Gonz, A.L.; Mcintosh, M.M.; Gong, Q. Movement, Activity, and Landscape Use Patterns of Heritage and Commercial Beef Cows Grazing Chihuahuan Desert Rangeland. J. Arid Environ. 2022, 199, 104704. [Google Scholar] [CrossRef]
- Bailey, D.W.; Trotter, M.G.; Knight, C.W.; Thomas, M.G. Use of GPS Tracking Collars and Accelerometers for Rangeland Livestock Production Research. Transl. Anim. Sci. 2018, 2, 81–88. [Google Scholar] [CrossRef]
- Nyamuryekung’e, S.; Cibilis, A.F.; Estell, R.E.; McIntosh, M.; VanLeeuwen, D.; Steele, C.; Gonzalez, A.L.; Spiegal, S.; Avedaño-Reyes, L.; Rodríguez-Almeida, F.A.; et al. Foraging Behavior and Body Temperature of Heritage vs. Commercial Beef Cows in Relation Desert Ambient Heat. J. Arid Environ. 2021, 193, 104565. [Google Scholar] [CrossRef]
- Clark, P.E.; Johnson, D.E.; Larson, L.L.; Louhaichi, M.; Roland, T.; Williams, J. Effects of Wolf Presence on Daily Travel Distance of Range Cattle. Rangel. Ecol. Manag. 2017, 70, 657–665. [Google Scholar] [CrossRef]
- Brosh, A.; Henkin, Z.; Ungar, E.D.; Dolev, A.; Orlov, A.; Yehuda, Y.; Aharoni, Y. Energy Cost of Cows’ Grazing Activity: Use of the Heart Rate Method and the Global Positioning System for Direct Field Estimation. J. Anim. Sci. 2006, 84, 1951–1967. [Google Scholar] [CrossRef]
- Augustin, A.; Yi, J.; Clausen, T.; Townsley, W.M. A Study of Lora: Long Range & Low Power Networks for the Internet of Things. Sensors 2016, 16, 1466. [Google Scholar] [CrossRef]
- Sanchez-Iborra, R.; Cano, M.D. State of the Art in LP-WAN Solutions for Industrial IoT Services. Sensors 2016, 16, 708. [Google Scholar] [CrossRef]
- Germani, L.; Mecarelli, V.; Baruffa, G.; Rugini, L.; Frescura, F. An IoT Architecture for Continuous Livestock Monitoring Using Lora LPWAN. Electronics 2019, 8, 1435. [Google Scholar] [CrossRef]
- McIntosh, M.; Cibils, A.; Nyamuryekung’e, S.; Estell, R.; Cox, A.; Duni, D.; Gong, Q.; Waterhouse, T.; Holland, J.; Cao, H.; et al. Deployment of a LoRa-WAN near Real-Time Precision Ranching System on Extensive Desert Rangelands: What We Have Learned. Appl. Anim. Sci. 2023, in press. [Google Scholar]
- Ayaz, M.; Ammad-Uddin, M.; Sharif, Z.; Mansour, A.; Aggoune, E.H.M. Internet-of-Things (IoT)-Based Smart Agriculture: Toward Making the Fields Talk. IEEE Access 2019, 7, 129551–129583. [Google Scholar] [CrossRef]
- dos Reis, B.R.; Easton, Z.; Fuka, D. A LoRa Sensor Network for Monitoring Pastured Livestock Location and Activity. Transl. Anim. Sci. 2021, 5, txab010. [Google Scholar] [CrossRef] [PubMed]
- Madakam, S.; Ramaswamy, R.; Tripathi, S. Internet of Things (IoT): A Literature Review. J. Comput. Commun. 2015, 3, 164–173. [Google Scholar] [CrossRef]
- Navarro, E.; Costa, N.; Pereira, A. A Systematic Review of Iot Solutions for Smart Farming. Sensors 2020, 20, 4231. [Google Scholar] [CrossRef] [PubMed]
- Nyamuryekung’e, S. Re-Imagining Rangeland Livestock Production in Response to the Evolving Demands of a Fast-Paced, Changing World. Rangelands 2023, submitted.
- Bailey, D.W.; Trotter, M.G.; Tobin, C.; Thomas, M.G. Opportunities to Apply Precision Livestock Management on Rangelands. Front. Sustain. Food Syst. 2021, 5, 611915. [Google Scholar] [CrossRef]
- Tedeschi, L.O.; Greenwood, P.L.; Halachmi, I.; Lezion, R. Advancements in Sensor Technology and Decision Support Intelligent Tools to Assist Smart Livestock Farming. J. Anim. Sci. 2021, 99, skab038. [Google Scholar] [CrossRef]
- Greenwood, P.L.; Bishop-Hurley, G.J.; González, L.A.; Ingham, A.B. Development and Application of a Livestock Phenomics Platform to Enhance Productivity and Efficiency at Pasture. Anim. Prod. Sci. 2016, 56, 1299–1311. [Google Scholar] [CrossRef]
- Berckmans, D. Precision Livestock Farming Technologies for Welfare Management in Intensive Livestock Systems. OIE Rev. Sci. Tech. 2014, 33, 189–196. [Google Scholar] [CrossRef]
- Britt, J.H.; Cushman, R.A.; Dechow, C.D.; Dobson, H.; Humblot, P.; Hutjens, M.F.; Jones, G.A.; Ruegg, P.S.; Sheldon, I.M.; Stevenson, J.S. Invited Review: Learning from the Future—A Vision for Dairy Farms and Cows in 2067. J. Dairy Sci. 2018, 101, 3722–3741. [Google Scholar] [CrossRef]
- Halachmi, I.; Guarino, M.; Bewley, J.; Pastell, M. Smart Animal Agriculture: Application of Real-Time Sensors to Improve Animal Well-Being and Production. Annu. Rev. Anim. Biosci. 2019, 7, 403–425. [Google Scholar] [CrossRef]
- Rutten, C.J.; Velthuis, A.G.J.; Steeneveld, W.; Hogeveen, H. Invited Review: Sensors to Support Health Management on Dairy Farms Invited Review: Sensors to Support Health Management on Dairy Farms. J. Dairy Sci. 2013, 96, 1928–1952. [Google Scholar] [CrossRef]
- Bracke, M.B.M.; Hopster, H. Assessing the Importance of Natural Behavior for Animal Welfare. J. Agric. Environ. Ethics 2006, 19, 77–89. [Google Scholar] [CrossRef]
- Stachowicz, J.; Umstätter, C. Do We Automatically Detect Health- or General Welfare-Related Issues? A Framework. Proc. R. Soc. B Biol. Sci. 2021, 288, 20210190. [Google Scholar] [CrossRef]
- McIntosh, M.M.; Cibils, A.F.; Estell, R.E.; Gong, Q.; Cao, H.; Gonzalez, A.L.; Nyamuryekung’e, S.; Spiegal, S.A. Can Cattle Geolocation Data Yield Behavior-Based Criteria to Inform Precision Grazing Systems on Rangeland? Livest Sci. 2022, 255, 104801. [Google Scholar] [CrossRef]
- McGavin, S.L.; Bishop-Hurley, G.J.; Charmley, E.; Greenwood, P.L.; Callaghan, M.J. Effect of GPS Sample Interval and Paddock Size on Estimates of Distance Travelled by Grazing Cattle in Rangeland, Australia. Rangel. J. 2018, 40, 55–64. [Google Scholar] [CrossRef]
- Ungar, E.D.; Henkin, Z.; Gutman, M.; Dolev, A.; Genizi, A.; Ganskopp, D. Inference of Animal Activity From GPS Collar Data on Free-Ranging Cattle. Rangel. Ecol. Manag. 2005, 58, 256–266. [Google Scholar] [CrossRef]
- Agouridis, C.T.; Stombaugh, T.S.; Workman, S.R.; Koostra, B.K.; Edwards, D.R.; Vanzant, E.S. Suitability of a GPS Collar for Grazing Studies. Trans. Am. Soc. Agric. Eng. 2004, 47, 1321–1329. [Google Scholar] [CrossRef]
- Turner, L.W.; Udal, M.C.; Larson, B.T.; Shearer, S.A. Monitoring Cattle Behavior and Pasture Use with GPS and GIS. Can. J. Anim. Sci. 2000, 80, 405–413. [Google Scholar] [CrossRef]
- Buerkert, A.; Schlecht, E. Performance of Three GPS Collars to Monitor Goats’ Grazing Itineraries on Mountain Pastures. Comput. Electron. Agric. 2009, 65, 85–92. [Google Scholar] [CrossRef]
- Ganskopp, D.C.; Johnson, D.D. GPS Error in Studies Addressing Animal Movements and Activities. Rangel. Ecol. Manag. 2007, 60, 350–358. [Google Scholar] [CrossRef]
- Nyamuryekung’e, S.; Cibils, A.F.; Estell, R.E.; Funk, M.; Mcintosh, M.M.; Cox, A.; Utsumi, S.A.; Cao, H.; Boucheron, L.; Gong, Q.; et al. Performance of Lora-WAN Sensors for Precision Livestock Tracking and Biosensing Applications. In Proceedings of the XXIV International Grassland Congress/XI International Rangeland Congress, Nairobi, Kenya, 25–29 October 2021; National Organizing Committee of 2021 IGC/IRC Congress, Ed.; Kenya Agricultural and Livestock Research Organization: Nairobi, Kenya, 2021. [Google Scholar]
- Nyamuryekung’e, S.; Cibils, A.F.; Estell, R.E.R.E.; VanLeeuwen, D.; Steele, C.; Roacho-Estrada, J.O.; Rodriguez Almeida, F.; Gonzalez, A.L.; Spiegal, S.; Nyamuryekung’e, S.; et al. Do Young Calves Constrain Movement Patterns of Nursing Raramuri Criollo Cows on Rangeland? Rangel. Ecol. Manag. 2020, 73, 84–92. [Google Scholar] [CrossRef]
- Akhigbe, I.; Munir, K.; Akinade, O.; Akanbi, L.; Oyedele, L.O. Iot Technologies for Livestock Management: A Review of Present Status, Opportunities, and Future Trends Bernard. Big Data Cogn. Comput. 2021, 5, 10. [Google Scholar] [CrossRef]
- Ellis, J.L.; Jacobs, M.; Dijkstra, J.; van Laar, H.; Cant, J.P.; Tulpan, D.; Ferguson, N. Review: Synergy between Mechanistic Modelling and Data-Driven Models for Modern Animal Production Systems in the Era of Big Data. Animal 2020, 14, 223–237. [Google Scholar] [CrossRef]
- Muminov, A.; Sattarov, O.; Lee, C.W.; Kang, H.K.; Ko, M.C.; Oh, R.; Ahn, J.; Oh, H.J.; Jeon, H.S. Reducing GPS Error for Smart Collars Based on Animal’s Behavior. Appl. Sci. 2019, 9, 3408. [Google Scholar] [CrossRef]
- Johnson, D.D.; Ganskopp, D.C. GPS Collar Sampling Frequency: Effects on Measures of Resource Use. Rangel. Ecol. Manag. 2008, 61, 226–231. [Google Scholar] [CrossRef]
- Fogarty, E.S.; Swain, D.L.; Cronin, G.M.; Moraes, L.E.; Trotter, M. Behaviour Classification of Extensively Grazed Sheep Using Machine Learning. Comput. Electron. Agric. 2020, 169, 105175. [Google Scholar] [CrossRef]
- Hosseininoorbin, S.; Layeghy, S.; Kusy, B.; Jurdak, R.; Bishop-Hurley, G.J.; Greenwood, P.L.; Portmann, M. Deep Learning-Based Cattle Behaviour Classification Using Joint Time-Frequency Data Representation. Comput. Electron. Agric. 2021, 187, 106241. [Google Scholar] [CrossRef]

| Distance (m) | State | Placement | LSmeans | p-Value | ||
|---|---|---|---|---|---|---|
| ±Std Err | µ Non-Static = µ Static | µ = 0 | ||||
| RawDist * | non-Static | Animal | 2724 ± 63,475 | a | 0.33 | 0.97 |
| Static | Indoor | 150,644 ± 69,534 | a | 0.03 | ||
| Static | Outdoor | 11,364 ± 66,543 | a | 0.86 | ||
| CorrectedDist | non-Static | Animal | 2695 ± 193 | a | <0.01 | <0.01 |
| Static | Indoor | 1725 ± 211 | b | <0.01 | ||
| Static | Outdoor | 385 ± 202 | c | 0.06 | ||
| CorrectedDist_Act | non-Static | Animal | 2574 ± 186 | a | <0.01 | <0.01 |
| Static | Indoor | 42 ± 203 | b | 0.84 | ||
| Static | Outdoor | 170 ± 193 | b | 0.38 | ||
Disclaimer/Publisher’s Note: The statements, opinions and data contained in all publications are solely those of the individual author(s) and contributor(s) and not of MDPI and/or the editor(s). MDPI and/or the editor(s) disclaim responsibility for any injury to people or property resulting from any ideas, methods, instructions or products referred to in the content. |
© 2023 by the authors. Licensee MDPI, Basel, Switzerland. This article is an open access article distributed under the terms and conditions of the Creative Commons Attribution (CC BY) license (https://creativecommons.org/licenses/by/4.0/).
Share and Cite
Nyamuryekung’e, S.; Duff, G.; Utsumi, S.; Estell, R.; McIntosh, M.M.; Funk, M.; Cox, A.; Cao, H.; Spiegal, S.; Perea, A.; et al. Real-Time Monitoring of Grazing Cattle Using LORA-WAN Sensors to Improve Precision in Detecting Animal Welfare Implications via Daily Distance Walked Metrics. Animals 2023, 13, 2641. https://doi.org/10.3390/ani13162641
Nyamuryekung’e S, Duff G, Utsumi S, Estell R, McIntosh MM, Funk M, Cox A, Cao H, Spiegal S, Perea A, et al. Real-Time Monitoring of Grazing Cattle Using LORA-WAN Sensors to Improve Precision in Detecting Animal Welfare Implications via Daily Distance Walked Metrics. Animals. 2023; 13(16):2641. https://doi.org/10.3390/ani13162641
Chicago/Turabian StyleNyamuryekung’e, Shelemia, Glenn Duff, Santiago Utsumi, Richard Estell, Matthew M. McIntosh, Micah Funk, Andrew Cox, Huiping Cao, Sheri Spiegal, Andres Perea, and et al. 2023. "Real-Time Monitoring of Grazing Cattle Using LORA-WAN Sensors to Improve Precision in Detecting Animal Welfare Implications via Daily Distance Walked Metrics" Animals 13, no. 16: 2641. https://doi.org/10.3390/ani13162641
APA StyleNyamuryekung’e, S., Duff, G., Utsumi, S., Estell, R., McIntosh, M. M., Funk, M., Cox, A., Cao, H., Spiegal, S., Perea, A., & Cibils, A. F. (2023). Real-Time Monitoring of Grazing Cattle Using LORA-WAN Sensors to Improve Precision in Detecting Animal Welfare Implications via Daily Distance Walked Metrics. Animals, 13(16), 2641. https://doi.org/10.3390/ani13162641