
Comparative Assessment of the Stress Response of Cattle to Common Dairy Management Practices
 , , , , and
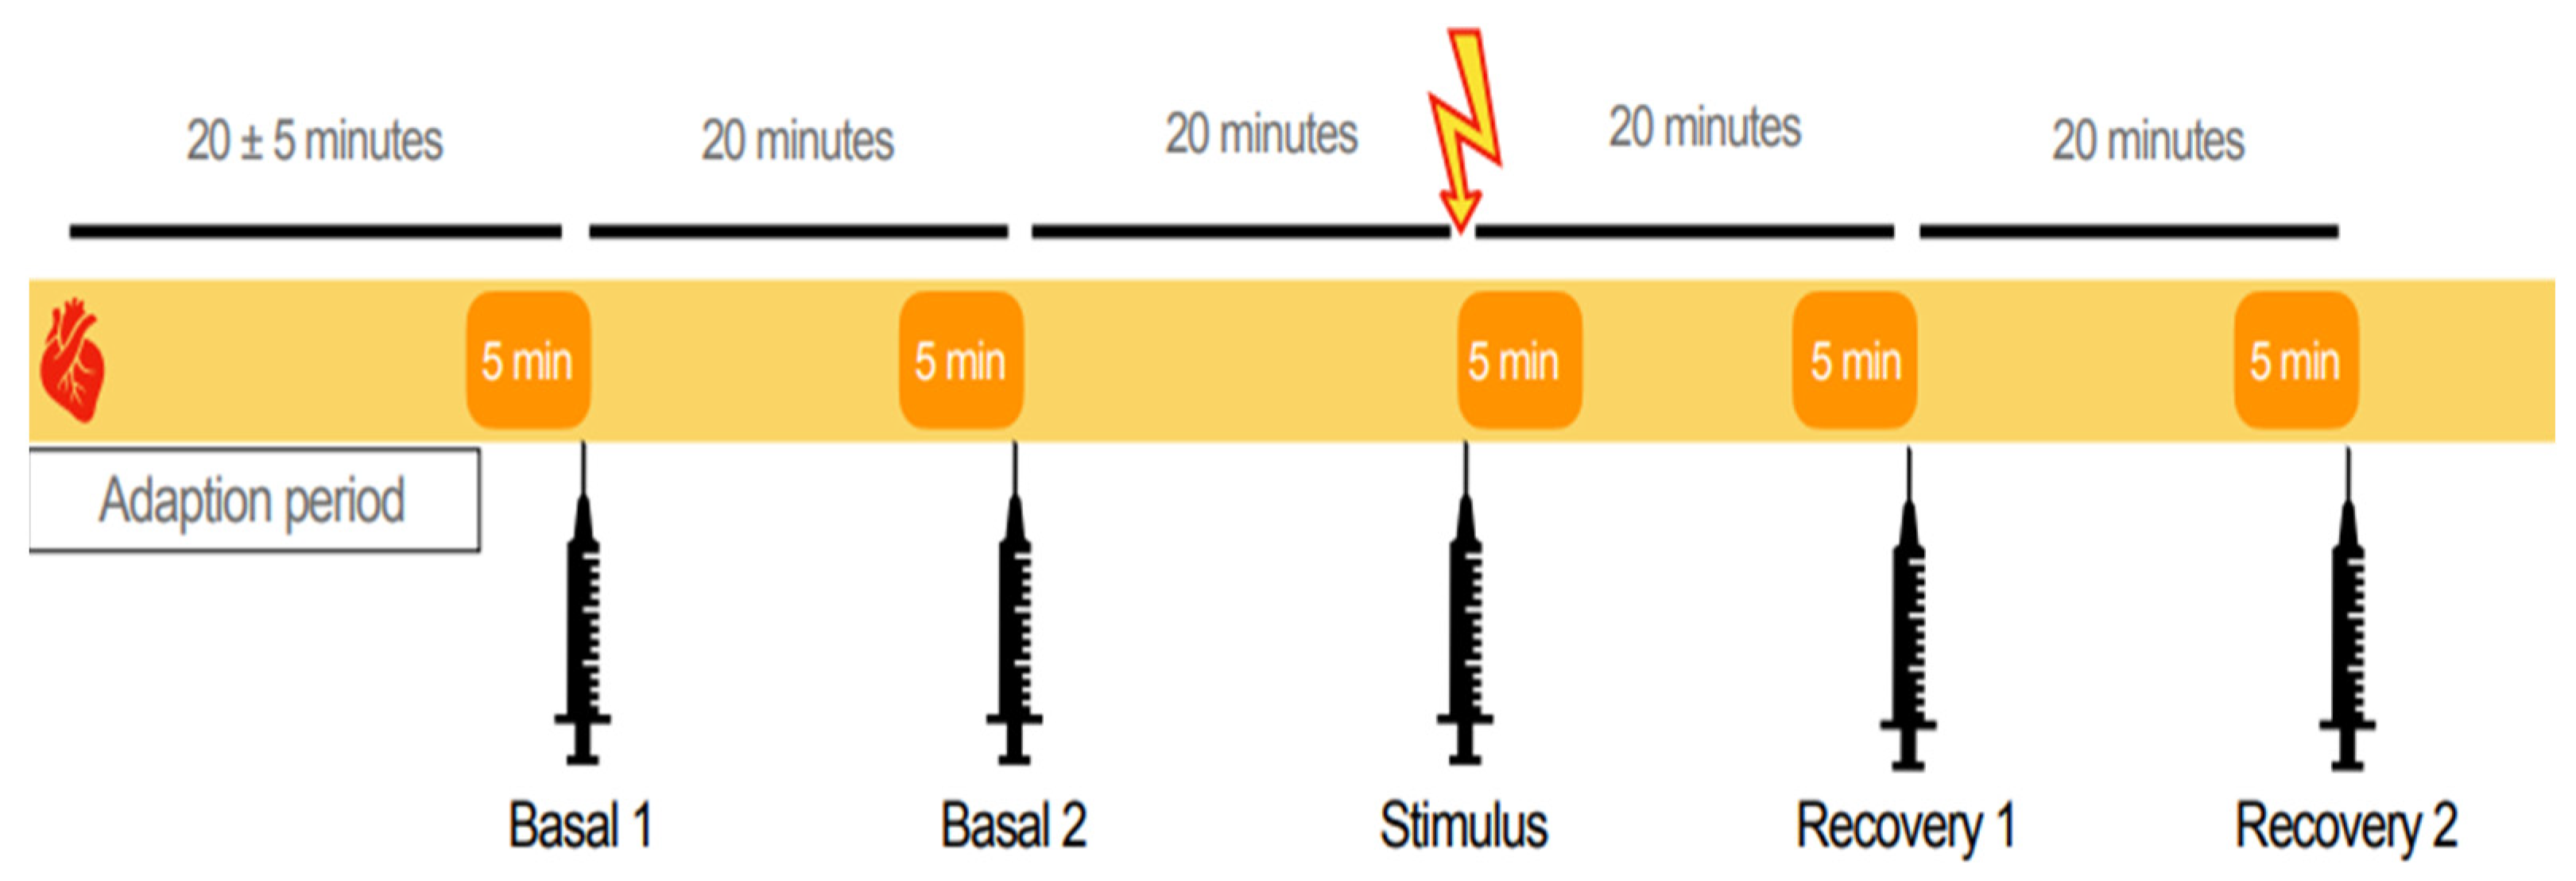
Abstract
Simple Summary
Abstract
1. Introduction
2. Materials and Methods
2.1. Animals and Housing
2.2. Experimental Design
2.3. Serum Cortisol
2.4. Daily Milk Yield
2.5. Heart Rate Variability
2.6. Statistical Analysis
3. Results
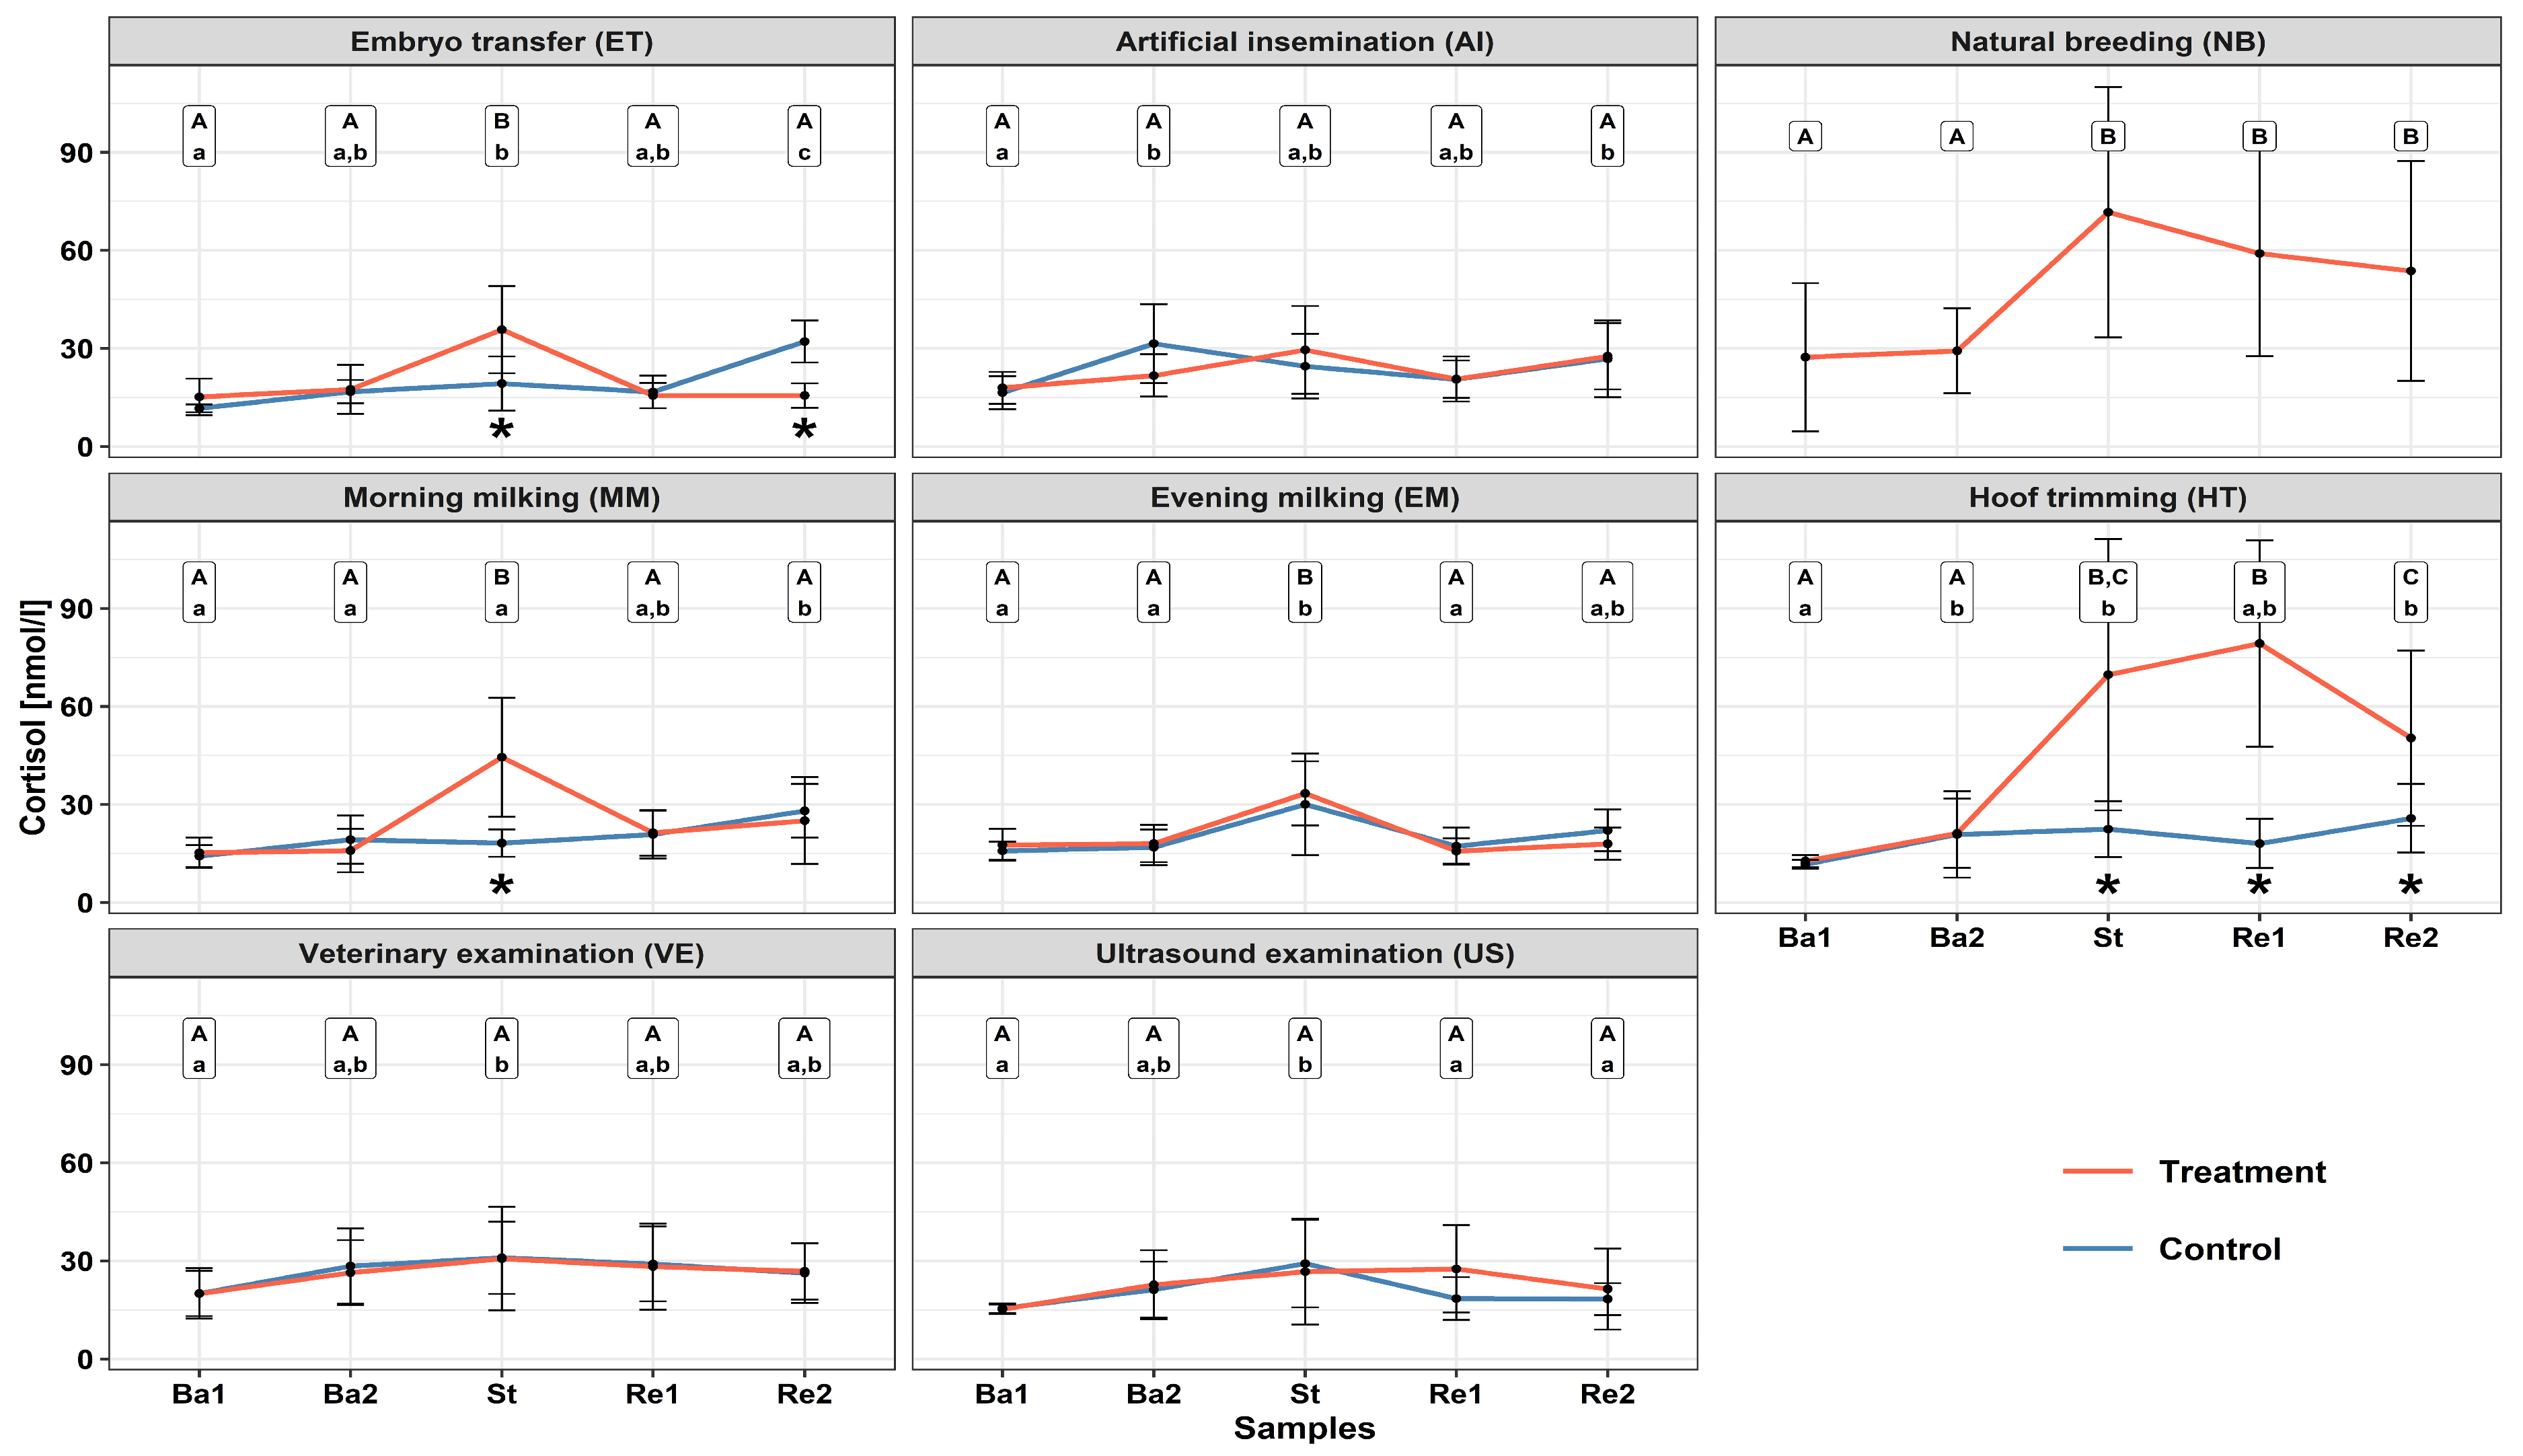
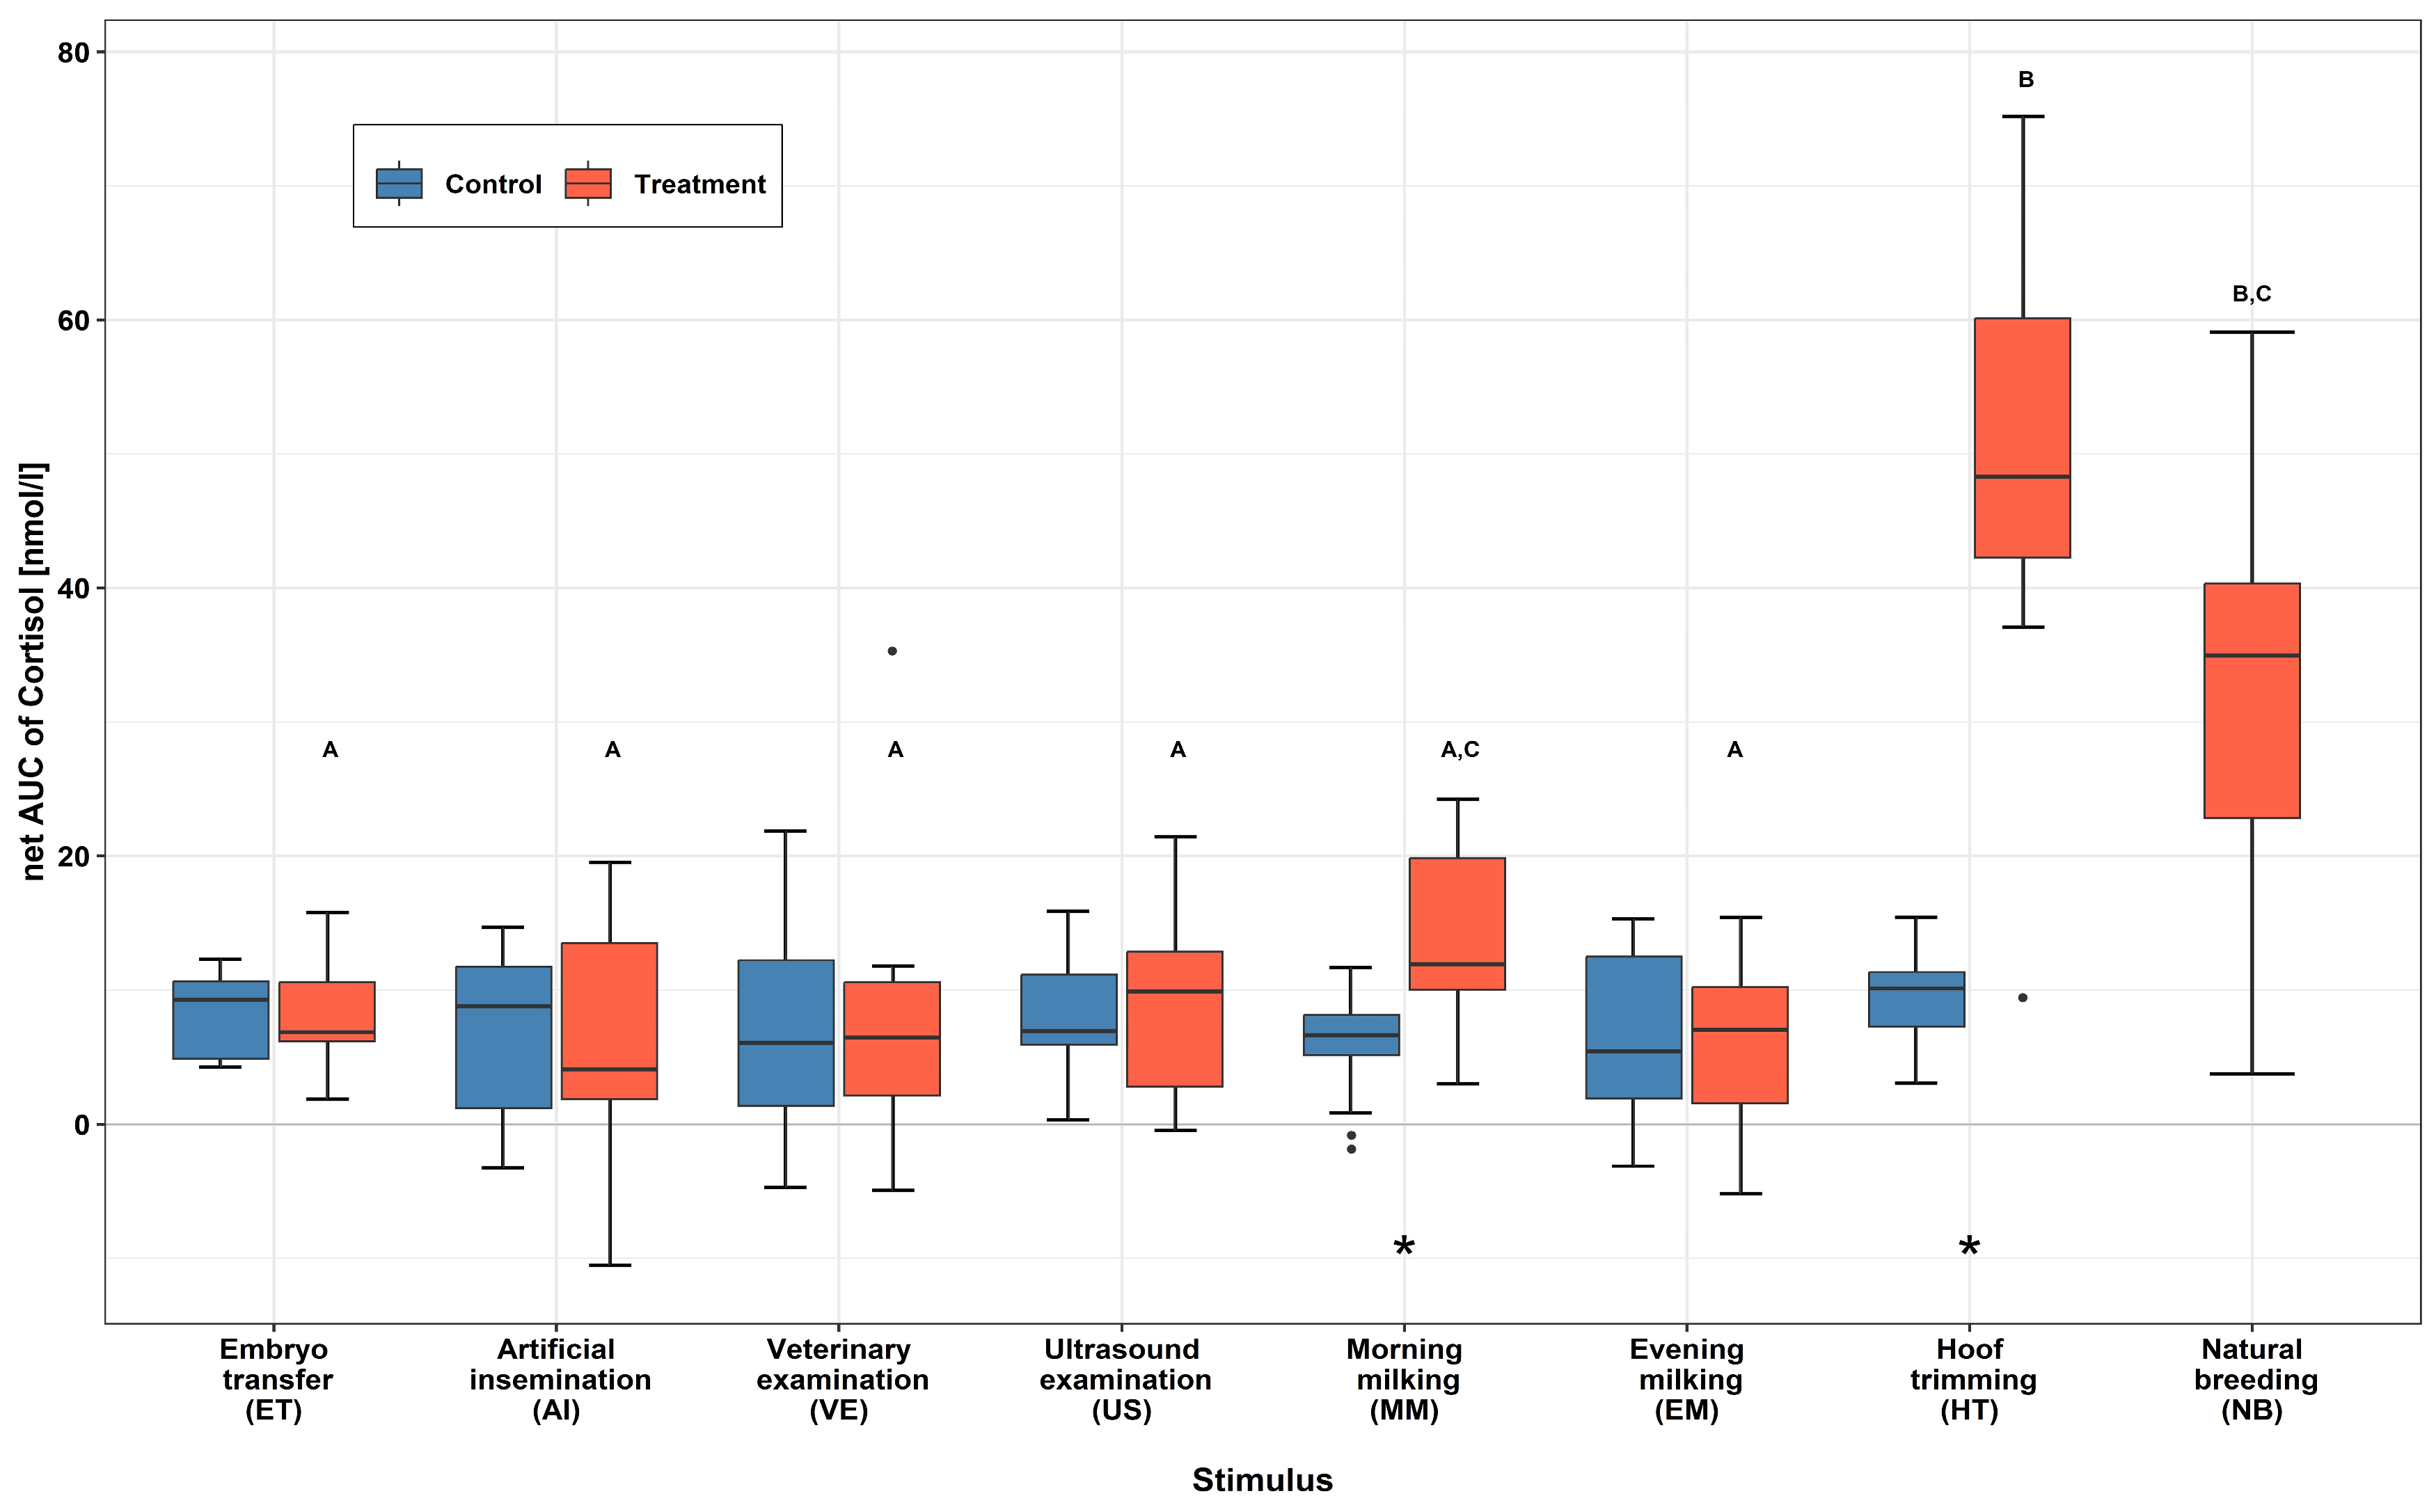
3.1. Serum Cortisol
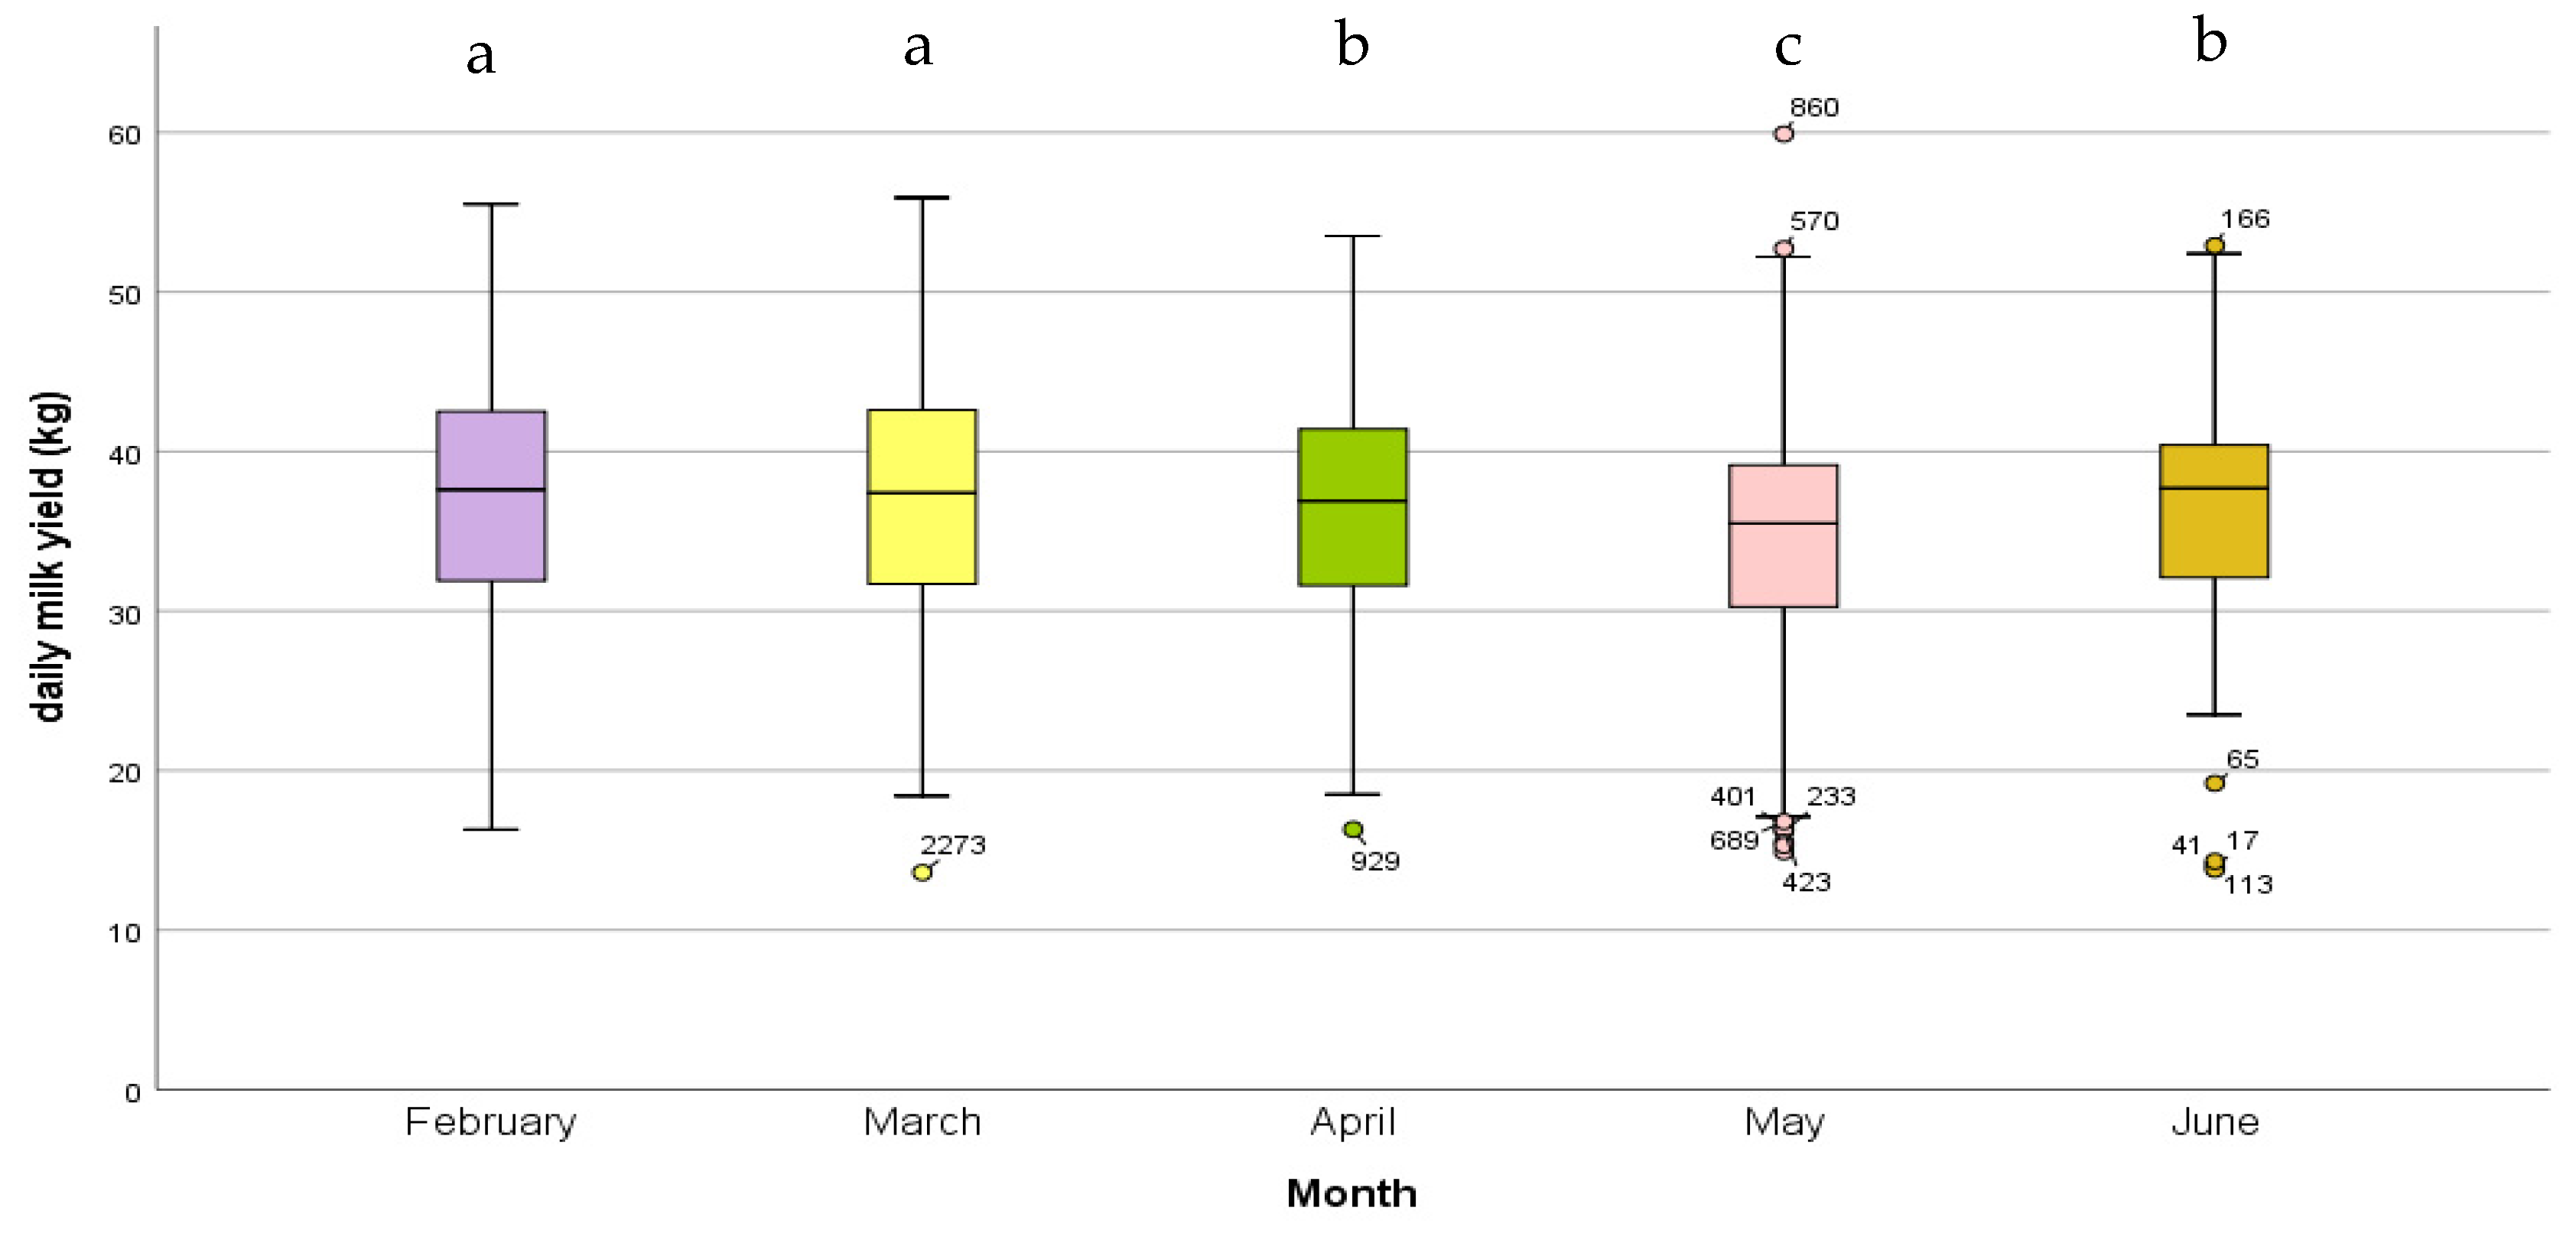
3.2. Daily Milk Yield
3.3. Heart Rate Variability
4. Discussion
5. Conclusions
Supplementary Materials
Author Contributions
Funding
Institutional Review Board Statement
Informed Consent Statement
Data Availability Statement
Acknowledgments
Conflicts of Interest
Appendix A
References
- World Organisation for Animal Health (OIE). Terrestrial Animal Health Code. 2022. Available online: https://www.woah.org/en/what-we-do/standards/codes-and-manuals/terrestrial-code-online-access/ (accessed on 8 April 2023).
- von Keyserlingk, M.A.G.; Rushen, J.; de Passillé, A.M.; Weary, D.M. Invited review: The welfare of dairy cattle—Key concepts and the role of science. J. Dairy Sci. 2009, 92, 4101–4111. [Google Scholar] [CrossRef] [PubMed]
- Selye, H. Stress and the general adaptation syndrome. Br. Med. J. 1950, 1, 1383–1392. [Google Scholar] [CrossRef] [PubMed]
- Koolhaas, J.M.; Bartolomucci, A.; Buwalda, B.; de Boer, S.F.; Flügge, G.; Korte, S.M.; Meerlo, P.; Murison, R.; Olivier, B.; Palanza, P. Stress revisited: A critical evaluation of the stress concept. Neurosci. Biobehav. Rev. 2011, 35, 1291–1301. [Google Scholar] [CrossRef] [PubMed]
- de Boer, S.F.; Koopmans, S.J.; Slangen, J.L.; Van Der Gugten, J. Plasma catecholamine, corticosterone and glucose responses to repeated stress in rats: Effect of interstressor interval length. Physiol. Behav. 1990, 47, 1117–1124. [Google Scholar] [CrossRef]
- McEwen, B.S. Stress, adaptation, and disease. Allostasis and allostatic load. Ann. N. Y. Acad. Sci. 1998, 840, 33–44. [Google Scholar] [CrossRef]
- Rankin, C.H.; Abrams, T.; Barry, R.J.; Bhatnagar, S.; Clayton, D.F.; Colombo, J.; Coppola, G.; Geyer, M.A.; Glanzman, D.L.; Marsland, S.; et al. Habituation revisited: An updated and revised description of the behavioral characteristics of habituation. Neurobiol. Learn. Mem. 2009, 92, 135–138. [Google Scholar] [CrossRef]
- Mormède, P.; Andanson, S.; Aupérin, B.; Beerda, B.; Guémené, D.; Malmkvist, J.; Manteca, X.; Manteuffel, G.; Prunet, P.; van Reenen, C.G.; et al. Exploration of the hypothalamic–pituitary–adrenal function as a tool to evaluate animal welfare. Physiol. Behav. 2007, 92, 317–339. [Google Scholar] [CrossRef]
- Mifsud, K.R.; Reul, J.M.H.M. Mineralocorticoid and glucocorticoid receptor-mediated control of genomic responses to stress in the brain. Stress 2018, 21, 389–402. [Google Scholar] [CrossRef]
- Spencer, R.; Deak, T. A users guide to HPA axis research. Physiol. Behav. 2017, 178, 43–65. [Google Scholar] [CrossRef]
- Harvey, S.; Phillips, J.G.; Rees, A.; Hall, T.R. Stress and adrenal function. J. Exp. Zool. 1984, 232, 633–645. [Google Scholar] [CrossRef]
- Smith, S.M.; Vale, W.W. The role of the hypothalamic-pituitary-adrenal axis in neuroendocrine responses to stress. Dialogues Clin. Neurosci. 2006, 8, 383–395. [Google Scholar] [CrossRef]
- Carroll, J.A.; Burdick Sanchez, N.C. Overlapping physiological responses and endocrine biomarkers that are indicative of stress responsiveness and immune function in beef cattle. J. Anim. Sci. 2014, 92, 5311–5318. [Google Scholar] [CrossRef] [PubMed]
- Vitku, J.; Kolatorova, L.; Hampl, R. Occurrence and reproductive roles of hormones in seminal plasma. Basic Clin. Androl. 2017, 27, 19. [Google Scholar] [CrossRef]
- Thun, R.; Eggenberger, E.; Zerobin, K.; Lüscher, T.; Vetter, W. Twenty-four-hour secretory pattern of cortisol in the bull: Evidence of episodic secretion and circadian rhythm. Endocrinology 1981, 109, 2208–2212. [Google Scholar] [CrossRef]
- Blum, J.W.; Jans, F.; Moses, W.; Fröhli, D.; Zemp, M.; Wanner, M.; Hart, I.C.; Thun, R.; Keller, U. Twenty-four-hour pattern of blood hormone and metabolite concentrations in high-yielding dairy cows: Effects of feeding low or high amounts of starch, or crystalline fat. Zentralbl. Veterinarmed. A 1985, 32, 401–418. [Google Scholar] [CrossRef]
- Pascual-Le Tallec, L.; Lombès, M. The Mineralocorticoid Receptor: A Journey Exploring Its Diversity and Specificity of Action. Mol. Endocrinol. 2005, 19, 2211–2221. [Google Scholar] [CrossRef]
- Smoak, K.A.; Cidlowski, J.A. Mechanisms of glucocorticoid receptor signaling during inflammation. Mech. Ageing Dev. 2004, 125, 697–706. [Google Scholar] [CrossRef] [PubMed]
- Heim, C.; Ehlert, U.; Hellhammer, D.H. The potential role of hypocortisolism in the pathophysiology of stress-related bodily disorders. Psychoneuroendocrinology 2000, 25, 1–35. [Google Scholar] [CrossRef] [PubMed]
- Spencer, R.; Kalman, B.; Dhabhar, F. Role of Endogenous Glucocorticoids in Immune System Function: Regulation and Counterregulation; John Wiley & Sons: Hoboken, NJ, USA, 2011. [Google Scholar]
- Romero, L.M.; Dickens, M.J.; Cyr, N.E. The reactive scope model—A new model integrating homeostasis, allostasis, and stress. Horm. Behav. 2009, 55, 375–389. [Google Scholar] [CrossRef] [PubMed]
- Fernandez-Novo, A.; Pérez-Garnelo, S.S.; Villagrá, A.; Pérez-Villalobos, N.; Astiz, S. The Effect of Stress on Reproduction and Reproductive Technologies in Beef Cattle—A Review. Animals 2020, 10, 2096. [Google Scholar] [CrossRef]
- Kovács, L.; Jurkovich, V.; Bakony, M.; Szenci, O.; Póti, P.; Tőzsér, J. Welfare implication of measuring heart rate and heart rate variability in dairy cattle: Literature review and conclusions for future research. Animal 2014, 8, 316–330. [Google Scholar] [CrossRef] [PubMed]
- Chu, B.; Marwaha, K.; Sanvictores, T.; Ayers, D. Physiology, Stress Reaction; StatPearls Publishing LLC: Treasure Island, FL, USA, 2022. [Google Scholar]
- McCorry, L.K. Physiology of the autonomic nervous system. Am. J. Pharm. Educ. 2007, 71, 78. [Google Scholar] [CrossRef]
- von Borell, E.; Langbein, J.; Després, G.; Hansen, S.; Leterrier, C.; Marchant-Forde, J.; Marchant-Forde, R.; Minero, M.; Mohr, E.; Prunier, A.; et al. Heart rate variability as a measure of autonomic regulation of cardiac activity for assessing stress and welfare in farm animals—A review. Physiol. Behav. 2007, 92, 293–316. [Google Scholar] [CrossRef] [PubMed]
- Shaffer, F.; Ginsberg, J.P. An Overview of Heart Rate Variability Metrics and Norms. Front. Public Health 2017, 5, 258. [Google Scholar] [CrossRef] [PubMed]
- Collier, R.J.; Renquist, B.J.; Xiao, Y. A 100-Year Review: Stress physiology including heat stress. J. Dairy Sci. 2017, 100, 10367–10380. [Google Scholar] [CrossRef]
- Bruckmaier, R.M. Normal and disturbed milk ejection in dairy cows. Domest. Anim. Endocrinol. 2005, 29, 268–273. [Google Scholar] [CrossRef]
- Buonaiuto, G.; Lopez-Villalobos, N.; Costa, A.; Niero, G.; Degano, L.; Mammi, L.M.E.; Cavallini, D.; Palmonari, A.; Formigoni, A.; Visentin, G. Stayability in Simmental cattle as affected by muscularity and body condition score between calvings. Front. Vet. Sci. 2023, 10, 1141286. [Google Scholar] [CrossRef]
- Nannoni, E.; Buonaiuto, G.; Martelli, G.; Lizzi, G.; Trevisani, G.; Garavini, G.; Sardi, L. Influence of Increased Freedom of Movement on Welfare and Egg Laying Pattern of Hens Kept in Aviaries. Animals 2023, 12, 2307. [Google Scholar] [CrossRef]
- Fazio, F.; Ferrantelli, V.; Cicero, A.; Casella, S.; Piccione, G. Utility of Acute Phase Proteins as Biomarkers of Transport Stress in Ewes and Beef Cattle. Ital. J. Food Saf. 2015, 4, 4210. [Google Scholar] [CrossRef]
- Grandin, T. Auditing animal welfare at slaughter plants. Meat Sci. 2010, 86, 56–65. [Google Scholar] [CrossRef]
- Szenci, O.; Karen, A.; Bajcsy, A.C.; Gáspárdy, A.; de Sousa, N.M.; Beckers, J.F. Effect of restraint stress on plasma concentrations of cortisol, progesterone and pregnancy associated-glycoprotein-1 in pregnant heifers during late embryonic development. Theriogenology 2011, 76, 1380–1385. [Google Scholar] [CrossRef]
- ESVE. ESVE Veterinary Endocrinology External Quality Assessment Scheme. 2019. Available online: https://www.esve.org/esve/eve-qas/default.aspx (accessed on 9 April 2023).
- Hopster, H.; van der Werf, J.T.N.; Erkens, J.H.F.; Blokhuis, H.J. Effects of repeated jugular puncture on plasma cortisol concentrations in loose-housed dairy cows. J. Anim. Sci. 1999, 77, 708–714. [Google Scholar] [CrossRef] [PubMed]
- Giese, H.; Dilly, M.; Gundelach, Y.; Hoffmann, G.; Schmicke, M. Influence of transrectal palpation training on cortisol levels and heart rate variability in cows. Theriogenology 2018, 119, 238–244. [Google Scholar] [CrossRef]
- European Society of Cardiology. Heart rate variability: Standards of measurement, physiological interpretation and clinical use. Task Force of the European Society of Cardiology and the North American Society of Pacing and Electrophysiology. Circulation 1996, 93, 1043–1065. [Google Scholar] [CrossRef]
- Hagen, K.; Langbein, J.; Schmied, C.; Lexer, D.; Waiblinger, S. Heart rate variability in dairy cows—Influences of breed and milking system. Physiol. Behav. 2005, 85, 195–204. [Google Scholar] [CrossRef] [PubMed]
- Kovács, L.; Kézér, F.L.; Póti, P.; Jurkovich, V.; Szenci, O.; Nagy, K. Short communication: Heart rate variability, step, and rumination behavior of dairy cows milked in a rotary milking system. J. Dairy Sci. 2019, 102, 5525–5529. [Google Scholar] [CrossRef]
- Mohr, E.; Langbein, J.; Nürnberg, G. Heart rate variability: A noninvasive approach to measure stress in calves and cows. Physiol. Behav. 2002, 75, 251–259. [Google Scholar] [CrossRef]
- R Core Team. A Language and Environment for Statistical Computing; R Foundation for Statistical Computing: Vienna, Austria, 2022. [Google Scholar]
- Kuznetsova, A.; Brockhoff, P.B.; Christensen, R.H.B. lmerTest Package: Tests in Linear Mixed Effects Models. J. Stat. Softw. 2017, 82, 1–26. [Google Scholar] [CrossRef]
- Wickham, H. ggplot2: Elegant Graphics for Data Analysis; Springer: New York, NY, USA, 2016. [Google Scholar]
- Lay, D.C., Jr.; Friend, T.H.; Randel, R.D.; Jenkins, O.C.; Neuendorff, D.A.; Kapp, G.M.; Bushong, D.M. Adrenocorticotropic hormone dose response and some physiological effects of transportation on pregnant Brahman cattle. J. Anim. Sci. 1996, 74, 1806–1811. [Google Scholar] [CrossRef]
- Kovács, L.; Tőzsér, J.; Szenci, O.; Póti, P.; Kézér, F.L.; Ruff, F.; Gábriel-Tőzsér, G.; Hoffmann, D.; Bakony, M.; Jurkovich, V. Cardiac responses to palpation per rectum in lactating and nonlactating dairy cows. J. Dairy Sci. 2014, 97, 6955–6963. [Google Scholar] [CrossRef]
- Veissier, I.; Le Neindre, P. Cortisol responses to physical and pharmacological stimuli in heifers. Reprod. Nutr. Dev. (1980) 1988, 28, 553–562. [Google Scholar] [CrossRef] [PubMed]
- Chen, Y.; Stookey, J.; Arsenault, R.; Scruten, E.; Griebel, P.; Napper, S. Investigation of the physiological, behavioral, and biochemical responses of cattle to restraint stress1. J. Anim. Sci. 2016, 94, 3240–3254. [Google Scholar] [CrossRef] [PubMed]
- Hopster, H.; Bruckmaier, R.M.; Van der Werf, J.T.N.; Korte, S.M.; Macuhova, J.; Korte-Bouws, G.; van Reenen, C.G. Stress Responses during Milking; Comparing Conventional and Automatic Milking in Primiparous Dairy Cows. J. Dairy Sci. 2002, 85, 3206–3216. [Google Scholar] [CrossRef] [PubMed]
- von Keyserlingk, M.A.G.; Olenick, D.; Weary, D.M. Acute Behavioral Effects of Regrouping Dairy Cows. J. Dairy Sci. 2008, 91, 1011–1016. [Google Scholar] [CrossRef]
- Veronesi, M.C.; Tosi, U.; Villani, M.; Govoni, N.; Faustini, M.; Kindahl, H.; Madej, A.; Carluccio, A. Oxytocin, vasopressin, prostaglandin F2α, luteinizing hormone, testosterone, estrone sulfate, and cortisol plasma concentrations after sexual stimulation in stallions. Theriogenology 2010, 73, 460–467. [Google Scholar] [CrossRef]
- Colborn, D.R.; Thompson, D.L., Jr.; Roth, T.L.; Capehart, J.S.; White, K.L. Responses of cortisol and prolactin to sexual excitement and stress in stallions and geldings. J. Anim. Sci. 1991, 69, 2556–2562. [Google Scholar] [CrossRef]
- Borg, K.E.; Esbenshade, K.L.; Johnson, B.H. Cortisol, growth hormone, and testosterone concentrations during mating behavior in the bull and boar1. J. Anim. Sci. 1991, 69, 3230–3240. [Google Scholar] [CrossRef]
- Pesenhofer, G.; Palme, R.; Pesenhofer, R.M.; Kofler, J. Comparison of two methods of fixation during functional claw trimming-Walk-in crush versus tilt table-In dairy cows using faecal cortisol metabolite concentrations and daily milk yield as parameters. Wien. Tierarztl. Monatsschr. 2006, 93, 288–294. [Google Scholar]
- Heinrich, M.; Muller, H.; Fieseler, H.; Steiner, A.; Gottschalk, J.; Einspanier, A.; Spilke, J.; Mielenz, N.; Palme, R.; Baumgartner, W.; et al. Cortisol concentration before, during and after sham foot trimming in German Holstein cows-the suitability of different matrices. Tierarztl. Prax. Ausg. G Grosstiere Nutztiere 2020, 48, 291–300. [Google Scholar] [CrossRef]
- Herskin, M.S.; Munksgaard, L.; Andersen, J.B. Effects of social isolation and restraint on adrenocortical responses and hypoalgesia in loose-housed dairy cows1. J. Anim. Sci. 2007, 85, 240–247. [Google Scholar] [CrossRef] [PubMed]
- Alam, M.G.; Dobson, H. Effect of various veterinary procedures on plasma concentrations of cortisol, luteinising hormone and prostaglandin F2 alpha metabolite in the cow. Vet. Rec. 1986, 118, 7–10. [Google Scholar] [CrossRef] [PubMed]
- Nakao, T.; Sato, T.; Moriyoshi, M.; Kawata, K. Plasma cortisol response in dairy cows to vaginoscopy, genital palpation per rectum and artificial insemination. J. Vet. Med. Ser. A 1994, 41, 16–21. [Google Scholar] [CrossRef] [PubMed]
- Schönbom, H.; Kassens, A.; Hopster-Iversen, C.; Klewitz, J.; Piechotta, M.; Martinsson, G.; Kißler, A.; Burger, D.; Sieme, H. Influence of transrectal and transabdominal ultrasound examination on salivary cortisol, heart rate, and heart rate variability in mares. Theriogenology 2015, 83, 749–756. [Google Scholar] [CrossRef] [PubMed]


Disclaimer/Publisher’s Note: The statements, opinions and data contained in all publications are solely those of the individual author(s) and contributor(s) and not of MDPI and/or the editor(s). MDPI and/or the editor(s) disclaim responsibility for any injury to people or property resulting from any ideas, methods, instructions or products referred to in the content. |
© 2023 by the authors. Licensee MDPI, Basel, Switzerland. This article is an open access article distributed under the terms and conditions of the Creative Commons Attribution (CC BY) license (https://creativecommons.org/licenses/by/4.0/).
Share and Cite
Koenneker, K.; Schulze, M.; Pieper, L.; Jung, M.; Schmicke, M.; Beyer, F. Comparative Assessment of the Stress Response of Cattle to Common Dairy Management Practices. Animals 2023, 13, 2115. https://doi.org/10.3390/ani13132115
Koenneker K, Schulze M, Pieper L, Jung M, Schmicke M, Beyer F. Comparative Assessment of the Stress Response of Cattle to Common Dairy Management Practices. Animals. 2023; 13(13):2115. https://doi.org/10.3390/ani13132115
Chicago/Turabian StyleKoenneker, Katja, Martin Schulze, Laura Pieper, Markus Jung, Marion Schmicke, and Fritz Beyer. 2023. "Comparative Assessment of the Stress Response of Cattle to Common Dairy Management Practices" Animals 13, no. 13: 2115. https://doi.org/10.3390/ani13132115
APA StyleKoenneker, K., Schulze, M., Pieper, L., Jung, M., Schmicke, M., & Beyer, F. (2023). Comparative Assessment of the Stress Response of Cattle to Common Dairy Management Practices. Animals, 13(13), 2115. https://doi.org/10.3390/ani13132115