Simple Summary
Veneto is one of the most important Italian regions for poultry biodiversity. However, the indigenous population cannot compete, in terms of production, with the commercial lines. The nutritional value significantly varies among the breeds as a consequence of changes in egg composition and size. The variability in terms of egg composition is useful to develop Near-InfraRed spectroscopy calibration models for its prediction.
Abstract
The aims of the present study were to characterize egg composition and develop VIS-Near-infrared spectroscopy (VIS-NIR) models for its predictions in Italian local chicken breeds, namely Padovana Camosciata, Padovana Dorata, Polverara Bianca, Polverara Nera, Pepoi, Ermellinata di Rovigo, Robusta Maculata and Robusta Lionata. Hens were reared in a single conservation center under the same environmental and management conditions. A total of 200 samples (25 samples per breed, two eggs/sample) were analyzed for the composition of albumen and yolk. Prediction models for these traits were developed on both fresh and freeze-dried samples. Eggs of Polverara Nera and Polverara Bianca differed from eggs of the other breeds (p < 0.05) in terms of the greatest moisture content (90.06 ± 1.23% and 89.57 ± 1.31%, respectively) and the lowest protein content (8.34 ± 1.27% and 8.81 ± 1.27%) in the albumen on wet basis. As regards the yolk, Robusta Maculata and Robusta Lionata differed (p < 0.05) from the other breeds, having lower protein content (15.62 ± 1.13% and 15.21 ± 0.63%, respectively) and greater lipid content (34.11 ± 1.12% and 35.30 ± 0.98%) on wet basis. Eggs of Pepoi had greater cholesterol content (1406.39 ± 82.34 mg/100 g) on wet basis compared with Padovana Camosciata, Polverara Bianca and Robusta Maculata (p < 0.05). Spectral data were collected in reflectance mode in the VIS-NIR range (400 to 2500 nm) using DS2500 (Foss, Hillerød, Denmark) on fresh and freeze-dried samples. Models were developed through partial least-squares regression on untreated and pre-treated spectra independently for yolk and albumen, and using several combinations of scattering corrections and mathematical treatments. The predictive ability of the models developed for each compound was evaluated through the coefficient of determination (R2cv), standard error of prediction (SEcv) and the ratio of performance to deviation (RPDcv) in cross-validation. Prediction models performed better for freeze-dried than fresh albumen and yolk. In particular, for the albumen the performance of models using freeze-dried eggs was excellent (R2cv ≥ 0.91), and for yolk it was suitable for the prediction of protein content and dry matter. Good performances of prediction were observed in yolk for dry matter (R2cv = 0.85), lipids and cholesterol (R2cv = 0.74). Overall, the results support the potential of infrared technology to predict the composition of eggs from local hens. Prediction models for proteins, dry matter and lipids of freeze-dried yolk could be used for labelling purposes to promote local breeds through the valorization of nutritional aspects.
1. Introduction
In the last sixty years, the selection of high-performing commercial chickens has hidden the productive characteristics of the local breeds, which are more disadvantageous from a commercial point of view due to the lower oviposition rate. This has had significant effects on the animal production scenario, leading to genetic erosion of local species and breeds through the loss of genetic variability [1,2]. In particular, genetic depletion has characterized the poultry sector, incentivizing production systems based on commercial hybrids in order to reach greater performances for both meat and egg production than the local breeds. Although local breeds are considered less profitable than commercial hybrids, the territoriality of these breeds is a very important resource, mirroring the culture and heritage of the local producers. Moreover, the heterogeneous genetic background of the autochthonous breeds affects the variability of the final product, conferring qualitative traits that differ among breeds.
As cheap and nutritional complete food, egg has been recognized as an essential product of the daily diet of humans, providing almost all the main elements of human nutrition, such as moisture (75%), lipids (12%), proteins (12%), carbohydrates (1.1%) and minerals (0.5%) [3]. Proteins are included, both in egg albumen and yolk, whereas lipids and cholesterol are exclusively found in the yolk. The characterization of egg composition is important to evaluate the nutritional profile on the commercial label.
Local breeds, which have not undergone any genetic selection to improve egg production and quality, are not suitable for intensive farming, as their egg production satisfies only a niche market. They show slow growing rate, delayed onset of laying when compared to commercial hybrids and, overall, they reach adult body weight at 6 months of age or even later [4]. However, these breeds can be valorized for their meat production both for males and females, after their egg production cycle. Breeds laying white-shell eggs, especially Padovana, which shows a poor muscle growth, produce meat appreciated for the peculiar traits and used for typical cooking preparations [4]. Breeds laying tinted-shell eggs have body weight ranging from 1 kg (Pepoi) to 3.3 kg (Robusta Lionata), and the carcass shows an appreciable muscle development [5,6].
Generally, egg composition is determined through laboratory analyses which, despite having high accuracy, are time-consuming, require skilled personnel and sample destruction, and are not applicable on a large scale [7]. The development of bioinformatics approaches and emerging technologies has made spectral analysis an important technique in the food sector [7]. VIS-Near-InfraRed spectroscopy (VIS-NIR) is a technique with a wide range of applications in food, such as the determination of the composition of products. This technology is cheap, sample preparation is easy, and the analysis is non-destructive. In the last decade, the VIS-NIR has been widely used to determine egg quality [3], freshness [7], blood and meat spots [8] and egg-shell composition [9], and also to detect infertile and non-hatchable eggs [9]. Currently, the importance of eggs from hybrid hens has marginalized the potential interest that the local breeds could have. To the best of our knowledge, nobody has attempted to develop VIS-NIR models to predict the composition of eggs from local breeds. Therefore, this study aimed to characterize the egg composition of eight local chicken breeds of the Veneto region (Northern Italy) and to investigate the ability of VIS-NIR to predict the composition traits.
2. Materials and Methods
2.1. Hens and Farming Conditions
Hens were located in the Conservation Centre “Sasse Rami” (Ceregnano, Italy) managed by Veneto Agricoltura Agency and were drawn from 8 local breeds, namely Padovana Camosciata (PA-C, chamois plumage), Padovana Dorata (PA-G, golden plumage), Polverara Bianca (PO-W, white plumage), Polverara Nera (PO-B, black plumage), Pepoi (PP), Ermellinata di Rovigo (ER), Robusta Maculata (RM) and Robusta Lionata (RL) (Figure 1). The first four breeds produce white-shell eggs, whereas the latter four breeds lay tinted-shell eggs. The PA-C, PA-G, PO-B and PO-W are recognized as egg-type breeds, whereas the other are dual-purpose (egg and meat) breeds.
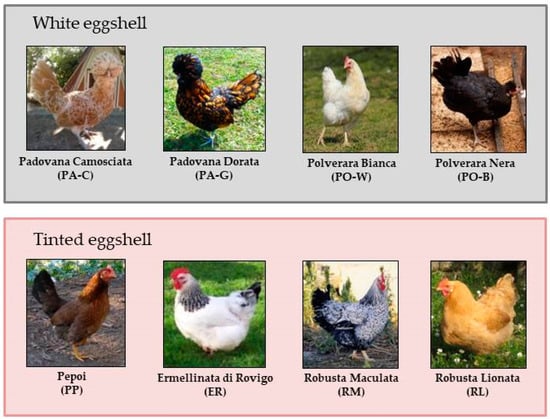
Figure 1.
Local chicken breeds involved in the trial grouped according to eggshell color.
Each breed was reared in a free-range area of about 300 m2 (5 m2/hen), equipped with linear drinkers, and hens had access to a wooden structure of 15 m2 (approximately 0.25 m2/hen) and 1 m2 of space occupied by the collective nest, with litter made of wood shavings. The wooden structure was equipped with perches, circular feeders and artificial light for complementing the natural photoperiod. The light cycle, according to the period of the year, was regulated by a timer to obtain an increasing photoperiod up to 14 h of light at the time of eggs collection, which was achieved by turning on the light one hour before sunrise and turning off it one hour after sunset. The hens were free to enter and leave the wooden structure, which they used mainly during the night, feeding, laying and in case of bad weather.
The diet was composed of commercial feed, consisting mainly of maize and soybean. The hens were fed ad libitum, starting from the laying period using pelleted feed (composition, % as-fed basis: crude protein = 16.2, Ca = 4.2, p = 0.6, lysine = 0.7, methionine = 0.3). The metabolizable energy was 11.5 MJ/kg. Feeding, rearing conditions (temperature, photoperiod) and prophylaxis procedures were the same for all breeds from the time of hatching until the end of the testing period.
2.2. Sampling and Chemical Analysis of the Eggs
The eggs were collected according to the European Regulations (EC No. 1/2005 and EC No. 1099/2009) on animal care and welfare. The sampling did not affect the welfare of the hens as it was carried out when the animals were not in the nests, thus avoiding their handling. For this study, 60 hens per breed were sampled. Hens averaged 50 weeks of age (with very small variation, from 49 to 51 weeks of age). Fifty eggs per breed across 4 consecutive days (about 13 eggs/breed/day) were collected, which resulted in a total of 400 eggs collected during the trial and 200 final samples (25 samples/breed) used for composition analyses, since each sample was composed of two eggs. Indeed, albumens and yolks of eggs collected during the trial were freeze-dried, and albumen (pool of albumens from two eggs) and yolk samples (pool of yolks from two eggs) were separately frozen at −20 °C. Samples were analyzed for moisture, proteins, lipids and ash according to the official AOAC analytical methods. Albumen and yolk dry matter [AOAC 925.30], proteins [AOAC 925.31], ash [AOAC 920.153] and total lipid contents [AOAC 991.31] were determined [10]. For cholesterol determination, tubes containing freeze-dried yolk samples (100 mg) were added with 5 mL of ethanol (95%) (Sigma-Aldrich, Burlington, NJ, USA) and 2 mL of KOH (Sigma-Aldrich, Burlington, NJ, USA), placed in a water bath at 70 °C and shaken for 10 min. After cooling at room temperature, 1 mL of internal standard (pregnenolone-ethanol; Sigma-Aldrich, Burlington, NJ, USA) and 35 mL of hexane-ethyl ether (Sigma-Aldrich, Burlington, NJ, USA) were added. After the addition of 20 mL of deionized water, samples were centrifugated. An aliquot of the supernatant organic phase (25 mL) was taken and dried in a rotating evaporator kept in a water bath at 35 °C (ASAL, Milano, IT). Then, 5 mL of the mobile phase was analyzed by GC-FID (Agilent, Santa Clara, CA, USA) [11].
2.3. Near-InfraRed Spectra Collection
Individual spectra were collected on the albumen and the yolk separately, both on fresh and freeze-dried samples. Each part of the egg was placed in a large sample cup (diameter 105 mm, depth 35 mm) and scanned with NIRS DS2500 (FOSS Electric A/S, Hillerød, Denmark) every 0.5 nm, from 400 to 2500 nm wavelength, at room temperature. Spectra were collected through ISIscan Nova and Mosaic software (FOSS Electric A/S, Hillerød, Denmark) and recorded as log(1/reflectance).
2.4. Chemometric Data Analysis
Spectral chemometric analysis was performed using WinISI software (Infrasoft International, Port Matilda, PA, USA). Four different prediction equations were developed for albumen and yolk, for both fresh and freeze-dried samples, using the modified partial least-squares (PLS) regression. To avoid overfitting, the PLS regressions were performed with five cross-validation steps and the number of PLS terms was limited to a maximum of ten. Spectral samples with a predicted value that differed more than 2.5 standard deviations from the reference value were excluded from the dataset (outliers). Several combinations of scatter corrections (NONE, no correction; SNV, standard normal variate; SNV_D, standard normal variate-detrending; MSC, multiplicative scatter correction) and derivative mathematical treatments (0, 0, 1, 1; 1, 4, 4, 1; 2, 5, 5, 1; where the first digit is the number of the derivative, the second is the gap over which the derivative is calculated, the third is the number of data points in the first smoothing and the fourth is the number of data points in the second smoothing) were tested. The performances of the prediction models were evaluated through the standard error of calibration (SEC) and cross-validation (SECV); the coefficient of determination of calibration (R2C) and cross-validation (R2CV); and the residual predictive deviation of cross-validation (RPDCV), calculated as the ratio between SD and SECV [12].
2.5. Statistical Analysis and Data Visualization
Normal distribution of the investigated traits was assessed through Shapiro–Wilk test and visual inspection of the normal plot. All traits were normally distributed and thus were analyzed through one-way analysis of variance, considering the effect of the breed. The same statistical approach was used to test differences between the composition of white versus tinted eggshell breeds. A multiple comparison of means was performed for the effect of breed, using Tukey’s post hoc test. Significance was set at p < 0.05, unless otherwise stated. All statistical analyses were carried out using R software version 4.04 [13]. Data were visualized by R package ggplot2 [14].
3. Results
3.1. Composition of Albumen and Yolk
Table 1 reports the least-squares means of the composition of the albumen. PP and RL had the greatest protein wet basis content (9.73 ± 0.71% and 9.72 ± 0.61%, respectively), and differed from PA-C, PO-B and PO-W breeds (p < 0.05). On the contrary, PP and RL had the lowest moisture content (88.63 ± 0.88% and 88.60 ± 0.78%), and differed from PA-C, PO-B, PO-W and RM (p < 0.05), with the greatest moisture observed for PO-B (90.06 ± 1.23%). As regards ash content, the only significant difference was observed between ER (0.72 ± 0.06%) and PO-B (0.67 ± 0.06%; p < 0.05).

Table 1.
Least-squares means and standard error of composition of albumen for the breed effect.
According to the yolk wet basis composition (Table 2), eggs of PA-C (16.55 ± 0.34%) and PO-W (16.57 ± 0.31%) had the greatest protein content, whereas eggs of RL (15.21 ± 0.63%) and RM (15.62 ± 1.13%) had the lowest protein content (p < 0.05). Moisture content was greater in eggs of PA-C and PP (50.11 ± 0.83% and 50.08 ± 1.04%, respectively) than ER (48.64 ± 0.85%), PO-B (48.86 ± 0.74%), PO-W (48.98 ± 0.72%), RL (48.55 ± 0.58%) and RM (49.14 ± 0.84%) (p < 0.05). The greatest lipid wet basis content was for RL (35.30 ± 0.98%) and it differed from the lipid content of all the other breeds (p < 0.05), with the lowest content observed for PA-C and PP (32.14 ± 0.93% and 32.73 ± 1.11%, respectively). Nevertheless, cholesterol content on a wet basis was the greatest in PP yolk (1406.39 ± 82.34 mg/100 g) and it differed from that of PA-C (1243.81 ± 134.13 mg/100 g), PO-W (1227.08 ± 71.14 mg/100 g) and RM (1262.27 ± 84.12 mg/100 g) (p < 0.05). The greatest wet basis ash content was observed in PA-G (1.89 ± 0.21%) and the lowest were seen in PO-B (1.67 ± 0.24%), PO-W (1.71 ± 0.21%) and RL (1.71 ± 0.15%) (p < 0.05). The same differences were observed for dry matter.
Table 2.
Least-squares means and standard error of composition of yolk for the breed effect.
3.2. Differences in Chemical Composition between White and Tinted Eggshell Breeds
Differences in composition between white eggshell (PA-C, PA-G, PO-W, PO-B) and tinted eggshell breeds (ER, RM, RL, PP) were investigated. Figure 2 depicts boxplots with the comparison of protein, moisture, dry matter and ash of albumen between the two groups. The violin plot has been integrated into boxplots to show the data distribution. Protein content and dry matter were greater in eggs with tinted shells (p < 0.001), whereas moisture content was greater in eggs with white shells (p < 0.001). Ash content did not differ between the two groups (Figure 2).
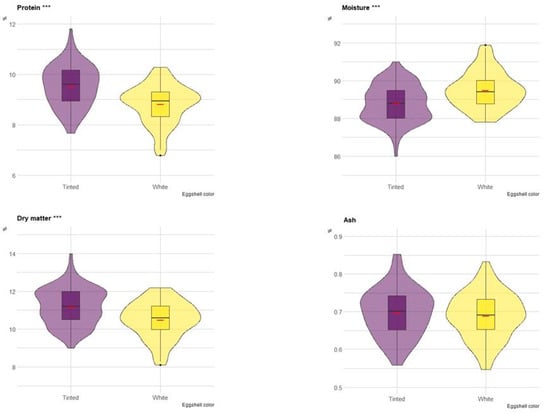
Figure 2.
Boxplot of the composition (on a wet basis) of albumen in eggs of tinted (violet) and white (yellow) shell. Red dash indicates mean value. The violin blot represents the data distribution. *** p < 0.001.
Figure 3 depicts the boxplots of the yolk content of eggs with white and tinted shells. In particular, lipid content (p < 0.001) and cholesterol content (p < 0.01) were greater in eggs with tinted than white shells. Conversely, the protein content was significantly greater in eggs with white than tinted shells. Moisture, dry matter and ash did not differ between the two groups (Figure 3).
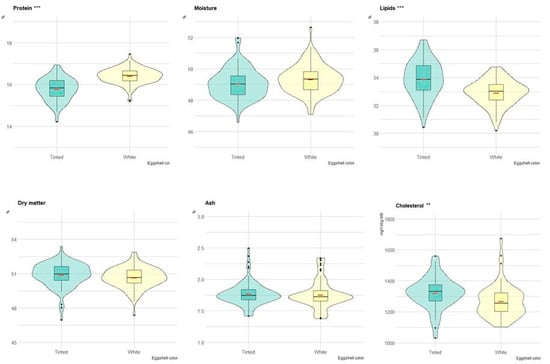
Figure 3.
Boxplot of the composition (on a wet basis) of yolk in eggs of tinted (violet) and white (yellow) shell. Red dash indicates mean value. The violin blot represents the data distribution. ** p < 0.01; *** p < 0.001.
3.3. Prediction Models
Independent calibrations were performed for the fresh and freeze-dried eggs. The performance statistics of the best VIS-NIR prediction of fresh and freeze-dried albumen and yolk samples are reported in Table 3 and Table 4, respectively. The number of terms ranged from 5 to 9 for albumen and 1 to 9 for yolk. In general, among the calibration models tested, the optimal prediction equations were mainly composed by NONE scatter, SNV_D and MSC, and half of the best equations were developed using the first derivative with a gap of four data points.
Table 3.
Calibration and cross-validation statistics for modified partial least-squares regression models developed to predict the composition of fresh and freeze-dried albumen.
Table 4.
Calibration and cross-validation statistics for modified partial least-squares regression models developed to predict the composition of fresh and freeze-dried yolk.
In general, the best performance of prediction was obtained for the freeze-dried product in which the RPDCV for dry matter in albumen was 4.47, and in which it was 3.48 and 2.68 for protein and dry matter in yolk, respectively. On the other hand, RPDCV lower than 2 was reported for all composition traits in the fresh yolk, and also for ash (% DM), lipids and cholesterol in the freeze-dried yolk. In albumen, all traits reported RPDCV lower than 2, with the exception of the dry matter in freeze-dried albumen.
4. Discussion
4.1. Chemical Composition
The importance of the genotype (hybrids, local breeds) to explain the variation of egg composition has been reported in the literature [15]. The characterization and valorization of local breeds through the qualitative aspects of the product is a viable strategy to protect and promote poultry biodiversity. The amount of protein in albumen reported for PA-G, PP and RL in the present study was greater than that observed in the literature for commercial hybrids [16,17]. In the current trial, proteins of the albumen varied among breeds, being 12% greater in PP and RL than in PA-C, PO-B and PO-W. For the albumen ash, differences among the breeds were about 7% (ER vs. PO-B). For the yolk, changes of about 7–8% were observed for the protein and lipid contents between some white and tinted eggshell breeds: eggs of PO-W and PA-C (white eggshell breeds) had greater protein content than eggs of RL and RM (tinted eggshell breeds), and the contrary was true for the lipids (RL vs. PO-W). Lipid content of RL eggs was greater also than in PP, a tinted eggshell breed, but these eggs also had very high shell lightness. The greatest variations among the breeds were observed for the yolk ash (13%) and cholesterol content (12%): ash varied between PA and PO, and cholesterol between PP and PA-C, but it differed also from RM. In detail, the content of protein, ash and dry matter in the eggs of the investigated local breeds was similar to that observed in two Italian native breeds of the Emilia Romagna region (Modenese and Romagnolo) [17]. Moreover, Zanon et al. [17] reported that local breeds produced eggs with greater protein content (+5.7%) and lower ether extract content (-5.3%) in yolk than the commercial white and tinted eggshell hybrids. Ianni et al. [1] compared the cholesterol and lipid content of the yolk between the Nera Atriana local breed and a commercial hybrid, and the differences were not significant. However, the results of the present study highlighted that PP had greater cholesterol and lower lipid content than those observed for commercial hybrids in the study of Ianni et al. [1].
In the study of Lordelo et al. [18], eggs from hybrid hens had greater albumen and lower yolk percentage when compared to eggs from local hens. The percentage of albumen was greater also in eggs of commercial hybrids than local hens in Rizzi and Marangon [19]. Overall, differences between eggs of local breeds and hybrids are often related to the albumen [17,18,19,20,21]. In particular, the water content is greater in the albumen of hybrid hens, likely as a consequence of the genetic improvement in the weight of the egg, which has led to an increase in the water content of the albumen [19]. A comparison, conducted between the composition of eggs from the current trial with that of hybrid hens with similar egg size, supports there being a greater amount of water in the albumen of commercial eggs [19]. Overall, comparisons among studies should be performed with caution, as egg composition varies according to the breed, its laying rate, feeding and, in general, environmental conditions.
The different eggshell color of the eggs laid by the hens, as influenced by their different genetic origin, also reflects different body size and metabolism, which in turn affect the egg formation and production. The cholesterol content may be affected by the laying rate, as reported in the literature [22]. At the age of egg sampling, the PP hens showed a laying rate lower than that of the other breeds, which exhibited a dilution effect for the cholesterol content. Differences in egg composition (moisture, fat and protein contents) observed across the local breeds are, at least partly, related to the genetic background of the hens [2]. Whereas, as expected, similarities were observed between Polverara and Padovana breeds due to their close genetic background [2].
Overall, the composition of both albumen and yolk differed among breeds. Considering the eggshell color, the expected difference in the composition of the eggs has been already demonstrated in previous studies on various species [23,24]. The chemical outcome seems to underline a better nutritional profile of eggs with tinted shells in terms of greater protein content in albumen. However, the yolk had greater amount of lipids and cholesterol than the yolk of white-shell eggs. The color of the eggshell is controlled by several genes that encode proteins and enzymes, thereby regulating the production and deposition of pigment into the shell [25]. Thus, the differences can be explained by the genetics of the breeds. Samiullah et al. (2015) [25] reported that eggshell and egg internal quality are influenced by various factors such as egg weight, shell weight, specific gravity, shell breaking strength, shell deformation, shell thickness, albumen height and yolk color. However, tinted eggshell color is positively correlated with some shell characteristics, such as shell strength and hatchability [26]. Further, it has been suggested that some shell quality features such as strength, weight, consistency and ultrastructure can be assessed via shell color because of significant correlations between the shell quality index and shell color [27,28]. However, other authors have reported inconsistent results in this regard [29,30], and therefore shell color cannot be applied reliably as a quality assessment tool [26].
4.2. VIS-NIR Prediction Models
The ability of VIS-NIR to predict the composition of eggs has been evaluated in commercial hens [31]. However, to the best of our knowledge, no previous studies have assessed the prediction capability of VIS-NIR for the composition of eggs from local chicken breeds. The best performance of prediction was observed for freeze-dried yolk and albumen (Table 3 and Table 4, respectively), which was likely due to the instability of the moisture in the fresh samples exposed to the ambient air during the spectra acquisition. Moreover, the divergences among the trait prediction between fresh and freeze-dried samples could be mostly attributed to a scattering effect due to the nature of the product [32]. In particular, the presence of high amounts of water in food matrices masks the peaks of the spectrum of the other chemical components; whereas, low water content allows us to detect the peaks of the functional groups easily [33]. Therefore, the performance of the prediction models on dehydrated samples improved.
In fresh yolk, the performance of prediction for protein (R2CV = 0.68) and for lipids (R2CV = 0.59) indicate an approximative quantification and a discriminative capability, respectively [34,35,36]. Considering the performance observed for cholesterol, and as reported in the study of Dalle Zotte et al. (2006) [36], the unpredictability of this trait was expected due to the low concentration (~0.02%) close to the limit of sensitivity (<0.1%) of infrared spectroscopy [36]. Similarly, the performance of predictions in fresh albumen (Table 3) which were observed for dry matter (R2CV = 0.73) and protein (R2CV = 0.66) suggest an approximative quantification of the models. More satisfying predictions were obtained in freeze-dried albumen and yolk, except for protein, due to the lower amount of water. In detail, dry matter and protein models in the freeze-dried yolk are considered good and excellent for quality control and for practical purposes, respectively [35]. Conversely, the lipid calibration indicated an approximative quantification of such a trait. Moreover, in freeze-dried albumen an excellent prediction was obtained for dry matter, and thus such a prediction model can be used for quantitative purposes in the substitution of chemical laboratory analysis. The overall incapability of VIS-NIR to predict ash content is due to the non-interaction between VIS-NIR radiation and inorganic compounds, as previously reported in eggs and other food products [36,37,38,39]. Similar to our study, Dalle Zotte et al. (2006) [36] reported that lipid and cholesterol contents of freeze-dried yolk were better predicted using SNV_D scatter correction as the optimum pretreatment. Some discrepancies were observed in the mathematical equations selected for the prediction of protein, ash and dry matter content between the current study and that of Dalle Zotte et al. (2006) [36]. Overall, the present study reported better prediction performance for dry matter and protein in freeze-dried yolk compared to the aforementioned study. Divergences in protein could be related to the indirect determination method, i.e., its calculation as difference from moisture, ash and lipids, compared to the direct quantification methods of the present study. Zhao et al. (2018) [31] proposed independent prediction equations for yolk and albumen, and they reported worse performances in external validation for protein (R2 = 0.81) and moisture content (R2 = 0.76), which was probably due to the different type of validation approach used [40].
5. Conclusions
The present study has characterized the composition of the eggs from eight local chicken breeds of the Veneto region and has developed calibration models for its prediction. The composition of the egg is certainly important to valorize autochthonous chicken breeds and contribute to their conservation. The VIS-NIR models, developed in the current study, can be helpful for this purpose. Indeed, they can provide fast, relatively cheap and, overall, satisfactory predictions for composition traits, thus allowing us to discriminate between high and low trait concentrations in the egg, and thus for breed traceability. Moreover, calibration models may provide a useful tool to discriminate between commercial and local products according to their composition. Therefore, future studies should consider commercial lines to improve fitting statistics of the prediction models and investigate the ability of the models to discriminate between commercial and local chicken breeds according to the composition of their eggs.
Author Contributions
Conceptualization, F.C. and S.C.; methodology, M.P. and C.R.; software, S.C. and F.C..; validation, S.C.; formal analysis, F.C. and S.C.; investigation, C.R. and M.P.; resources, C.R. and M.C.; data curation, F.C., S.C. and C.R.; writing—original draft preparation, F.C. and S.C.; writing—review and editing, F.C., S.C., C.R., M.P. and M.C.; visualization, F.C.; supervision, M.C. and M.P.; project administration, M.P. and M.C.; funding acquisition, M.C. All authors have read and agreed to the published version of the manuscript.
Funding
This work was supported by the project “Protection of biodiversity of Italian poultry breeds—TuBAvI”, funded by the Ministry of Agricultural, Food and Forestry Policies (Italy) in the framework of the PSRN 2014-2020, sub-measure 10.2 “Support for sustainable conservation, use and development of genetic resources in agriculture”.
Institutional Review Board Statement
The eggs used for this research were collected in the Conservation Center “Sasse Rami” (Ceregnano, Italy) according to the European Regulations (EC No. 1/2005 and EC No. 1099/2009) on animal care and welfare. The sampling did not affect the welfare of the hens as it was carried out when the animals were not in the nests, thus avoiding their handling.
Data Availability Statement
Not applicable.
Acknowledgments
We would like to thank the Conservation Center “Sasse Rami” (Ceregnano, Italy) for technical support and the “LaChi” laboratory of the Department of Agronomy, Food, Natural resources, Animals and Environment (University of Padova) for composition analyses.
Conflicts of Interest
The authors declare no conflict of interest.
References
- Ianni, A.; Bartolini, D.; Bennato, F.; Martino, G. Egg quality from Nera Atriana, a local poultry breed of the Abruzzo Region (Italy), and ISA Brown hens reared under free range conditions. Animals 2021, 11, 257. [Google Scholar] [CrossRef] [PubMed]
- Cendron, F.; Perini, F.; Mastrangelo, S.; Tolone, M.; Criscione, A.; Bordonaro, S.; Cassandro, M. Genome-wide SNP analysis reveals the population structure and the conservation status of 23 Italian chicken breeds. Animals 2020, 10, 1441. [Google Scholar] [CrossRef] [PubMed]
- U.S. Department of Agriculture (USDA). Available online: https://fdc.nal.usda.gov/fdc-app.html#/food-details/173424/nutrients (accessed on 23 September 2022).
- Verdiglione, R.; Cassandro, M. Characterization of muscle fiber type in the pectoralis major muscle of slow-growing local and commercial chicken strains. Poult. Sci. 2013, 92, 2433–2437. [Google Scholar] [CrossRef] [PubMed]
- Zanetti, E.; De Marchi, M.; Dalvit, C.; Molette, C.; Remignon, H.; Cassandro, M. Carcase characteristics and qualitative meat traits of three Italian local chicken breeds. Br. Poult. Sci. 2010, 51, 629–634. [Google Scholar] [CrossRef][Green Version]
- Perini, F.; Cendron, F.; Lasagna, E.; Cassandro, M. Morphological and genetic characterization of 13 Italian local chicken breeds. Acta Fytotechn. Zootechn. 2020, 23, 137–143. [Google Scholar] [CrossRef]
- Wang, F.; Lin, H.; Xu, P.; Bi, X.; Sun, L. Egg Freshness Evaluation Using Transmission and Reflection of NIR Spectroscopy Coupled Multivariate Analysis. Foods 2021, 10, 2176. [Google Scholar] [CrossRef]
- Galiş, A.; Dale, L.; Boudry, C.; Théwis, A. The potential use of near-infrared spectroscopy for the quality assessment of eggs and egg products. Scientific Works. C Series. Vet. Med. 2012, 58, 285–298. [Google Scholar]
- Zhao, Q.; Ban, L.; Zheng, J.; Xu, G.; Ning, Z.; Qu, L. Potential use of spectroscopic techniques for assessing table eggs and hatching eggs. Poult. Sci. J. 2019, 75, 445–456. [Google Scholar] [CrossRef]
- AOAC. Official Methods of Analysis, 20th ed.; AOAC International: Rockville, MA, USA, 2016. [Google Scholar]
- Park, J.M.; Jeong, I.S.; Kwak, B.M.; Ahn, J.H.; Leem, D.; Jeong, J.; Kim, J.M. Application of rapid sample preparation method and monitoring for cholesterol content in chicken egg and egg powder. Food Sci. Anim. Resour. 2013, 33, 672–677. [Google Scholar] [CrossRef][Green Version]
- Williams, P.C.; Sobering, D.C. Comparison of commercial near infrared transmittance and reflectance instruments for analysis of whole grains and seeds. JNIRS 1993, 1, 25–32. [Google Scholar] [CrossRef]
- R Core Team. R: A Language and Environment for Statistical Computing; R Foundation for Statistical Computing: Vienna, Austria, 2022; Available online: https://www.R-project.org/ (accessed on 3 October 2022).
- Wickham, H.; Chang, W.; Wickham, M.H. Package ‘ggplot2’. Create elegant data visualisations using the grammar of graphics. Versio 2016, 2, 1–189. [Google Scholar]
- Rizzi, C.; Chiericato, G.M. Chemical composition of meat and egg yolk of hybrid and Italian breed hens reared using an organic production system. Poult. Sci. 2010, 89, 1239–1251. [Google Scholar] [CrossRef] [PubMed]
- Werner, R.; Caswell, B.; Maleta, K.; Stewart, C. Comparison of the nutrient content of eggs from commercial and village chickens in rural Malawi (P03-009-19). AJCN 2019, 3, nzz047-P03. [Google Scholar] [CrossRef]
- Zanon, A.; Beretti, V.; Superchi, P.; Zambini, E.M.; Sabbioni, A. Physico-chemical characteristics of eggs from two Italian autochthonous chicken breeds: Modenese and Romagnolo. Worlds Poult Sci. J. 2006, 62, 203. [Google Scholar]
- Lordelo, M.; Cid, J.; Cordovil, C.M.; Alves, S.P.; Bessa, R.J.; Carolino, I. A comparison between the quality of eggs from indigenous chicken breeds and that from commercial layers. Poult. Sci. 2020, 99, 1768–1776. [Google Scholar] [CrossRef]
- Rizzi, C.; Marangon, A. Quality of organic eggs of hybrid and Italian breed hens. Poult. Sci. 2012, 91, 2330–2340. [Google Scholar] [CrossRef]
- Van Den Brand, H.; Parmentier, H.K.; Kemp, A.B. Effects of housing system (outdoor vs cages) and age of laying hens on egg characteristics. Br. Poult. Sci. 2004, 45, 745–752. [Google Scholar] [CrossRef]
- Zita, L.; Tůmová, E.; Štolc, L. Effects of genotype, age and their interaction on egg quality in brown-egg laying hens. Acta Vet. Brno. 2009, 78, 85–91. [Google Scholar] [CrossRef]
- Sirri, F.; Zampiga, M.; Soglia, F.; Meluzzi, A.; Cavani, C.; Petracci, M. Quality characterization of eggs from Romagnola hens, an Italian local breed. Poult Sci. 2018, 97, 4131–4136. [Google Scholar] [CrossRef]
- Drabik, K.; Karwowska, M.; Wengerska, K.; Próchniak, T.; Adamczuk, A.; Batkowska, J. The variability of quality traits of table eggs and eggshell mineral composition depending on hens’ breed and eggshell color. Animals 2021, 11, 1204. [Google Scholar] [CrossRef]
- Krystianiak, S.; Kożuszek, R.; Kontecka, H.; Nowaczewski, S. Quality and ultrastructure of eggshell and hatchability of eggs in relation to eggshell colour in pheasants. Anim. Sci. J. 2005, 23, 5–14. [Google Scholar]
- Samiullah, S.; Roberts, J.R.; Chousalkar, K. Eggshell color in brown-egg laying hens—A review. Poult. Sci. 2015, 94, 2566–2575. [Google Scholar] [CrossRef] [PubMed]
- Șekeroğlu, A.; Duman, M. Effect of egg shell colour of broiler parent stocks on hatching results, chickens performance, carcass characteristics, internal organ weights and some stress indicators. Kafkas Univ. Vet. Fak. Derg. 2011, 17, 837–842. [Google Scholar] [CrossRef]
- Yang, H.M.; Wang, Z.Y.; Lu, J. Study on the relationship between eggshell colors and egg quality as well as shell ultrastructure in Yangzhou chicken. Afr. J. Biotechnol. 2009, 8, 2898–2902. [Google Scholar]
- Schreiweis, M.A.; Hester, P.Y.; Settar, P.; Moody, D.E. Identification of quantitative trait loci associated with egg quality, egg production, and body weight in an F2 resource population of chickens 1. Anim. Genet. 2006, 37, 106–112. [Google Scholar] [CrossRef] [PubMed]
- Joseph, N.S.; Robinson, N.A.; Renema, R.A.; Robinson, F.E. Shell quality and color variation in broiler breeder eggs. J. Appl. Poult Res. 1999, 8, 70–74. [Google Scholar] [CrossRef]
- Richards, P.D.G.; Deeming, D.C. Correlation between shell colour and ultrastructure in pheasant eggs. Br. Poult. Sci. 2001, 42, 338–343. [Google Scholar] [CrossRef]
- Kuroki, S.; Kanoo, T.; Itoh, H.; Kamisoyama, H. Nondestructive VIS/NIR spectroscopy estimation of intravitelline vitamin E and cholesterol concentration in hen shell eggs. J. Food Meas. Charact. 2020, 14, 1116–1124. [Google Scholar] [CrossRef]
- Zhao, Q.; Lv, X.; Jia, Y.; Chen, Y.; Xu, G.; Qu, L. Rapid determination of the fat, moisture, and protein contents in homogenized chicken eggs based on near-infrared reflectance spectroscopy. Poult. Sci. 2018, 97, 2239–2245. [Google Scholar] [CrossRef]
- Büning-Pfaue, H. Analysis of water in food by near infrared spectroscopy. Food Chem. 2003, 82, 107–115. [Google Scholar] [CrossRef]
- Karoui, R.; Mouazen, A.M.; Dufour, É.; Pillonel, L.; Picque, D.; Bosset, J.O.; De Baerdemaeker, J. Mid-infrared spectrometry: A tool for the determination of chemical parameters in Emmental cheeses produced during winter. Le Lait 2006, 86, 83–97. [Google Scholar] [CrossRef]
- Sinnaeve, G.; Dardenne, P.; Agneessens, R.; Biston, R. The use of near infrared spectroscopy for the analysis of fresh grass silage. J. Near Infrared Spectrosc. 1994, 2, 79–84. [Google Scholar] [CrossRef]
- Dalle Zotte, A.; Berzaghi, P.; Jansson, L.M.; Andrighetto, I. The use of near-infrared reflectance spectroscopy (NIRS) in the prediction of chemical composition of freeze-dried egg yolk and discrimination between different n−3 PUFA feeding sources. Anim. Feed Sci. Technol. 2006, 128, 108–121. [Google Scholar] [CrossRef]
- Abeni, F.; Bergoglio, G. Characterization of different strains of broiler chicken by carcass measurements, chemical and physical parameters and NIRS on breast muscle. Meat Sci. 2001, 57, 133–137. [Google Scholar] [CrossRef] [PubMed]
- Manuelian, C.L.; Currò, S.; Visentin, G.; Penasa, M.; Cassandro, M.; Dellea, C.; De Marchi, M. At-line prediction of mineral composition of fresh cheeses using near-infrared technologies. J. Dairy Sci. 2017, 100, 6084–6089. [Google Scholar] [CrossRef] [PubMed]
- Alamu, O.; Gbenga-Ilori, A.; Adelabu, M.; Imoize, A.; Ladipo, O. Energy efficiency techniques in ultra-dense wireless heterogeneous networks: An overview and outlook. Int. J. Eng. Sci. 2020, 23, 1308–1326. [Google Scholar] [CrossRef]
- Rácz, A.; Vass, A.; Héberger, K.; Fodor, M. Quantitative determination of coenzyme Q10 from dietary supplements by FT-NIR spectroscopy and statistical analysis. Anal. Bioanal. Chem. 2015, 407, 2887–2898. [Google Scholar] [CrossRef]
Disclaimer/Publisher’s Note: The statements, opinions and data contained in all publications are solely those of the individual author(s) and contributor(s) and not of MDPI and/or the editor(s). MDPI and/or the editor(s) disclaim responsibility for any injury to people or property resulting from any ideas, methods, instructions or products referred to in the content. |
© 2022 by the authors. Licensee MDPI, Basel, Switzerland. This article is an open access article distributed under the terms and conditions of the Creative Commons Attribution (CC BY) license (https://creativecommons.org/licenses/by/4.0/).