
Metabolomics Reveals the Effects of High Dietary Energy Density on the Metabolism of Transition Angus Cows

Abstract
:Simple Summary
Abstract
1. Introduction
2. Materials and Methods
2.1. Animal and Experimental Design
2.2. Collection and Analysis of Plasma
2.3. Metabolite Extraction and LC–MS/MS Analysis
2.4. Statistical Analysis
3. Results
3.1. Plasma Parameters
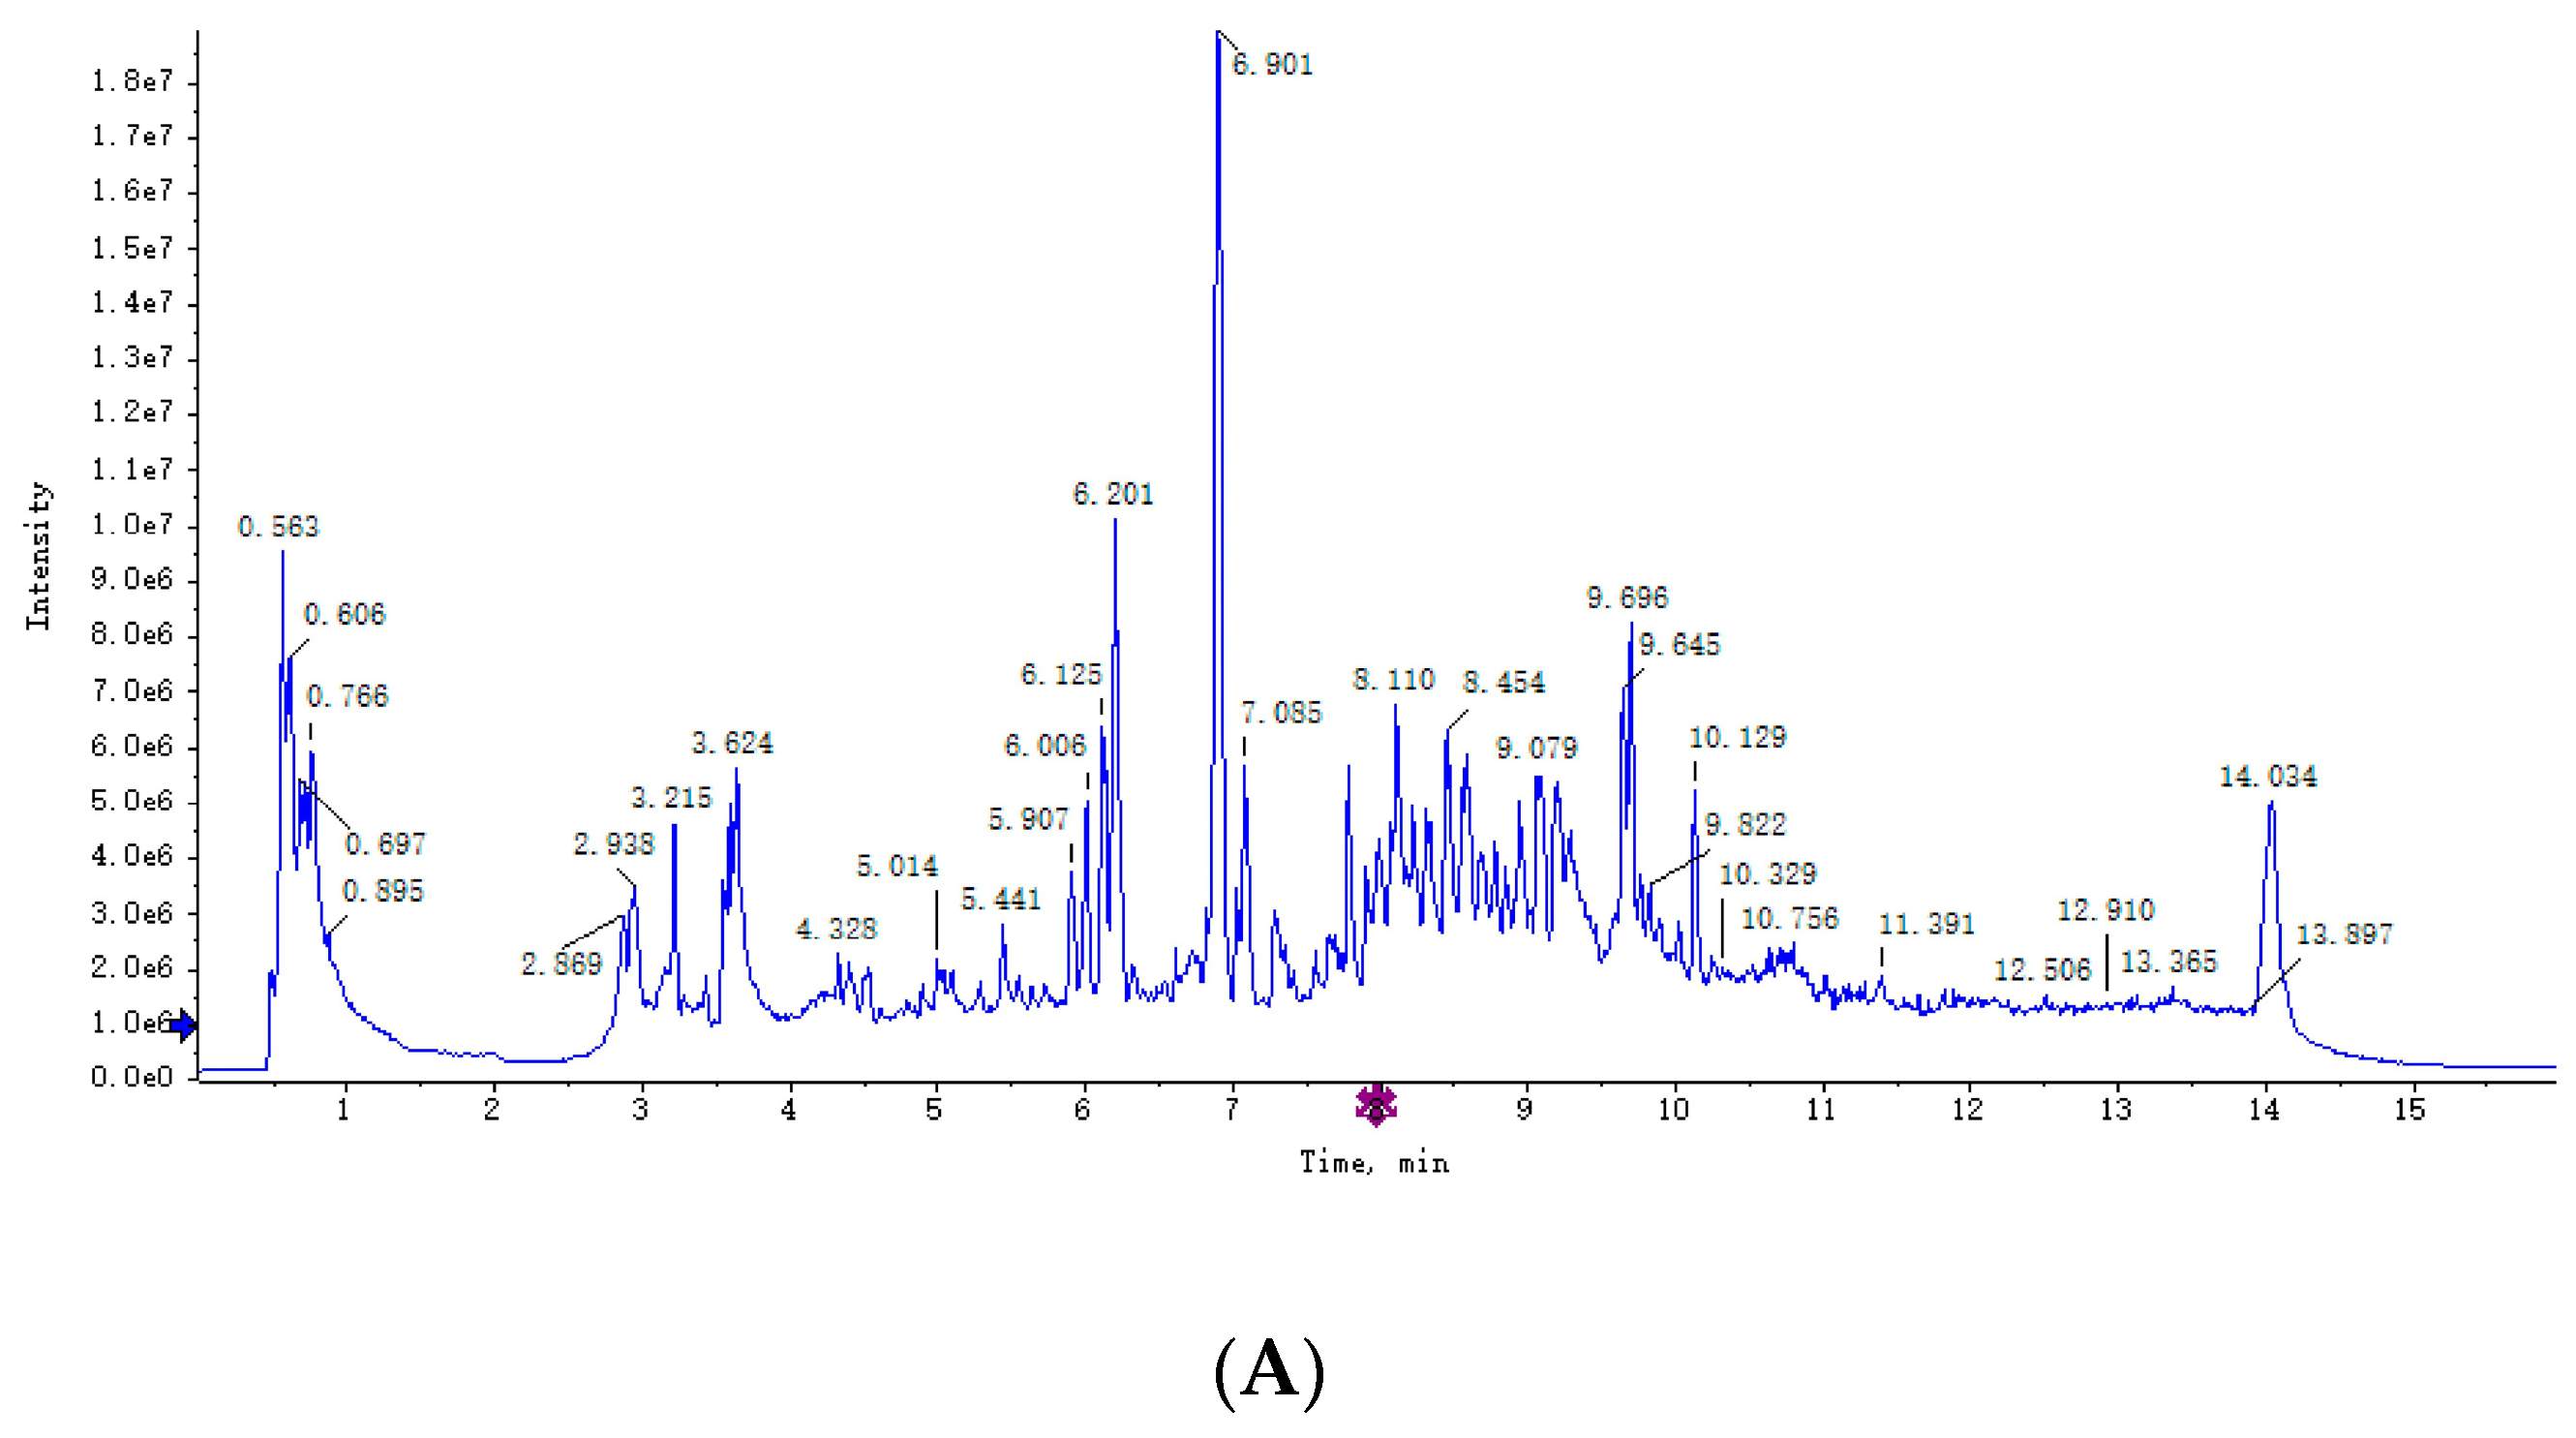
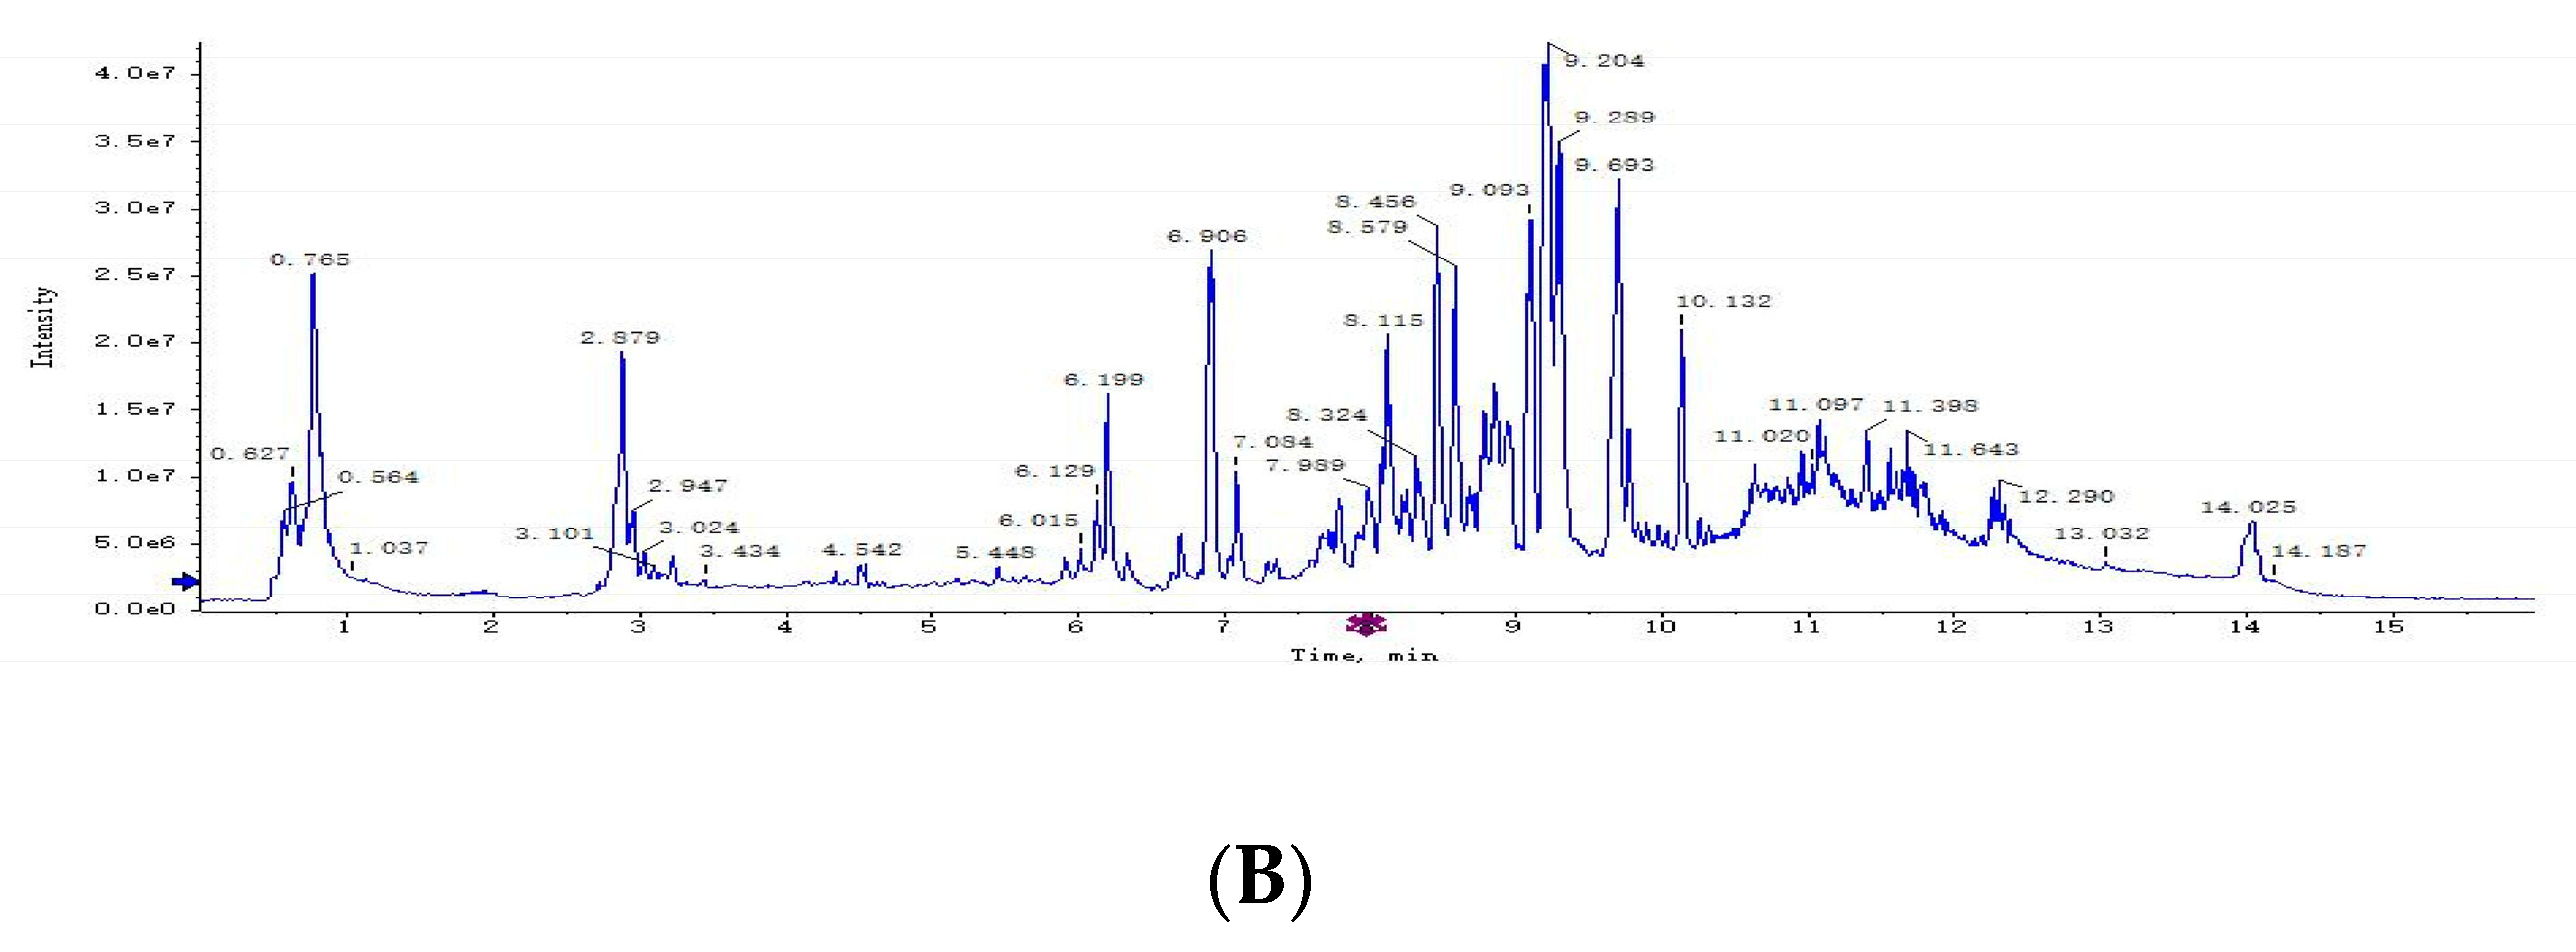
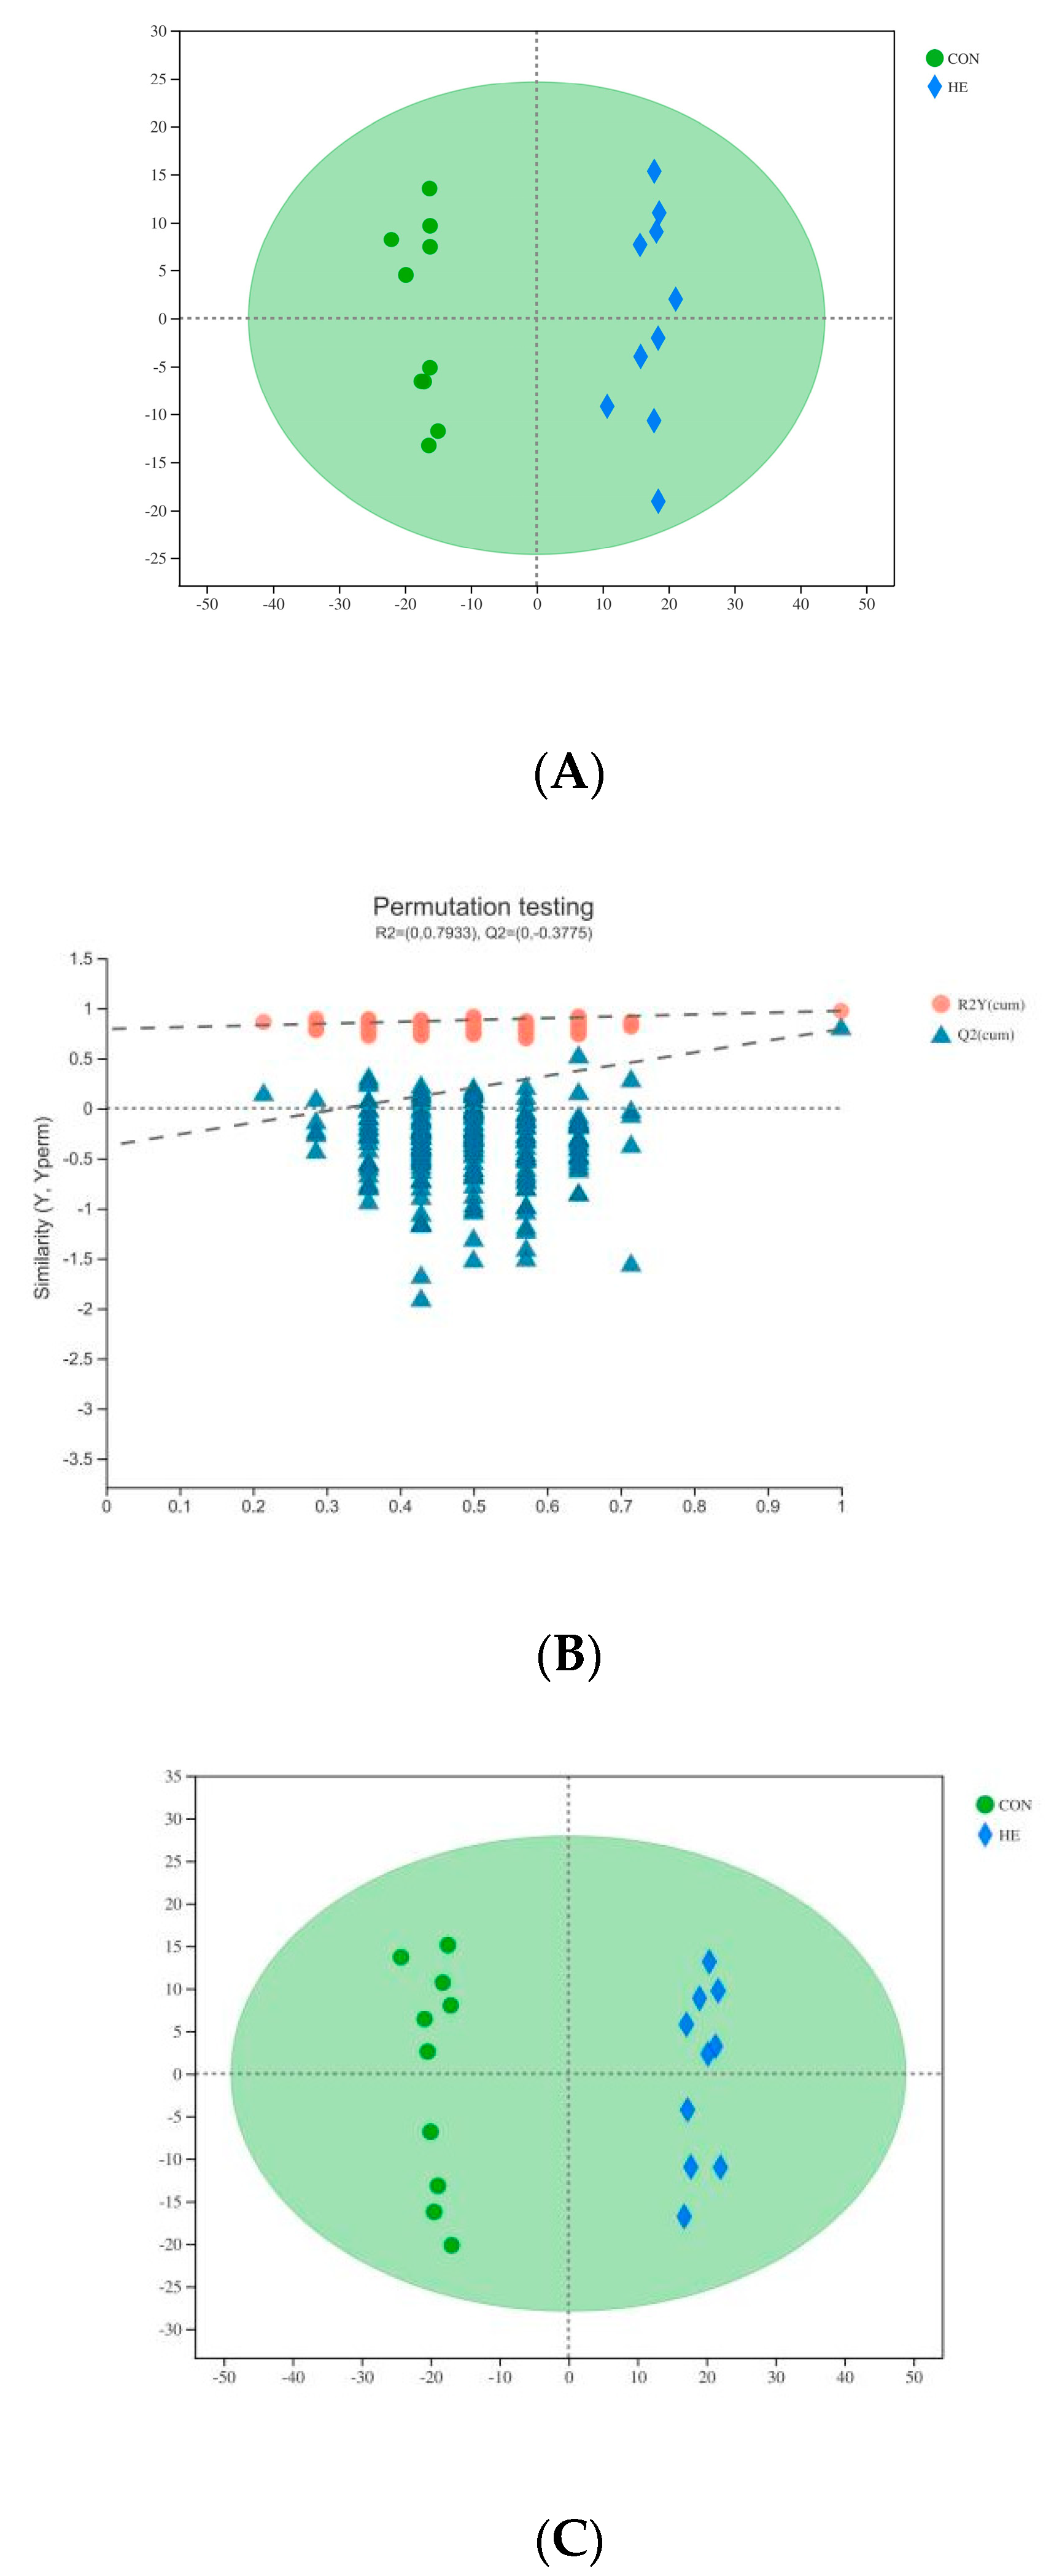
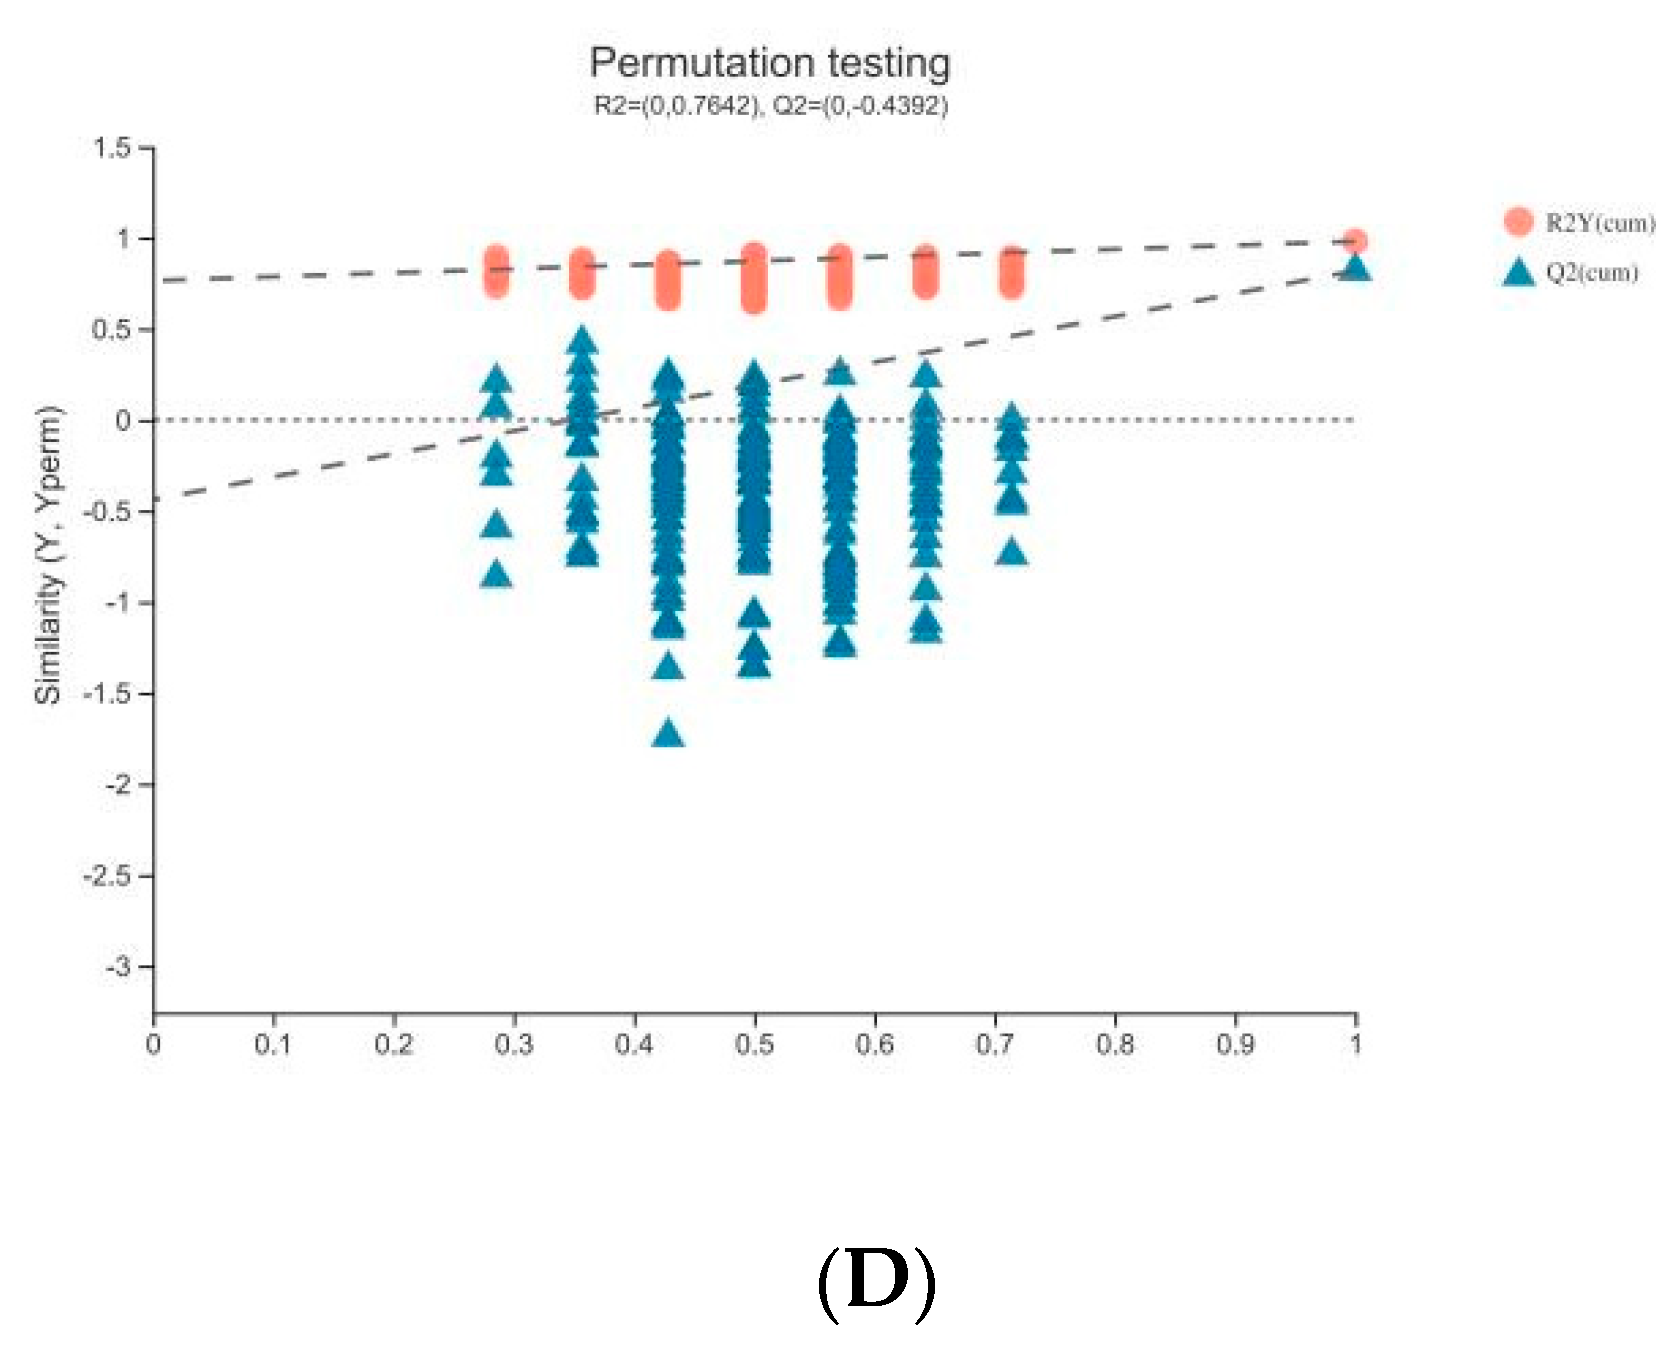
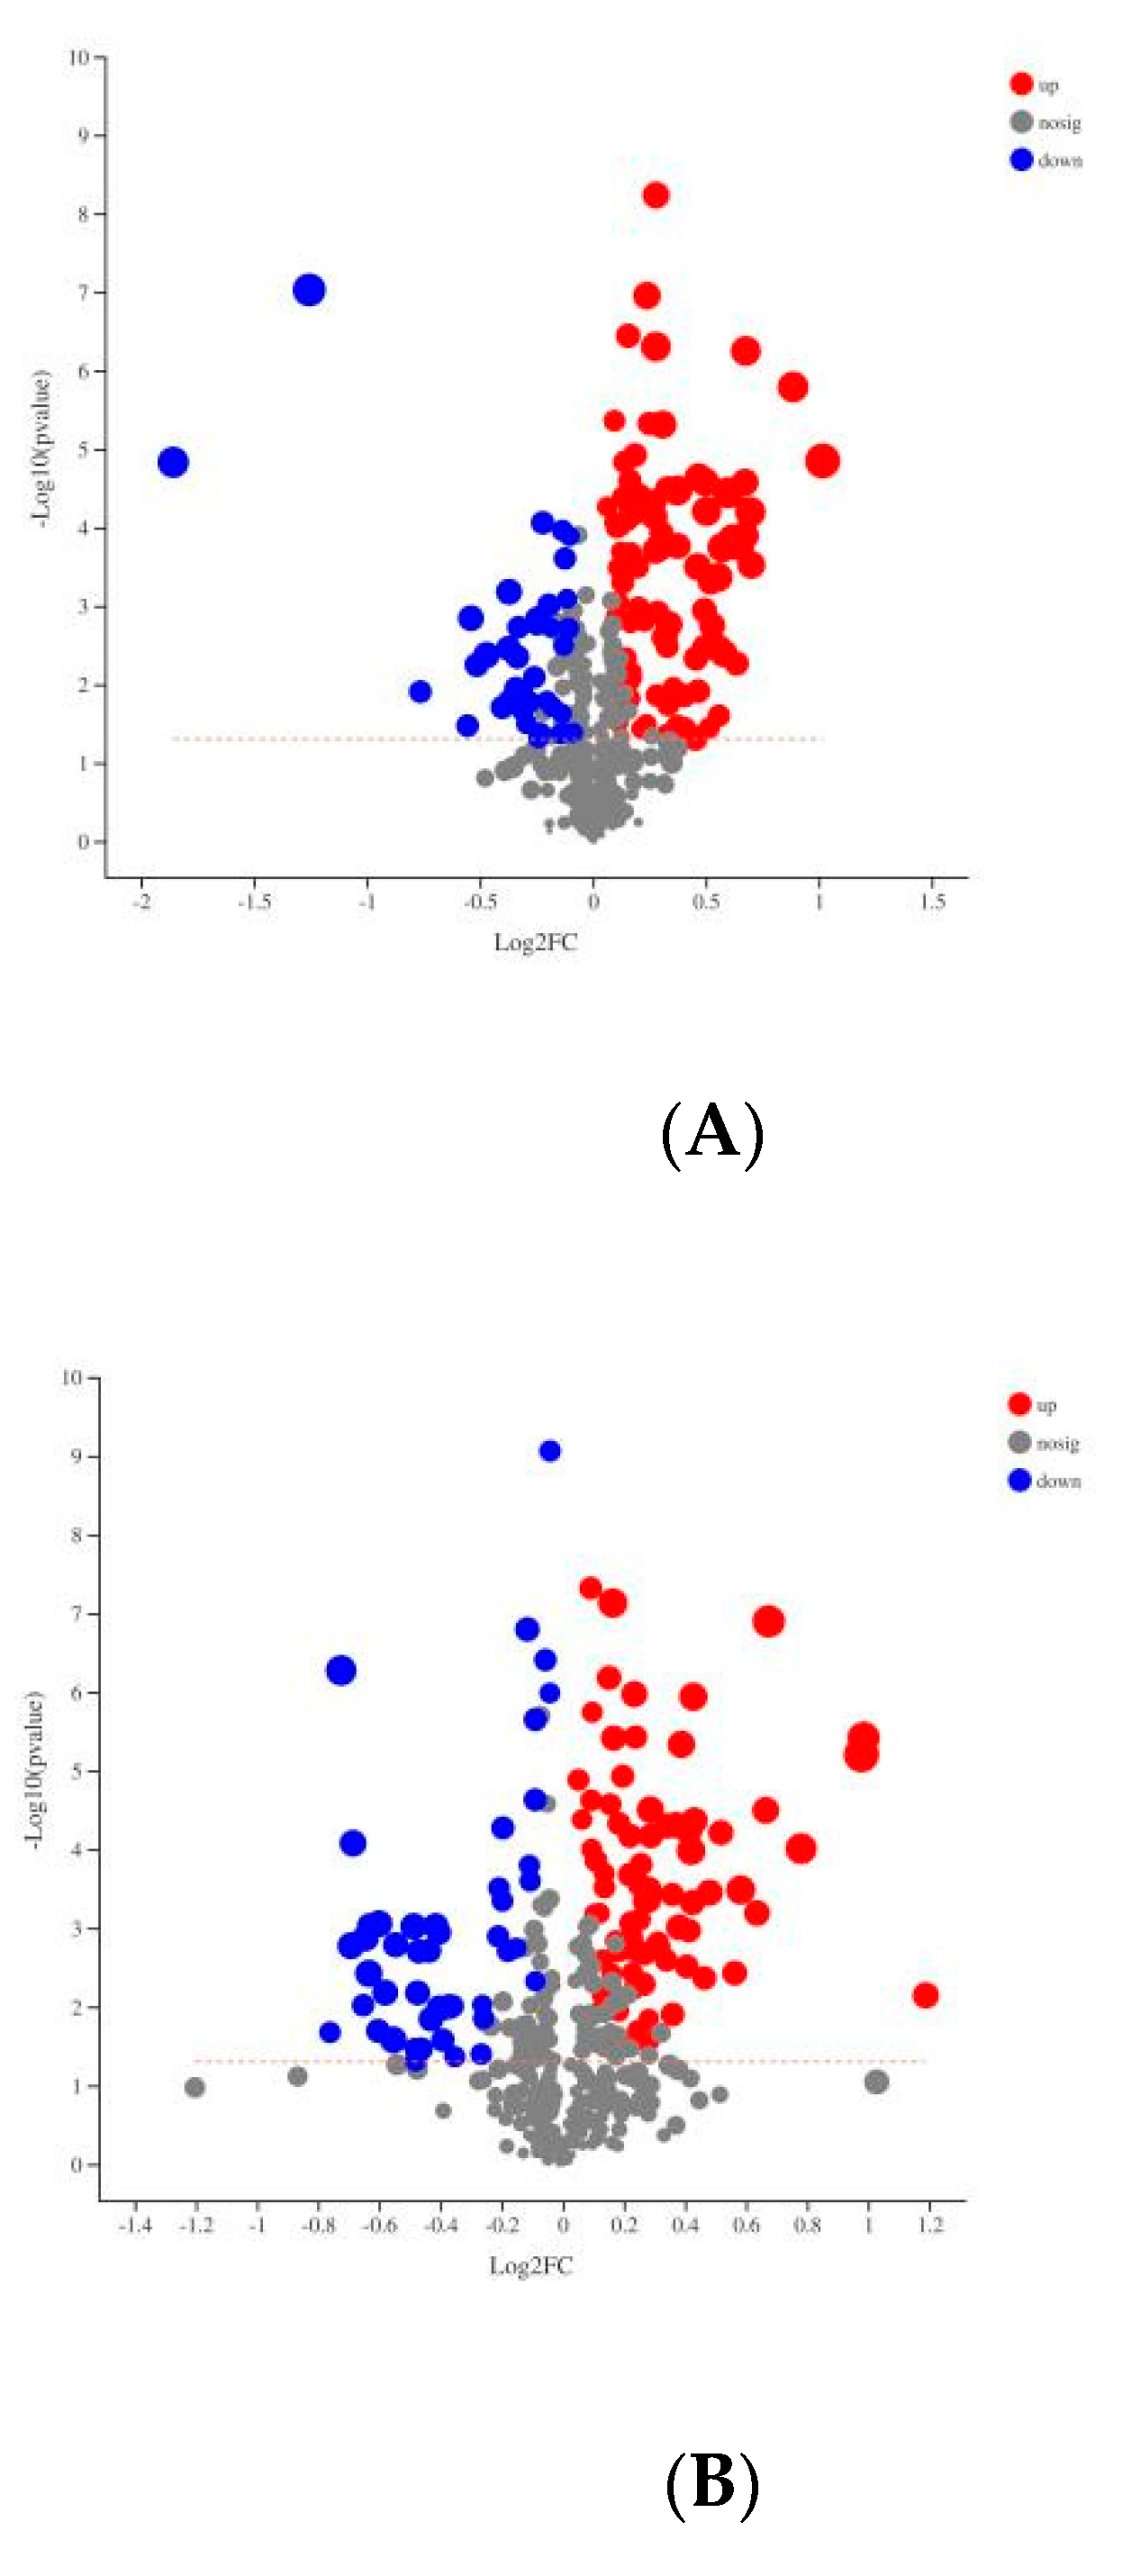
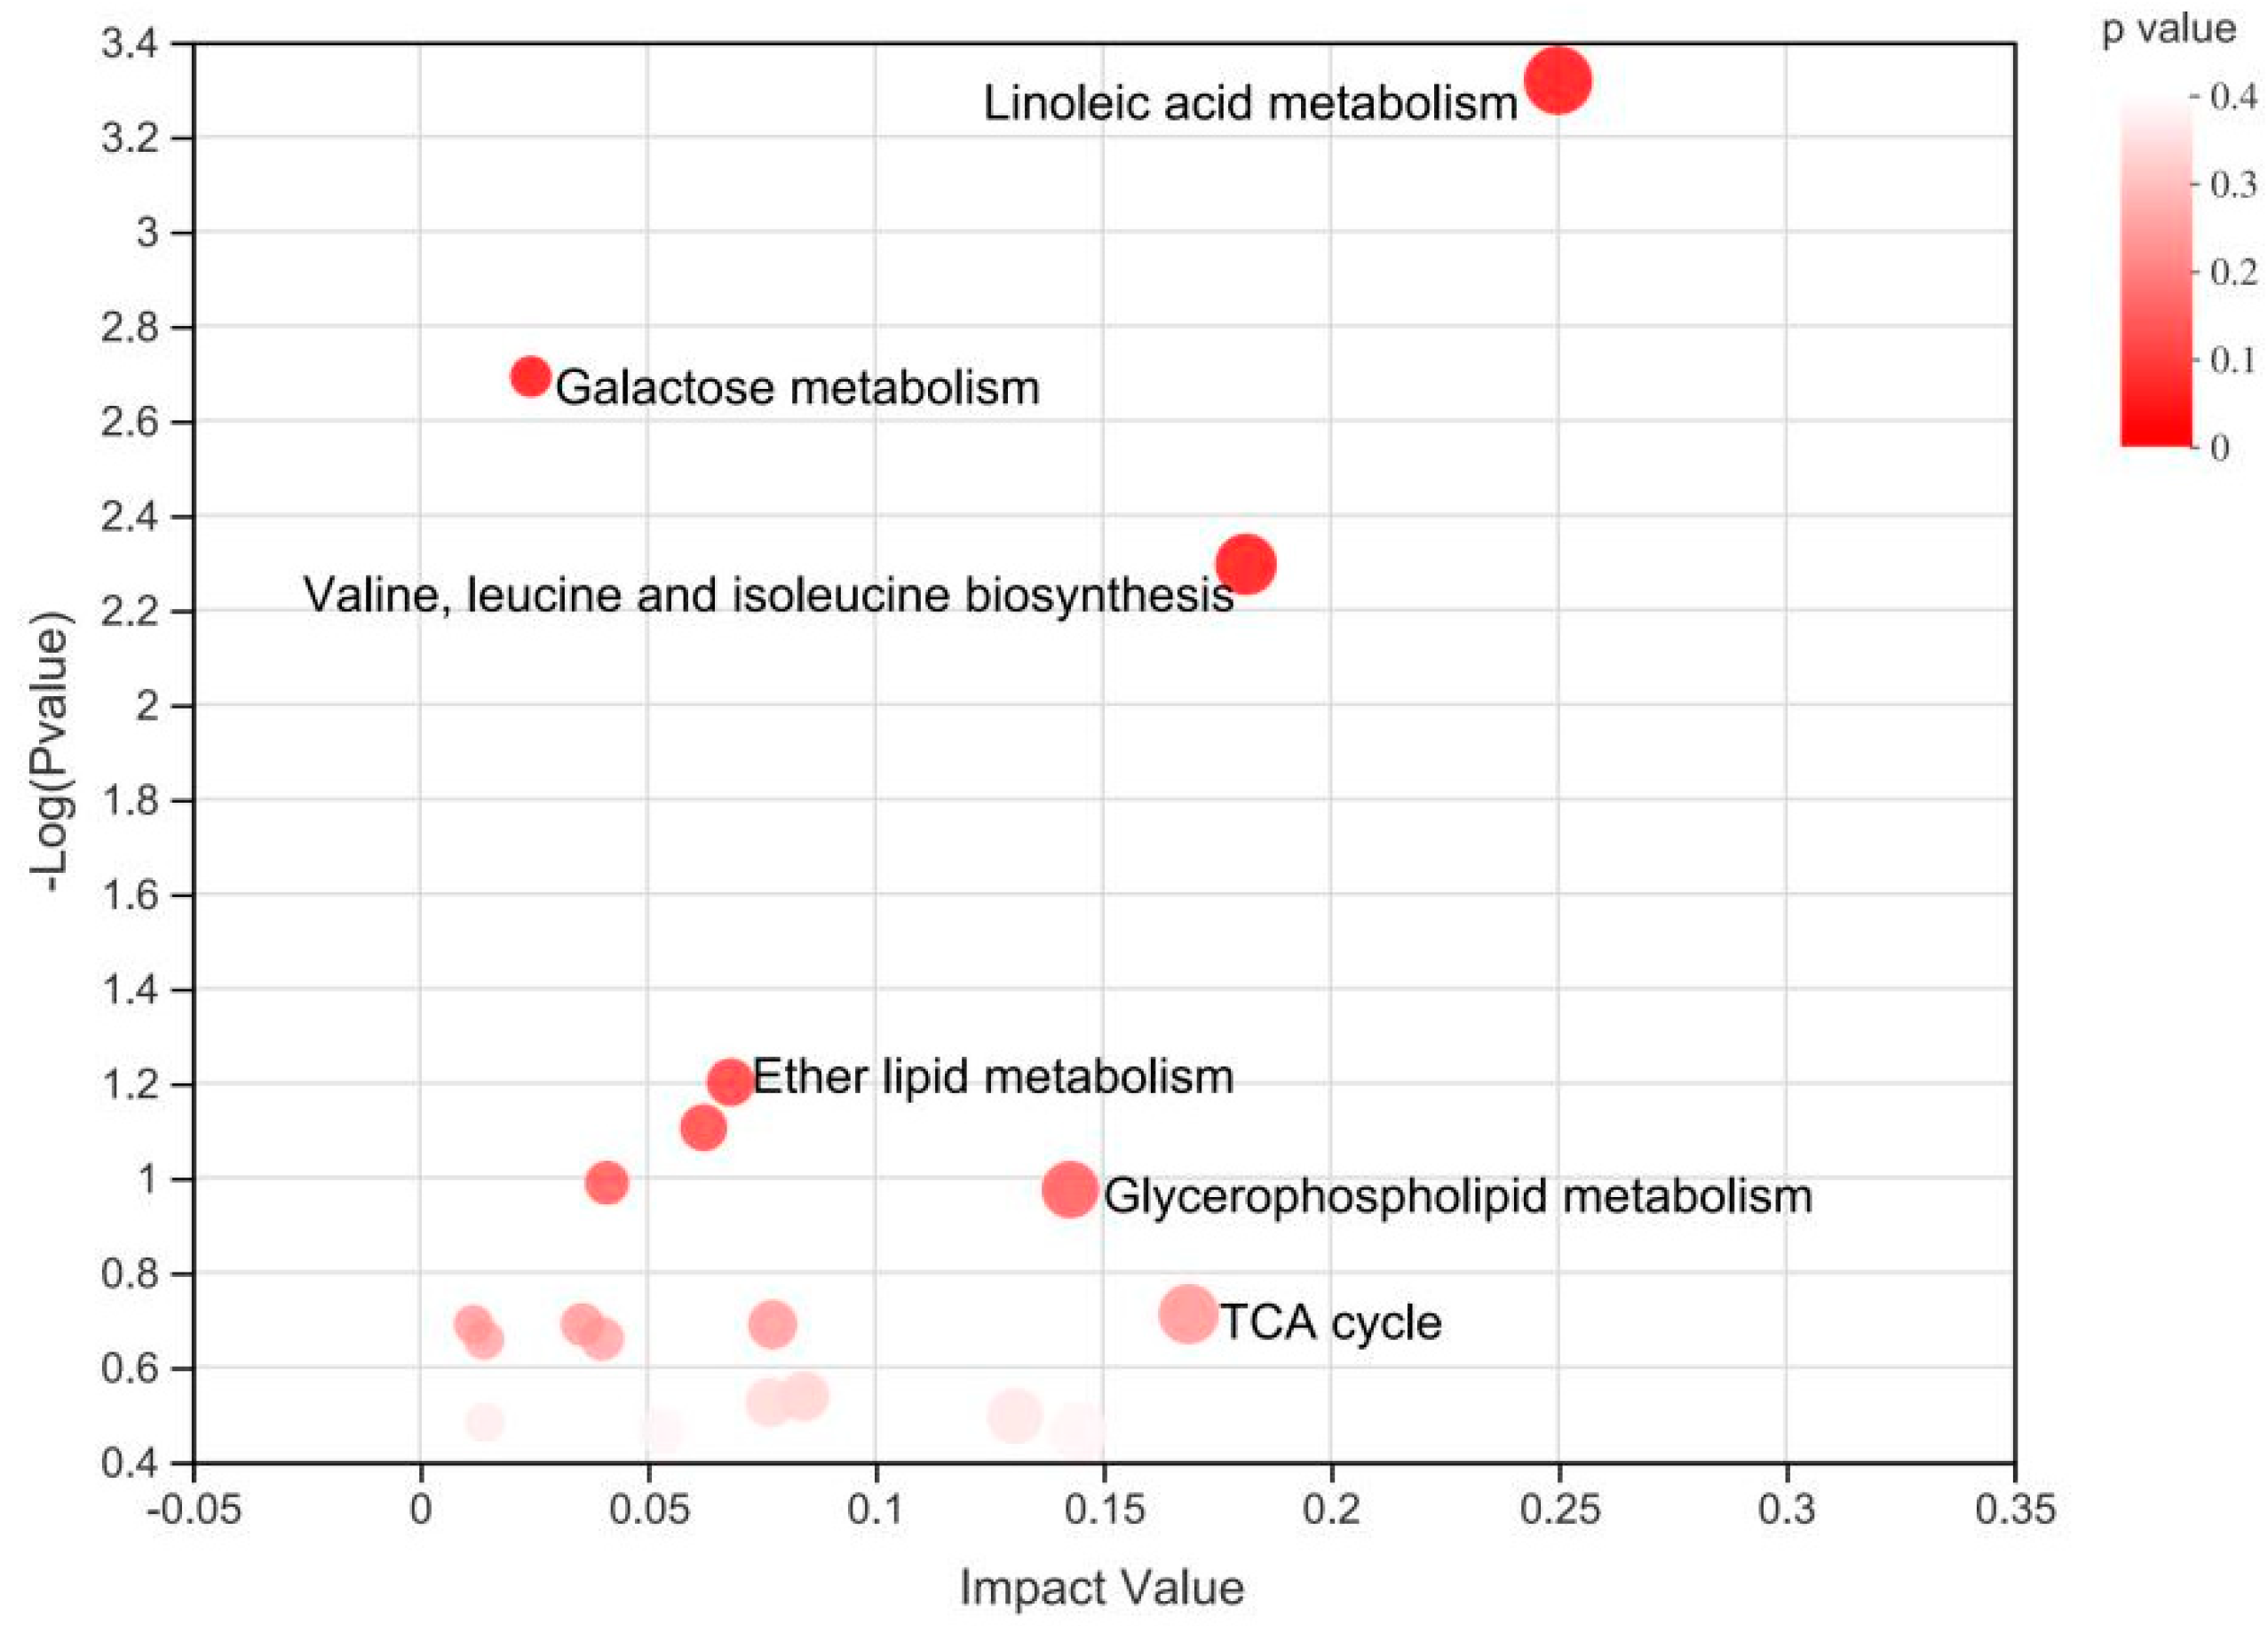
3.2. Plasma Metabolomics Profiling
4. Discussion
5. Conclusions
Author Contributions
Funding
Institutional Review Board Statement
Informed Consent Statement
Data Availability Statement
Conflicts of Interest
References
- Wei, X.; Yin, Q.; Zhao, H.; Cao, Y.; Cai, C.; Yao, J. Metabolomics for the effect of biotin and nicotinamide on transition dairy cows. J. Agric. Food Chem. 2018, 66, 5723–5732. [Google Scholar] [CrossRef] [PubMed]
- Bell, A.W. Regulation of organic nutrient metabolism during transition from late pregnancy to early lactation. J. Anim. Sci. 1995, 73, 2804–2819. [Google Scholar] [CrossRef] [PubMed]
- Mulligan, F.J.; Doherty, M.L. Production diseases of the transition cow. Vet. J. 2008, 176, 3–9. [Google Scholar] [CrossRef] [PubMed]
- Vernon, R.G. Lipid metabolism during lactation. A review of adipose tissue-liver interactions and the development of fatty liver. J. Dairy Res. 2005, 72, 460–469. [Google Scholar] [CrossRef] [PubMed]
- Esposito, G.; Irons, P.C.; Webb, E.C.; Chapwanya, A. Interactions between negative energy balance, metabolic diseases, uterine health and immune response in transition dairy cows. Anim. Reprod. Sci. 2014, 144, 60–71. [Google Scholar] [CrossRef] [Green Version]
- Guo, J.; Peters, R.R.; Kohn, R.A. Effect of a transition diet on production performance and metabolism in periparturient dairy cows. J. Dairy Sci. 2007, 90, 5247–5258. [Google Scholar] [CrossRef]
- McNamara, S.; O’Mara, F.P.; Rath, M.; Murphy, J.J. Effects of different transition diets on dry matter intake, milk production, and milk composition in dairy cows. J. Dairy Sci. 2003, 86, 2397–2408. [Google Scholar] [CrossRef]
- NRC. Nutrient Requirements of Dairy Cattle, 7th ed.; National Academies Press: Washington, DC, USA, 2001. [Google Scholar]
- Moe, P.W.; Tyrrell, H.F. Metabolizable energy requirements of pregnant dairy cows. J. Dairy Sci. 1972, 55, 480–483. [Google Scholar] [CrossRef]
- Tanner, A.R.; Bauer, M.L.; Kennedy, V.C.; Keomanivong, F.E.; Kirsch, J.D.; Reynolds, L.P.; Stokka, G.L.; Rodas-Gonzalez, A.; Ward, A.K.; Dahlen, C.R.; et al. Influence of corn supplementation to beef cows during mid- to late-gestation, Maternal feed intake, body condition, plasma metabolites, and calf growth. Livest. Sci. 2020, 240 (Suppl. S2), 1142–1150. [Google Scholar] [CrossRef]
- Rabelo, E.; Rezende, R.; Bertics, S.; Grummer, R. Effects of transition diets varying in dietary energy density on lactation performance and ruminal parameters of dairy cows. J. Dairy Sci. 2003, 86, 916–925. [Google Scholar] [CrossRef] [Green Version]
- Rabelo, E.; Rezende, R.; Bertics, S.; Grummer, R. Effects of pre- and postfresh transition diets varying in dietary energy density on metabolic status of periparturient dairy cows. J. Dairy Sci. 2005, 88, 4375–4383. [Google Scholar] [CrossRef]
- Girma, D.; Ma, L.; Wang, F.; Jiang, Q.; Callaway, T.; Drackley, J.; Bu, D. Effects of close-up dietary energy level and supplementing rumen-protected lysine on energy metabolites and milk production in transition cows. J. Dairy Sci. 2019, 102, 7059–7072. [Google Scholar] [CrossRef] [PubMed]
- Janovick, N.A.; Drackley, J.K. Prepartum dietary management of energy intake affects postpartum intake and lactation performance by primiparous and multiparous Holstein cows. J. Dairy Sci. 2010, 93, 3086–3102. [Google Scholar] [CrossRef] [PubMed]
- Riboni, M.V.; Farina, G.; Batistel, F.; Heiser, A.; Mitchell, M.; Crookenden, M.; Walker, C.; Kay, J.; Meier, S.; Roche, J.; et al. Far-off and close-up dry matter intake modulate indicators of immunometabolic adaptations to lactation in subcutaneous adipose tissue of pasture-based transition dairy cows. J. Dairy Sci. 2017, 100, 2334–2350. [Google Scholar] [CrossRef] [PubMed]
- Graugnard, D.; Bionaz, M.; Trevisi, E.; Moyes, K.; Salak-Johnson, J.; Wallace, R.; Drackley, J.; Bertoni, G.; Loor, J. Blood immunometabolic indices and polymorphonuclear neutrophil function in peripartum dairy cows are altered by the level of dietary energy prepartum. J. Dairy Sci. 2012, 95, 1749–1758. [Google Scholar] [CrossRef] [PubMed] [Green Version]
- Zhao, S.; Zhao, J.; Bu, D.; Sun, P.; Wang, J.; Dong, Z. Metabolomics analysis reveals large effect of roughage types on rumen microbial metabolic profile in dairy cows. Lett. Appl. Microbiol. 2014, 59, 79–85. [Google Scholar] [CrossRef] [PubMed]
- Liu, C.; Wu, H.; Liu, S.; Chai, S.; Meng, Q.; Zhou, Z. Dynamic Alterations in Yak Rumen Bacteria Community and Metabolome Characteristics in Response to Feed Type. Front. Microbiol. 2019, 10, 1116–1130. [Google Scholar] [CrossRef] [Green Version]
- Jun, Z.; Haitao, S.; Yajing, W.; Shengli, L.; Zhijun, C.; Shoukun, J.; Yuan, H.; Hongtao, Z. Effect of Dietary Forage to Concentrate Ratios on Dynamic Profile Changes and Interactions of Ruminal Microbiota and Metabolites in Holstein Heifers. Front. Microbiol. 2017, 8, 2206–2212. [Google Scholar]
- Dervishi, E.; Zhang, G.; Dunn, S.M.; Mandal, R.; Wishart, D.S.; Ametaj, B.N. GC-MS metabolomics identifies metabolite alterations that precede subclinical mastitis in the blood of transition dairy cows. J. Proteome Res. 2017, 16, 433–446. [Google Scholar] [CrossRef]
- Basoglu, A.; Baspinar, N.; Tenori, L.; Vignoli, A.; Gulersoy, E. Effects of boron supplementation on peripartum dairy cows’health. Biol. Trace Elem. Res. 2017, 179, 218–225. [Google Scholar] [CrossRef]
- Hailemariam, D.; Zhang, G.; Mandal, R.; Wishart, D.S.; Ametaj, B.N. Identification of serum metabolites associated with the risk of metritis in transition dairy cows. Can. J. Anim. Sci. 2018, 98, 525–537. [Google Scholar] [CrossRef]
- Sun, H.Z.; Wang, D.M.; Wang, B.; Wang, J.K.; Liu, H.Y.; Guan, L.L.; Liu, J.X. Metabolomics of four biofluids from dairy cows, Potential biomarkers for milk production and quality. J. Proteome Res. 2015, 14, 1287–1298. [Google Scholar] [CrossRef] [PubMed]
- Wang, Y.P.; Cai, M.; Hua, D.K.; Zhang, F.; Jiang, L.S.; Zhao, Y.G.; Wang, H.; Nan, X.M.; Xiong, B.H. Metabolomics reveals effects of rumen-protected glucose on metabolism of dairy cows in early lactation—Sciencedirect. Anim. Feed Sci. Technol. 2020, 269, 1620–1632. [Google Scholar] [CrossRef]
- Xu, G.W. Metabolomics-Methods and Applications, 1st ed.; Science and Technology Press: Beijing, China, 2008. [Google Scholar]
- Goldansaz, S.A.; Guo, A.C.; Sajed, T.; Steele, M.A.; Plastow, G.S.; Wishart, D.S. Livestock metabolomics and the livestock metabolome, A systematic review. PLoS ONE 2017, 12, 712–728. [Google Scholar] [CrossRef] [Green Version]
- Gowda, G.A.; Djukovic, D. Overview of mass spectrometry-based metabolomics, Opportunities and challenges. Methods Mol. Biol. 2014, 1198, 3–12. [Google Scholar]
- Gu, L.; Zhang, Z.-Y.; Quan, H.; Li, M.-J.; Zhao, F.-Y.; Xu, Y.-J.; Liu, J.; Sai, M.; Zheng, W.-L.; Lan, X.-Z. Integrated analysis of transcriptomic and metabolomic data reveals critical metabolic pathways involved in rotenoid biosynthesis in the medicinal plant mirabilis himalaica. Mol. Genet. Genom. 2018, 293, 635–647. [Google Scholar] [CrossRef] [Green Version]
- Yang, Y.; Dong, G.; Wang, Z.; Wang, J.; Zhang, Z.; Liu, J. Rumen and plasma metabolomics profiling by uhplc-qtof/ms revealed metabolic alterations associated with a high-corn diet in beef steers. PLoS ONE 2018, 13, 312–324. [Google Scholar] [CrossRef] [Green Version]
- Kanehisa, M.; Sato, Y.; Kawashima, M.; Furumichi, M.; Tanabe, M. KEGG as a reference resource for gene and protein annotation. Nucleic Acids Res. 2016, 44, 457–462. [Google Scholar] [CrossRef] [Green Version]
- Xia, J.; Sinelnikov, I.V.; Han, B.; Wishart, D.S. MetaboAnalyst 3.0-making metabolomics more meaningful. Nucleic Acids Res. 2015, 43, 251–257. [Google Scholar] [CrossRef] [Green Version]
- Yang, C.Y.; Hao, R.J.; Du, X.D.; Deng, Y.W.; Sun, R.J.; Wang, Q.H. Metabolomics responses of pearl oysters (Pinctada fucata martensii) fed a formulated diet indoors and cultured with natural diet outdoors. Front. Physiol. 2018, 9, 944–955. [Google Scholar] [CrossRef]
- Drackley, J.K. ADSA Foundation Scholar Award. Biology of dairy cows during the transition period, The final frontier. J. Dairy Sci. 1999, 82, 2259–2273. [Google Scholar] [CrossRef]
- Duffield, T.; Lissemore, K.; McBride, B.; Leslie, K. Impact of hyperketonemia in early lactation dairy cows on health and production. J. Dairy Sci. 2009, 92, 571–580. [Google Scholar] [CrossRef] [PubMed] [Green Version]
- Sordillo, L.M.; Raphael, W. Significance of metabolic stress, lipid mobilization, and inflammation on transition cow disorders. Vet. Clin. N. Am. Food Anim. Pract. 2013, 29, 267–278. [Google Scholar] [CrossRef] [PubMed]
- Pham-Huy, L.A.; He, H.; Pham-Huy, C. Free radicals, anti-oxidants in disease and health. Int. J. Biomed. Sci. 2008, 4, 89–96. [Google Scholar] [PubMed]
- Abuelo, A.; Hernandez, J.; Benedito, J.L.; Castillo, C. Association of oxidative status and insulin sensitivity in periparturient dairy cattle, An observational study. J. Anim. Physiol. Anim. Nutr. 2016, 100, 279–286. [Google Scholar] [CrossRef]
- Sordillo, L.M.; Contreras, G.A.; Aitken, S.L. Metabolic factors affecting the inflammatory response of periparturient dairy cows. Anim. Health Res. Rev. 2009, 10, 53–63. [Google Scholar] [CrossRef]
- Contreras, G.A.; Sordillo, L.M. Lipid mobilization and inflammatory responses during the transition period of dairy cows. Comp. Immunol. Microbiol. Infect. Dis. 2011, 34, 281–289. [Google Scholar] [CrossRef]
- Sitaraman, S.V.; Merlin, D.; Wang, L.; Wong, M.; Gewirtz, A.T.; Si-Tahar, M.; Madara, J.L. Neutrophil-epithelial crosstalk at the intestinal lumenal surface mediated by reciprocal secretion of adenosine and IL-6. J. Clin. Investig. 2001, 107, 861–869. [Google Scholar] [CrossRef] [Green Version]
- Drackley, J.K.; Cardoso, F.C. Prepartum and postpartum nutritional management to optimize fertility in high-yielding dairy cows in confined TMR systems. Animal 2014, 8 (Suppl. S1), 5–14. [Google Scholar] [CrossRef] [Green Version]
- Bernabucci, U.; Ronchi, B.; Lacetera, N.; Nardone, A. Influence of body condition score on relationships between metabolic status and oxidative stress in periparturient dairy cows. J. Dairy Sci. 2005, 88, 2017–2026. [Google Scholar] [CrossRef] [Green Version]
- Sordillo, L.; O’Boyle, N.; Gandy, J.; Corl, C.; Hamilton, E. Shifts in thioredoxin reductase activity and oxidant status in mononuclear cells obtained from transition dairy cattle. J. Dairy Sci. 2007, 90, 1186–1192. [Google Scholar] [CrossRef]
- Roche, J.; Macdonald, K.; Schütz, K.; Matthews, L.; Verkerk, G.; Meier, S.; Loor, J.; Rogers, A.; McGowan, J.; Morgan, S.; et al. Calving body condition score affects indicators of health in grazing dairy cows. J. Dairy Sci. 2013, 96, 5811–5825. [Google Scholar] [CrossRef] [PubMed] [Green Version]
- Contreras, G.A.; OBoyle, N.J.; Herdt, T.H.; Sordillo, L.M. Lipomobilization in periparturient dairy cows influences the composition of plasma nonesterified fatty acids and leukocyte phospholipid fatty acids. J. Dairy Sci. 2010, 93, 2508. [Google Scholar] [CrossRef] [PubMed] [Green Version]
- Cole, L.K.; Vance, J.E.; Vance, D.E. Phosphatidylcholine biosynthesis and lipoprotein metabolism. Biochim. Biophys. Acta 2012, 1821, 754–761. [Google Scholar] [CrossRef]
- Imhasly, S.; Bieli, C.; Naegeli, H.; Nystrom, L.; Ruetten, M.; Gerspach, C. Blood plasma lipidome profile of dairy cows during the transition period. BMC Vet. Res. 2015, 11, 252–260. [Google Scholar] [CrossRef] [Green Version]
- Montecucco, F.; Mach, F. Common inflammatory mediators orchestrate pathophysiological processes in rheumatoid arthritis and atherosclerosis. Rheumatology 2009, 48, 11–22. [Google Scholar] [CrossRef] [Green Version]
- Sordillo, L.M.; Mavangira, V. The nexus between nutrient metabolism, oxidative stress and inflammation in transition cows. Anim. Prod. Sci. 2014, 54, 1204–1212. [Google Scholar] [CrossRef]
- Mavangira, V.; Sordillo, L.M. Role of lipid mediators in the regulation of oxidative stress and inflammatory responses in dairy cattle. Res. Vet. Sci. 2018, 116, 4–14. [Google Scholar] [CrossRef]
- Gulliver, C.E.; Friend, M.A.; King, B.J.; Clayton, E.H. The role of omega-3 polyunsaturated fatty acids in reproduction of sheep and cattle. Anim. Prod. Sci. 2012, 131, 9–22. [Google Scholar] [CrossRef]
- Ryman, V.E.; Packiriswamy, N.; Sordillo, L.M. Apoptosis of endothelial cells by 13-HPODE contributes to impairment of endothelial barrier integrity. Mediat. Inflamm. 2016, 2016, 1138–1152. [Google Scholar] [CrossRef] [Green Version]
- Harbige, L.S. Fatty acids, the immune response, and autoimmunity, A question of n-6 essentiality and the balance between n-6 and n-3. Lipids 2003, 38, 323–341. [Google Scholar] [CrossRef] [PubMed]
- Haskó, G.; Sitkovsky, M.V.; Szabó, C. Immunomodulatory and neuroprotective effects of inosine. Trends Pharmacol. Sci. 2004, 25, 152–157. [Google Scholar] [CrossRef] [PubMed]
- Karisa, B.; Thomson, J.; Wang, Z.; Li, C.; Montanholi, Y.; Miller, S.; Moore, S.; Plastow, G. Plasma metabolites associated with residual feed intake and other productivity performance traits in beef cattle. Livest. Sci. 2014, 165, 200–211. [Google Scholar] [CrossRef]
- Reecy, J.M.; Williams, J.E.; Kerley, M.S.; MacDonald, R.S.; Thorn-ton, W.H.; Davis, J.L. The effect of postruminal amino acid flow on muscle cell proliferation and protein turnover. J. Anim. Sci. 1996, 74, 2158–2169. [Google Scholar] [CrossRef] [PubMed]
- Lobley, G.E.; Hoskin, S.O.; McNeil, C.J. Glutamine in animal science and production. J. Nutr. 2001, 131, 2525S–2531S. [Google Scholar] [CrossRef] [PubMed] [Green Version]
- Clemmons, B.A.; Mihelic, R.I.; Beckford, R.C.; Powers, J.B.; Melchior, E.A.; McFarlane, Z.D.; Cope, E.R.; Embree, M.M.; Mulliniks, J.T.; Campagna, S.R.; et al. Serum metabolites associated with feed efficiency in black angus steers. Metabolomics 2017, 13, 147–153. [Google Scholar] [CrossRef]
- Abeni, F.; Calamari, L.; Stefanini, L. Metabolic conditions of lactating Friesian cows during the hot season in the Po valley. 1. Blood indicators of heat stress. Int. J. Biometeorol. 2007, 52, 87–96. [Google Scholar] [CrossRef]
- Mata, J.M.; Kershenobich, D.; Villarreal, E.; Rojkind, M. Serum free proline and free hydroxyproline in patients with chronic liver disease. Gastroenterology 1975, 68, 1265–1269. [Google Scholar] [CrossRef]
- Haque, M.N.; Rulquin, H.; Lemosquet, S. Milk protein responses in dairy cows to changes in postruminal supplies of arginine, isoleucine, and valine. J. Dairy Sci. 2013, 96, 420–430. [Google Scholar] [CrossRef]
- Zhang, J.; Shi, H.T.; Wang, Y.C.; Li, S.L.; Cao, Z.J.; Yang, H.J.; Wang, Y.J. Carbohydrate and amino acid metabolism and oxidative status in holstein heifers precision-fed diets with different forage to concentrate ratios. Animal 2020, 14, 2315–2325. [Google Scholar] [CrossRef]
- Kuhla, B.; Albrecht, D.; Kuhla, S.; Metges, C.C. Proteome analysis of fatty liver in feed-deprived dairy cows reveals interaction of fuel sensing, calcium, fatty acid, and glycogen metabolism. Physiol. Genom. 2009, 37, 88–98. [Google Scholar] [CrossRef] [PubMed] [Green Version]
- Luo, Z.Z.; Shen, L.H.; Jiang, J.; Huang, Y.X.; Bai, L.P.; Yu, S.M.; Yao, X.P.; Ren, Z.H.; Yang, Y.X.; Cao, S.Z. Plasma metabolite changes in dairy cows during parturition identified using untargeted metabolomics. J. Dairy Sci. 2019, 102, 4639–4650. [Google Scholar] [CrossRef] [PubMed] [Green Version]
- Tian, H.; Wang, W.; Zheng, N.; Cheng, J.; Li, S.; Zhang, Y.; Wang, J. Identification of diagnostic biomarkers and metabolic pathway shifts of heat-stressed lactating dairy cows. J. Proteom. 2015, 125, 17–28. [Google Scholar] [CrossRef] [PubMed]


| Group 1 | ||
|---|---|---|
| Item | HE | CON |
| Ingredient, % of DM | ||
| Corn silage | 42.0 | 33.0 |
| Dry rice straw | 18.0 | 27.0 |
| Corn | 22.8 | 15.6 |
| Wheat bran | 5.2 | 12.1 |
| Soybean meal | 2.4 | 2.4 |
| Cottonseed meal | 3.6 | 5.1 |
| CaHPO4 | 0.6 | 0.6 |
| NaHCO3 | 0.4 | 0.4 |
| NaCl | 0.5 | 0.5 |
| Unifat 2 | 2.5 | 1.3 |
| Premix 3 | 2.0 | 2.0 |
| Total | 100 | 100 |
| Nutrient composition | ||
| CP, % of DM | 11.55 | 11.78 |
| ADF, % of DM | 23.52 | 26.88 |
| NDF, % of DM | 37.51 | 41.62 |
| TDN, % of DM | 71.19 | 68.31 |
| NEm 4, Mcal/kg DM | 1.67 | 1.53 |
| Calcium, % of DM | 0.72 | 0.79 |
| Phosphorus, % of DM | 0.36 | 0.34 |
| Treatments 1 | ||||
|---|---|---|---|---|
| Items 2 | CON | HE | SEM | p-Value |
| Glucose mmol/L | 5.73 b | 6.21 a | 0.055 | 0.031 |
| Insulin mIU/L | 19.02 b | 28.47 a | 0.398 | 0.002 |
| NEFA μmol/L | 612.56 a | 529.77 b | 30.50 | 0.017 |
| BHBA μmol/L | 509.62 a | 398.31 b | 18.69 | 0.026 |
| T-AOC U/mL | 2.25 b | 3.63 a | 0.375 | <0.001 |
| GSH-Px U/mL | 136.05 | 102.03 | 16.53 | 0.011 |
| SOD U/mL | 15.66 | 17.91 | 0.021 | 0.127 |
| MDA mmol/mL | 2.33 a | 1.56 b | 0.76 | 0.018 |
| Metabolite Name | VIP | RT (min) | Ion (m/z) | Fold Change | p-Value | Positive/Negative |
|---|---|---|---|---|---|---|
| Cibaric acid | 1.2626 | 6.67 | 325.20 | 0.84 | 0.0378 | pos |
| Linoleic acid | 2.2307 | 7.78 | 485.32 | 0.78 | <0.00001 | pos |
| Pelargonic acid | 1.6576 | 6.51 | 200.16 | 0.72 | 0.045 | pos |
| 2-Hydroxymyristic acid | 1.0692 | 8.41 | 243.19 | 1.1034 | 0.0061 | neg |
| Citric acid | 1.235 | 0.727 | 191.02 | 1.06 | 0.0005 | neg |
| Hexadecanedioic acid | 1.0971 | 7.63 | 285.21 | 0.93 | <0.00001 | neg |
| heptadecanoic acid | 1.1185 | 6.13 | 263.24 | 0.61 | 0.0015 | neg |
| 7-Ketodeoxycholic acid | 1.9979 | 6.97 | 451.36 | 1.57 | 0.00018 | neg |
| 11Z-Eicosenoic acid | 1.0659 | 9.16 | 355.28 | 1.065 | 0.0014 | neg |
| Butyl salicylate | 1.033 | 6.66 | 195.10 | 0.9458 | 0.02184 | pos |
| LysoPE(0:0/22:0) | 1.1191 | 9.34 | 582.37 | 0.94 | 0.0005 | neg |
| LysoPC(20:4(5Z,8Z,11Z,14Z)) | 1.2623 | 7.96 | 544.33 | 0.95 | 0.01638 | pos |
| LysoPE (0:0/18:0) | 1.1836 | 7.98 | 550.31 | 0.91 | 0.0006 | neg |
| LysoPE(0:0/22:4(7Z,10Z,13Z,16Z)) | 1.3637 | 7.85 | 574.31 | 0.79 | 0.0033 | neg |
| LysoPC(20:0) | 1.3302 | 9.20 | 552.40 | 0.94 | 0.00001 | pos |
| LysoPC(22:2(13Z,16Z)) | 1.4444 | 9.27 | 620.39 | 0.83 | 0.0002 | neg |
| LysoPC(O-18:0) | 1.8298 | 9.35 | 544.36 | 0.67 | 0.0004 | neg |
| PS(14:0/18:1(9Z)) | 2.41 | 9.16 | 778.48 | 0.46 | 0.0002 | neg |
| l-Phosphoarginine | 2.3631 | 3.53 | 237.07 | 0.48 | 0.02184 | pos |
| Alpha-methylphenylalanine | 1.8553 | 2.15 | 180.10 | 1.74 | 0.022 | pos |
| Xanthosine | 1.6569 | 5.02 | 319.04 | 0.6661 | 0.03052 | neg |
| Pilosine | 1.5464 | 5.32 | 287.15 | 0.7331 | 0.024 | pos |
| l-Pyridosine | 1.85 | 2.74 | 237.12 | 1.91 | 0.011 | pos |
| Avenanthramide L | 1.9264 | 3.35 | 348.08 | 0.6458 | 0.0375 | pos |
| Shinflavanone | 1.6465 | 7.01 | 411.15 | 1.3989 | 0.00027 | neg |
| Mytilin B | 1.6406 | 4.11 | 391.10 | 0.7846 | 0.0403 | pos |
| 3-phenyllactic acid | 1.540 | 4.14 | 131.05 | 0.8978 | 0.0001 | pos |
| Threonine | 1.667 | 5.36 | 310.12 | 1.274 | 0.01084 | neg |
| 6-Hydroxymelatonin | 1.5301 | 5.42 | 293.11 | 1.4486 | 0.0009 | neg |
| Inosine | 1.5043 | 2.33 | 305.02 | 1.3865 | 0.02384 | neg |
| Glutamine | 1.8506 | 3.09 | 292.13 | 1.67 | 0.00157 | pos |
| Galactose | 1.1852 | 11.3 | 191.02 | 1.17 | 0.0011 | neg |
| Butyramide | 1.1267 | 1.56 | 88.07 | 0.8722 | 0.03654 | pos |
| Physapubenolide | 1.101 | 6.13 | 563.24 | 0.91 | 0.0015 | neg |
| l-Isoleucine | 1.088 | 5.13 | 132.10 | 1.053 | 0.0375 | pos |
| l-ornithine | 1.072 | 6.641 | 173.09 | 1.089 | 0.0004 | neg |
| l-valine | 1.176 | 5.82 | 165.55 | 0.741 | 0.001 | neg |
| l-hydroxyproline | 1.2108 | 2.71 | 277.12 | 0.847 | 0.0149 | neg |
| Isopentenyladenine-9-N-glucoside | 1.0246 | 7.83 | 405.22 | 1.0745 | 0.0078 | pos |
| Gamma-Glutamylvaline | 1.7916 | 1.78 | 245.11 | 1.68 | <0.00001 | neg |
| Deoxycholic acid | 1.74 | 7.79 | 437.28 | 1.12 | <0.00001 | neg |
| 5′-Deoxy-5-fluorocytidine | 1.60 | 5.07 | 268.0 | 0.72 | 0.008 | pos |
| Acetoxy-8-gingerol | 1.53 | 6.79 | 363.21 | 1.23 | 0.0003 | neg |
| Gamma-Glu-Leu | 1.512 | 2.86 | 259.12 | 1.32 | 0.01 | neg |
| Oleyl alcohol | 1.135 | 7.58 | 286.30 | 0.81 | 0.048 | pos |
| 4-Methoxybenzyl propanoate | 1.1245 | 5.26 | 195.10 | 1.21 | 0.017 | pos |
| Sphinganine | 1.062 | 6.08 | 274.27 | 0.91 | 0.034 | pos |
| Lucidenic acid E2 | 1.042 | 5.77 | 551.24 | 1.14 | 0.0039 | neg |
| Monomenthyl succinate | 1.26 | 4.60 | 301.16 | 1.25 | 0.001 | neg |
| Cinncassiol D1 glucoside | 1.23 | 5.74 | 535.25 | 1.22 | 0.006 | neg |
| N-Decanoylglycine | 1.16 | 6.65 | 228.16 | 1.35 | 0.04 | neg |
Publisher’s Note: MDPI stays neutral with regard to jurisdictional claims in published maps and institutional affiliations. |
© 2022 by the authors. Licensee MDPI, Basel, Switzerland. This article is an open access article distributed under the terms and conditions of the Creative Commons Attribution (CC BY) license (https://creativecommons.org/licenses/by/4.0/).
Share and Cite
Chen, H.; Wang, C.; Huasai, S.; Chen, A. Metabolomics Reveals the Effects of High Dietary Energy Density on the Metabolism of Transition Angus Cows. Animals 2022, 12, 1147. https://doi.org/10.3390/ani12091147
Chen H, Wang C, Huasai S, Chen A. Metabolomics Reveals the Effects of High Dietary Energy Density on the Metabolism of Transition Angus Cows. Animals. 2022; 12(9):1147. https://doi.org/10.3390/ani12091147
Chicago/Turabian StyleChen, Hao, Chunjie Wang, Simujide Huasai, and Aorigele Chen. 2022. "Metabolomics Reveals the Effects of High Dietary Energy Density on the Metabolism of Transition Angus Cows" Animals 12, no. 9: 1147. https://doi.org/10.3390/ani12091147
APA StyleChen, H., Wang, C., Huasai, S., & Chen, A. (2022). Metabolomics Reveals the Effects of High Dietary Energy Density on the Metabolism of Transition Angus Cows. Animals, 12(9), 1147. https://doi.org/10.3390/ani12091147