
Using Post-Mortem Measurements to Predict Carcass Tissue Composition in Growing Rabbits


 , , ,
, , ,  and
and
Abstract
Simple Summary
Abstract
1. Introduction
2. Materials and Methods
2.1. Experimental Site and Animals
2.2. Slaughter of Animals and Carcass Measurements
2.3. Data Analyses
3. Results
4. Discussion
5. Conclusions
Author Contributions
Funding
Institutional Review Board Statement
Informed Consent Statement
Data Availability Statement
Conflicts of Interest
References
- Escorza-Montoya, M.; Amador-Larios, G.; García-Esquivel, J.; Ayala-Martínez, M.; Zepeda-Bastida, A.; Soto-Simental, S. Productive performance and meat quality of rabbits that consumed cookie waste. Abanico Vet. 2019, 9, 1–7. [Google Scholar]
- Galán-Caballero, M.E.; Escalona-Maurice, M.J.; Jiménez-Moreno, M.J.; Hernández-Romero, O.; Caamal-Cahuich, I.; Velázquez-Marzano, G. Structure and operation of the rabbit meat production chain, Texcoco, México. Agroproductividad 2021, 14, 2. [Google Scholar]
- Olivares-Pineda, R.; Gómez-Cruz, M.A.; Schwentesius-Rindermann, R.; Carrera-Chávez, B. Alternativas a la producción y mercadeo para la carne de conejo en Tlaxcala, México. Reg. Sociedad. 2009, 21, 191–207. [Google Scholar] [CrossRef]
- García-López, J.C.; Pro-Martínez, A.; Becerril-Pérez, C.M.; Suárez-Oporta, M.E.; Pinos-Rodríguez, J.M. Technical note: Rabbit meat production under a small scale production system as a source of animal protein in a rural of Mexico. World Rabbit Sci. 2006, 14, 259–263. [Google Scholar]
- Barrón, M.C.; Herrera, J.G.; Suárez, M.E.; Zamora, M.M.; Lemus, C. Evaluación de características de canal en tres razas de conejos. Rev. Cuba. Cienc. Agríc. 2004, 38, 19–23. [Google Scholar]
- Montes-Vergara, D.; Lenis, V.C.; Hernández-Herrera, D. Prediction of carcass weight and yield in New Zealand rabbits from body measurements. J. MVZ Cordoba 2020, 25, e1990. [Google Scholar] [CrossRef]
- Michalik, D.; Lewczuk, A.; Wilkiewicz-Wawro, E.; Brozozowski, W. Prediction of the meat content of the carcass and valuable carcass parts in French lop rabbits using some traits measured in vivo and post mortem. Czech J. Anim. Sci. 2006, 51, 406–415. [Google Scholar] [CrossRef]
- Lukefahr, S.D.; Ozimba, C.E. Prediction of carcass merit from live body measurements in rabbits of four breed-types. Livest. Prod. Sci. 1991, 29, 323–334. [Google Scholar] [CrossRef]
- Sam, I.M.; Essien, C.A.; Ekpo, J.S. Phenotypic correlation and carcass traits prediction using live body weight in four genetic groups of rabbit raised in tropical rain-forest zone of Nigeria. Niger. J. Anim. Sci. 2020, 22, 48–56. [Google Scholar]
- Hernández, P.; Pla, M.; Blasco, A. Prediction of carcass composition in the rabbit. Meat Sci. 1996, 44, 75–83. [Google Scholar] [CrossRef]
- González-Redondo, P.; Camacho, T.; González-Sánchez, C.; Reina, R. Bone content of the carcass of wild rabbits hunted in Andalusia (Spain). XXXV Symp. Cunicult. ASESCU 2010, 99–103. Available online: https://idus.us.es/bitstream/handle/11441/52651/gonzalez35Symposium_Segovia2010.pdf?sequence=1&isAllowed=y (accessed on 10 November 2021).
- McKinney, W. Data Structures for Statistical Computing in Python, Version = 1.1.3. Available online: https://pandas.pydata.org/ (accessed on 10 November 2021).
- Newville, M.; Stensitzki, T.; Allen, D.B.; Ingargiola, A. LMFIT: Non-Linear Least-Square Minimization and Curve-Fitting for Python, Version = 1.0.2. Available online: https://zenodo.org/record/11813#.Ybo5ftDMK00 (accessed on 10 November 2021).
- Hunter, J.D. Matplotlib: A 2D Graphics Environment, Version = 3.3.2. Available online: https://matplotlib.org/ (accessed on 10 November 2021).
- Pedregosa, F.; Varoquaux, G.; Gramfort, A.; Thirion, B.; Blondel, M.; Prettenhofer, P.; Weiss, R.; Perrot, M.; Duchesnay, E. Scikit-Learn: Machine Learning in Python, Version = 0.23.2. Available online: https://scikit-learn.org/ (accessed on 10 November 2021).
- Ortiz-Hernández, J.A.; Rubio-Lozano, M.S. Effect of breed and sex on rabbit carcass yield and meat quality. World Rabbit Sci. 2001, 9, 51–56. [Google Scholar] [CrossRef]
- Paci, G.; Cecchi, F.; Preziuso, G.; Ciampolini, R.; D’Agata, M. Carcass traits and meat quality of two different rabbits genotypes. Italian J. Anim. Sci. 2012, 11, e45. [Google Scholar] [CrossRef][Green Version]
- Venturini, R.S.; Carvalho, S.; Pacheco, P.S.; Ribeiro, A.C.; de Pellegrin, S.; Martins, A.A.; Lopes, J.F.; Moro, A.B.; Simoes, R.R. Characteristics of carcass and of non-carcass components of lambs and hoggets fed high-concentrate corn or sorghum diets. R. Bras. Zootec. 2017, 46, 257–263. [Google Scholar] [CrossRef]
- Nascimento, U.F.S.; Santos, G.R.A.; Azevedo, C.S.; Macedo, F.A.F.; Goncalves, T.R.; Bomfim, L.E.L.M.; Farias, J.S.; Santos, A.D.F. Performance and carcass characteristics of lambs ½ Dorper + ½ Santa Inês, slaughtered with different thicknesses of subcutaneous fat. Rev. Bras. Saúde Prod. Anim. 2018, 19, 125–135. [Google Scholar] [CrossRef][Green Version]
- Blasco, A.; Estany, J.; Baselga, M. Prediction of rabbit meat and bone weight using carcass measurements and sample cuts. Ann. Zootech. 1984, 33, 161–170. [Google Scholar] [CrossRef]


| Variable | Description | Mean ± SD | Maximum | Minimum |
|---|---|---|---|---|
| BW | Body weight (g) | 1351 ± 347 | 2491 | 718 |
| HCW | Hot carcass weight (g) | 698 ± 221 | 1390 | 297 |
| CCW | Cold carcass weight (g) | 696 ± 171 | 1334 | 280 |
| DL | Dorsal length (cm) | 26.5 ± 2.83 | 30.8 | 18.0 |
| TD | Thoracic depth (cm) | 9.71 ± 1.38 | 14.0 | 7.00 |
| CL | Carcass length (cm) | 31.7 ± 3.18 | 37.5 | 22.2 |
| TL | Thigh length (cm) | 5.27 ± 0.97 | 7.00 | 3.40 |
| LC | Lumbar circumference (cm) | 13.9 ± 2.02 | 18.9 | 9.40 |
| CCI | Carcass compactness index (g/cm) | 21.6 ± 5.15 | 37.0 | 11.5 |
| TCM | Total carcass muscle (g) | 488 ± 171 | 1045 | 191 |
| TCB | Total carcass bone (g) | 207 ± 61.4 | 344 | 80.2 |
| HCW | CCW | DL | TD | CL | TL | LC | CCI | TCM | TCB | |
|---|---|---|---|---|---|---|---|---|---|---|
| BW | 0.97 * | 0.98 * | 0.70 * | 0.86 * | 0.81 | 0.56 | 0.87 * | 0.96 * | 0.97 * | 0.68 * |
| HCW | 0.99 * | 0.74 * | 0.83 * | 0.84 | 0.50 * | 0.91 * | 0.97 * | 0.98 * | 0.73 * | |
| CCW | 0.76 * | 0.84 * | 0.83 * | 0.52 * | 0.90 * | 0.97 * | 0.97 * | 0.76 * | ||
| DL | 0.54 * | 0.95 * | 0.19 ns | 0.60 * | 0.61 * | 0.67 * | 0.77 * | |||
| TD | 0.67 * | 0.62 * | 0.81 * | 0.82 * | 0.86 * | 0.47 * | ||||
| CL | 0.45 * | 0.69 * | 0.71 * | 0.78 * | 0.75 * | |||||
| TL | 0.50 * | 0.51 ** | 0.55 * | 0.16 ns | ||||||
| LC | 0.91 | 0.90 * | 0.62 * | |||||||
| CCI | 0.96 * | 0.68 * | ||||||||
| TCM | 0.59 * |
| No | Equations | R2 | MSE | RMSE | AIC | BIC | CV | p-Value |
|---|---|---|---|---|---|---|---|---|
| 1 | TCM (g) = −214 (±28.4 ***) + 32.3 (±1.27 ***) × CCI | 0.93 | 2058.5 | 45.4 | 375.8 | 376.1 | 9.30 | <0.0001 |
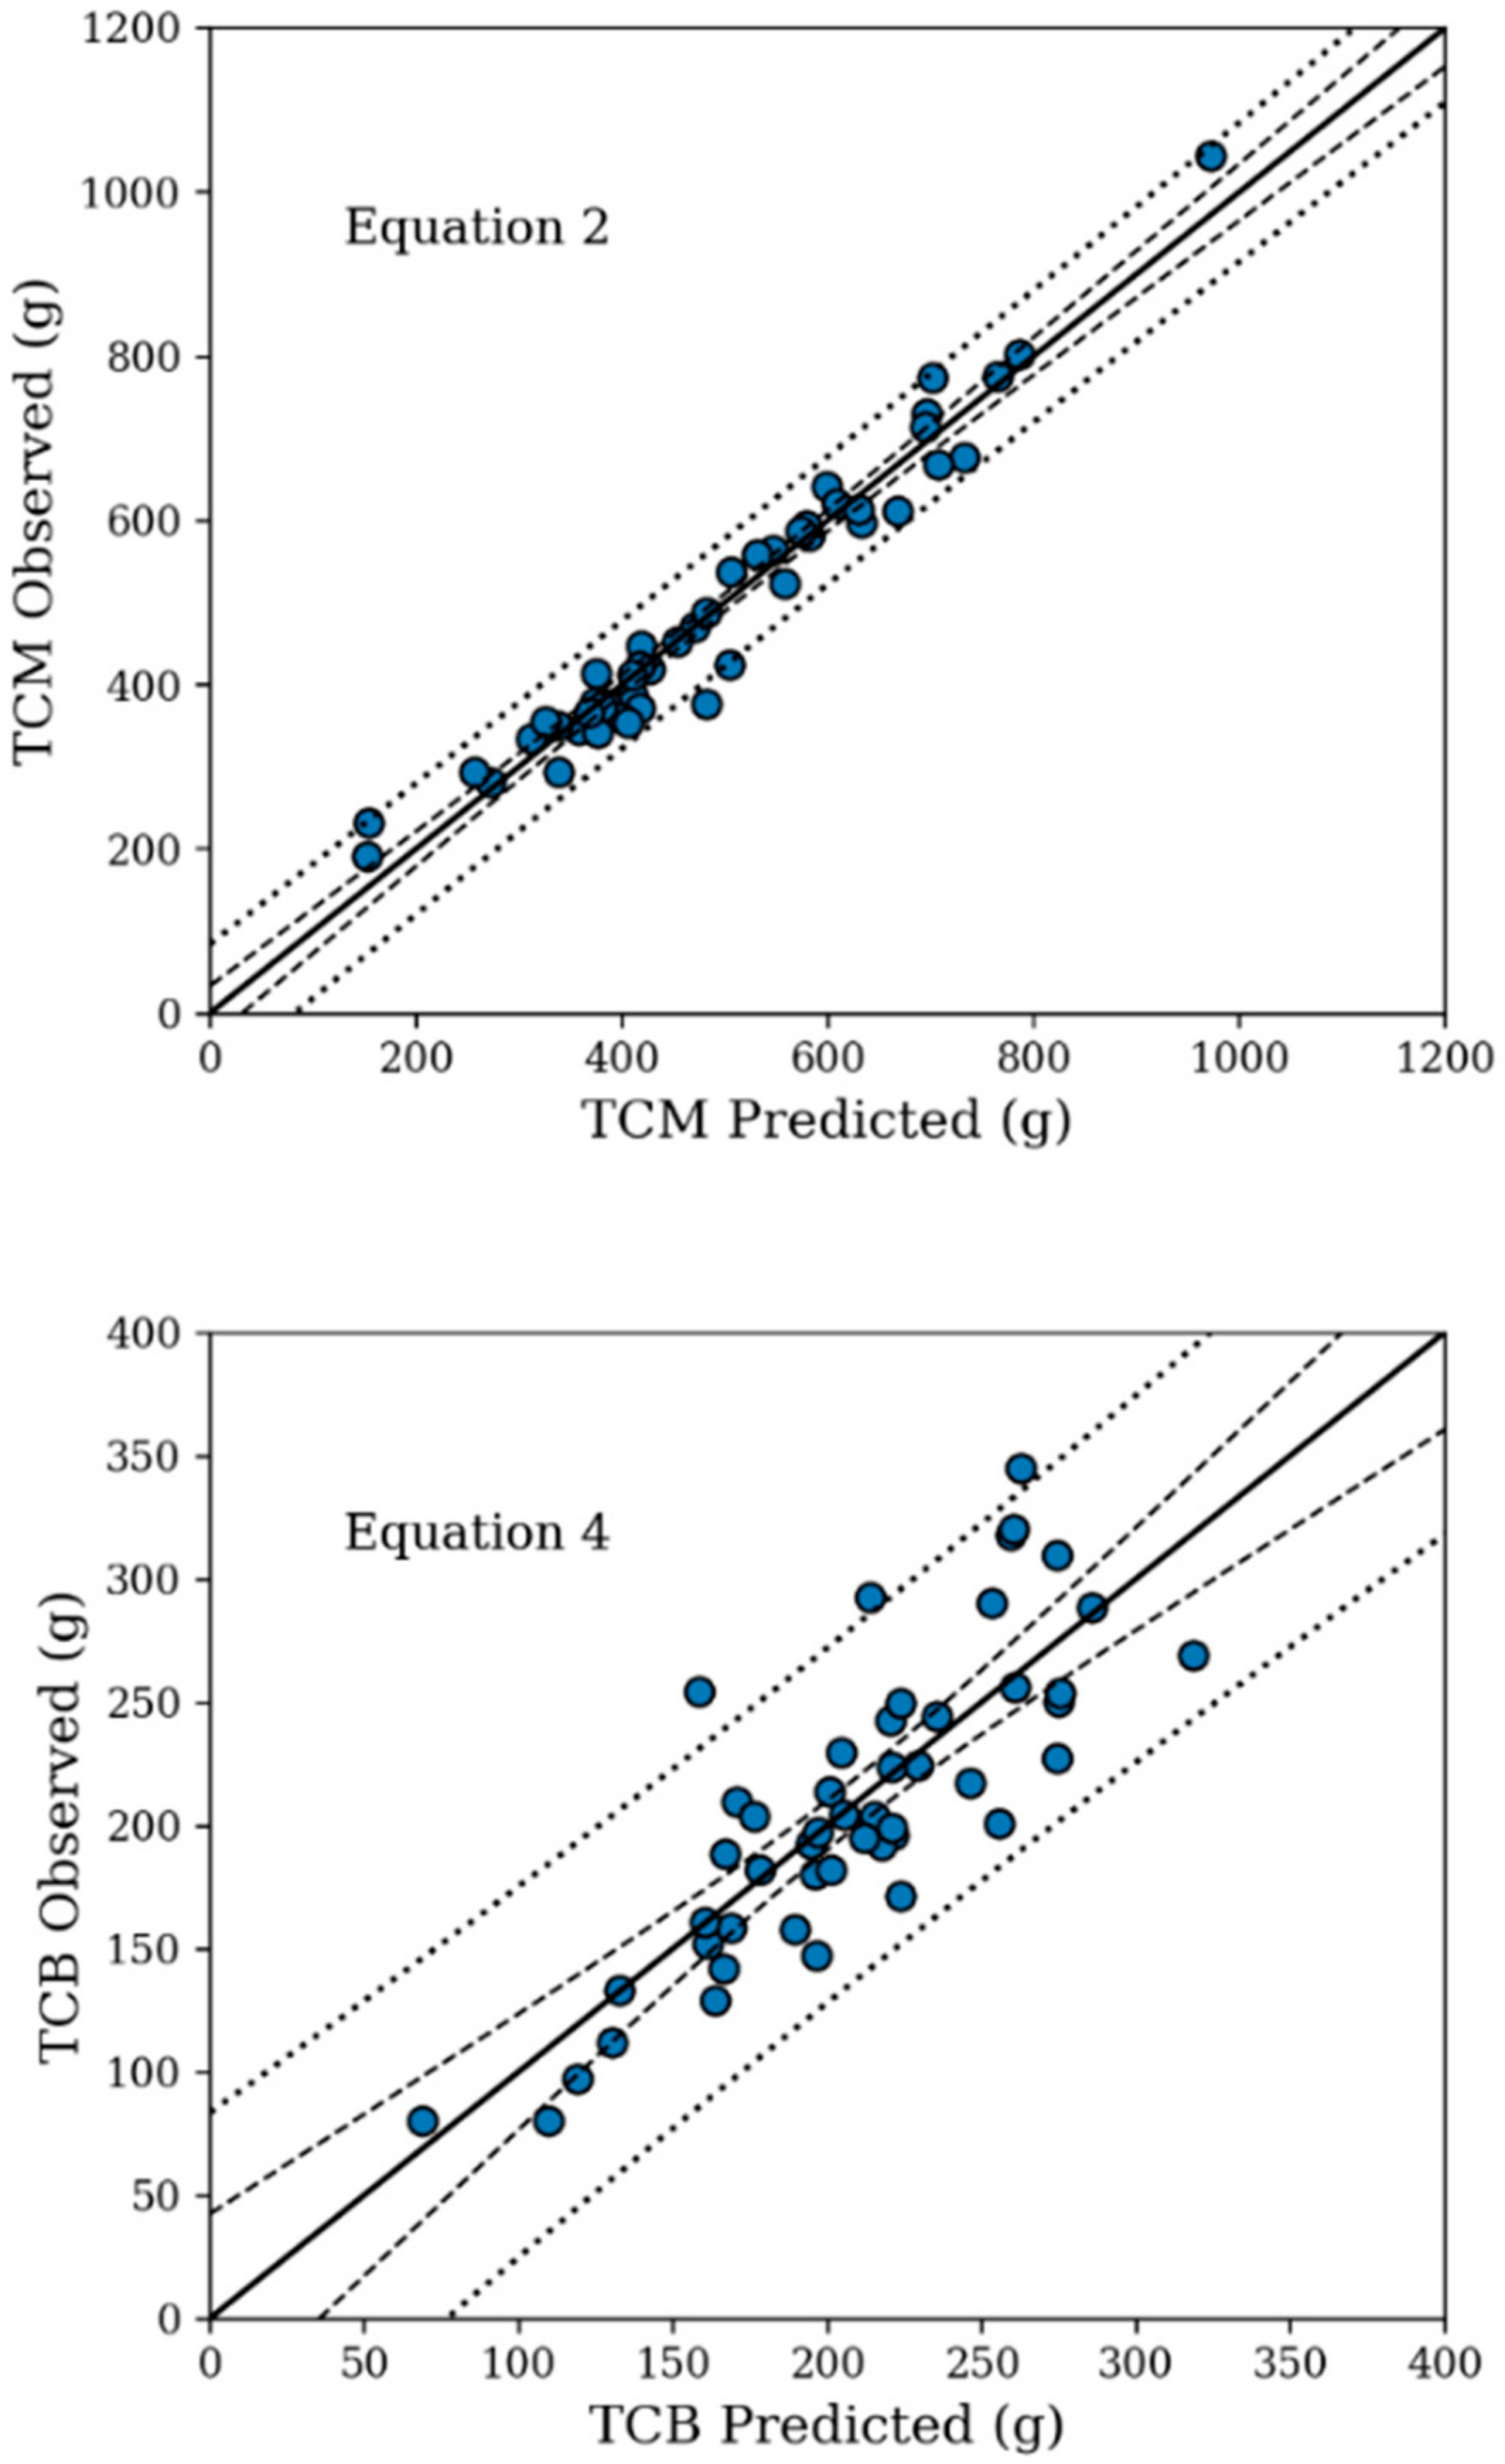
| 2 | TCM (g) = −455 (±60.2 ***) + 10.8 (±2.47 ***) × CL + 27.5 (±1.52 ***) × CCI | 0.95 | 1487.4 | 38.6 | 360.8 | 362.9 | 7.91 | <0.0001 |
| 3 | TCB (g) = −236 (±53.1 ***) + 16.7 (±1.98 ***) × DL | 0.60 | 1543.2 | 39.3 | 361.6 | 362.9 | 18.9 | <0.0001 |
| 4 | TCB (g) = −205 (±49.3 ***) + 12.1 (±2.29 ***) × DL + 4.13 (±1.27 *) × CCI | 0.67 | 1282.7 | 35.8 | 353.5 | 355.7 | 17.3 | <0.0001 |
| Equation No. | n | R2 | MSEP | RMSEP | MAE |
|---|---|---|---|---|---|
| 2 | 50 | 0.93 | 1112.9 | 33.4 | 29.8 |
| 4 | 50 | 0.57 | 1336.6 | 36.6 | 28.2 |
Publisher’s Note: MDPI stays neutral with regard to jurisdictional claims in published maps and institutional affiliations. |
© 2022 by the authors. Licensee MDPI, Basel, Switzerland. This article is an open access article distributed under the terms and conditions of the Creative Commons Attribution (CC BY) license (https://creativecommons.org/licenses/by/4.0/).
Share and Cite
Croda-Andrade, A.Y.; Valencia-García, C.G.; Arbez-Abnal, T.A.; Portillo-Salgado, R.; Estrada-León, R.J.; Vázquez-Martínez, I.; Camacho-Pérez, E.; Vargas-Bello-Pérez, E.; Chay-Canul, A.J. Using Post-Mortem Measurements to Predict Carcass Tissue Composition in Growing Rabbits. Animals 2022, 12, 605. https://doi.org/10.3390/ani12050605
Croda-Andrade AY, Valencia-García CG, Arbez-Abnal TA, Portillo-Salgado R, Estrada-León RJ, Vázquez-Martínez I, Camacho-Pérez E, Vargas-Bello-Pérez E, Chay-Canul AJ. Using Post-Mortem Measurements to Predict Carcass Tissue Composition in Growing Rabbits. Animals. 2022; 12(5):605. https://doi.org/10.3390/ani12050605
Chicago/Turabian StyleCroda-Andrade, Andrea Y., Cristell G. Valencia-García, Tomas A. Arbez-Abnal, Rodrigo Portillo-Salgado, Raciel J. Estrada-León, Ignacio Vázquez-Martínez, Enrique Camacho-Pérez, Einar Vargas-Bello-Pérez, and Alfonso J. Chay-Canul. 2022. "Using Post-Mortem Measurements to Predict Carcass Tissue Composition in Growing Rabbits" Animals 12, no. 5: 605. https://doi.org/10.3390/ani12050605
APA StyleCroda-Andrade, A. Y., Valencia-García, C. G., Arbez-Abnal, T. A., Portillo-Salgado, R., Estrada-León, R. J., Vázquez-Martínez, I., Camacho-Pérez, E., Vargas-Bello-Pérez, E., & Chay-Canul, A. J. (2022). Using Post-Mortem Measurements to Predict Carcass Tissue Composition in Growing Rabbits. Animals, 12(5), 605. https://doi.org/10.3390/ani12050605