
Rider Variables Affecting the Stirrup Directional Force Asymmetry during Simulated Riding Trot

 , , , and
Abstract
Simple Summary
Abstract
1. Introduction
2. Materials and Methods
2.1. Sample
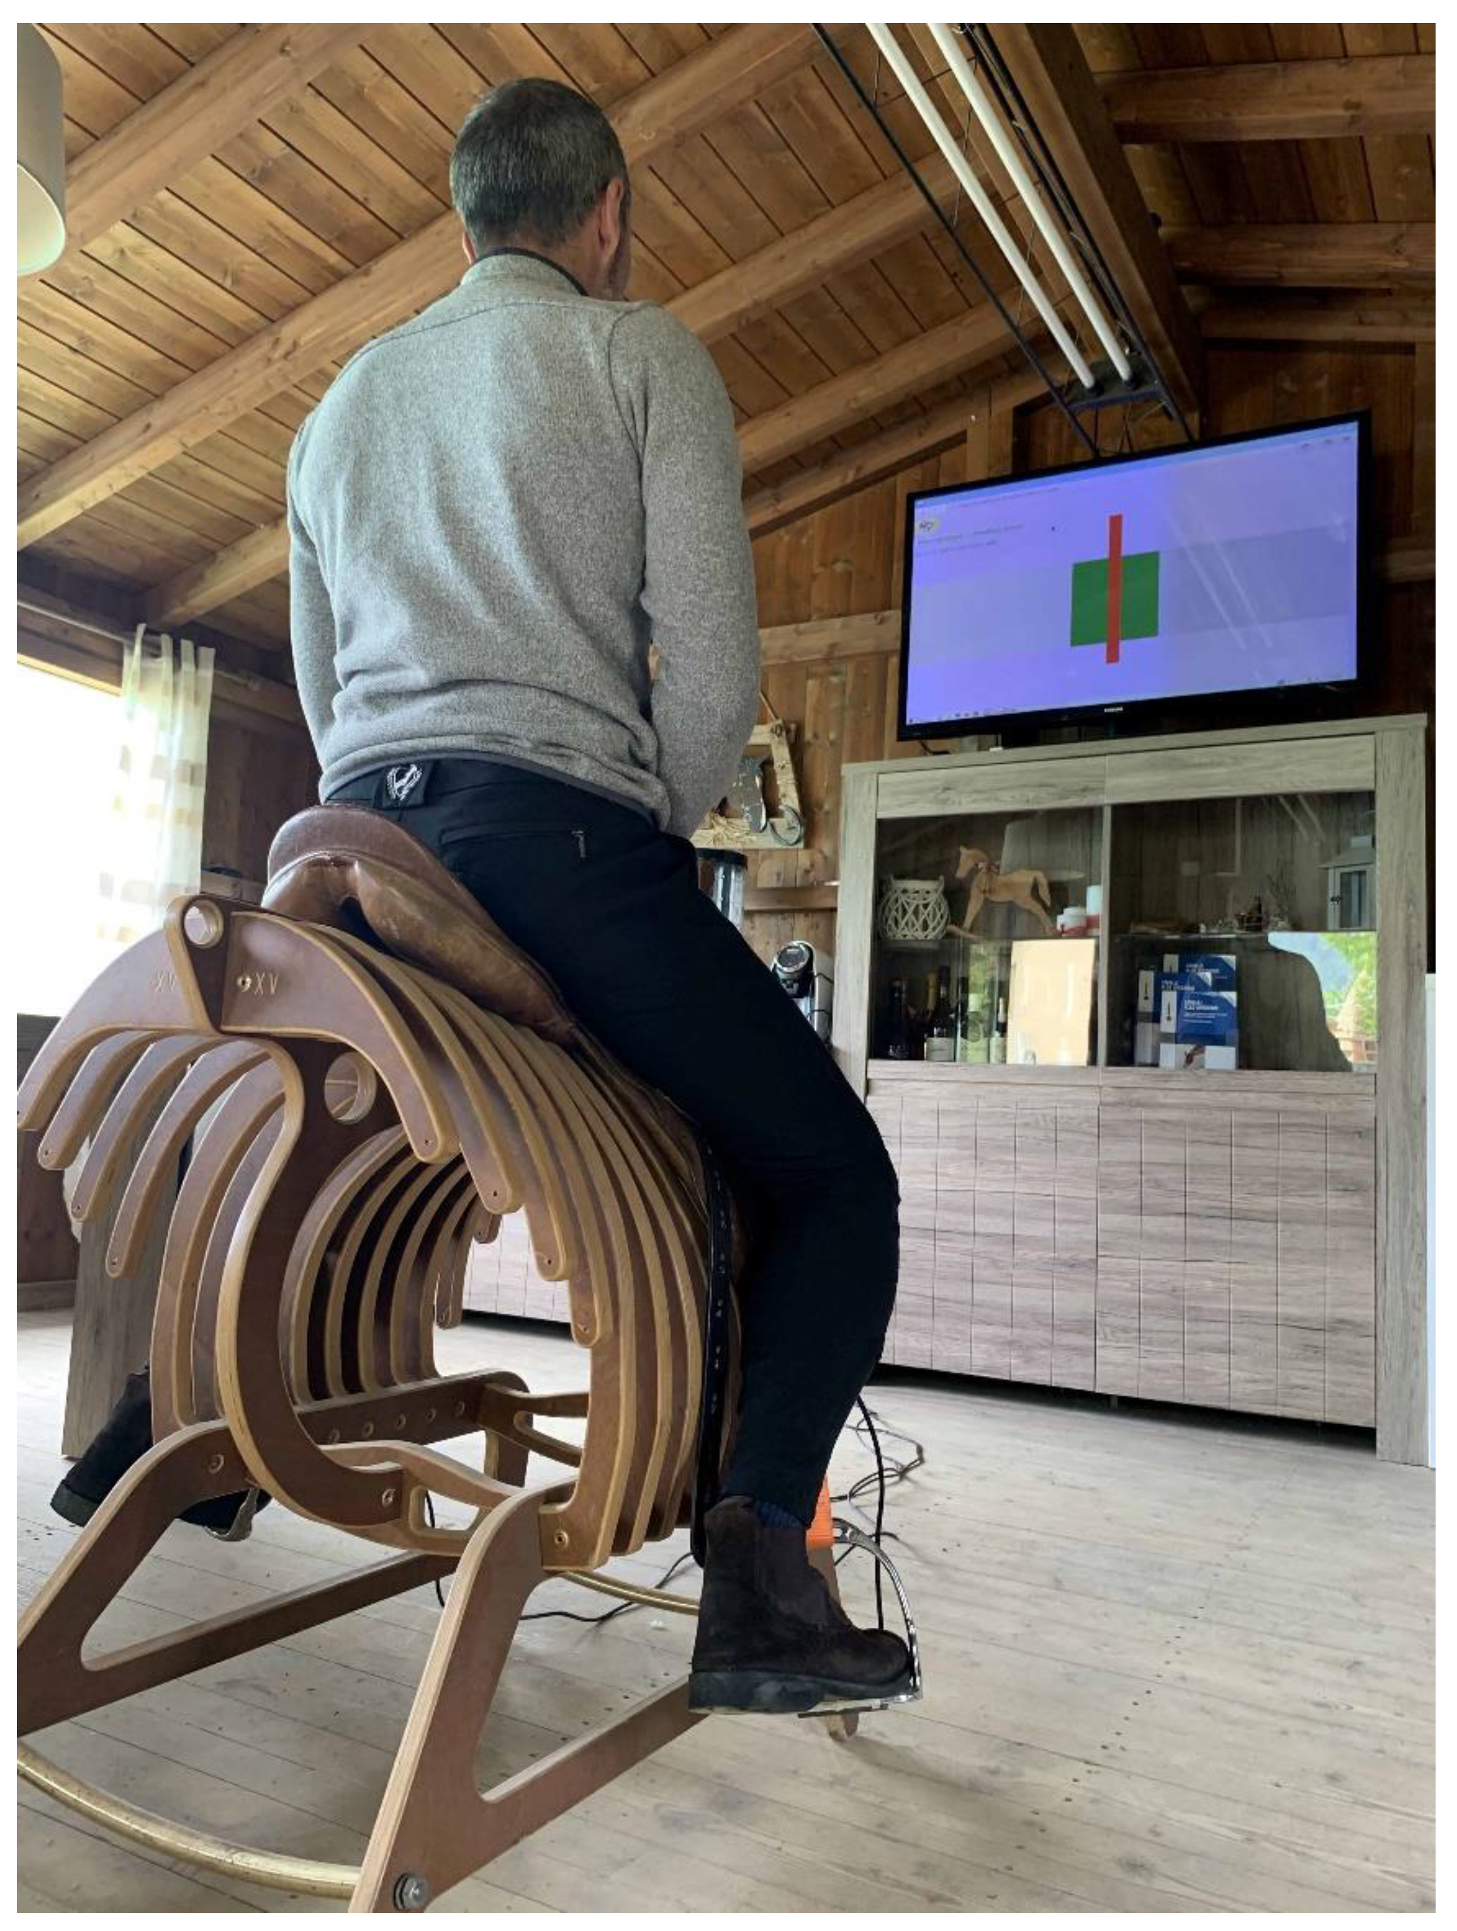
2.2. Saddle Test
2.3. Statistical Analysis
3. Results
4. Discussion
5. Conclusions
Author Contributions
Funding
Institutional Review Board Statement
Informed Consent Statement
Data Availability Statement
Acknowledgments
Conflicts of Interest
References
- Clayton, H.M.; Hobbs, S.-J. The role of biomechanical analysis of horse and rider in equitation science. Appl. Anim. Behav. Sci. 2017, 190, 123–132. [Google Scholar] [CrossRef]
- Gunst, S.; Dittmann, M.T.; Arpagaus, S.; Roepstorff, C.; Latif, S.N.; Klaassen, B.; Pauli, C.A.; Bauer, C.M.; Weishaupt, M.A. Influence of functional rider and horse asymmetries on saddle force distribution during stance and in sitting trot. J. Equine Vet. Sci. 2019, 78, 20–28. [Google Scholar] [CrossRef] [PubMed]
- Nevison, C.M.; Timmis, M.A. The effect of physiotherapy intervention to the pelvic region of experienced riders on seated postural stability and the symmetry of pressure distribution to the saddle: A preliminary study. J. Vet. Behav. 2013, 8, 261–264. [Google Scholar] [CrossRef]
- Ogi, A.; Fortunato, D. Influence of the familiarity with the handler on the dog’s paw preference. Dog Behav. 2017, 3, 13–18. [Google Scholar] [CrossRef]
- Maupas, E.; Paysant, J.; Datie, A.; Martinet, N.; André, J. Functional asymmetries of the lower limbs. A comparison between clinical assessment of laterality, isokinetic evaluation and electrogoniometric monitoring of knees during walking. Gait Posture 2002, 16, 304–312. [Google Scholar] [CrossRef]
- Symes, D.; Ellis, R. A preliminary study into rider asymmetry within equitation. Vet. J. 2009, 181, 34–37. [Google Scholar] [CrossRef] [PubMed]
- van Beek, F.E.; de Cocq, P.; Timmerman, M.; Muller, M. Stirrup forces during horse riding: A comparison between sitting and rising trot. Vet. J. 2012, 193, 193–198. [Google Scholar] [CrossRef] [PubMed]
- Münz, A.; Eckardt, F.; Witte, K. Horse–rider interaction in dressage riding. Hum. Mov. Sci. 2014, 33, 227–237. [Google Scholar] [CrossRef] [PubMed]
- de Cocq, P.; Clayton, H.M.; Terada, K.; Muller, M.; van Leeuwen, J.L. Usability of normal force distribution measurements to evaluate asymmetrical loading of the back of the horse and different rider positions on a standing horse. Vet. J. 2009, 181, 266–273. [Google Scholar] [CrossRef] [PubMed]
- MacKechnie-Guire, R.; MacKechnie-Guire, E.; Fairfax, V.; Fisher, M.; Hargreaves, S.; Pfau, T. The effect that induced rider asymmetry has on equine locomotion and the range of motion of the thoracolumbar spine when ridden in rising trot. J. Equine Vet. Sci. 2020, 88, 102946. [Google Scholar] [CrossRef] [PubMed]
- Martin, P.; Cheze, L.; Pourcelot, P.; Desquilbet, L.; Duray, L.; Chateau, H. Effect of the rider position during rising trot on the horse’s biomechanics (back and trunk kinematics and pressure under the saddle). J. Biomech. 2016, 49, 1027–1033. [Google Scholar] [CrossRef] [PubMed]
- Hawson, L.A.; Koprinska, I.; McLean, A.N.; McGreevy, P.D. Deciphering the cues from riders’ legs. J. Vet. Behav. Clin. Appl. Res. 2013, 2, e9. [Google Scholar] [CrossRef]
- Bye, T.L.; Lewis, V. Saddle and stirrup forces of equestrian riders in sitting trot, rising trot, and trot without stirrups on a riding simulator. Comp. Exerc. Physiol. 2020, 16, 75–85. [Google Scholar] [CrossRef]
- Seeley, M.K.; Umberger, B.R.; Clasey, J.L.; Shapiro, R. The relation between mild leg-length inequality and able-bodied gait asymmetry. J. Sports Sci. Med. 2010, 9, 572. [Google Scholar] [PubMed]
- Peham, C.; Kotschwar, A.B.; Borkenhagen, B.; Kuhnke, S.; Molsner, J.; Baltacis, A. A comparison of forces acting on the horse’s back and the stability of the rider’s seat in different positions at the trot. Vet. J. 2010, 184, 56–59. [Google Scholar] [CrossRef] [PubMed]
- Gandy, E.A.; Bondi, A.; Hogg, R.; Pigott, T.M.C. A preliminary investigation of the use of inertial sensing technology for the measurement of hip rotation asymmetry in horse riders. Sport. Technol. 2014, 7, 79–88. [Google Scholar] [CrossRef]
- Padalino, B.; Raidal, S.L.; Hall, E.; Knight, P.; Celi, P.; Jeffcott, L.; Muscatello, G. A Survey on Transport Management Practices Associated with Injuries and Health Problems in Horses. PLoS ONE 2016, 11, 1–16. [Google Scholar] [CrossRef] [PubMed]
- Thompson, K.; Clarkson, L. How owners determine if the social and bejavioral needs of their horses are being met: Findings from an Australian online survey. J. Vet. Behav. 2019, 29, 128–133. [Google Scholar] [CrossRef]


| Explanatory Variables | Categories |
|---|---|
| Gender (n/%) | Females 77/147 (52.4%) Males 70/147 (47.6%) |
| Mean age (± SD) | 37.8 ± 12.4 |
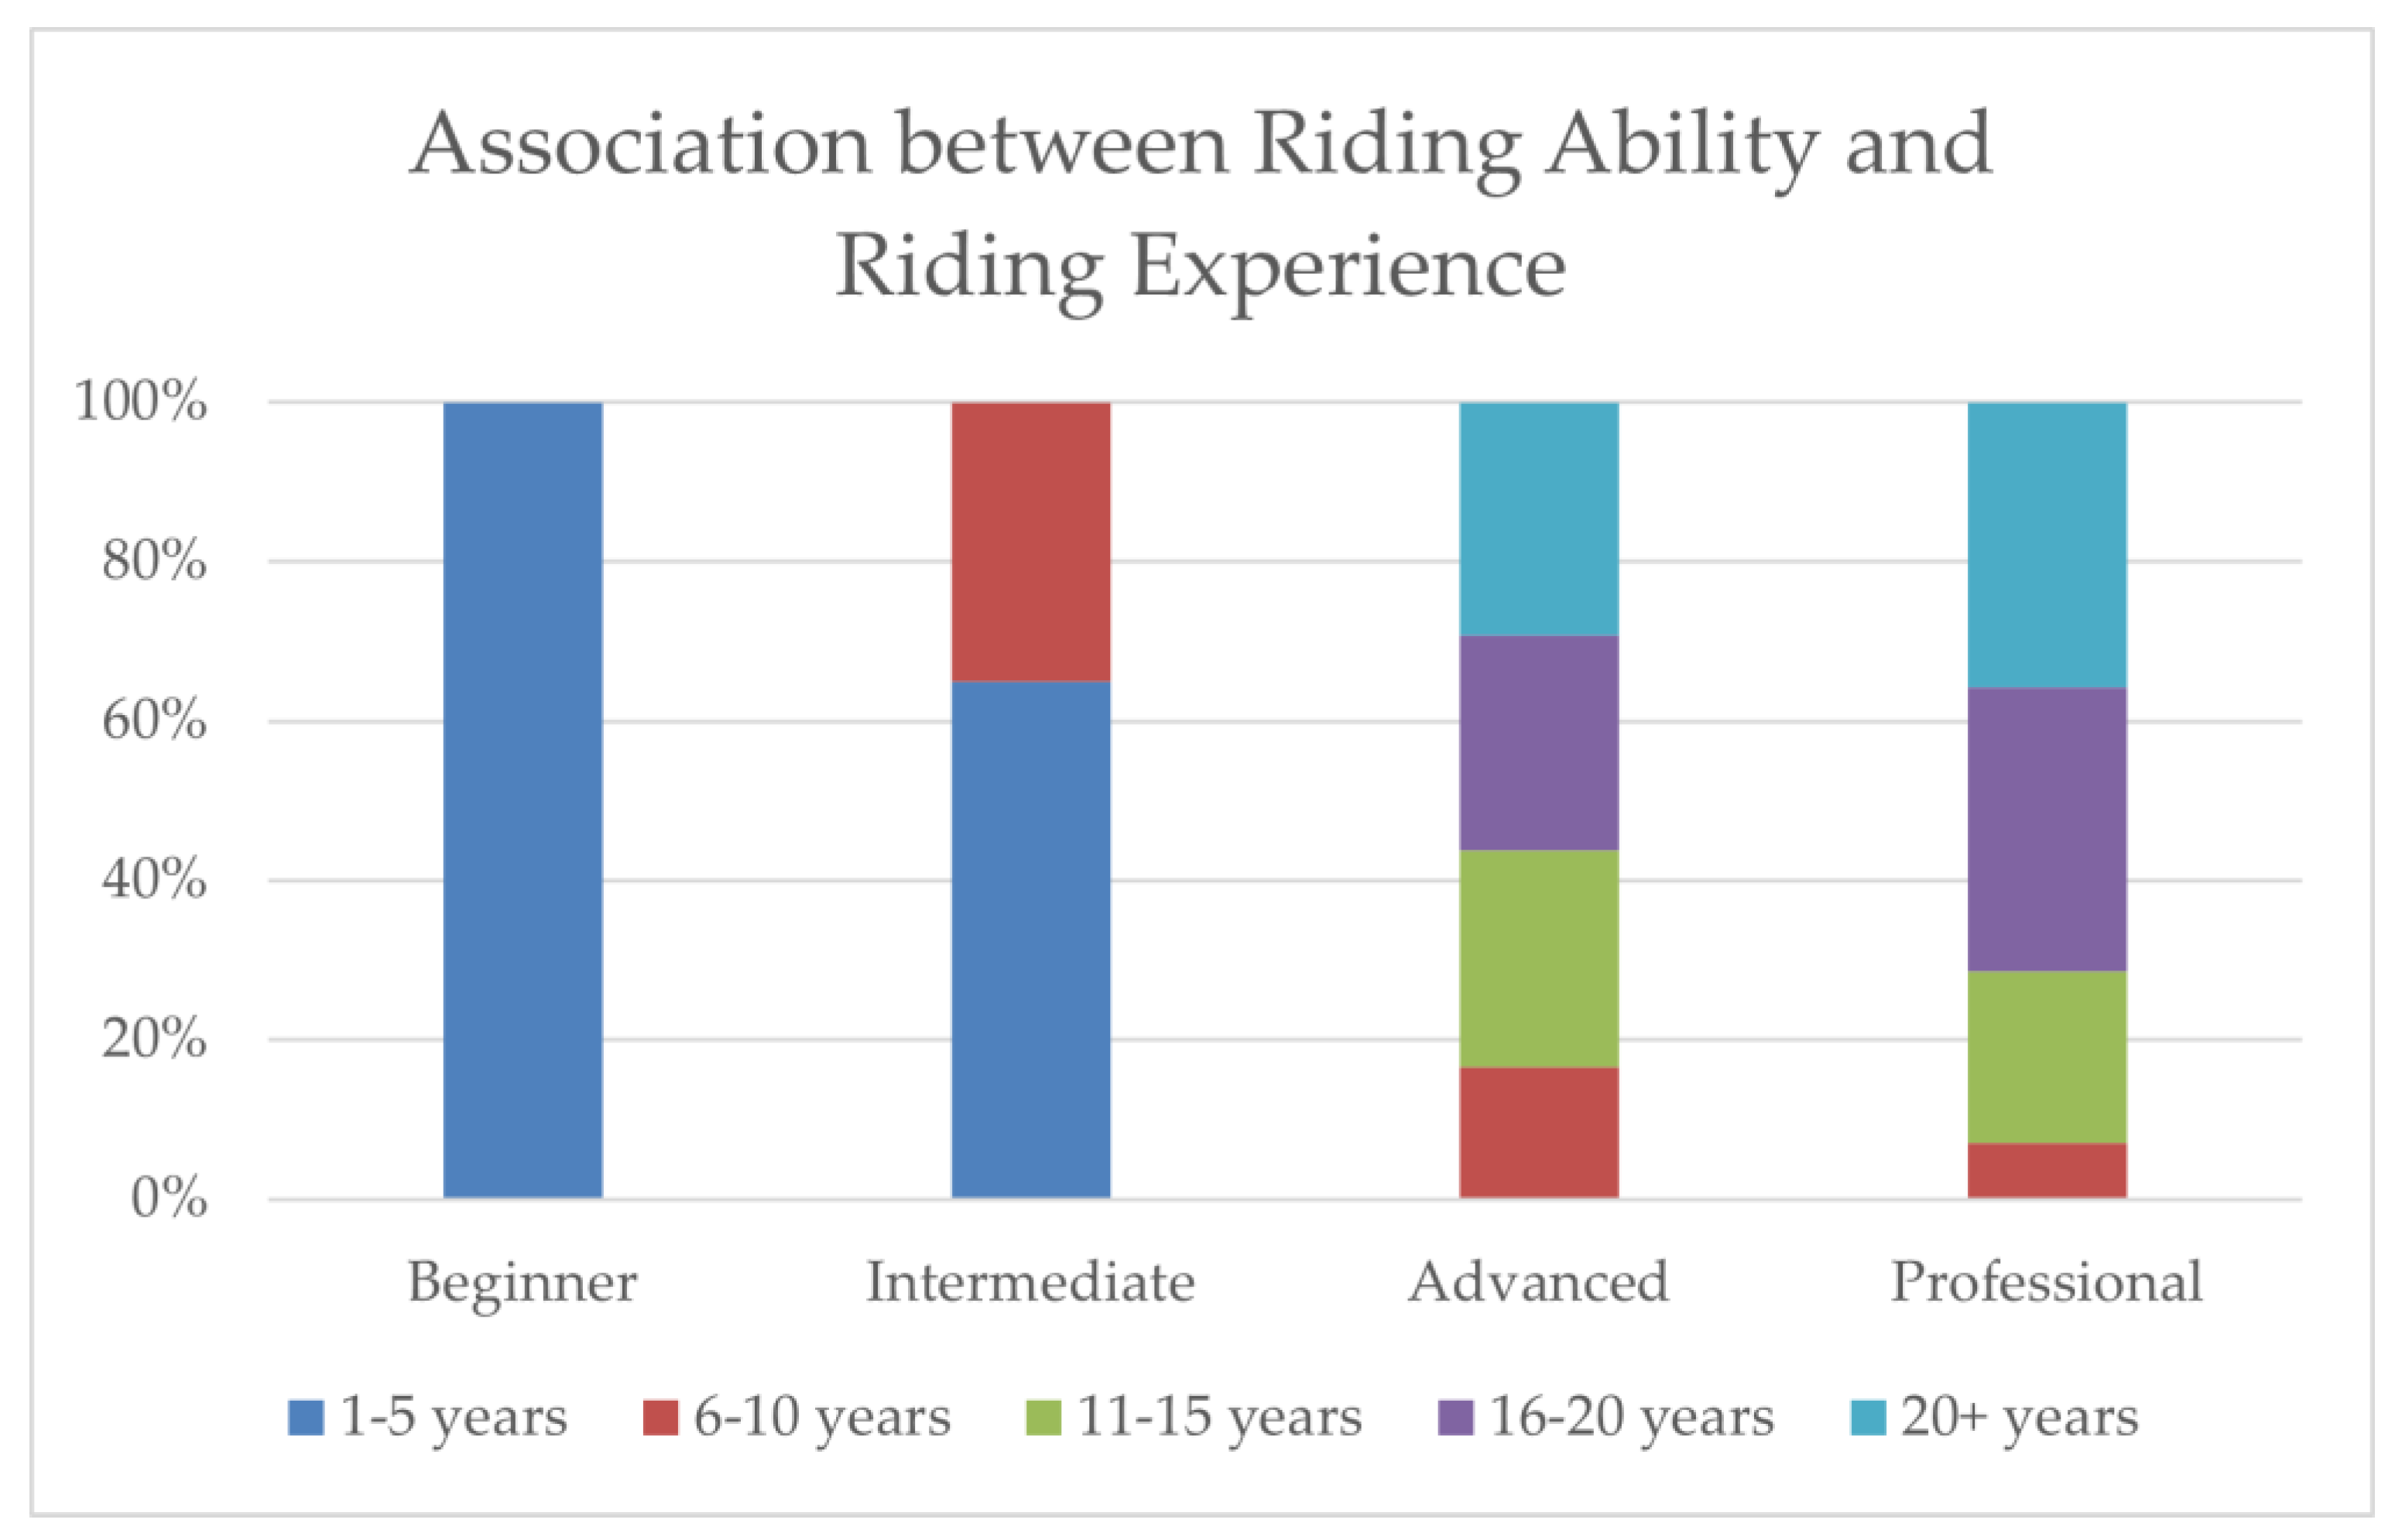
| Level of riding ability 1 (n/%) | Beginner 27/147 (18.4%) Intermediate 28/147 (19%) Advanced 71/147 (48.3%) Professional 21/147 (14.3%) |
| Years of riding experience 2 (n/%) | 1—45/147 (30.6%) 2—23/147 (15.6%) 3—23/147 (15.6%) 4—27/147 (18.4%) 5—29/147 (19.8%) |
| Riding style 3 (n/%) | Working riding 87/147 (59.2%) English riding 60/147 (40.8%) |
| Motivation of riding 4 (n/%) | Leisure 103/147 (70.1%) Competitive 44/147 (29.9%) |
| Discipline 5 (n/%) | Show jumping 11/147 (7.5%) Flatwork 42/147 (28.6%) Western 20/147 (13.6%) Hacking 59/147 (40.1%) Other 15/147 (10.2%) |
| Handedness (n/%) | Right 127/147 (86.4%) Left 8/147 (5.4%) Both 12/147 (8.2%) |
| Parameter | Phase 1 (L) | Phase 1 (R) | Phase 2 (L) | Phase 2 (R) | Phase 3 (L) | Phase 3 (R) |
|---|---|---|---|---|---|---|
| Mean | 674.72 | 820.54 | 2468.11 | 2583.62 | 1709.42 | 1746.13 |
| SD | 43.96 | 51.18 | 38.49 | 32.55 | 656.75 | 670.52 |
| min | 452.65 | 633.11 | 2345.01 | 2485.80 | 390.04 | 399.55 |
| max | 741.91 | 911.47 | 2525.11 | 2663.06 | 2608.00 | 2527.41 |
| Median | 674.26 | 810.11 | 2475.22 | 2587.17 | 2042.71 | 2059.43 |
| Parameter | Phase 1 (L) | Phase 1 (R) | Phase 2 (L) | Phase 2 (R) | Phase 3 (L) | Phase 3 (R) |
|---|---|---|---|---|---|---|
| Mean | 655.08 | 658.26 | 2044.30 | 2038.20 | 1409.27 | 1409.73 |
| SD | 255.33 | 250.40 | 488.40 | 468.26 | 684.66 | 667.20 |
| min | 20.14 | 4.31 | 213.19 | 154.96 | 24.60 | 58.70 |
| max | 1468.13 | 1801.74 | 4646.87 | 4520.36 | 3952.98 | 4066.92 |
| Median | 609.22 | 598.29 | 1948.48 | 1960.61 | 1427.75 | 1422.69 |
| Parameter | Phase 1 (L) | Phase 1 (R) | Phase 2 (L) | Phase 2 (R) | Phase 3 (L) | Phase 3 (R) | ||||||
|---|---|---|---|---|---|---|---|---|---|---|---|---|
| ER | WR | ER | WR | ER | WR | ER | WR | ER | WR | ER | WR | |
| Mean | 597.32 | 696.24 | 608.11 | 694.01 | 1943.32 | 2116.28 | 1955.34 | 2097.25 | 1340.88 | 1458.04 | 1348.39 | 1453.45 |
| SD | 200.69 | 280.86 | 209.05 | 270.51 | 423.19 | 518.15 | 424.80 | 488.43 | 637.11 | 712.67 | 631.18 | 688.43 |
| min | 20.14 | 211.75 | 4.31 | 247.68 | 422.61 | 213.19 | 436.23 | 154.96 | 80.13 | 24.6 | 81.85 | 58.70 |
| max | 1445.18 | 1468.13 | 1801.74 | 1625.49 | 3148.86 | 4646.87 | 3117.67 | 4520.36 | 3224.27 | 3952.98 | 3115.39 | 4066.92 |
| Median | 599.53 | 618.355 | 582.91 | 627.87 | 1851.92 | 2006.45 | 1814.24 | 2957.27 | 1397.55 | 1454.60 | 1383.90 | 1456.41 |
| Explanatory Variables | Asymmetrical Riders | Symmetrical Riders |
|---|---|---|
| Gender (n/%) | Females 30/68 (44.1%) Males 38/68 (55.9%) | Females 47/79 (59.5%) Males 32/79 (40.5%) |
| Mean age (±SD) | 39.7 ± 12.3 | 37.1 ± 12.5 |
| Level of riding ability 1 (n/%) | Beginner 16/68 (23.5%) Intermediate 12/68 (17.7%) Advanced 30/68 (44.1%) Professional 10/68 (14.7%) | Beginner 11/79 (13.9%) Intermediate 16/79 (20.3%) Advanced 41/79 (51.9%) Professional 11/79 (13.9%) |
| Years of riding experience 2 (n/%) | 1—25/68 (36.8%) 2—10/68 (14.7%) 3—8/68 (11.8%) 4—12/68 (17.7%) 5—13/68 (19.1%) | 1—20/79 (25.3%) 2—13/79 (16.5%) 3—15/79 (19%) 4—15/79 (19%) 5—16/79 (20.3%) |
| Riding style 3 (n/%) | Working riding 47/68 (69.1%) English riding 21/68 (30.9%) | Working riding 40/79 (50.6%) English riding 39/79 (49.4%) |
| Motivation of riding 4 (n/%) | Leisure 49/68 (72.1%) Competitive 19/68 (27.9%) | Leisure 54/79 (68.4%) Competitive 25/79 (31.6%) |
| Discipline 5 (n/%) | Show jumping 3/68 (4.4%) Flatwork 21/68 (30.9%) Western 11/68 (16.2%) Hacking 29/68 (42.7%) Other 4/68 (5.9%) | Show jumping 8/79 (10.1%) Flatwork 21/79 (26.6%) Western 9/79 (11.4%) Hacking 30/79 (38%) Other 11/79 (13.9%) |
| Handedness (n/%) | Right 58/68 (85.3%) Left 4/68 (5.9%) Both 6/68 (8.8%) | Right 69/79 (87.3%) Left 4/79 (5.1%) Both 6/79 (7.6%) |
Publisher’s Note: MDPI stays neutral with regard to jurisdictional claims in published maps and institutional affiliations. |
© 2022 by the authors. Licensee MDPI, Basel, Switzerland. This article is an open access article distributed under the terms and conditions of the Creative Commons Attribution (CC BY) license (https://creativecommons.org/licenses/by/4.0/).
Share and Cite
Baragli, P.; Alessi, A.; Pagliai, M.; Felici, M.; Ogi, A.; Hawson, L.; Gazzano, A.; Padalino, B. Rider Variables Affecting the Stirrup Directional Force Asymmetry during Simulated Riding Trot. Animals 2022, 12, 3364. https://doi.org/10.3390/ani12233364
Baragli P, Alessi A, Pagliai M, Felici M, Ogi A, Hawson L, Gazzano A, Padalino B. Rider Variables Affecting the Stirrup Directional Force Asymmetry during Simulated Riding Trot. Animals. 2022; 12(23):3364. https://doi.org/10.3390/ani12233364
Chicago/Turabian StyleBaragli, Paolo, Alberto Alessi, Marco Pagliai, Martina Felici, Asahi Ogi, Lesley Hawson, Angelo Gazzano, and Barbara Padalino. 2022. "Rider Variables Affecting the Stirrup Directional Force Asymmetry during Simulated Riding Trot" Animals 12, no. 23: 3364. https://doi.org/10.3390/ani12233364
APA StyleBaragli, P., Alessi, A., Pagliai, M., Felici, M., Ogi, A., Hawson, L., Gazzano, A., & Padalino, B. (2022). Rider Variables Affecting the Stirrup Directional Force Asymmetry during Simulated Riding Trot. Animals, 12(23), 3364. https://doi.org/10.3390/ani12233364