Simple Summary
Fecundity is an important economic trait of sheep that directly affects their economic and productive efficiency. Our study aimed to identify single nucleotide polymorphism (SNP) loci associated with sheep puberty or litter size which could be used in future breeding programs to improve fertility. We obtained one SNP on GNAQ gene (NC_040253.1: g.62677376G > A), which was associated with litter size in Cele Black sheep. Perhaps this SNP could be a criterion to screen polytocous sheep.
Abstract
Fecundity is an important economic trait in sheep that directly affects their economic and productive efficiency. Our study aimed to identify SNP loci associated with sheep puberty or litter size which could be used in future breeding programs to improve fertility. Genomic DNA was obtained from Hetian and Cele Black sheep breeds and used for reduced-representation genome sequencing to identify SNP loci associated with pubertal initiation and litter size. Selective signatures analysis was performed based on the fixation index and nucleotide diversity, followed by pathway analysis of the genes contained in the selected regions. The selected SNP loci in the genes associated with pubertal initiation and litter size were validated using both sheep breeds. In total, 384,718 high quality SNPs were obtained and 376 genes were selected. Functional annotation of genes and enrichment analysis identified 12 genes associated with pubertal initiation and 11 genes associated with litter size. SNP locus validation showed that two SNP on PAK1 and four on ADCY1 may be associated with pubertal initiation, and one SNP on GNAQ gene (NC_040253.1: g.62677376G > A) was associated with litter size in Cele Black sheep. Our results provide new theoretical support for sheep breeding.
1. Introduction
Puberty is a critical stage, when animals first acquire fertility and involves complex interactions [1,2,3]. In animal production, breeding females with early menarche can reduce feeding costs and increase lifetime production, therefore shortening the generation interval and accelerating the breeding process [4,5,6]. The polytocous traits of sheep are also influenced by genetic, hormonal, environmental, and nutritional factors [7,8,9]. Interest in the research and identification of proteins associated with these traits is increasing because they have potential for use as protein biomarkers for polytocous traits, which would be extremely beneficial for sheep breeding.
Selection, both artificial and natural, has generated the many sheep breeds existing worldwide. During selection, the frequency of certain alleles within the population increases and the surrounding associated chromosomal regions show a decrease in polymorphism due to the hitchhiking effect, a phenomenon known as selective signatures [10]. Sequencing technology to study trait-associated genes has been widely utilized [11,12]. Wei et al. [13] used Fst and XP-EHH methods on 122 Chinese native sheep and found that EPASI genes play an important role in hypoxia adaptation. By selective signature analysis between polytocous and monotocous sheep populations, Wang et al. identified six genes (ESR1, OXTR, MAPK1, RYR1, PDIA4, and CYP19A1) associated with polytocous traits in sheep [14]. Yao et al. used selective signature analysis between high and low fertility populations in Bamei mutton sheep and found that JUN, ITPR3, PLCB2, HERC5 and KDM4B genes might be associated with polytocous traits [15]. Li et al. [16] identified the PDGFD gene as a possible important candidate gene affecting tail fat deposition in sheep by selective signatures analysis. Xin et al. [17] identified the P4-Ins-13bp mutation of the IGF2BP2 gene in goats as a potential molecular marker significantly associated with lambing traits by selective signatures analysis. Wang et al. conducted a selection elimination analysis on Jining gray goats with one, two, and three firstborn litters and found that KIT, KCNH7, KMT2E, PAK1, PRKAA1, and SMAD9 genes may regulate polytocous traits in this sheep [18].
The Cele Black Sheep and the Tian Sheep are two local breeds in Northwest China, characterized by high and low fertility, respectively [19]. Hetian sheep is a wool-producing breed that lives in the Hotan region of Xinjiang. It has characteristics of heat resistance, rough processing resistance and disease resistance [20]. In Xinjiang, Cele Black sheep produce more lambs per litter and have more estrus cycles in a year than other breeds. Although the environment in Xinjiang is very harsh, with hot summers, cold winters and windy and dry conditions all year round, ewes of this breed produce 2–4 lambs per litter [21]. Hetian sheep reach puberty at approximately 8–12 months of age and breed at 18–24 months of age, with an average litter size of 102.52% [22]. The puberty of Cele Black sheep generally occurs earlier than in other sheep breeds. Ewes become sexually mature at 4–5 months of age and breed after one year of age, with an average litter size rate of 215% [23].
Sheep are one of the most important domestic animals in Xinjiang. Improving the productivity of sheep plays an important role in improving the quality of life of local people and is one of the important goals of sheep breeding. However, the low fertility of most domesticated sheep is one of the factors limiting the development of sheep breeding in Xinjiang [19]. In this study, we performed selective signatures analysis based on the differences in pubertal initiation time and litter size between Hetian and Cele Black sheep to obtain single nucleotide polymorphism (SNP) loci associated with these two traits. This can provide theoretical support for the selection and breeding of sheep in Xinjiang.
2. Materials and Methods
2.1. Sample Cohort and DNA Extraction
A total of 342 blood samples from a natural population of healthy ewes between the ages of three and four years were collected and stored at −80 °C until use. The exploratory cohort for selection signatures analysis comprised 54 Cele Black sheep (No litter size record; Group CL) and 26 Hetian sheep (No litter size record; Group HT). To validate the relationship of SNP loci with litter size we used a validation cohort of 77 monotocous Cele Black sheep (litter size = 1; Group CL-1), 68 polytocous Cele Black sheep (litter size = 2; Group CL-2). These 145 Cele Black sheep (CL-1 and CL-2) and 117 Hetian sheep (Group HT-1) were used as a cohort for validating the relationship of SNP loci with puberty. Genomic DNA was extracted using the standard phenol/chloroform extraction method. DNA integrity was verified using a 1% agarose gel and the OD 260/280 ratio was obtained by NanoDrop™ spectrophotometer (Thermo Fisher Scientific, Waltham, MA, USA). The DNA concentration was measured using a Qubit (Thermo Fisher Scientific). This study was conducted in accordance with the specifications of the Ethics Committee of Tarim University of Science and Technology. All the sheep were collected from Xinjiang Kunlun Luyuan Sheep Farm in Cele County, Hotan City, Xinjiang Province.
2.2. Library Construction and Sequencing
Library construction was performed using the genotyping-by-sequencing (GBS) method. Genomic DNAs from CL and HT were digested with restriction endonucleases MseI and SacI (New England Biolabs, Ipswich, MA, USA) before being ligated with specific adaptors. An aliquot of the product was pooled and purified with AMPure XP Beads (Beckman Coulter, Brea, CA, USA). Polymerase chain reaction (PCR) enrichment was then performed using the high-fidelity polymerase KOD-Plus-Neo (Toyobo Co. Ltd., Osaka, Japan). All products were pooled and loaded onto an electrophoresis gel overnight with Certified Megabase Agarose (Bio-Rad, Hercules, CA, USA) at low pressure. Products in the range of 380–480 bp were purified using a gel extraction kit (QIAGEN, Hilden, Germany). Libraries were pooled according to the target downstream data volume and paired end 150 bp (PE150) sequencing was performed using the Illumina HiSeq platform (Illumina, San Diego, CA, USA). Each library contains 40 samples and we matched the clean reads individually to the barcodes and remnant restriction sites at both ends.
2.3. Quality Control, Comparison and Identification of SNP Loci
Quality control and data filtering were performed using fastp software [24] with the following filtering criteria: (1) Remove polyG and polyX at the end of the reads (minimum length of 10 bp). (2) Reads with N numbers greater than 5 were removed. (3) Remove reads with a base mass ratio below 15, higher than 40%. (4) Filtered reads with lengths below 15 were removed. The BWA package [25] version:0.7.17; parameter: mem) was then used to compare the filtered clean reads with the reference genome [26]. Variant loci were detected using GATK [27] (version 4.1.9.0; parameters: HaplotypeCaller, CombineGVFs, GenotypeGVFs). All variant loci were annotated using ANNOVAR [28] (version 20200607; default parameters). The SNP and insertion–deletion mutations (INDEL) loci were filtered separately using GATK. The following criteria were used for SNP filtering: QualByDepth (QD) < 2.0; Quality (QUAL) < 30.0; StrandOddsRatio (SOR) > 3.0; FisherStrand (FS) > 60.0; RMSMappingQuality (MQ) < 40.0; MappingQualityRankSumTest (MQRankSum) < −12.5; ReadPosRankSumTest (ReadPosRankSum) < −8.0. The following criteria were used for INDEL filtering: QD < 2.0; QUAL < 30.0; FS > 200.0; MQ < 40.0; ReadPosRankSum < −20.0. For the GATK-filtered loci, vcftools [29] were used to exclude loci with minor allele frequency (maf) less than 3% [30] and genotype deletion rate greater than 20%.
2.4. Genetic Diversity Analysis
The frequency, number of alleles, and nucleotide diversity (π) were calculated using vcftools software and the polymorphism information content (PIC) values of the SNP data were calculated using the following equation:
where n is the number of alleles and Pi and Pj denote the ith and jth allele frequency, respectively.
Genetic diversity (GD) and observed heterozygosity (Ho) were calculated using PLINK [31]. We used PopLDdecay [32] with default parameters to plot linkage disequilibrium (LD) decay, based on the allele frequency correlation (r2) to reveal the population relationship between HT and CL. The average number of nucleotide differences (K) was calculated as the sum of nucleotide variations of all individuals divided by the number of individuals.
2.5. Population Structure Analysis
Neighbor-joining trees were constructed using PHYLIP [33] and data were visualized using ggtree [34]. Principal component analysis (PCA) was performed using GCTA [35] to obtain the principal component values of each sample. The R package scatterplot3d [36] was then used to plot the principal component scatter plots in order to further investigate the population genetic structure. ADMIXTURE [37] was used to infer the population structure.
2.6. Selective Signatures Analysis and Protein Interaction Analysis
Selective signature analysis was performed using HT as the reference and CL as the target population in order to identify genes associated with pubertal initiation and litter size. The differentiation index (Fst) and nucleotide diversity (π) were calculated by vcftools, parameter: —fst-window-size 100,000—fst-window-step 50,000, for each interval between the two breeds (100 KB as a window and 50 KB as a step to divide the genome). Plots were drawn using the R package cmplot. Using the methods described by Li et al. [38], regions with both extremely low or high θπ ratios (5% left-tailed and 95% right-tailed) and significantly high Fst values (Fst in the top 5%) were selected as genomic candidate region. Gene functions for the genes in selected regions were annotated via alignment with the Gene Ontology (GO) and Kyoto Encyclopedia of Genes and Genomes (KEGG) databases. Then we reviewed the references and screened for genes associated with sheep puberty or litter size. Protein interaction analysis of the screened genes was performed by STRING [39].
2.7. SNP Loci Validation
For SNP validation, we used CL-1, CL-2, and HT-1 groups. CL-1 and CL-2 were used to validate the relationship of SNP loci with litter size. CL-1, CL-2, and HT-1 groups were used to validate the relationship of SNP loci with puberty. SNP typing was performed by the Beijing Compass Biotechnology Company, China. The SNP loci located in screened genes that were associated with sheep puberty or litter size were validated for genotype-litter size correlation in CL-1 and CL-2 using Fisher’s exact test method [40]. The genotype-pubertal initiation correlation was validated between HT-1 and Cele Black (CL-1 and CL-2) populations.
3. Results
3.1. Reduced-Representation Genome Sequencing and Data Filtering
We obtained 41.859 G of clean data, 0.076–1.174 G per sample, with an average of 0.523 G. An average of 4.36 million reads were retained per sample among the clean reads; q20 was higher than 98.03%, q30 was higher than 92.92% and the GC content was stable between 45.305 and 47.734%. Overall, our sequencing data yielded a high-quality score and a total of 384,718 high-quality SNPs were identified.
3.2. Population Genetic Diversity
Table 1 shows the PIC, Ho, GD, nucleic acid diversity (π), and the average number of nucleotide differences (K) were all higher in HT than in CL, indicating that Hetian sheep had higher genetic diversity. Linkage disequilibrium (LD) analysis showed a small difference in the decay rate of LD coefficients between the HT and CL (Figure 1A). CL showed a faster decay rate (Figure 1B).

Table 1.
Comparison of genetic parameters between Hetian and Cele Black sheep population groups.
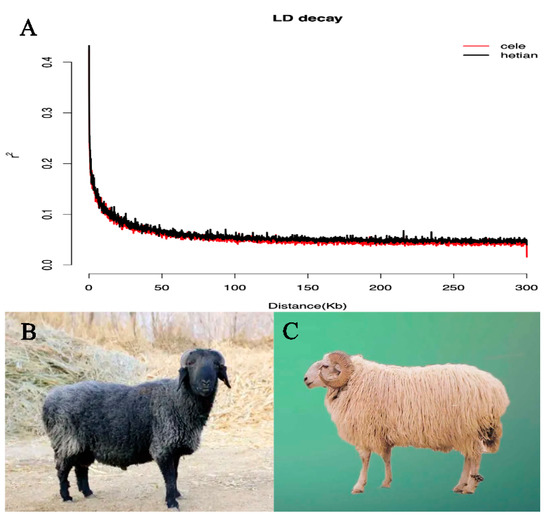
Figure 1.
(A): The decline curve of linkage disequilibrium (LD) between Hetian and Cele Black sheep. (B): Cele Black sheep. (C): Hetian sheep.
3.3. Population Structure Analysis
The population structure was assessed using CL and HT. Both the evolutionary tree and PCA results identified two distinct groups (Figure 2A,B). The structural analysis showed that the most likely value of K was 2 (Figure 2C,D). This is consistent with the PCA data and clustering of the two breeds and therefore indicates that CL and HT have two different ancestral genetic backgrounds.
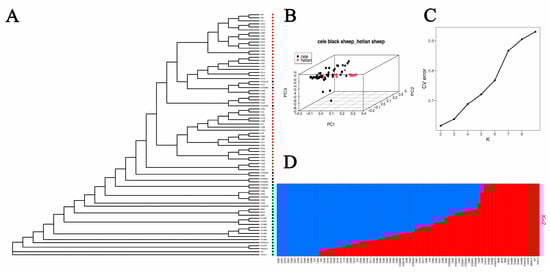
Figure 2.
(A): Phylogenetic tree: red circles represent Cele Black sheep, black circles represent Hetian sheep. (B): Principal component analysis. (C): Cross validation errors of ancestral clusters K. (D): Population structures with number of ancestral clusters K equaling two. Each color represents one ancestral cluster. The length of colored segments represents corresponding ancestry attributions.
3.4. Selective Signatures Analysis
Based on selective signatures analysis (Figure 3), we identified 376 genes under selection (Supplementary Materials Additional File 1). Based on GO annotation, KEGG enrichment analysis and related references of the 376 genes, 12 genes (PLCE1, SPIRE1, DIAPH2, GABRA3, GNAQ, GHR, DNMT3B, PLCB1, ABCC8, PTGFR, PAK1, ADCY1) were associated with pubertal initiation and 11 genes (ADCY1, POU1F1, BMPR2, HS6ST1, LHCGR, DNMT3B, GHR, LIF, PAK1, TGFB2, GNAQ) were associated with litter size. From these genes, we selected 25 SNP loci with high Fst values for further validation. Protein interaction analysis revealed interactions between PTGFR, LHCGR, GNAQ, GHR, PLCE1, LIF, PLCB1, ADCY1, BMPR2, and TGFB2 (Figure 4). The selected genes included several SNPs potentially linked with pubertal initiation: six SNP loci in GNAQ, three in GHR, one in DNMT3B, two in PAK1, and six in ADCY1. Furthermore, several SNPs linked with litter size were found: six SNP sites were located in ADCY1, one in POU1F1, four in BMPR2, one in LHCGR, one in DNMT3B, three in GHR, one in LIF, two in PAK1, and six in GNAQ.
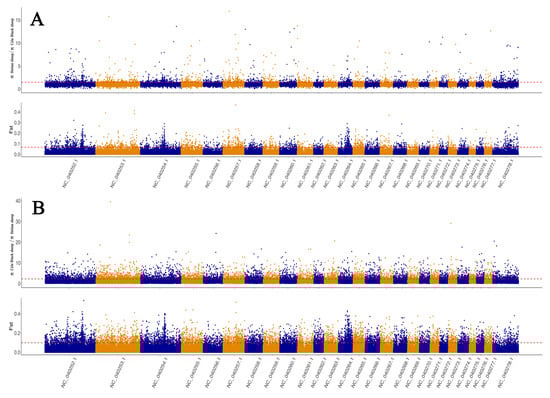
Figure 3.
(A): The area above the dotted line includes Hetian sheep/Cele Black sheep are subject to selection. (B): The area above the dotted line includes Cele Black sheep/Hetian sheep subject to selection.
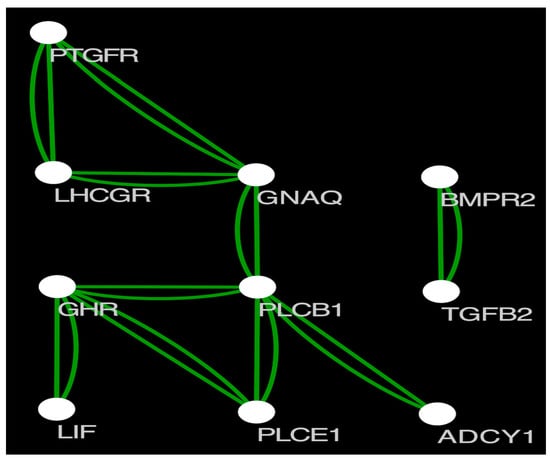
Figure 4.
Protein interaction map of the screened genes.
3.5. SNP Loci Validation
We found that two SNP loci in PAK1 (NC_040272.1: g. 20302507T > A and NC_040272.1: g. 20312315G > T) and four SNP loci in ADCY1 (NC_040252.1: g. 127782749T > G, NC_040252.1: g. 127782799G > A, NC_040252.1: g. 127782815G > T and NC_040252.1: g. 127782942T > C) showed significant differences (p < 0.05) between HT-1 and the CL-1 and CL-2 groups. These SNPs were thought to be associated with primiparous initiation. Another SNP locus in GNAQ showed highly significant differences (p < 0.01) between CL-1 and CL-2, suggesting that this SNP locus was associated with litter size in Cele Black sheep. The heterozygous genotype GA at the NC_040253.1: g.62677376G > A locus on the GNAQ gene was more favorable for producing polytocous sheep (Supplementary Materials Additional File 2).
4. Discussion
In this study, we characterized population genetic diversity and genomic selection in 54 CLs of high fertility and 26 HTs of low fertility. We assessed the population structure of these two sheep populations using NJ tree, ADMIXTURE and PCA. In addition, we performed Selection signatures analysis using FST and π methods to screen for SNP loci associated with puberty or little size. Finally, we validated the little size associated SNP loci using Celle black sheep (CL-1 and CL-2) with little size records and performed preliminary validation of SNP loci associated with puberty using Hetian sheep (HT-1) and Cele Black sheep (CL-1 and CL-2).
The assessment of genetic variation within breeds/populations can be an important basis in the improvement and development of sheep breeding [41,42]. Species with high genetic diversity have a greater ability to adapt to their environment [43]. In our study, genetic diversity of Hetian sheep was higher than that of Cele Black sheep. This indicates that Hetian sheep have higher adaptability to the environment. The decay of LD was influenced by the recombination rate and the number of recombination generations. CL showed a faster decay rate (Figure 1B) indicating an earlier initiation of puberty and higher litter size than HT (Figure 1C). This is consistent with previous published results [22,23].
To determine whether Hetian and Cele Black sheep populations are suitable to the selection signatures analysis, we conducted a population structure analysis. The resulting data showed that Hetian sheep and Cele Black sheep have different ancestral genetic backgrounds.
Selective signatures can reveal genomic regions subject to selection that are associated with phenotypic traits acquired during biological evolution [44,45]. In this study, we used reduced-representation genome sequencing technology to analyze Hetian and Cele Black sheep and applied selective signatures analysis to identify SNPs associated with pubertal initiation and litter size in sheep.
Selection signatures analysis identified two SNP loci in PAK1 and four SNP loci in ADCY1 potentially associated with pubertal initiation in sheep, and one SNP locus in GNAQ that was significantly associated with litter size in sheep. P21-activated kinase-1 (PAK1) is an important mediator of estrogen’s cell survival functions [46]. In addition, PRL and estrogen interact with each other through PAK1 [47]. Pak1 is able to phosphorylate the Ser305 site of estrogen receptor alpha (ER α), a modification that is important in the transactivation function of ER α [48]. Therefore, PAK1 may indirectly control the initiation of puberty in sheep by regulating estrogen. Expression of adenylyl cyclase (ADCY1) was reported to induce enrichment of cyclic adenosine monophosphate at the zona pellucida and nucleus of the oocytes and is a main second messenger in oocytes, where is involved in the regulation of the meiotic process [49]. Therefore, the ADCY1 gene may promote the initiation of proestrus in sheep by controlling meiosis. Previous studies have shown that the GNAQ gene is significantly associated with little size in Kazakh, Chinese Merino and Hu sheep [50]. Our study adds to this point that the GNAQ gene was also significantly associated with little size in Cele Black sheep. The heterozygous genotype GA at the NC_040253.1: g.62677376G > A locus on the GNAQ gene was more favorable for producing polytocous sheep. However, the age at pubertal initiation for each sheep was not collected and therefore further validation of the identified loci associated with pubertal initiation is needed.
5. Conclusions
We identified two SNP loci on the PAK1 gene and four SNP loci on the ADCY1 gene that may be associated with pubertal initiation in sheep based on reduced-representation genome sequencing using selection elimination analysis. One SNP (NC_040253.1: g.62677376G > A) locus on the GNAQ gene was found to be associated with lambing number in sheep. Hetian sheep had higher genetic diversity than Cele Black sheep. Our results provide new theoretical support for sheep breeding.
Supplementary Materials
The following supporting information can be downloaded at: https://www.mdpi.com/article/10.3390/ani12192520/s1, Additional File 1: Genes; Additional File 2: Puberty and litter size.
Author Contributions
Z.Z. conceived the study, conducted data analysis, and prepared the figures and tables. Z.Z., Z.S., Q.L. and J.Z. performed the sample collection. Z.Z., Y.Z., C.W. and X.L. performed genetic diversity analysis. F.X. oversaw the study. Z.Z. prepared the manuscript. All authors have read and agreed to the published version of the manuscript.
Funding
The study was made possible thanks to funding from the National Natural Science Foundation of China (Grant/Award Numbers: 31660652, 31960655) and the Xinjiang Production and Construction Corps (Grant/Award Numbers: 2022CB001-04).
Institutional Review Board Statement
This study was conducted in accordance with the specifications of the Ethics Committee of Tarim University of Science and Technology.
Informed Consent Statement
Not applicable.
Data Availability Statement
Raw read data were submitted to the NCBI Sequence Read Archive under the accession number PRJNA833897.
Acknowledgments
The study was made possible thanks to funding from the National Natural Science Foundation of China (Grant/Award Numbers: 31660652, 31960655) and the Xinjiang Production and Construction Corps (Grant/Award Numbers: 2022CB001-04).
Conflicts of Interest
The authors declare that the research was conducted in the absence of any commercial or financial relationships that could be construed as potential conflicts of interest.
References
- Greives, T.J.; Mason, A.O.; Scotti, M.A.L.; Levine, J.; Ketterson, E.D.; Kriegsfeld, L.J.; Demas, G.E. Environmental control of kisspeptin: Implications for seasonal reproduction. Endocrinology 2007, 148, 1158–1166. [Google Scholar] [CrossRef] [PubMed]
- Xing, F.; Zhang, C.Y.; Kong, Z.Q. Cloning and expression of lin-28 homolog B gene in the onset of puberty in Duolang sheep. Asian Australas. J. Anim. Sci. 2019, 32, 23–30. [Google Scholar] [CrossRef] [PubMed]
- Spaziani, M.; Tarantino, C.; Tahani, N.; Gianfrilli, D.; Sbardella, E.; Lenzi, A.; Radicioni, A.F. Hypothalamo-Pituitary axis and puberty. Mol. Cell. Endocrinol. 2021, 520, 111094. [Google Scholar] [CrossRef] [PubMed]
- Nieto, C.A.R.; Thompson, A.N.; Martin, G.B. A new perspective on managing the onset of puberty and early reproductive performance in ewe lambs: A review. Anim. Prod. Sci. 2018, 58, 1967–1975. [Google Scholar] [CrossRef]
- Bedenbaugh, M.N.; Bowdridge, E.C.; Hileman, S.M. Role of neurokinin B in ovine puberty. Domest. Anim. Endocrinol. 2020, 73, 106442. [Google Scholar] [CrossRef]
- Li, Q.Q.; Yuan, X.L.; Chen, Z.T.; Zhang, A.L.; Zhang, Z.; Zhang, H.; Li, J.Q. Heritability estimates and effect on lifetime reproductive performance of age at puberty in sows. Anim. Reprod. Sci. 2018, 195, 207–215. [Google Scholar] [CrossRef]
- Guo, X.F.; Wang, X.Y.; Liang, B.M.; Di, R.; Liu, Q.Y.; Hu, W.P.; He, X.Y.; Zhang, J.L.; Zhang, X.S.; Chu, M.X. Molecular Cloning of the B4GALNT2 Gene and Its Single Nucleotide Polymorphisms Association with Litter Size in Small Tail Han Sheep. Animals 2018, 8, 160. [Google Scholar] [CrossRef]
- Qi, Y.X.; He, X.L.; Liu, X.F.; Wu, J.H.; Rong, W.H.; Liu, Y.B. The analysis of the concentration change patterns of serum follicle-stimulating hormone and luteinizing hormone and their relationships with litter size during the estrous period of Bamei mutton sheep. Heilongjiang Anim. Sci. Vet. Med. 2014, 7, 17–20. (In Chinese) [Google Scholar] [CrossRef]
- Li, C.Z.; Zhang, L.; Pu, B.C.R.; Hu, Y.D.; Zha, X.; De, Q.Z.G.; Ma, J.Y.; Dan, B. Research progress on influencing factors of polysomy traits in sheep. Yunnan J. Anim. Sci. Vet. Med. 2020, 1, 36–43. (In Chinese) [Google Scholar]
- Stephan, W. Selective Sweeps. Genetics 2019, 211, 5–13. [Google Scholar] [CrossRef]
- Xiong, Y.; Lei, F.M. SLC2A12 of SLC2 Gene Family in Bird Provides Functional Compensation for the Loss of SLC2A4 Gene in Other Vertebrates. Mol. Biol. Evol. 2021, 38, 1276–1291. [Google Scholar] [CrossRef] [PubMed]
- Xiong, Y.; Hao, Y.; Cheng, Y.L.; Fan, L.Q.; Song, G.; Li, D.M.; Qu, Y.H.; Lei, F.M. Comparative transcriptomic and metabolomic analysis reveals pectoralis highland adaptation across altitudinal songbirds. Integr. Zool. 2022, 1–17. [Google Scholar] [CrossRef] [PubMed]
- Wei, C.H.; Wang, H.H.; Liu, G.; Zhao, F.P.; Kijas, J.W.; Ma, Y.J.; Lu, J.; Zhang, L.; Cao, J.X.; Wu, M.M.; et al. Genome-wide analysis reveals adaptation to high altitudes in Tibetan sheep. Sci. Rep. 2016, 6, 26770. [Google Scholar] [CrossRef]
- Wang, Y.; Niu, Z.G.; Zeng, Z.C.; Jiang, Y.; Jiang, Y.F.; Ding, Y.G.; Tang, S.; Shi, H.C.; Ding, X.D. Using High-Density SNP Array to Reveal Selection Signatures Related to Prolificacy in Chinese and Kazakhstan Sheep Breeds. Animals 2020, 10, 1633. [Google Scholar] [CrossRef] [PubMed]
- Yao, Y.X.; Pan, Z.Y.; Di, R.; Liu, Q.Y.; Hu, W.P.; Guo, X.F.; He, X.Y.; Gan, S.Q.; Wang, X.Y.; Chu, M.X. Whole Genome Sequencing Reveals the Effects of Recent Artificial Selection on Litter Size of Bamei Mutton Sheep. Animals 2021, 11, 157. [Google Scholar] [CrossRef] [PubMed]
- Li, X.; Yang, J.; Shen, M.; Xie, X.L.; Liu, G.J.; Xu, Y.X.; Lv, F.H.; Yang, H.; Yang, Y.L.; Liu, C.B.; et al. Whole-genome resequencing of wild and domestic sheep identifies genes associated with morphological and agronomic traits. Nat. Commun. 2020, 11, 2815. [Google Scholar] [CrossRef]
- Xin, D.Y.; Bai, Y.Y.; Bi, Y.; He, L.B.; Kang, Y.X.; Pan, C.Y.; Zhu, H.J.; Chen, H.; Qu, L.; Lan, X.Y. Insertion/deletion variants within the IGF2BP2 gene identified in reported genome-wide selective sweep analysis reveal a correlation with goat litter size. J. Zhejiang Univ.-Sci. B 2021, 22, 757–766. [Google Scholar] [CrossRef]
- Wang, J.J.; Zhang, T.; Chen, Q.M.; Zhang, R.Q.; Li, L.; Cheng, S.F.; Shen, W.; Lei, C.Z. Genomic Signatures of Selection Associated With Litter Size Trait in Jining Gray Goat. Front. Genet. 2020, 11, 286. [Google Scholar] [CrossRef]
- Chen, H.Y.; Shen, H.; Jia, B.; Zhang, Y.S.; Wang, X.H.; Zeng, X.C. Differential Gene Expression in Ovaries of Qira Black Sheep and Hetian Sheep Using RNA-Seq Technique. PLoS ONE 2015, 10, e0120170. [Google Scholar] [CrossRef]
- Shi, R.; Li, S.; Liu, P.; Zhang, S.; Wu, Z.; Wu, T.; Gong, S.; Wan, Y. Identification of key genes and signaling pathways related to Hetian sheep wool density by RNA-seq technology. PLoS ONE 2022, 17, e0265989. [Google Scholar] [CrossRef]
- Niu, Z.G.; Qin, J.; Jiang, Y.; Ding, X.D.; Ding, Y.G.; Tang, S.; Shi, H.C. The Identification of Mutation in BMP15 Gene Associated with Litter Size in Xinjiang Cele Black Sheep. Animals 2021, 11, 668. [Google Scholar] [CrossRef] [PubMed]
- Hasimu, A.; Maitusong, A. Survey and analysis of the development trend of Hotan sheep in Yutian County. XINJIANG XUMUYE 2013, S2, 20–21. (In Chinese) [Google Scholar] [CrossRef]
- Qi, C.N.; Xie, A.X.; Hu, W.B.; Mi, R.N.S.H.; Ai, H.M.J.; Mai, R.M.N.S.H. Qira Black Sheep’s Variety Characteristic and Protection Use. J. Tarim Univ. 2006, 2, 32–33. (In Chinese) [Google Scholar]
- Chen, S.F.; Zhou, Y.Q.; Chen, Y.R.; Gu, J. fastp: An ultra-fast all-in-one FASTQ preprocessor. Bioinformatics 2018, 34, 884–890. [Google Scholar] [CrossRef]
- Li, H.; Durbin, R. Fast and accurate short read alignment with Burrows-Wheeler transform. Bioinformatics 2009, 25, 1754–1760. [Google Scholar] [CrossRef]
- Salavati, M.; Caulton, A.; Clark, R.; Gazova, I.; Smith, T.P.L.; Worley, K.C.; Cockett, N.E.; Archibald, A.L.; Clarke, S.M.; Murdoch, B.M.; et al. Global Analysis of Transcription Start Sites in the New Ovine Reference Genome (Oar rambouillet v1.0). Front. Genet. 2020, 11, 580580. [Google Scholar] [CrossRef]
- Van der Auwera, G.A.; O’Connor, B.D. Genomics in the Cloud: Using Docker, GATK, and WDL in Terra; O’Reilly Media: Sebastopol, CA, USA, 2020. [Google Scholar]
- Wang, K.; Li, M.Y.; Hakonarson, H. ANNOVAR: Functional annotation of genetic variants from high-throughput sequencing data. Nucleic Acids Res. 2010, 38, e164. [Google Scholar] [CrossRef]
- Danecek, P.; Auton, A.; Abecasis, G.; Albers, C.A.; Banks, E.; DePristo, M.A.; Handsaker, R.E.; Lunter, G.; Marth, G.T.; Sherry, S.T.; et al. The variant call format and VCFtools. Bioinformatics 2011, 27, 2156–2158. [Google Scholar] [CrossRef]
- Martin, C.A.; Armstrong, C.; Illera, J.C.; Emerson, B.C.; Richardson, D.S.; Spurgin, L.G. Genomic variation, population history and within-archipelago adaptation between island bird populations. R. Soc. Open Sci. 2021, 8, 16. [Google Scholar] [CrossRef]
- Purcell, S.; Neale, B.; Todd-Brown, K.; Thomas, L.; Ferreira, M.A.R.; Bender, D.; Maller, J.; Sklar, P.; de Bakker, P.I.W.; Daly, M.J.; et al. PLINK: A tool set for whole-genome association and population-based linkage analyses. Am. J. Hum. Genet. 2007, 81, 559–575. [Google Scholar] [CrossRef]
- Zhang, C.; Dong, S.S.; Xu, J.Y.; He, W.M.; Yang, T.L. PopLDdecay: A fast and effective tool for linkage disequilibrium decay analysis based on variant call format files. Bioinformatics 2019, 35, 1786–1788. [Google Scholar] [CrossRef] [PubMed]
- Revell, L.J.; Chamberlain, S.A. Rphylip: An R interface for PHYLIP. Methods Ecol. Evol. 2014, 5, 976–981. [Google Scholar] [CrossRef]
- Yu, G.C.; Smith, D.K.; Zhu, H.C.; Guan, Y.; Lam, T.T.Y. GGTREE: An R package for visualization and annotation of phylogenetic trees with their covariates and other associated data. Methods Ecol. Evol. 2017, 8, 28–36. [Google Scholar] [CrossRef]
- Yang, J.A.; Lee, S.H.; Goddard, M.E.; Visscher, P.M. GCTA: A Tool for Genome-wide Complex Trait Analysis. Am. J. Hum. Genet. 2011, 88, 76–82. [Google Scholar] [CrossRef]
- Ligges, U.; Mächler, M. Scatterplot3d-An R Package for Visualizing Multivariate Data; Technical Report; Universität Dortmund: Dortmund, Germany, 2002. [Google Scholar]
- Alexander, D.H.; Novembre, J.; Lange, K. Fast model-based estimation of ancestry in unrelated individuals. Genome Res. 2009, 19, 1655–1664. [Google Scholar] [CrossRef] [PubMed]
- Li, M.Z.; Tian, S.L.; Jin, L.; Zhou, G.Y.; Li, Y.; Zhang, Y.; Wang, T.; Yeung, C.K.L.; Chen, L.; Ma, J.D.; et al. Genomic analyses identify distinct patterns of selection in domesticated pigs and Tibetan wild boars. Nat. Genet. 2013, 45, 1431–1438. [Google Scholar] [CrossRef] [PubMed]
- Jensen, L.J.; Kuhn, M.; Stark, M.; Chaffron, S.; Creevey, C.; Muller, J.; Doerks, T.; Julien, P.; Roth, A.; Simonovic, M.; et al. STRING 8-a global view on proteins and their functional interactions in 630 organisms. Nucleic Acids Res. 2009, 37, D412–D416. [Google Scholar] [CrossRef]
- Xiong, Y.; Fan, L.Q.; Hao, Y.; Cheng, Y.L.; Chang, Y.B.; Wang, J.; Lin, H.Y.; Song, G.; Qu, Y.H.; Lei, F.M. Physiological and genetic convergence supports hypoxia resistance in high-altitude songbirds. PLoS Genet. 2020, 16, e1009270. [Google Scholar] [CrossRef]
- Wei, C.H.; Wang, H.H.; Liu, G.; Wu, M.M.; Cao, J.X.V.; Liu, Z.; Liu, R.Z.; Zhao, F.P.; Zhang, L.; Lu, J.; et al. Genome-wide analysis reveals population structure and selection in Chinese indigenous sheep breeds. Bmc Genomics 2015, 16, 194. [Google Scholar] [CrossRef]
- Getachew, T.; Haile, A.; Meszaros, G.; Rischkowsky, B.; Huson, H.J.; Gizaw, S.; Wurzinger, M.; Mwai, A.O.; Solkner, J. Genetic diversity, population structure and runs of homozygosity in Ethiopian short fat-tailed and Awassi sheep breeds using genome-wide 50k SNP markers. Livest. Sci. 2020, 232, 103899. [Google Scholar] [CrossRef]
- Hoban, S.; Bruford, M.W.; Funk, W.C.; Galbusera, P.; Griffith, M.P.; Grueber, C.E.; Heuertz, M.; Hunter, M.E.; Hvilsom, C.; Stroil, B.K.; et al. Global Commitments to Conserving and Monitoring Genetic Diversity Are Now Necessary and Feasible. Bioscience 2021, 71, 964–976. [Google Scholar] [CrossRef] [PubMed]
- Hohenlohe, P.A.; Phillips, P.C.; Cresko, W.A. Using Population Genomics to Detect Selection in Natural Populations: Key Concepts and Methodological Considerations. Int. J. Plant Sci. 2010, 171, 1059–1071. [Google Scholar] [CrossRef] [PubMed]
- Oleksyk, T.K.; Smith, M.W.; O’Brien, S.J. Genome-wide scans for footprints of natural selection. Philos. Trans. R. Soc. B-Biol. Sci. 2010, 365, 185–205. [Google Scholar] [CrossRef] [PubMed]
- Mazumdar, A.; Kumar, R. Estrogen regulation of Pak1 and FKHR pathways in breast cancer cells. FEBS Lett. 2003, 535, 6–10. [Google Scholar] [CrossRef]
- Oladimeji, P.; Skerl, R.; Rusch, C.; Diakonova, M. Synergistic Activation of ER alpha by Estrogen and Prolactin in Breast Cancer Cells Requires Tyrosyl Phosphorylation of PAK1. Cancer Res. 2016, 76, 2600–2611. [Google Scholar] [CrossRef]
- Talukder, A.H.; Li, D.Q.; Manavathi, B.; Kumar, R. Serine 28 phosphorylation of NRIF3 confers its co-activator function for estrogen receptor-alpha transactivation. Oncogene 2008, 27, 5233–5242. [Google Scholar] [CrossRef][Green Version]
- Sun, M.H.; Zheng, J.; Xie, F.Y.; Shen, W.; Yin, S.; Ma, J.Y. Cumulus Cells Block Oocyte Meiotic Resumption via Gap Junctions in Cumulus Oocyte Complexes Subjected to DNA Double-Strand Breaks. PLoS ONE 2015, 10, e0143223. [Google Scholar] [CrossRef]
- Zhu, M.T.; Zhang, H.M.; Yang, H.; Zhao, Z.S.; Blair, H.T.; Zhai, M.J.; Yu, Q.; Wu, P.; Fang, C.H.; Xie, M.T. Polymorphisms and association of GRM1, GNAQ and HCRTR1 genes with seasonal reproduction and litter size in three sheep breeds. Reprod. Domest. Anim. 2022, 57, 532–540. [Google Scholar] [CrossRef]
Publisher’s Note: MDPI stays neutral with regard to jurisdictional claims in published maps and institutional affiliations. |
© 2022 by the authors. Licensee MDPI, Basel, Switzerland. This article is an open access article distributed under the terms and conditions of the Creative Commons Attribution (CC BY) license (https://creativecommons.org/licenses/by/4.0/).