
Extremely Low-Frequency Electromagnetic Field Impairs the Development of Honeybee (Apis cerana)


 and
and 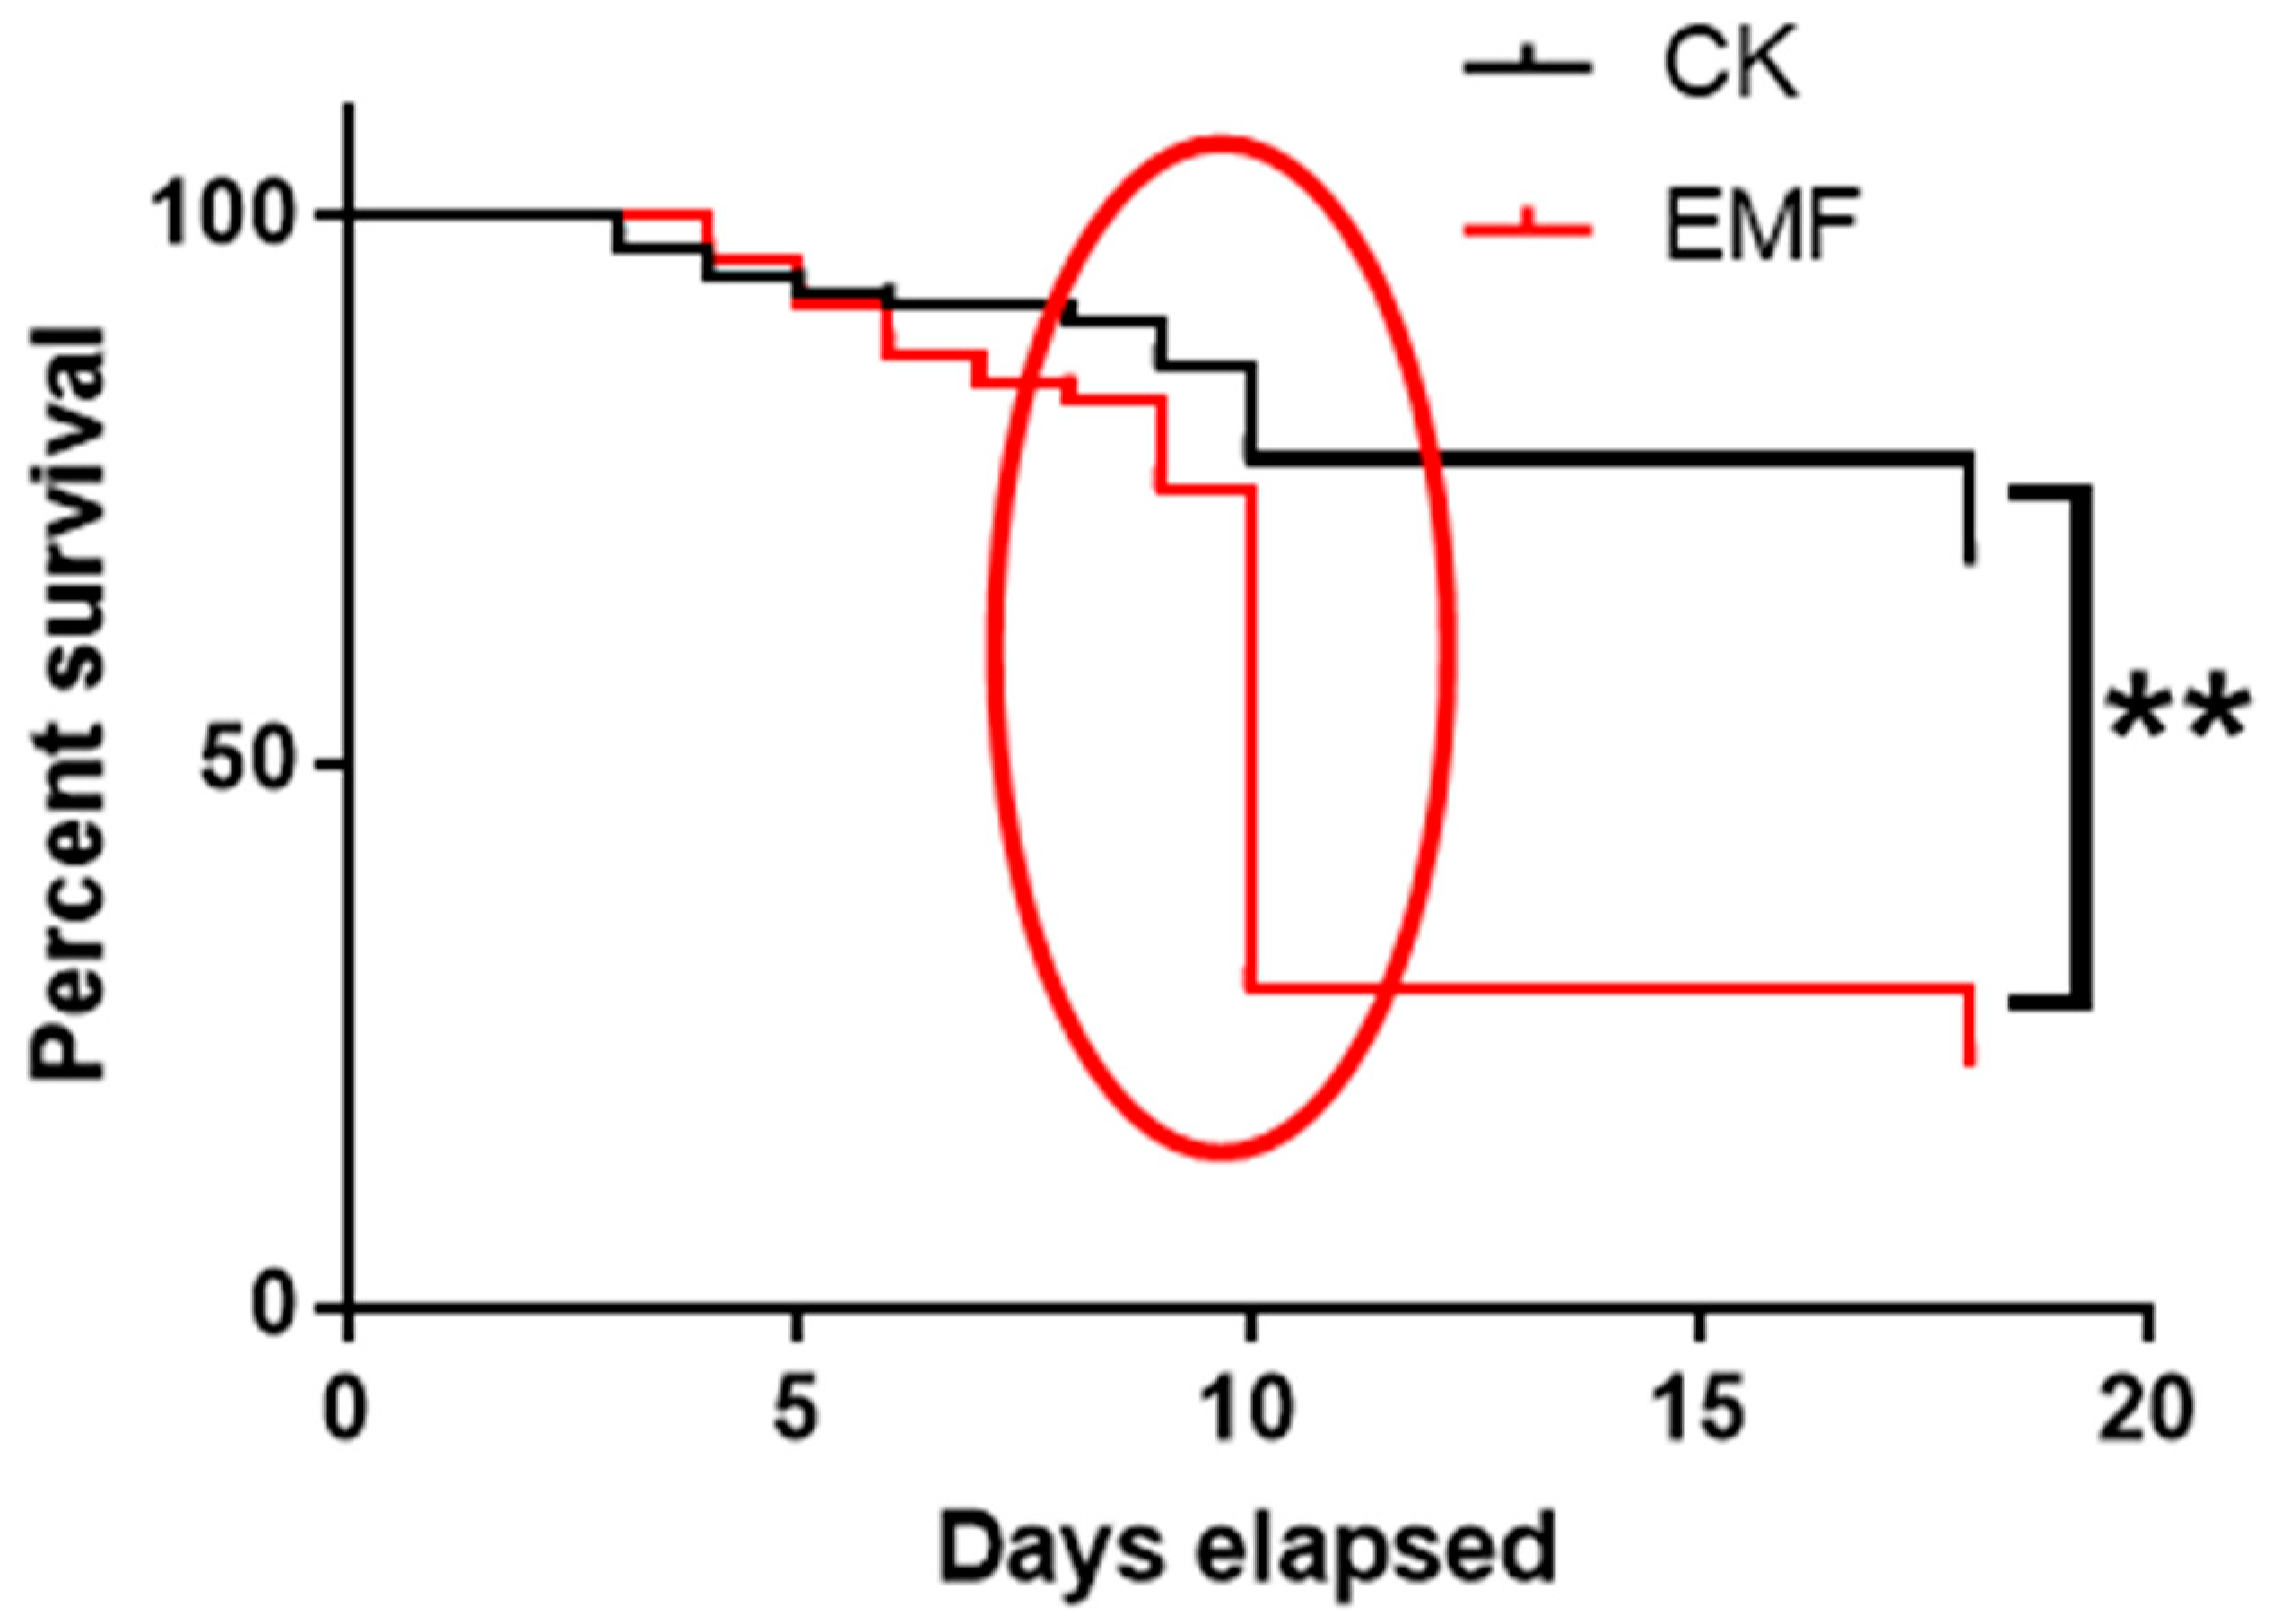
Abstract
Simple Summary
Abstract
1. Introduction
2. Materials and Methods
2.1. Honeybee Larvae Collection and Lab Rearing
2.2. ELF-EMF Exposure
2.3. RNA Extraction, Library Construction, Sequencing, Reads Mapping and Assembling
2.4. Quantification and Differential Gene Expression Analysis
2.5. GO and KEGG Enrichment Analysis of Differentially Expressed Genes
2.6. Validation of the Gene Expression Level by qRT-PCR
2.7. Statistical Analysis
3. Results
3.1. ELF-EMF Exposure Decreased the Larvae Survival Rate
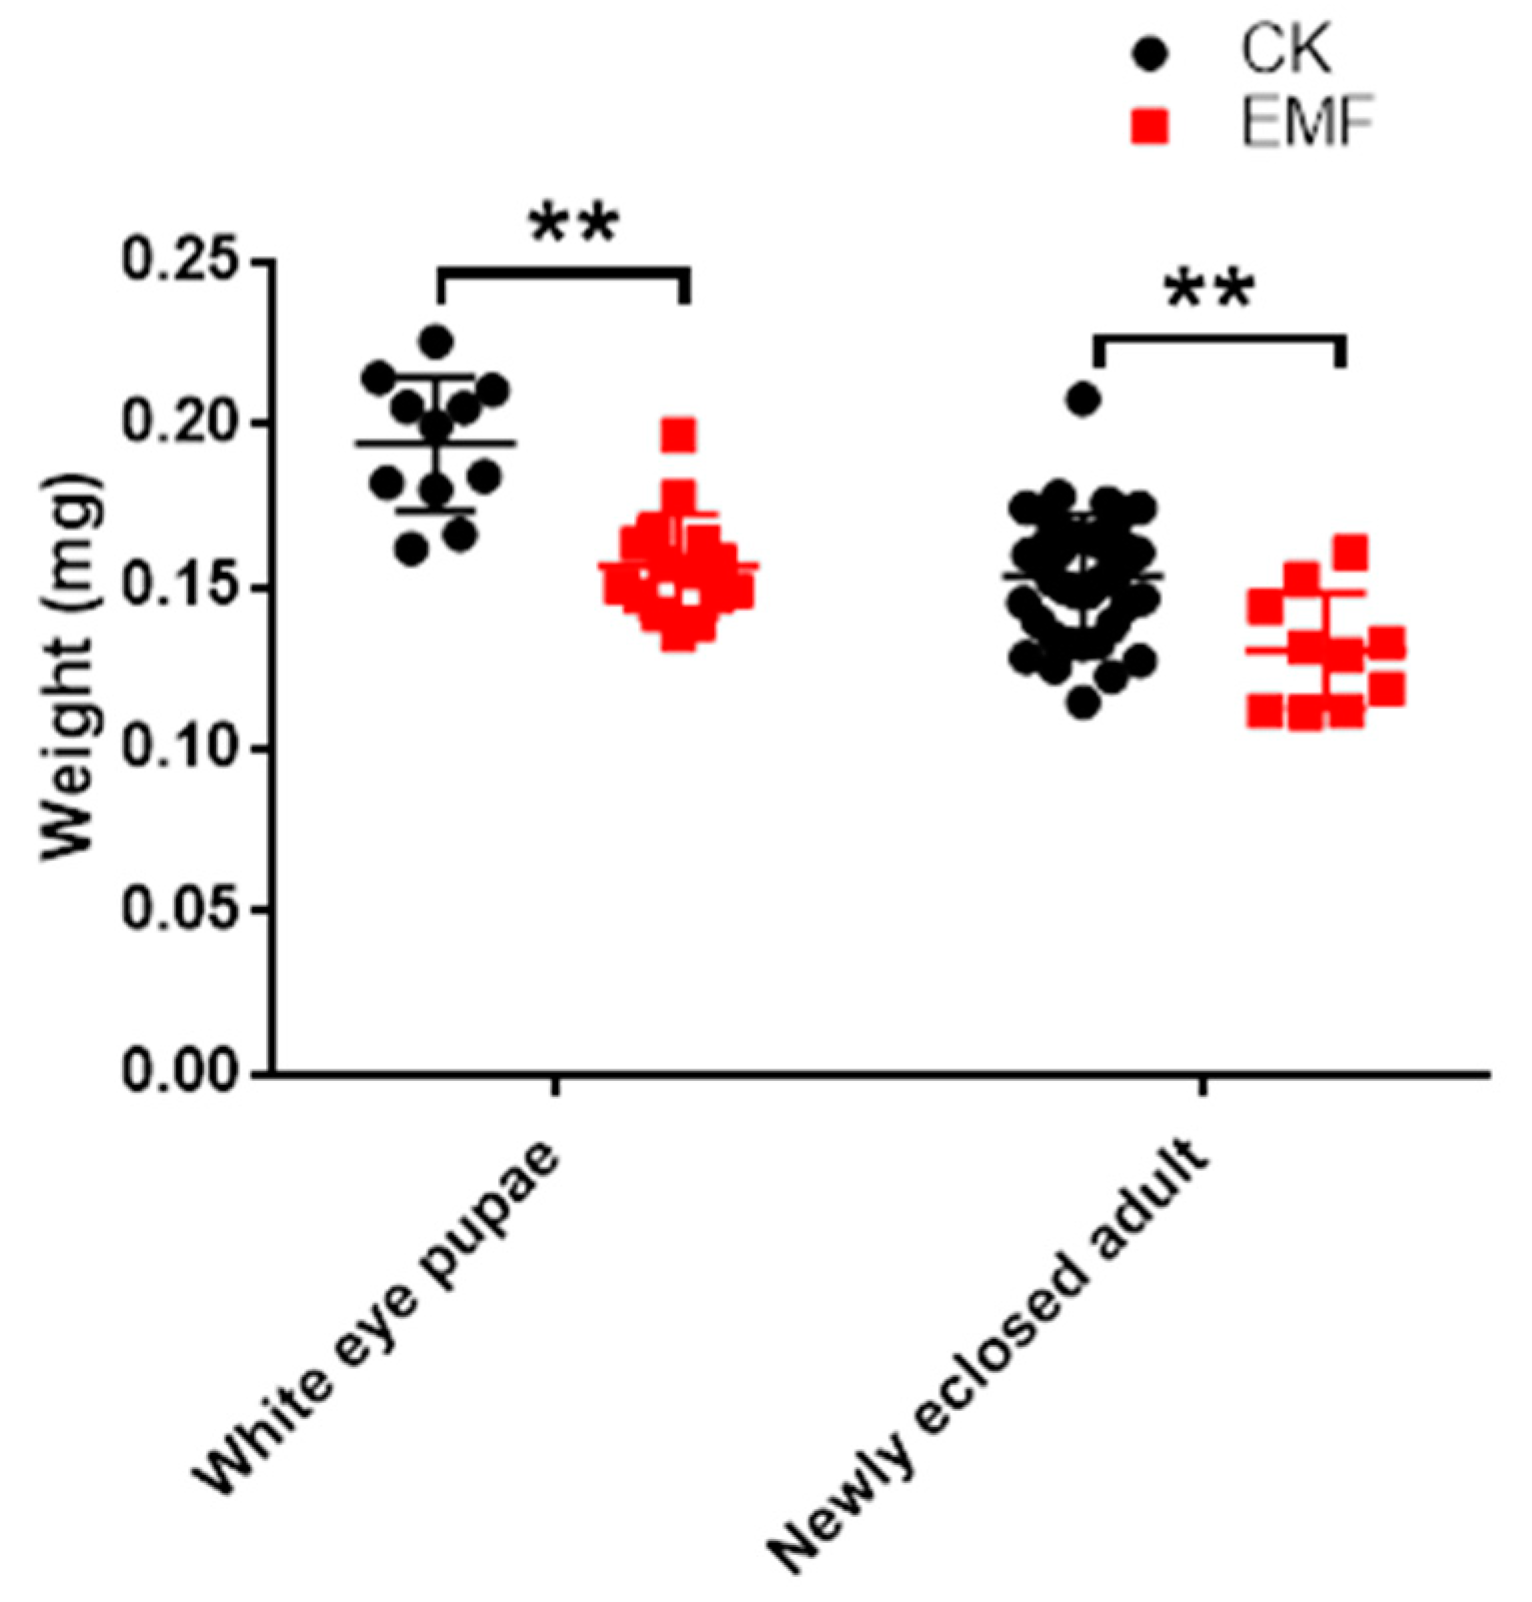
3.2. ELF-EMF Exposure Decreased the Honeybee Weight
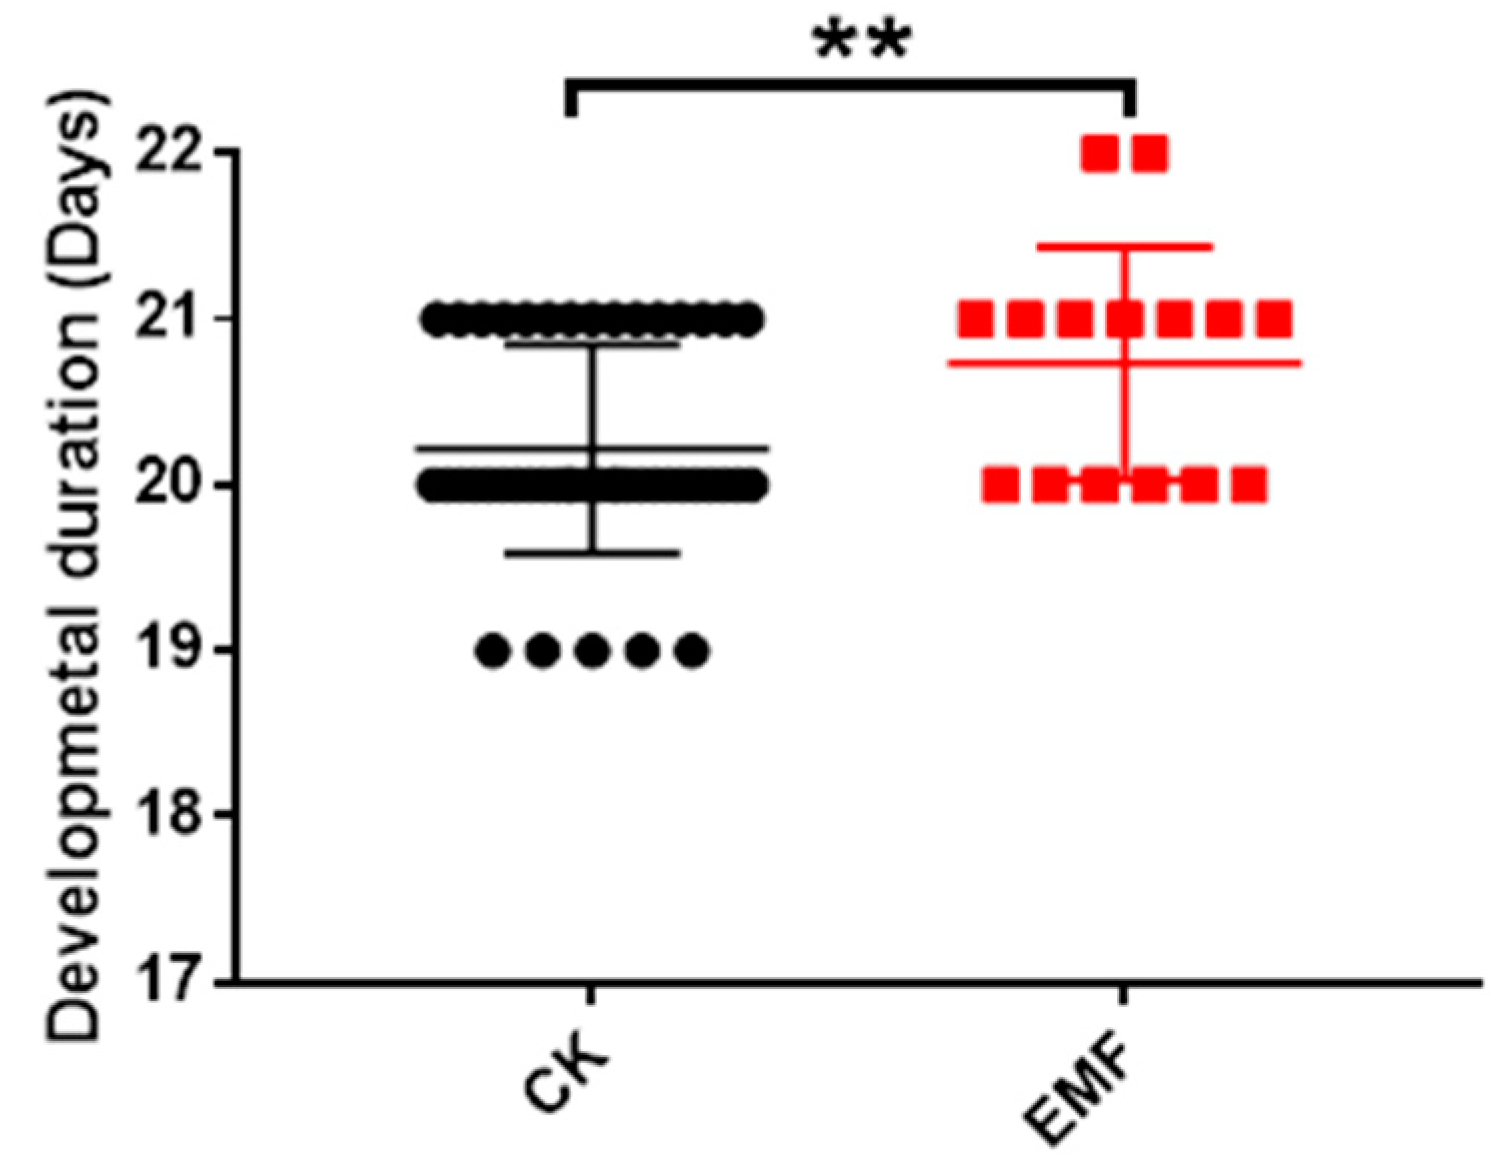
3.3. ELF-EMF Exposure Extended the Honeybee Development Time
3.4. Transcriptome Sequencing
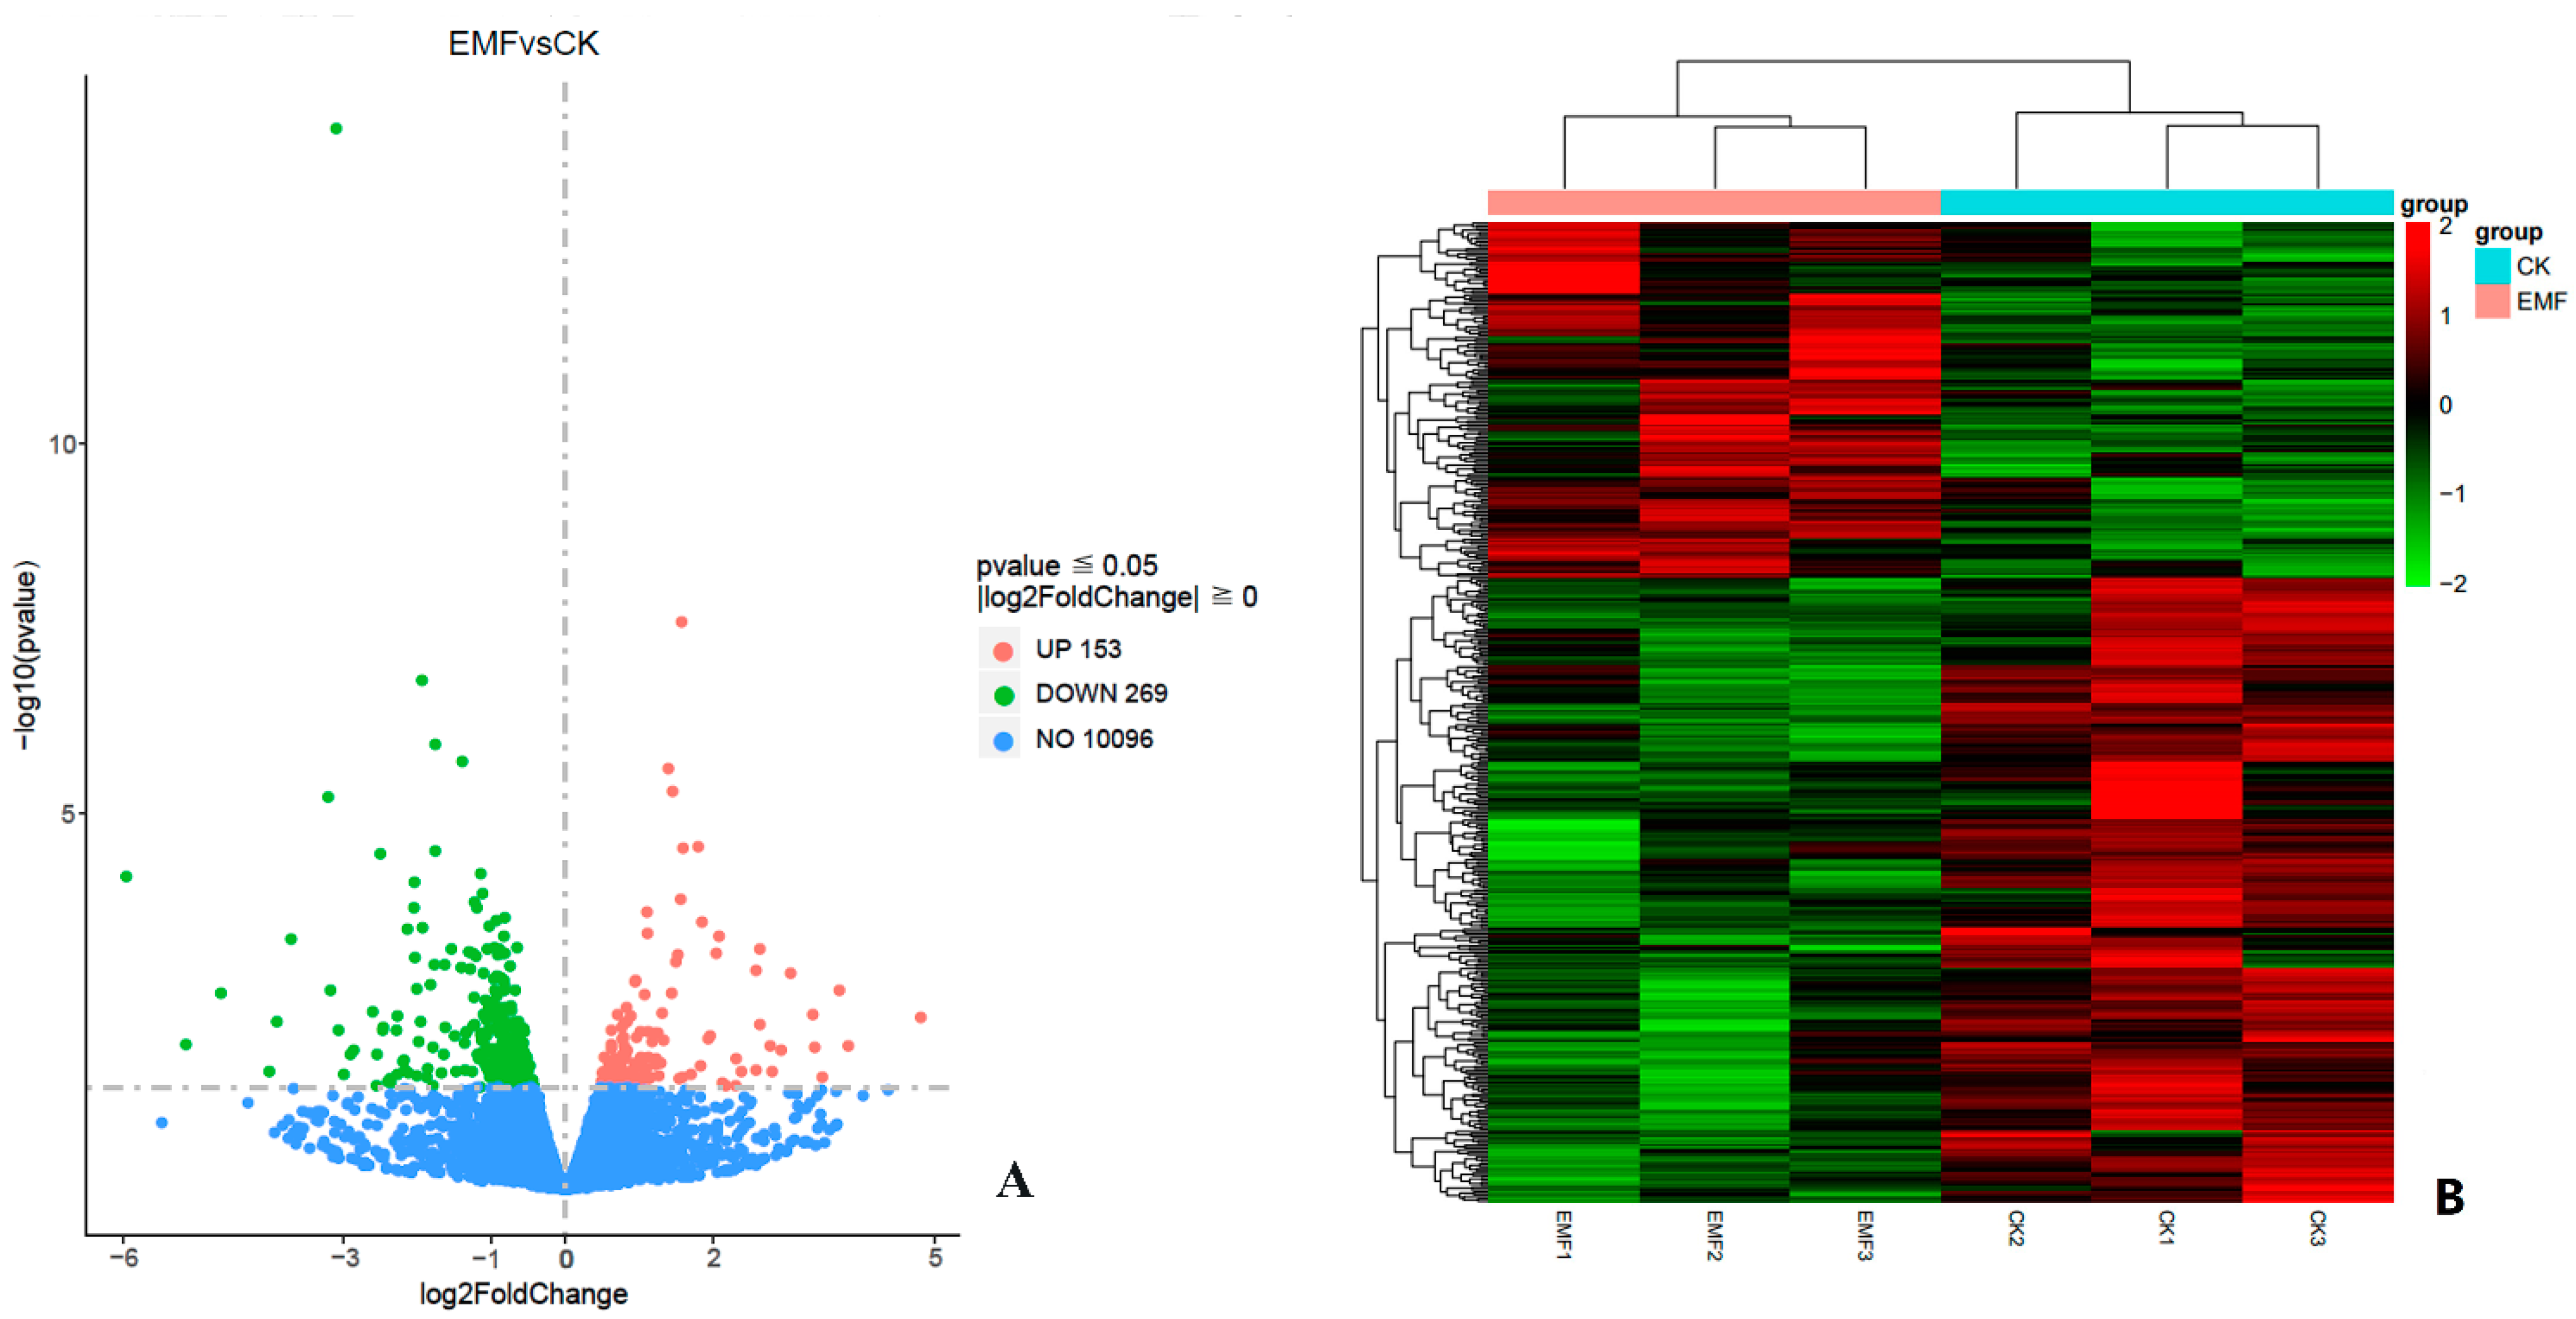
3.5. Differentially Expressed Genes Analysis
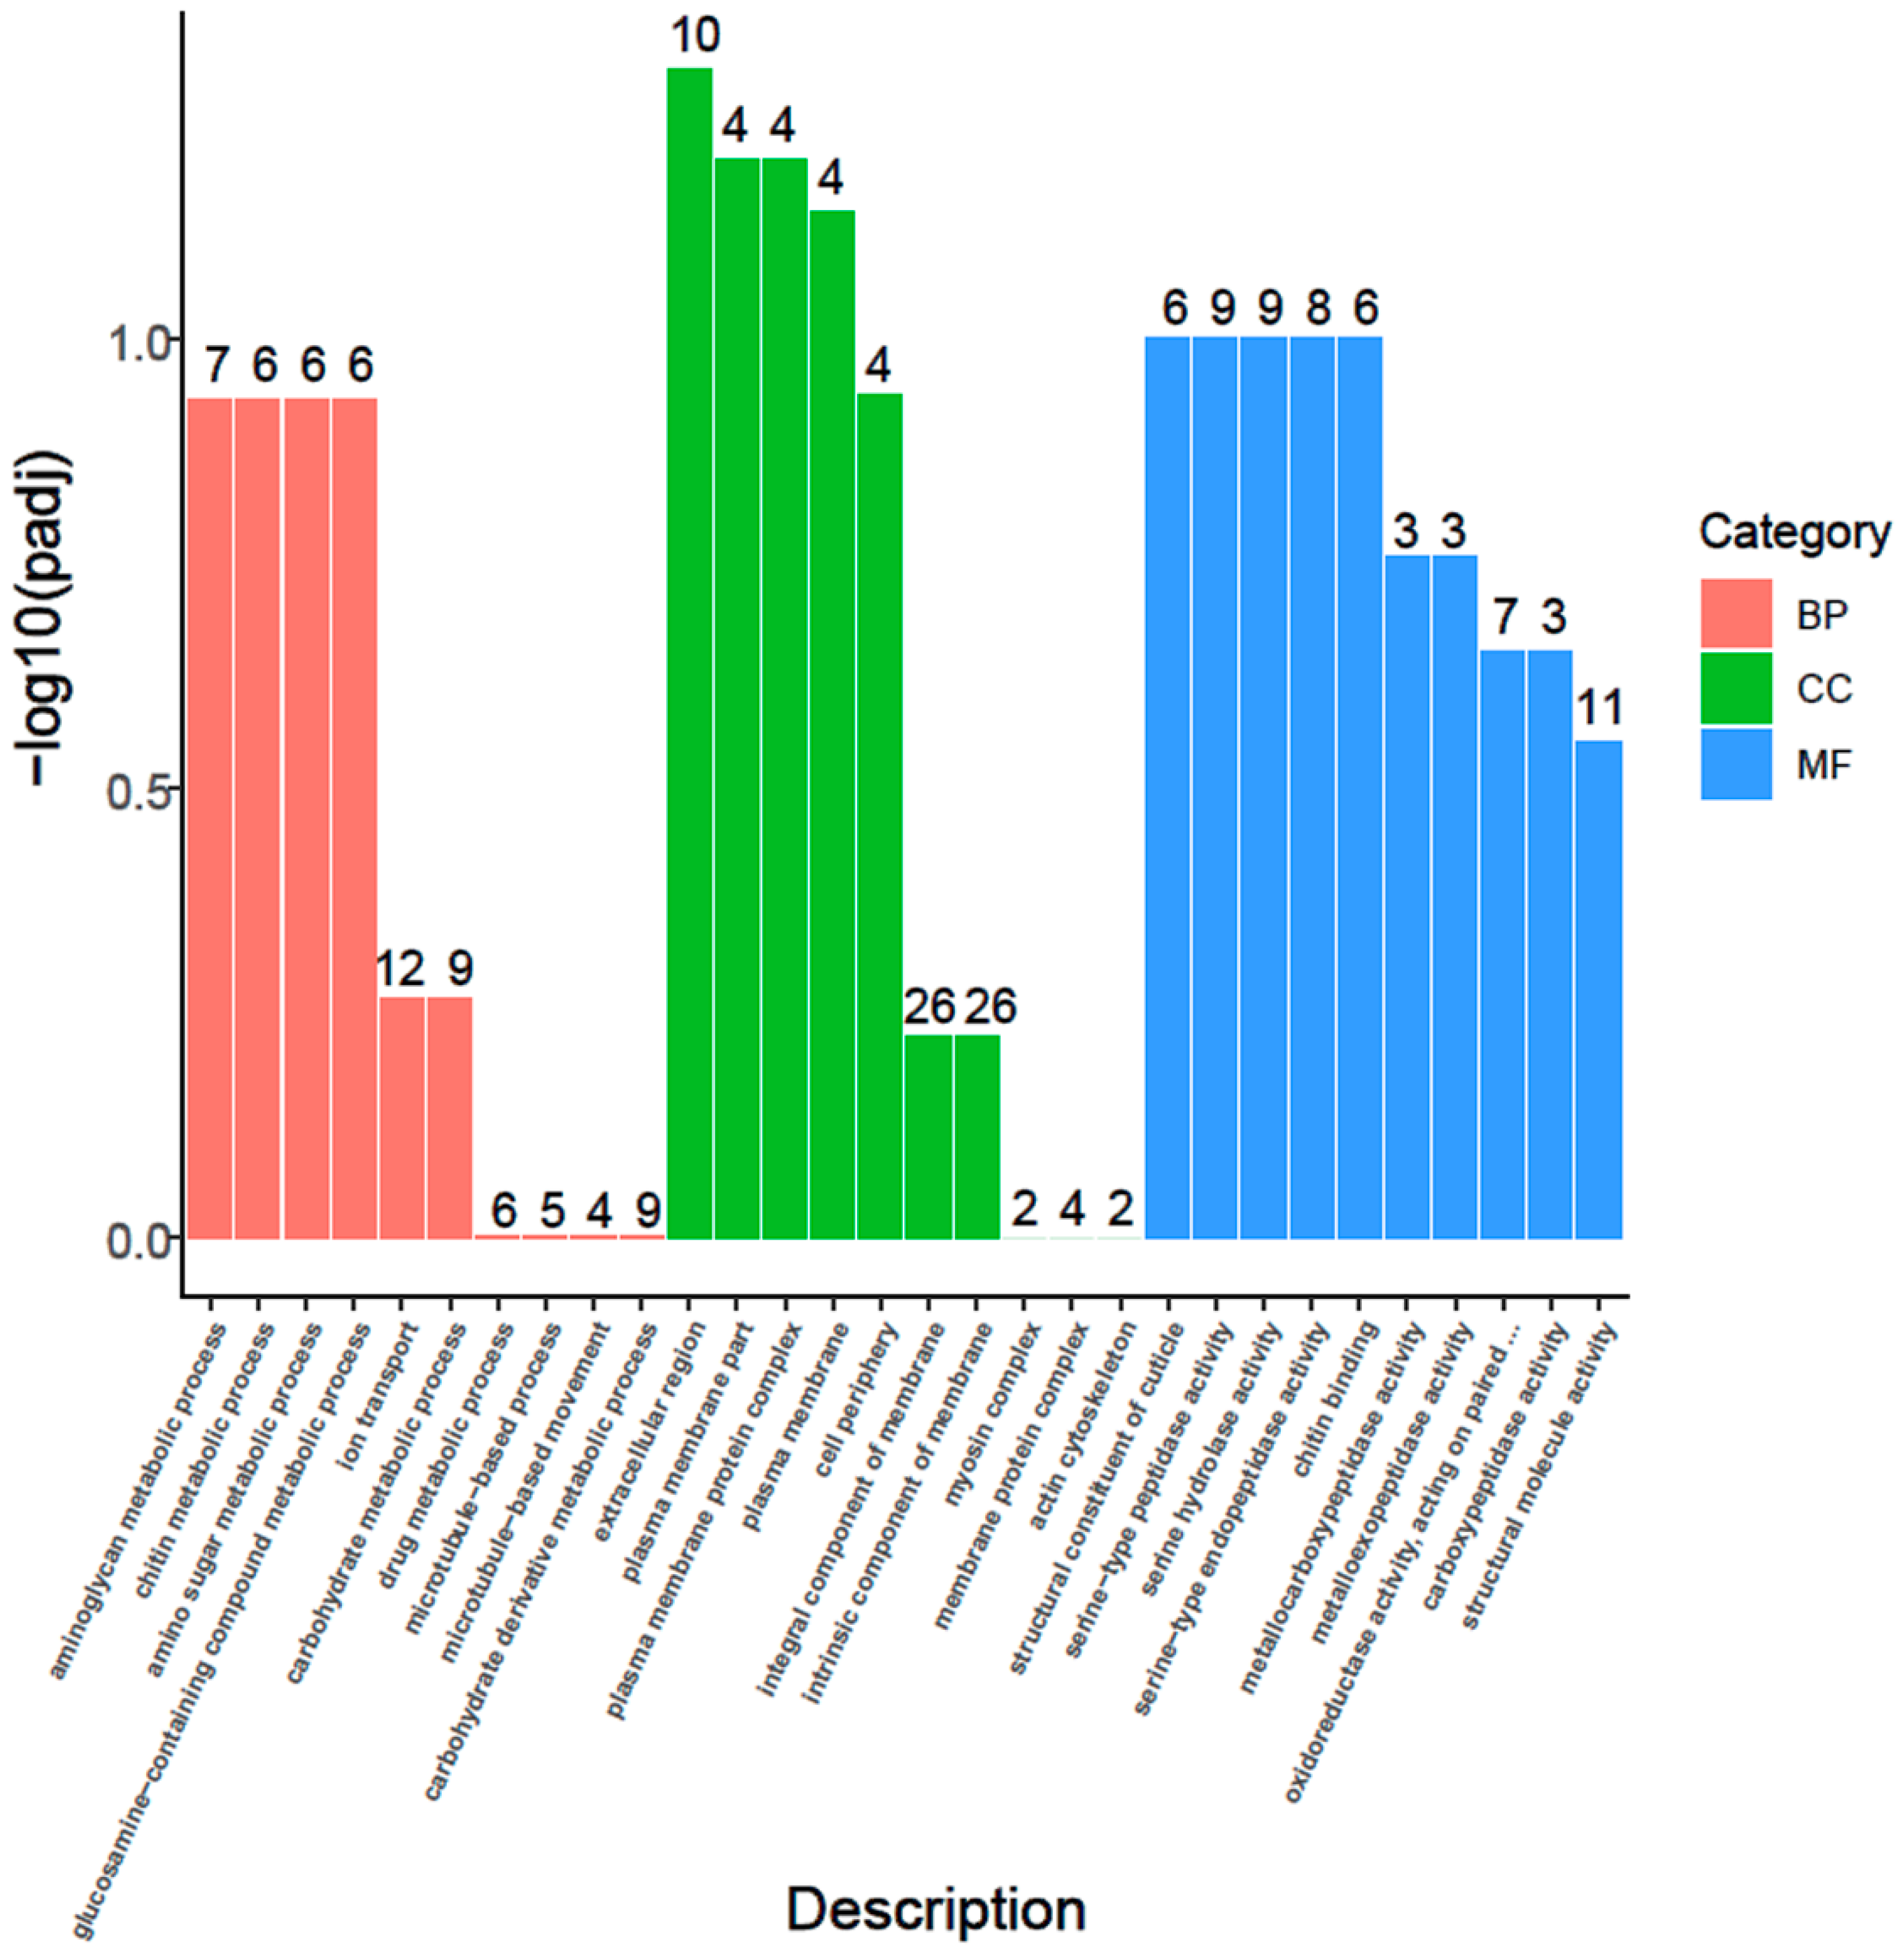
3.6. GO Enrichment
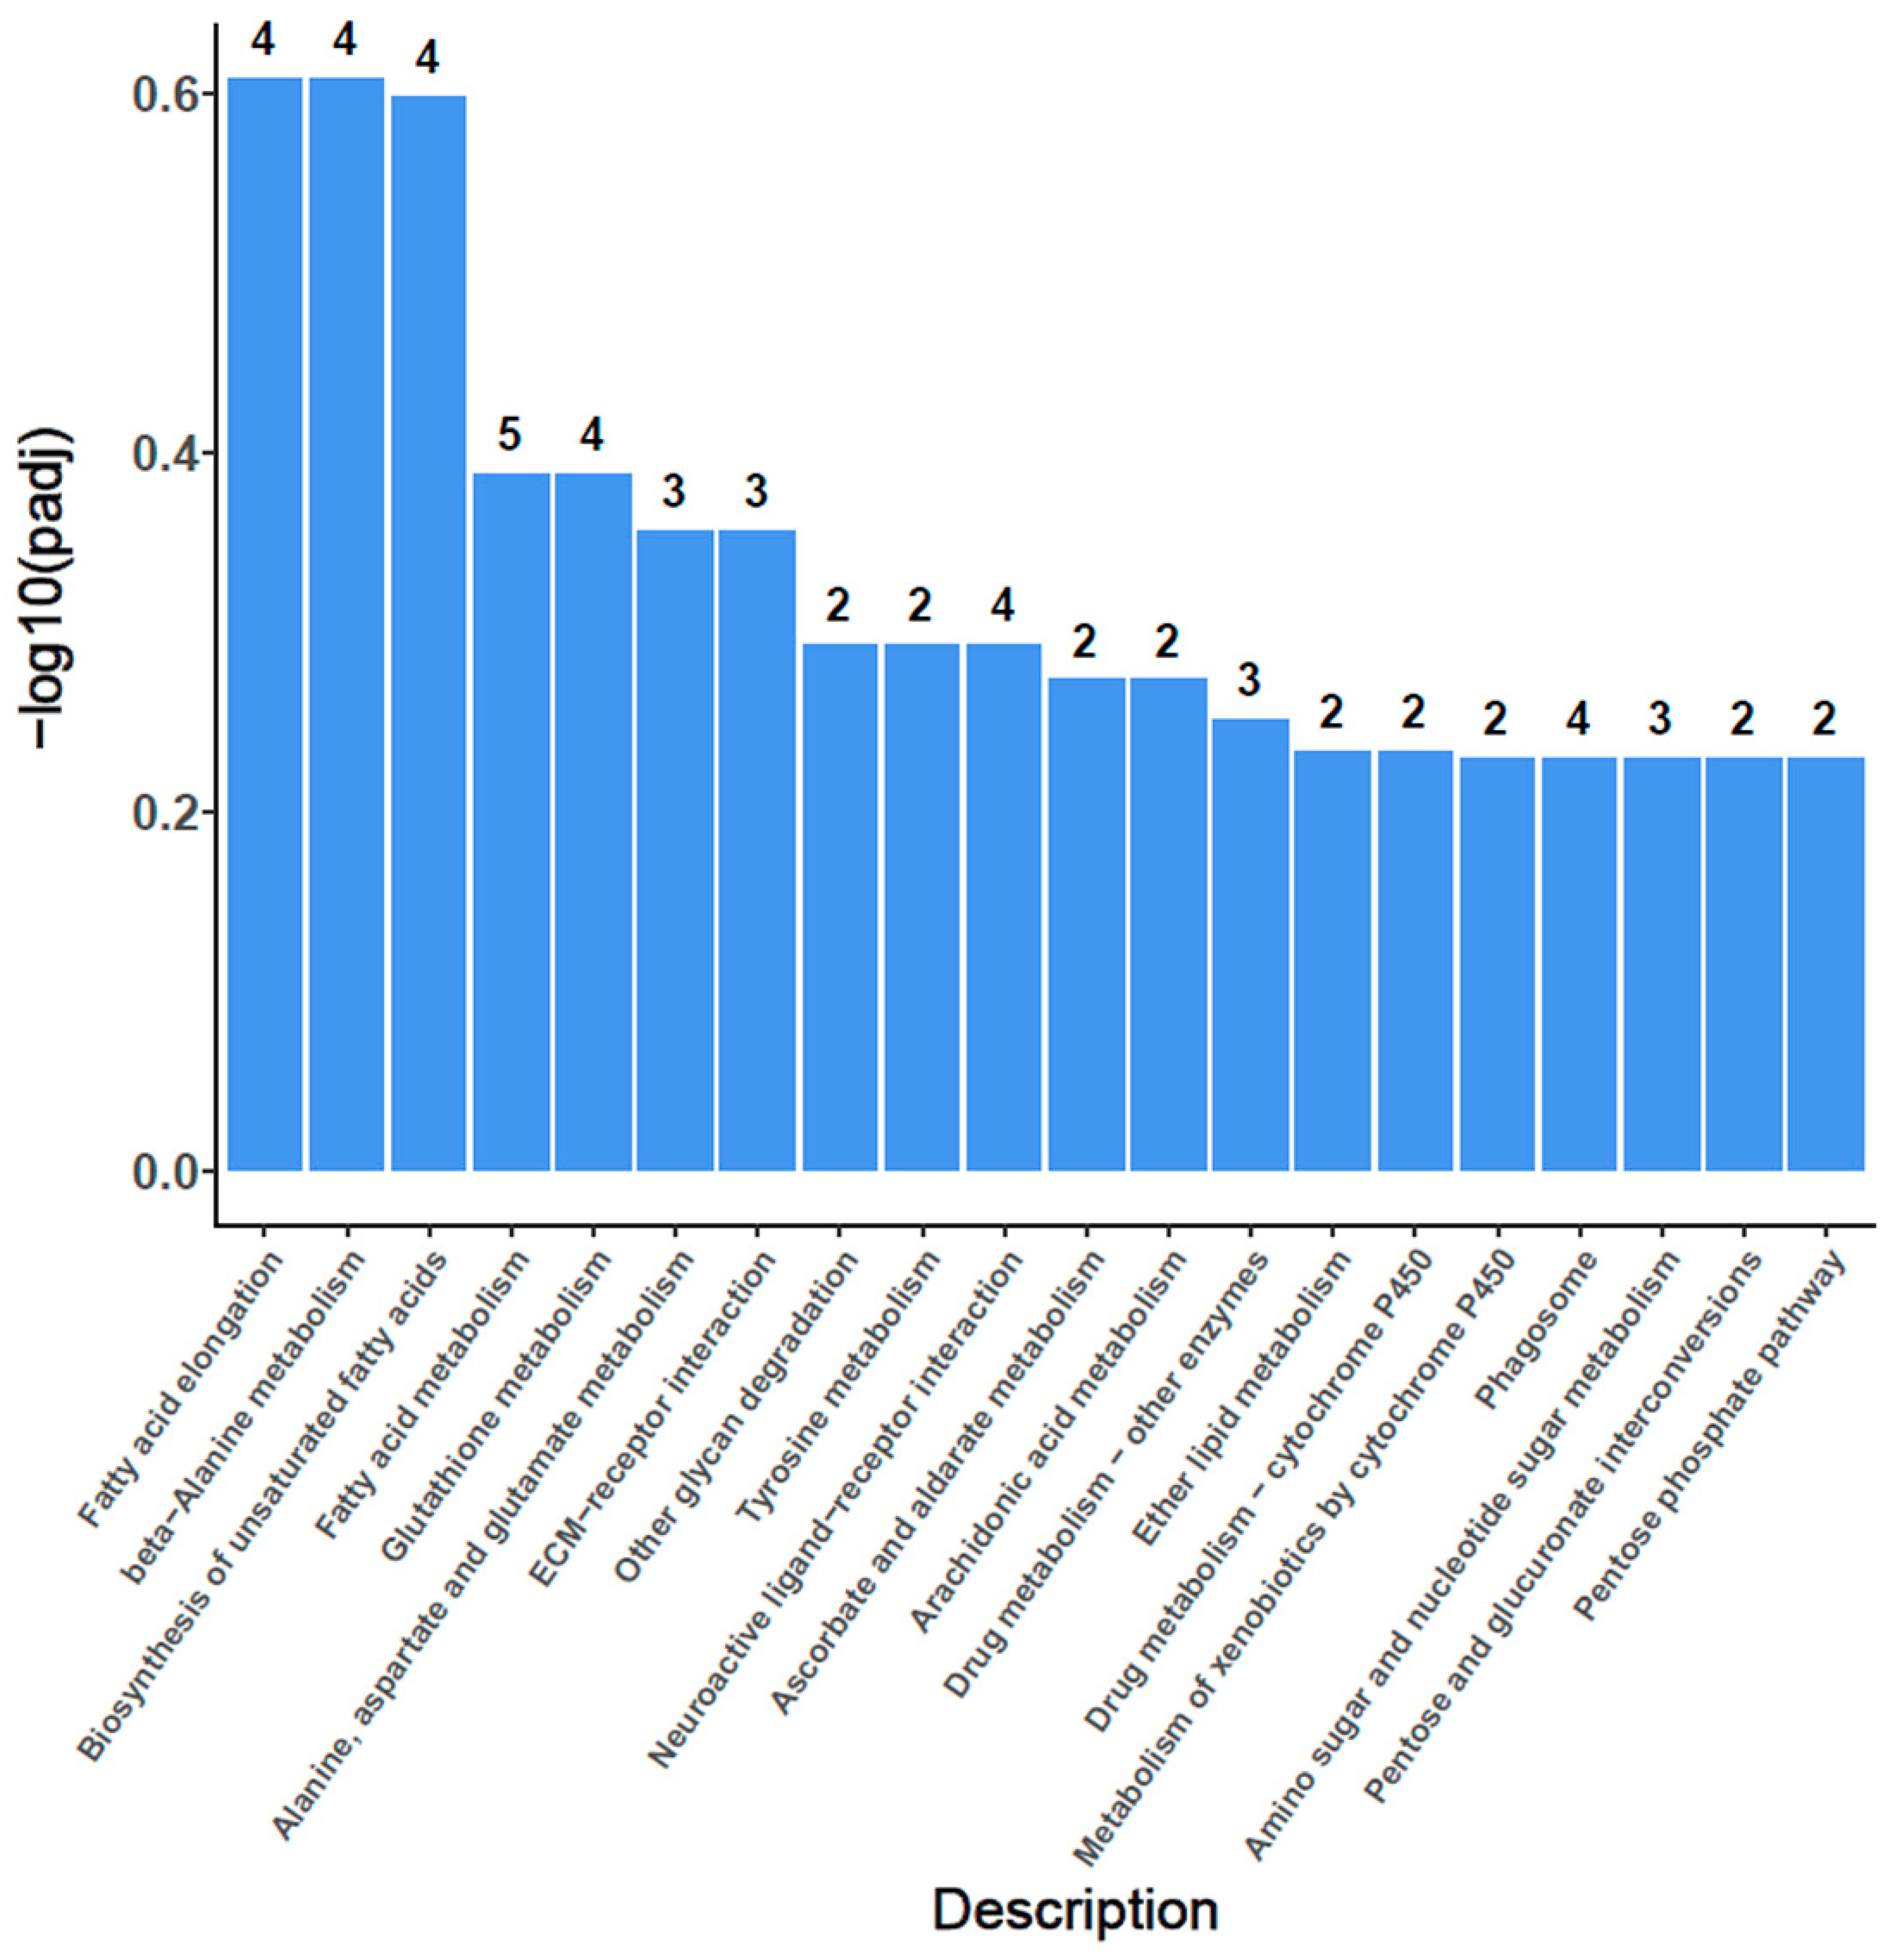
3.7. KEGG Enrichment
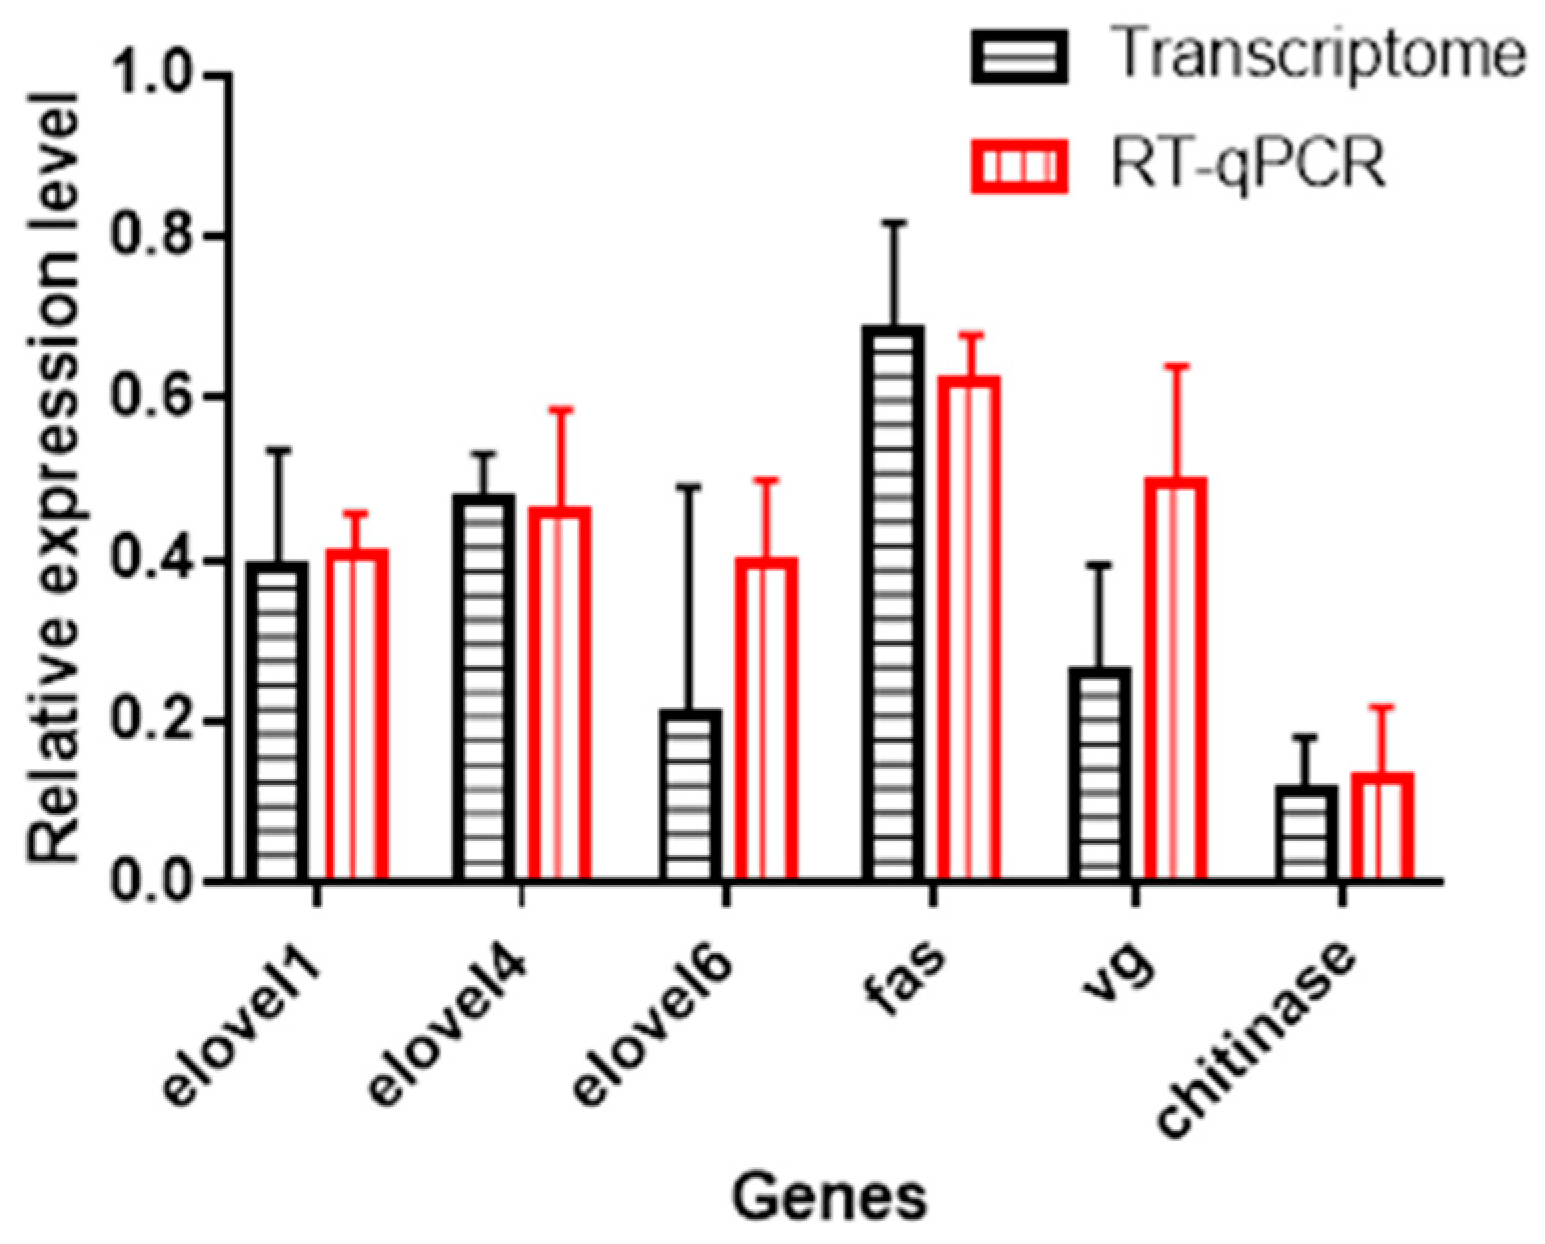
3.8. Validation by qRT-PCR
4. Discussion
5. Conclusions
Supplementary Materials
Author Contributions
Funding
Institutional Review Board Statement
Informed Consent Statement
Data Availability Statement
Acknowledgments
Conflicts of Interest
References
- Skiles, D.D. The Geomagnetic Field Its Nature, History, and Biological Relevance. In Magnetite Biomineralization and Magnetoreception in Organisms: A New Biomagnetism; Kirschvink, J.L., Jones, D.S., MacFadden, B.J., Eds.; Springer: Boston, MA, USA, 1985; pp. 43–102. [Google Scholar]
- Formicki, K.; Korzelecka-Orkisz, A.; Tański, A. Magnetoreception in fish. J. Fish Biol. 2019, 95, 73–91. [Google Scholar] [CrossRef] [PubMed]
- Naisbett-Jones, L.C.; Lohmann, K.J. Magnetoreception and magnetic navigation in fishes: A half century of discovery. J. Comp. Physiol. A 2022, 208, 19–40. [Google Scholar] [CrossRef] [PubMed]
- Lohmann, K.; Lohmann, C. Orientation and open-sea navigation in sea turtles. J. Exp. Biol. 1996, 199, 73–81. [Google Scholar] [CrossRef] [PubMed]
- Wiltschko, W.; Wiltschko, R. Magnetic orientation and magnetoreception in birds and other animals. J. Comp. Physiol. A 2005, 191, 675–693. [Google Scholar] [CrossRef] [PubMed]
- Fleischmann, P.N.; Grob, R.; Rössler, W. Magnetoreception in Hymenoptera: Importance for navigation. Anim. Cogn. 2020, 23, 1051–1061. [Google Scholar] [CrossRef]
- Reppert, S.M.; Gegear, R.J.; Merlin, C. Navigational mechanisms of migrating monarch butterflies. Trends Neurosci. 2010, 33, 399–406. [Google Scholar] [CrossRef]
- Mouritsen, H.; Ritz, T. Magnetoreception and its use in bird navigation. Curr. Opin. Neurobiol. 2005, 15, 406–414. [Google Scholar] [CrossRef]
- Wiltschko, R.; Wiltschko, W. Magnetoreception in birds. J. R. Soc. Interface 2019, 16, 20190295. [Google Scholar] [CrossRef]
- Goswami, P.; He, K.; Li, J.; Pan, Y.; Roberts, A.P.; Lin, W. Magnetotactic bacteria and magnetofossils: Ecology, evolution and environmental implications. NPJ Biofilms Microbiomes 2022, 8, 43. [Google Scholar] [CrossRef]
- Lin, W.; Kirschvink, J.L.; Paterson, G.A.; Bazylinski, D.A.; Pan, Y. On the origin of microbial magnetoreception. Natl. Sci. Rev. 2020, 7, 472–479. [Google Scholar] [CrossRef]
- Monteil, C.L.; Lefevre, C.T. Magnetoreception in Microorganisms. Trends Microbiol. 2020, 28, 266–275. [Google Scholar] [CrossRef]
- Jacob, J.J.; Suthindhiran, K. Magnetotactic bacteria and magnetosomes—Scope and challenges. Mater. Sci. Eng. C 2016, 68, 919–928. [Google Scholar] [CrossRef]
- Maffei, M.E. Magnetic field effects on plant growth, development, and evolution. Front. Plant Sci. 2014, 5, 445. [Google Scholar] [CrossRef]
- Redlarski, G.; Lewczuk, B.; Żak, A.; Koncicki, A.; Krawczuk, M.; Piechocki, J.; Jakubiuk, K.; Tojza, P.; Jaworski, J.; Ambroziak, D.; et al. The influence of electromagnetic pollution on living organisms: Historical trends and forecasting changes. Biomed. Res. Int. 2015, 2015, 234098. [Google Scholar] [CrossRef]
- Ahlbom, A.; Bridges, J.; de Seze, R.; Hillert, L.; Juutilainen, J.; Mattsson, M.O.; Neubauer, G.; Schüz, J.; Simko, M.; Bromen, K. Possible effects of electromagnetic fields (EMF) on human health—Opinion of the scientific committee on emerging and newly identified health risks (SCENIHR). Toxicology 2008, 246, 248–250. [Google Scholar] [CrossRef]
- Wyszkowska, J.; Shepherd, S.; Sharkh, S.; Jackson, C.W.; Newland, P.L. Exposure to extremely low frequency electromagnetic fields alters the behaviour, physiology and stress protein levels of desert locusts. Sci. Rep. 2016, 6, 36413. [Google Scholar] [CrossRef]
- Jadidi, M.; Firoozabadi, S.M.; Rashidy-Pour, A.; Sajadi, A.A.; Sadeghi, H.; Taherian, A.A. Acute exposure to a 50Hz magnetic field impairs consolidation of spatial memory in rats. Neurobiol. Learn. Mem. 2007, 88, 387–392. [Google Scholar] [CrossRef]
- Szemerszky, R.; Zelena, D.; Barna, I.; Bárdos, G. Stress-related endocrinological and psychopathological effects of short- and long-term 50 Hz electromagnetic field exposure in rats. Brain Res. Bull. 2010, 81, 92–99. [Google Scholar] [CrossRef]
- Repacholi, M. Concern that “EMF” magnetic fields from power lines cause cancer. Sci. Total Environ. 2012, 426, 454–458. [Google Scholar] [CrossRef]
- Breeze, T.D.; Vaissière, B.E.; Bommarco, R.; Petanidou, T.; Seraphides, N.; Kozák, L.; Scheper, J.; Biesmeijer, J.C.; Kleijn, D.; Gyldenkærne, S.; et al. Agricultural policies exacerbate honeybee pollination service supply-demand mismatches across Europe. PLoS ONE 2014, 9, e82996. [Google Scholar] [CrossRef]
- Potts, S.G.; Biesmeijer, J.C.; Kremen, C.; Neumann, P.; Schweiger, O.; Kunin, W.E. Global pollinator declines: Trends, impacts and drivers. Trends Ecol. Evol. 2010, 25, 345–353. [Google Scholar] [CrossRef]
- Gallai, N.; Salles, J.-M.; Settele, J.; Vaissière, B.E. Economic valuation of the vulnerability of world agriculture confronted with pollinator decline. Ecol. Econ. 2009, 68, 810–821. [Google Scholar] [CrossRef]
- Kirschvink, J.; Padmanabha, S.; Boyce, C.; Oglesby, J. Measurement of the threshold sensitivity of honeybees to weak, extremely low-frequency magnetic fields. J. Exp. Biol. 1997, 200, 1363–1368. [Google Scholar] [CrossRef]
- Walker, M.M.; Bitterman, M.E. Conditioning analysis of magnetoreception in honeybees. Bioelectromagnetics 1989, 10, 261–275. [Google Scholar] [CrossRef]
- Hsu, C.Y.; Li, C.W. Magnetoreception in honeybees. Science 1994, 265, 95–97. [Google Scholar] [CrossRef][Green Version]
- Shepherd, S.; Lima, M.A.P.; Oliveira, E.E.; Sharkh, S.M.; Jackson, C.W.; Newland, P.L. Extremely Low Frequency Electromagnetic Fields impair the Cognitive and Motor Abilities of Honey Bees. Sci. Rep. 2018, 8, 7932. [Google Scholar] [CrossRef]
- Shepherd, S.; Hollands, G.; Godley, V.C.; Sharkh, S.M.; Jackson, C.W.; Newland, P.L. Increased aggression and reduced aversive learning in honey bees exposed to extremely low frequency electromagnetic fields. PLoS ONE 2019, 14, e0223614. [Google Scholar] [CrossRef]
- Migdał, P.; Berbeć, E.; Bieńkowski, P.; Plotnik, M.; Murawska, A.; Latarowski, K. Exposure to Magnetic Fields Changes the Behavioral Pattern in Honeybees (Apis mellifera L.) under Laboratory Conditions. Animals 2022, 12, 855. [Google Scholar] [CrossRef]
- Santhosh Kumar, S. Colony Collapse Disorder (CCD) in Honey BeesCaused by EMF Radiation. Bioinformation 2018, 14, 421–424. [Google Scholar] [CrossRef]
- Koziorowska, A.; Depciuch, J.; Białek, J.; Woś, I.; Kozioł, K.; Sadło, S.; Piechowicz, B. Electromagnetic field of extremely low frequency has an impact on selected chemical components of the honeybee. J. Comp. Physiol. A Neuroethol. Sens. Neural Behav. Physiol. 2020, 23, 537–544. [Google Scholar] [CrossRef]
- Migdał, P.; Murawska, A.; Bieńkowski, P.; Strachecka, A.; Roman, A. Effect of the electric field at 50 Hz and variable intensities on biochemical markers in the honey bee’s hemolymph. PLoS ONE 2021, 16, e0252858. [Google Scholar] [CrossRef]
- Duan, Y.; Wang, Z.; Zhang, H.; He, Y.; Lu, R.; Zhang, R.; Sun, G.; Sun, X. The preventive effect of lotus seedpod procyanidins on cognitive impairment and oxidative damage induced by extremely low frequency electromagnetic field exposure. Food Funct. 2013, 4, 1252–1262. [Google Scholar] [CrossRef]
- Migdał, P.; Murawska, A.; Strachecka, A.; Bieńkowski, P.; Roman, A. Changes in the Honeybee Antioxidant System after 12 h of Exposure to Electromagnetic Field Frequency of 50 Hz and Variable Intensity. Insects 2020, 11, 713. [Google Scholar] [CrossRef]
- Atli, E.; Unlü, H. The effects of microwave frequency electromagnetic fields on the development of Drosophila melanogaster. Int. J. Radiat. Biol. 2006, 82, 435–441. [Google Scholar] [CrossRef]
- Agrawal, N.; Verma, K.; Baghel, D.; Chauhan, A.; Prasad, D.N.; Sharma, S.K.; Kohli, E. Effects of extremely low-frequency electromagnetic field on different developmental stages of Drosophila melanogaster. Int. J. Radiat. Biol. 2021, 97, 1606–1616. [Google Scholar] [CrossRef]
- Mirabolghasemi, G.; Azarnia, M. Developmental changes in Drosophila melanogaster following exposure to alternating electromagnetic fields. Bioelectromagnetics 2002, 23, 416–420. [Google Scholar] [CrossRef]
- Valadez-Lira, J.A.; Medina-Chavez, N.O.; Orozco-Flores, A.A.; Heredia-Rojas, J.A.; Rodriguez-de la Fuente, A.O.; Gomez-Flores, R.; Alcocer-Gonzalez, J.M.; Tamez-Guerra, P. Alterations of Immune Parameters on Trichoplusia ni (Lepidoptera: Noctuidae) Larvae Exposed to Extremely Low-Frequency Electromagnetic Fields. Environ. Entomol. 2017, 46, 376–382. [Google Scholar] [CrossRef]
- Vojvodic, S.; Jensen, A.B.; James, R.R.; Boomsma, J.J.; Eilenberg, J. Temperature dependent virulence of obligate and facultative fungal pathogens of honeybee brood. Vet. Microbiol. 2011, 149, 200–205. [Google Scholar] [CrossRef]
- Jensen, A.B.; Pedersen, B.V.; Eilenberg, J. Differential susceptibility across honey bee colonies in larval chalkbrood resistance. Apidologie 2009, 40, 524–534. [Google Scholar] [CrossRef]
- Mortazavi, A.; Williams, B.A.; McCue, K.; Schaeffer, L.; Wold, B. Mapping and quantifying mammalian transcriptomes by RNA-Seq. Nat. Methods 2008, 5, 621–628. [Google Scholar] [CrossRef]
- Pertea, M.; Pertea, G.M.; Antonescu, C.M.; Chang, T.-C.; Mendell, J.T.; Salzberg, S.L. StringTie enables improved reconstruction of a transcriptome from RNA-seq reads. Nature Biotechnol. 2015, 33, 290–295. [Google Scholar] [CrossRef]
- Liao, Y.; Smyth, G.K.; Shi, W. Feature counts: An efficient general purpose program for assigning sequence reads to genomic features. Bioinformatics 2013, 30, 923–930. [Google Scholar] [CrossRef]
- Love, M.I.; Huber, W.; Anders, S. Moderated estimation of fold change and dispersion for RNA-seq data with DESeq2. Genome Biol. 2014, 15, 550. [Google Scholar] [CrossRef]
- Yu, G.; Wang, L.G.; Han, Y.; He, Q.Y. Cluster profiler: An R package for comparing biological themes among gene clusters. Omics A J. Integr. Biol. 2012, 16, 284–287. [Google Scholar] [CrossRef]
- Simone, M.; Evans, J.D.; Spivak, M. Resin collection and social immunity in honey bees. Evol. Int. J. Org. Evol. 2009, 63, 3016–3022. [Google Scholar] [CrossRef]
- Telfer, W.H.; Kunkel, J.G. The function and evolution of insect storage hexamers. Annu. Rev. Entomol. 1991, 36, 205–228. [Google Scholar] [CrossRef]
- Zoltowska, K.; Frączek, R.; Lipiński, Z. Hydrolases of developing worker brood and newly emerged worker of Apis mellifera carnica. J. Apic. Sci. 2011, 55, 27–36. [Google Scholar]


Publisher’s Note: MDPI stays neutral with regard to jurisdictional claims in published maps and institutional affiliations. |
© 2022 by the authors. Licensee MDPI, Basel, Switzerland. This article is an open access article distributed under the terms and conditions of the Creative Commons Attribution (CC BY) license (https://creativecommons.org/licenses/by/4.0/).
Share and Cite
Li, Y.; Sun, C.; Zhou, H.; Huang, H.; Chen, Y.; Duan, X.; Huang, S.; Li, J. Extremely Low-Frequency Electromagnetic Field Impairs the Development of Honeybee (Apis cerana). Animals 2022, 12, 2420. https://doi.org/10.3390/ani12182420
Li Y, Sun C, Zhou H, Huang H, Chen Y, Duan X, Huang S, Li J. Extremely Low-Frequency Electromagnetic Field Impairs the Development of Honeybee (Apis cerana). Animals. 2022; 12(18):2420. https://doi.org/10.3390/ani12182420
Chicago/Turabian StyleLi, Yingjiao, Chaoxia Sun, He Zhou, Hongji Huang, Yijie Chen, Xinle Duan, Shaokang Huang, and Jianghong Li. 2022. "Extremely Low-Frequency Electromagnetic Field Impairs the Development of Honeybee (Apis cerana)" Animals 12, no. 18: 2420. https://doi.org/10.3390/ani12182420
APA StyleLi, Y., Sun, C., Zhou, H., Huang, H., Chen, Y., Duan, X., Huang, S., & Li, J. (2022). Extremely Low-Frequency Electromagnetic Field Impairs the Development of Honeybee (Apis cerana). Animals, 12(18), 2420. https://doi.org/10.3390/ani12182420