
Supplementation of Molasses-Based Liquid Feed for Cattle Fed on Limpograss Hay
 , , , ,
Simple Summary
Abstract
1. Introduction
2. Materials and Methods
2.1. Experiment 1
2.1.1. Experimental Design, Animals, and Treatments
2.1.2. Apparent Total Tract Digestibility
2.1.3. Ruminal Fluid and pH
2.1.4. Laboratory Analyses
2.1.5. Calculations and Statistical Analysis
2.1.6. Statistical Analysis
2.2. Experiment 2
2.2.1. Treatments and Substrates
2.2.2. In Vitro Incubations
2.2.3. In Vitro Organic Matter Digestibility (IVOMD)
2.2.4. Statistical Analysis
3. Results
3.1. Experiment 1
3.1.1. Diet Intake
3.1.2. Nitrogen Uptake
3.1.3. Digestibility of Diets
3.1.4. Dynamics of In Vivo Ruminal Fermentation Indicators
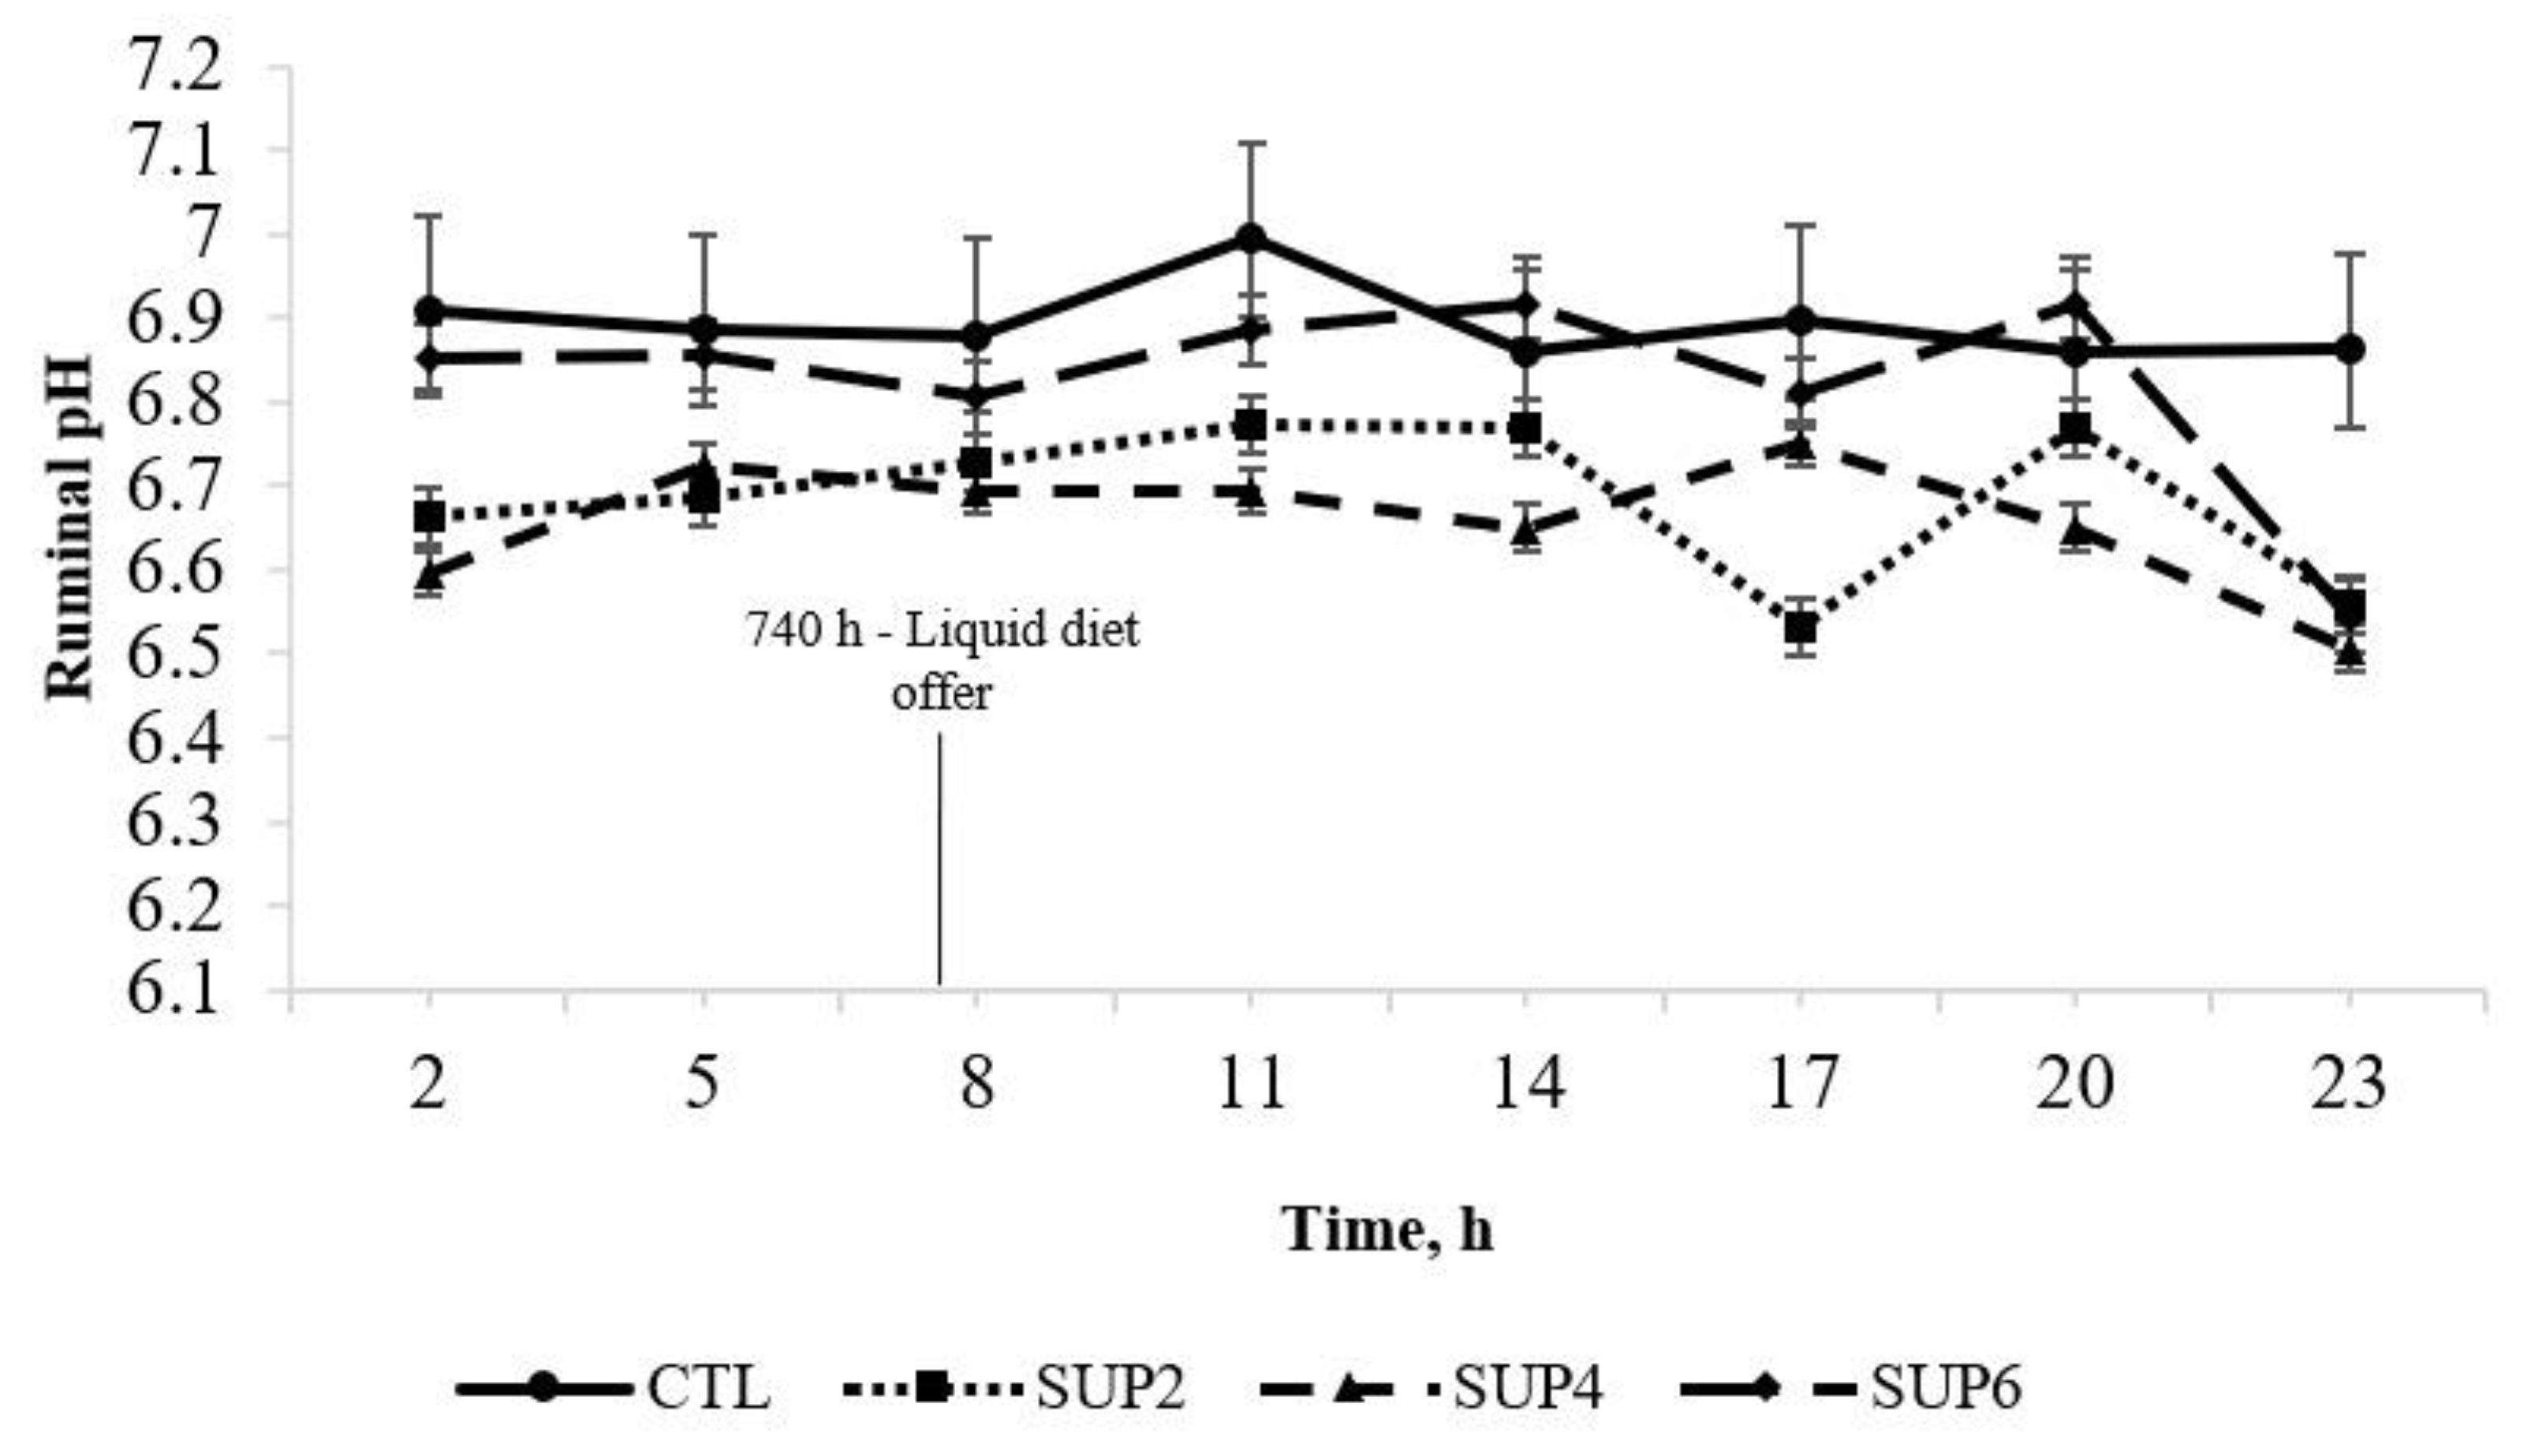
- pH
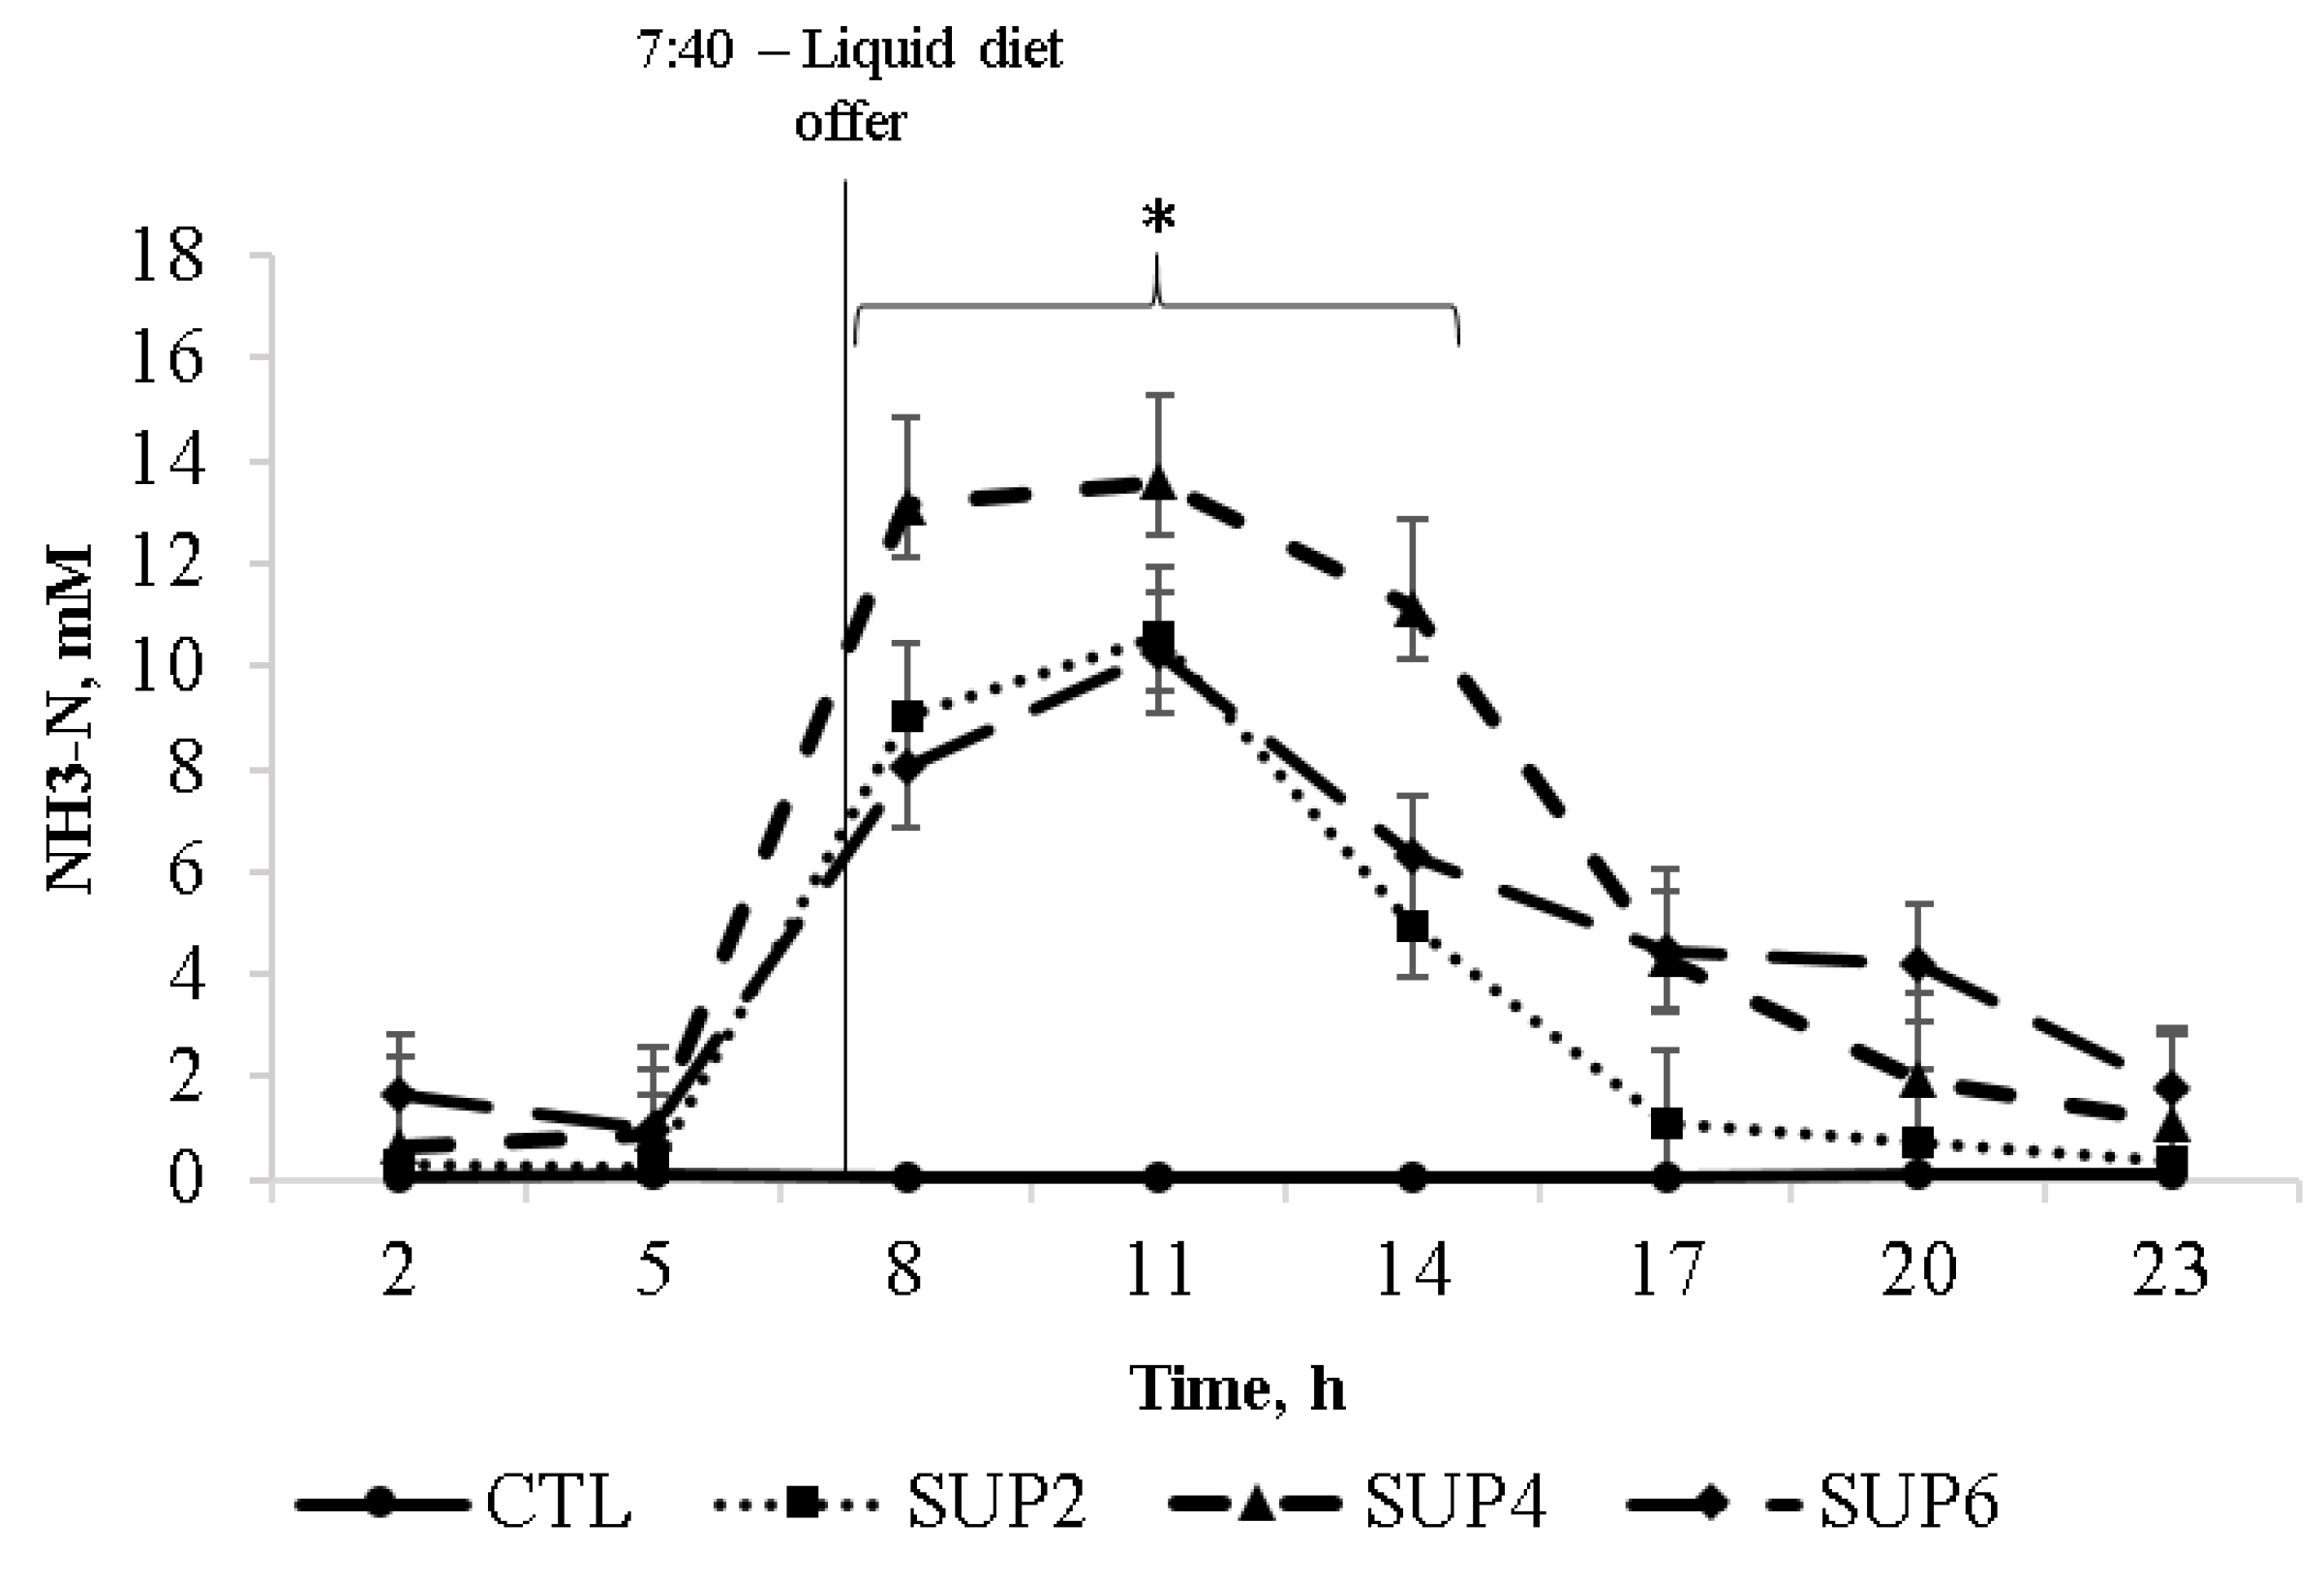
- Ammonia (NH3-N)
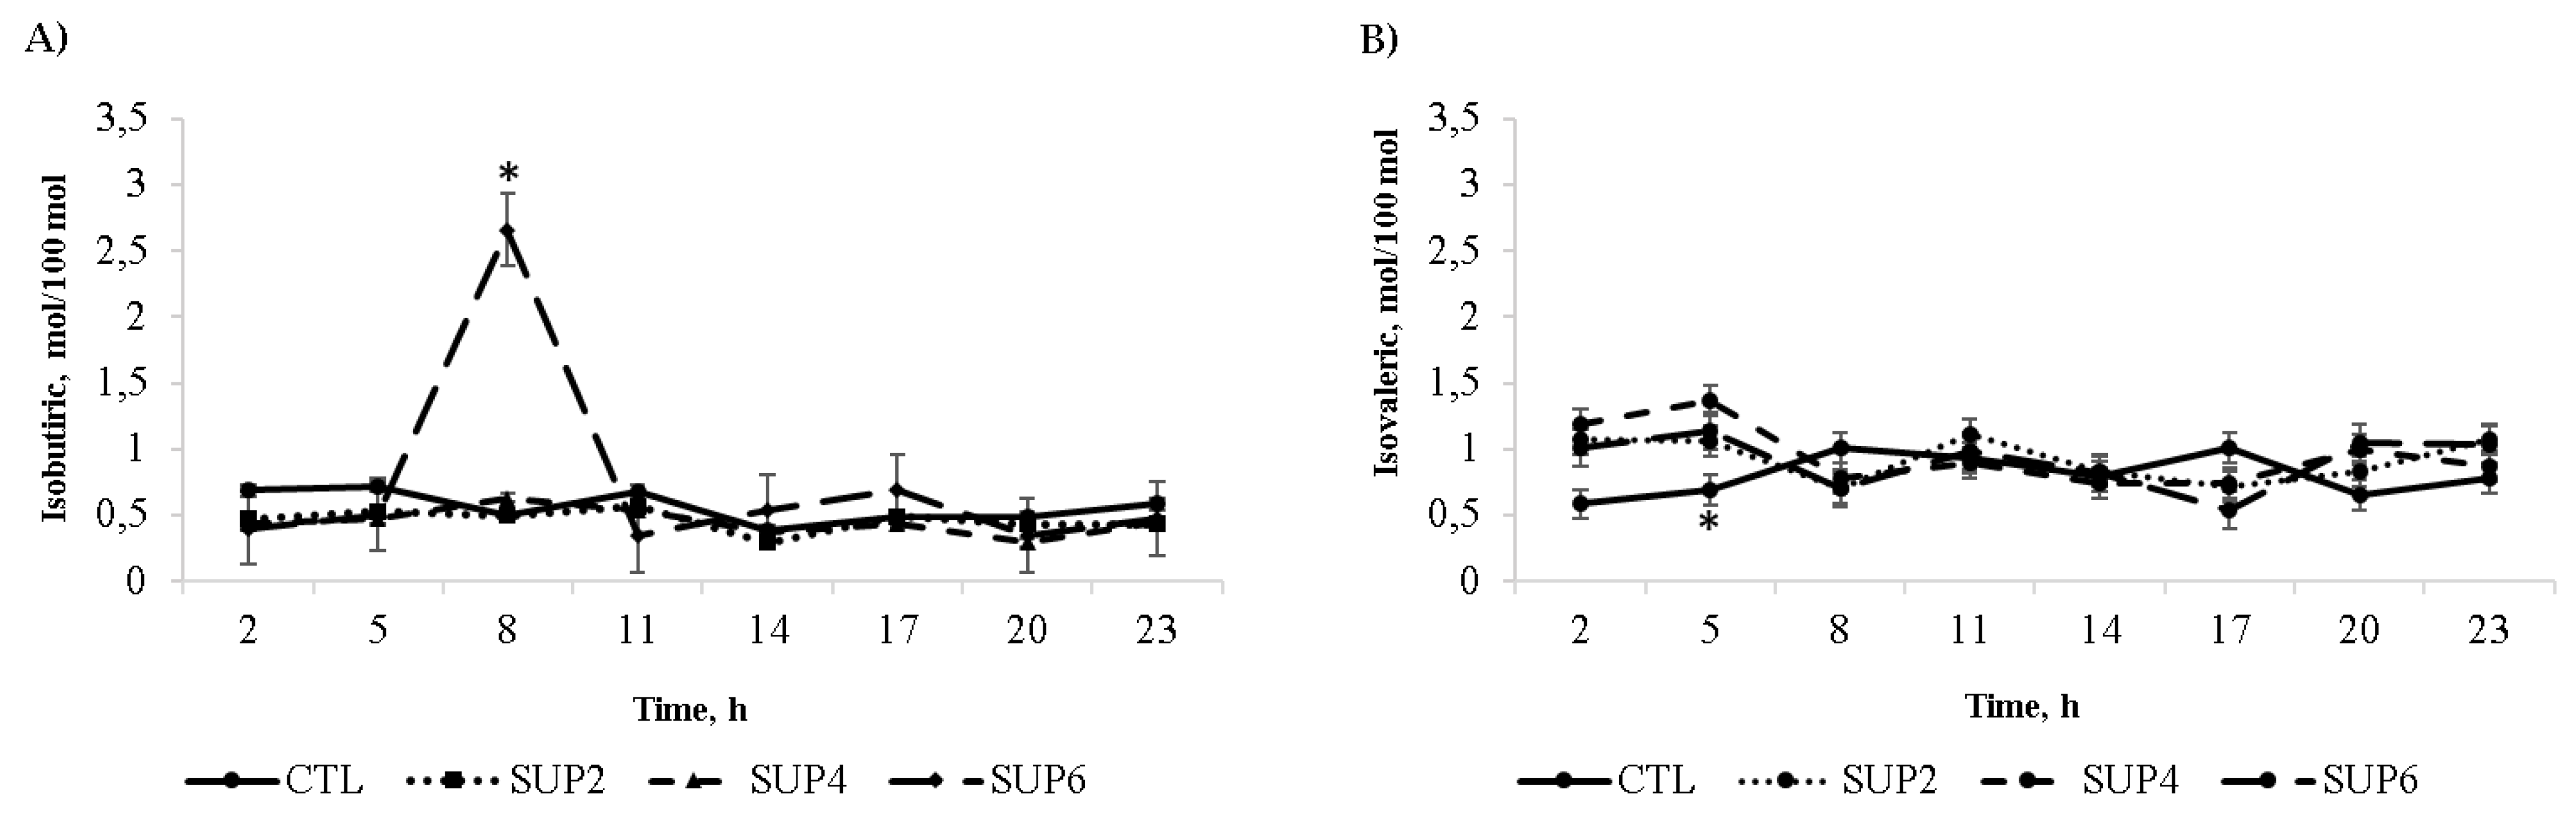
- Volatile fatty acids
3.2. Experiment 2
Dynamics of In Vitro Ruminal Fermentation Indicators
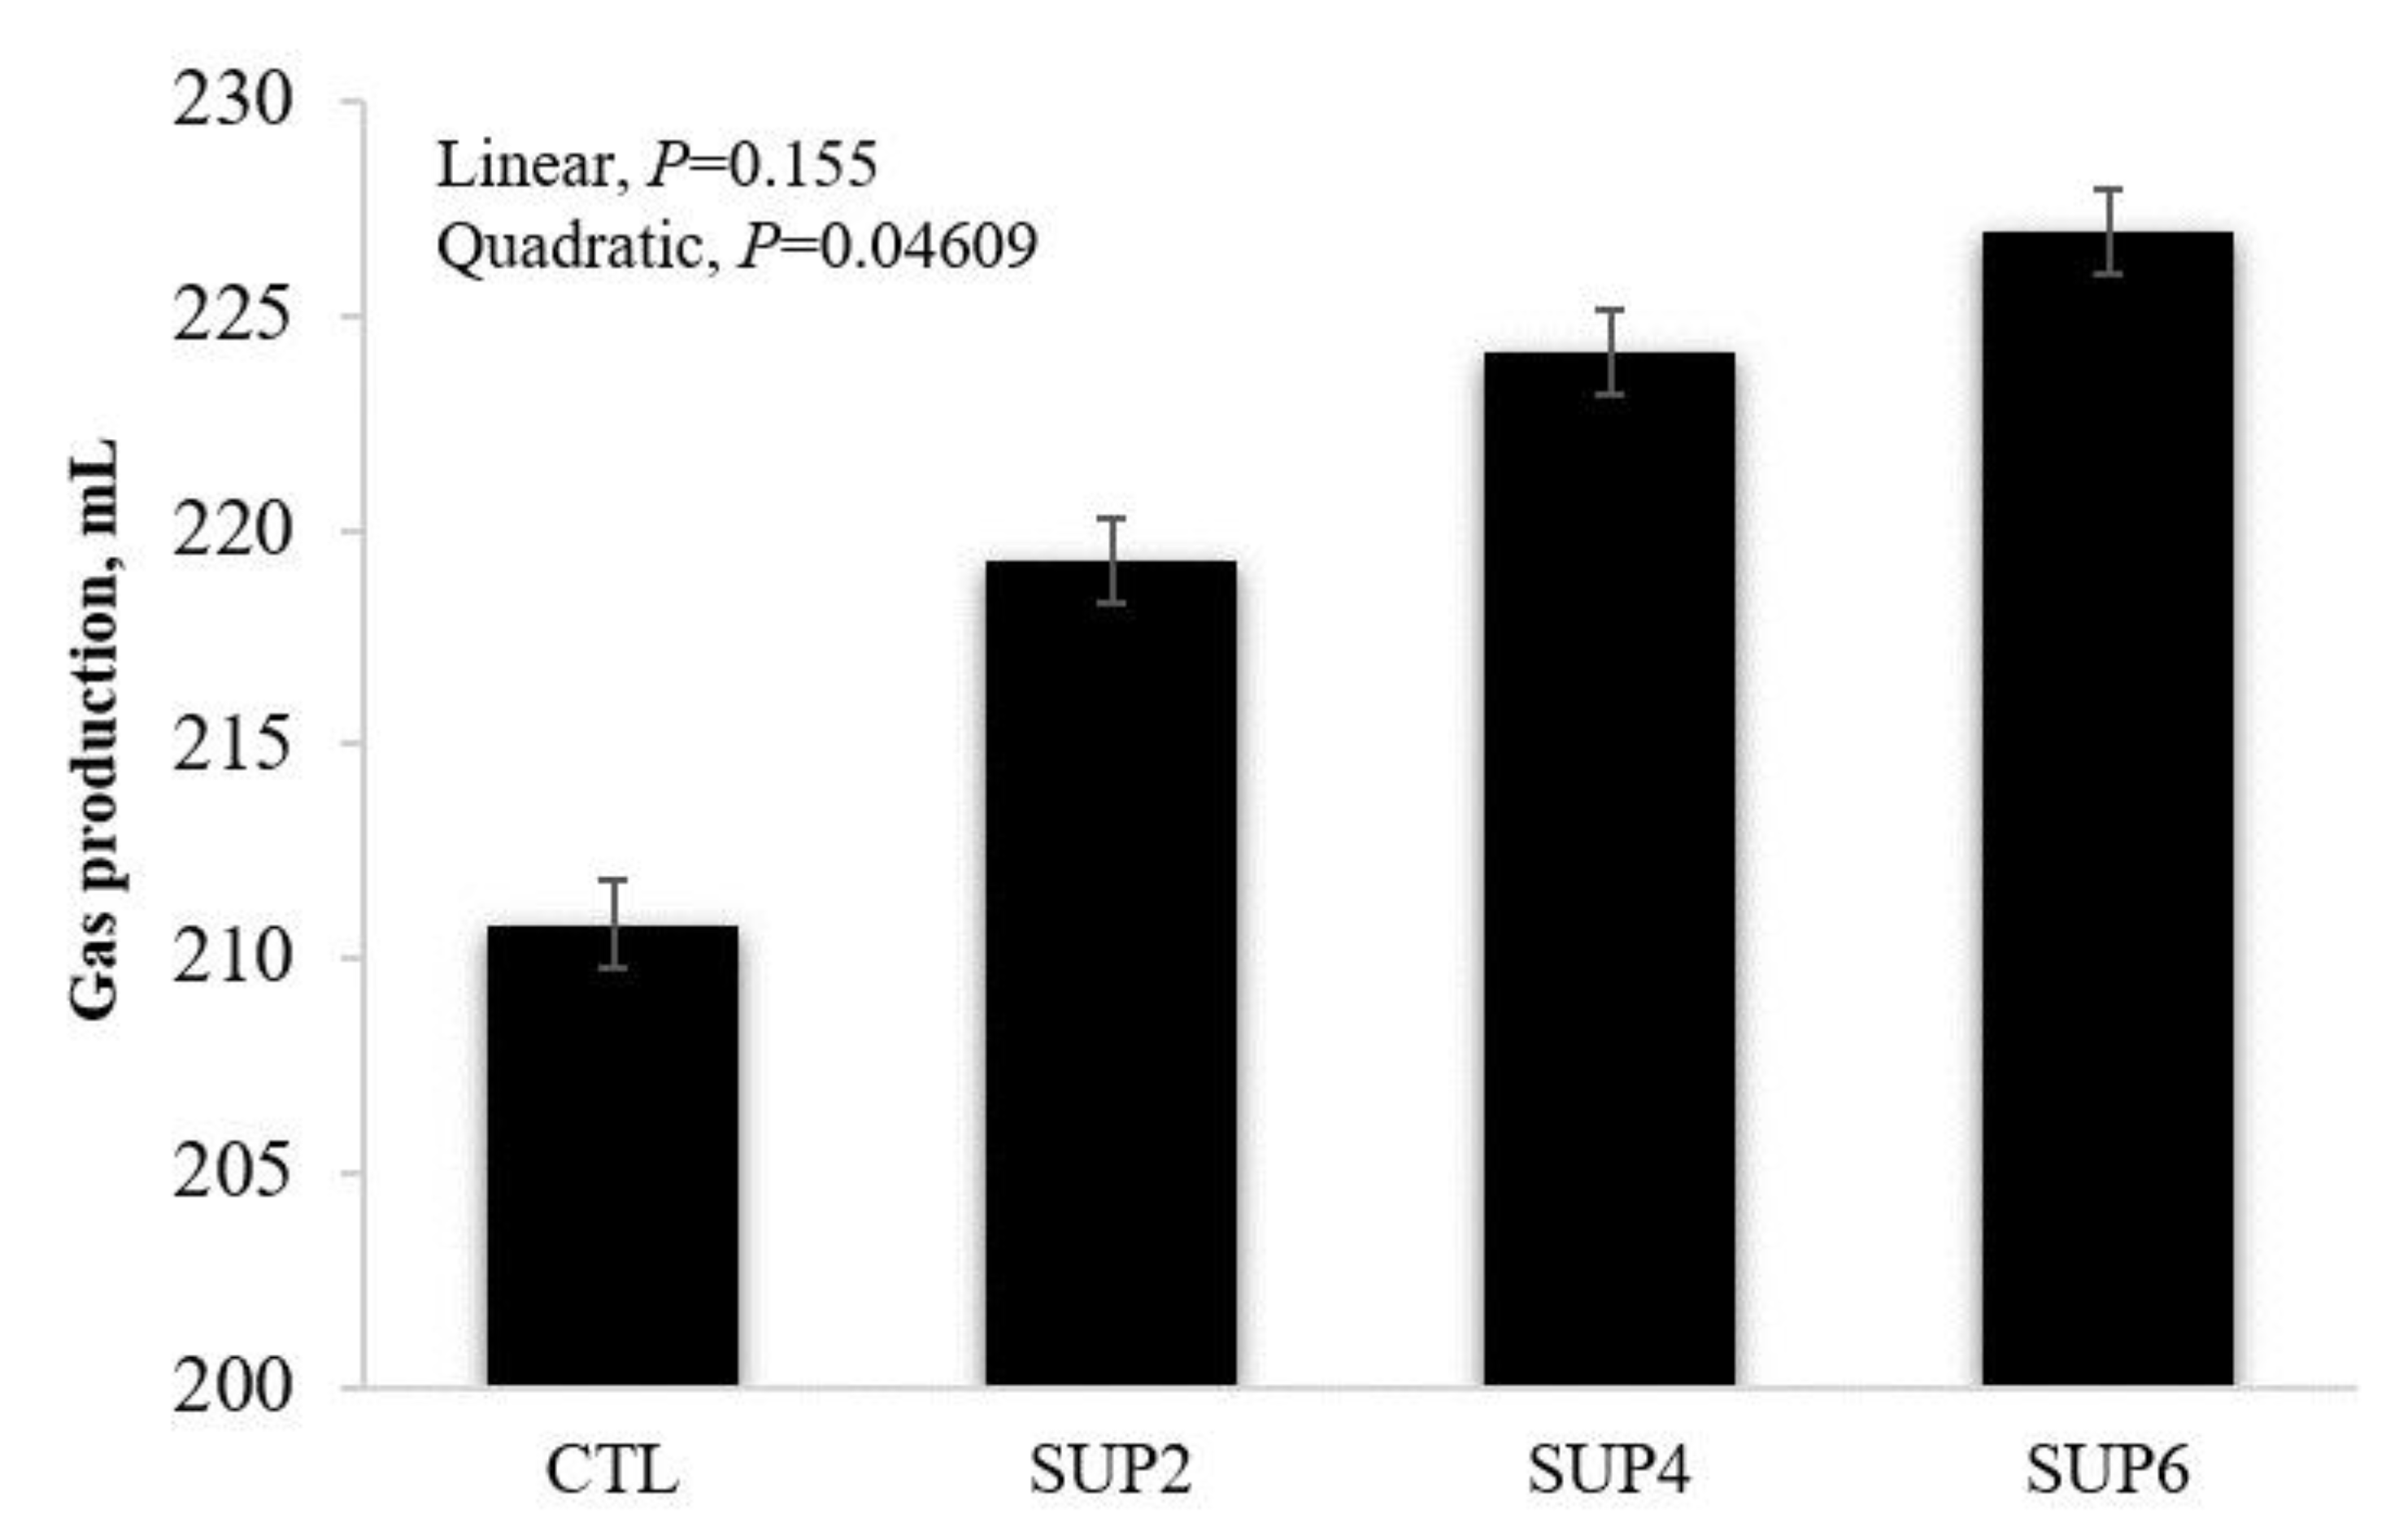
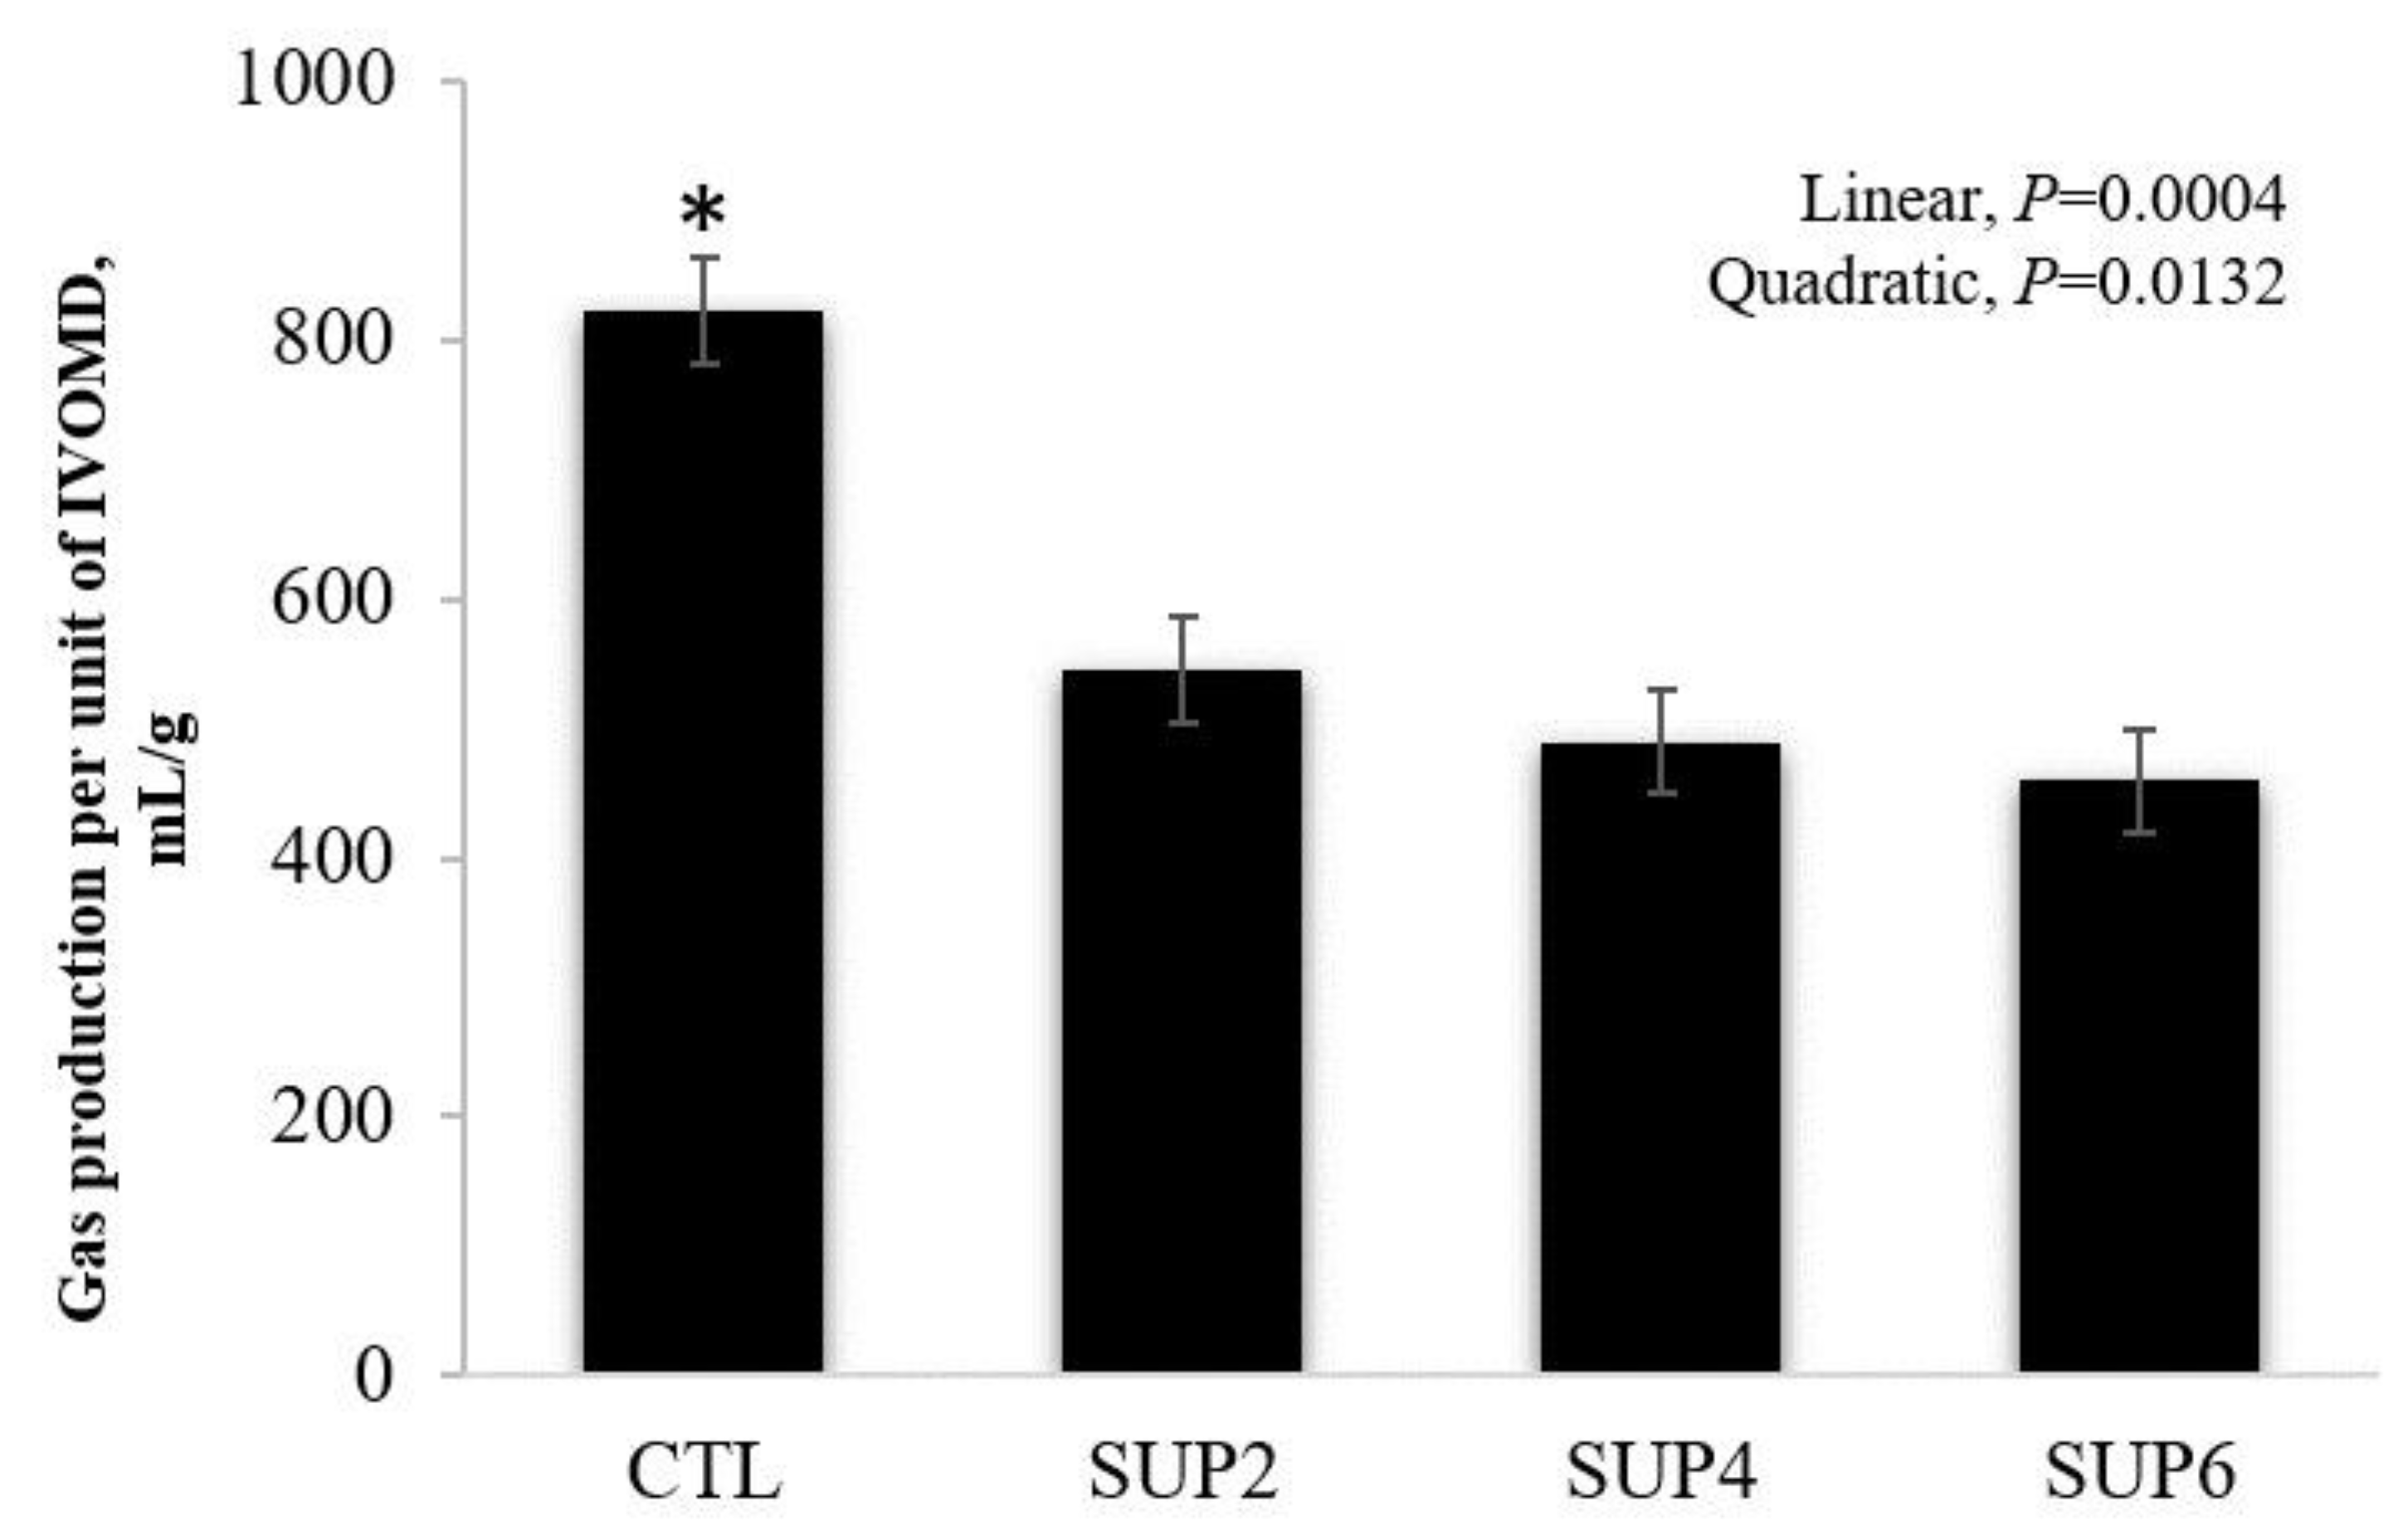
- Gas production
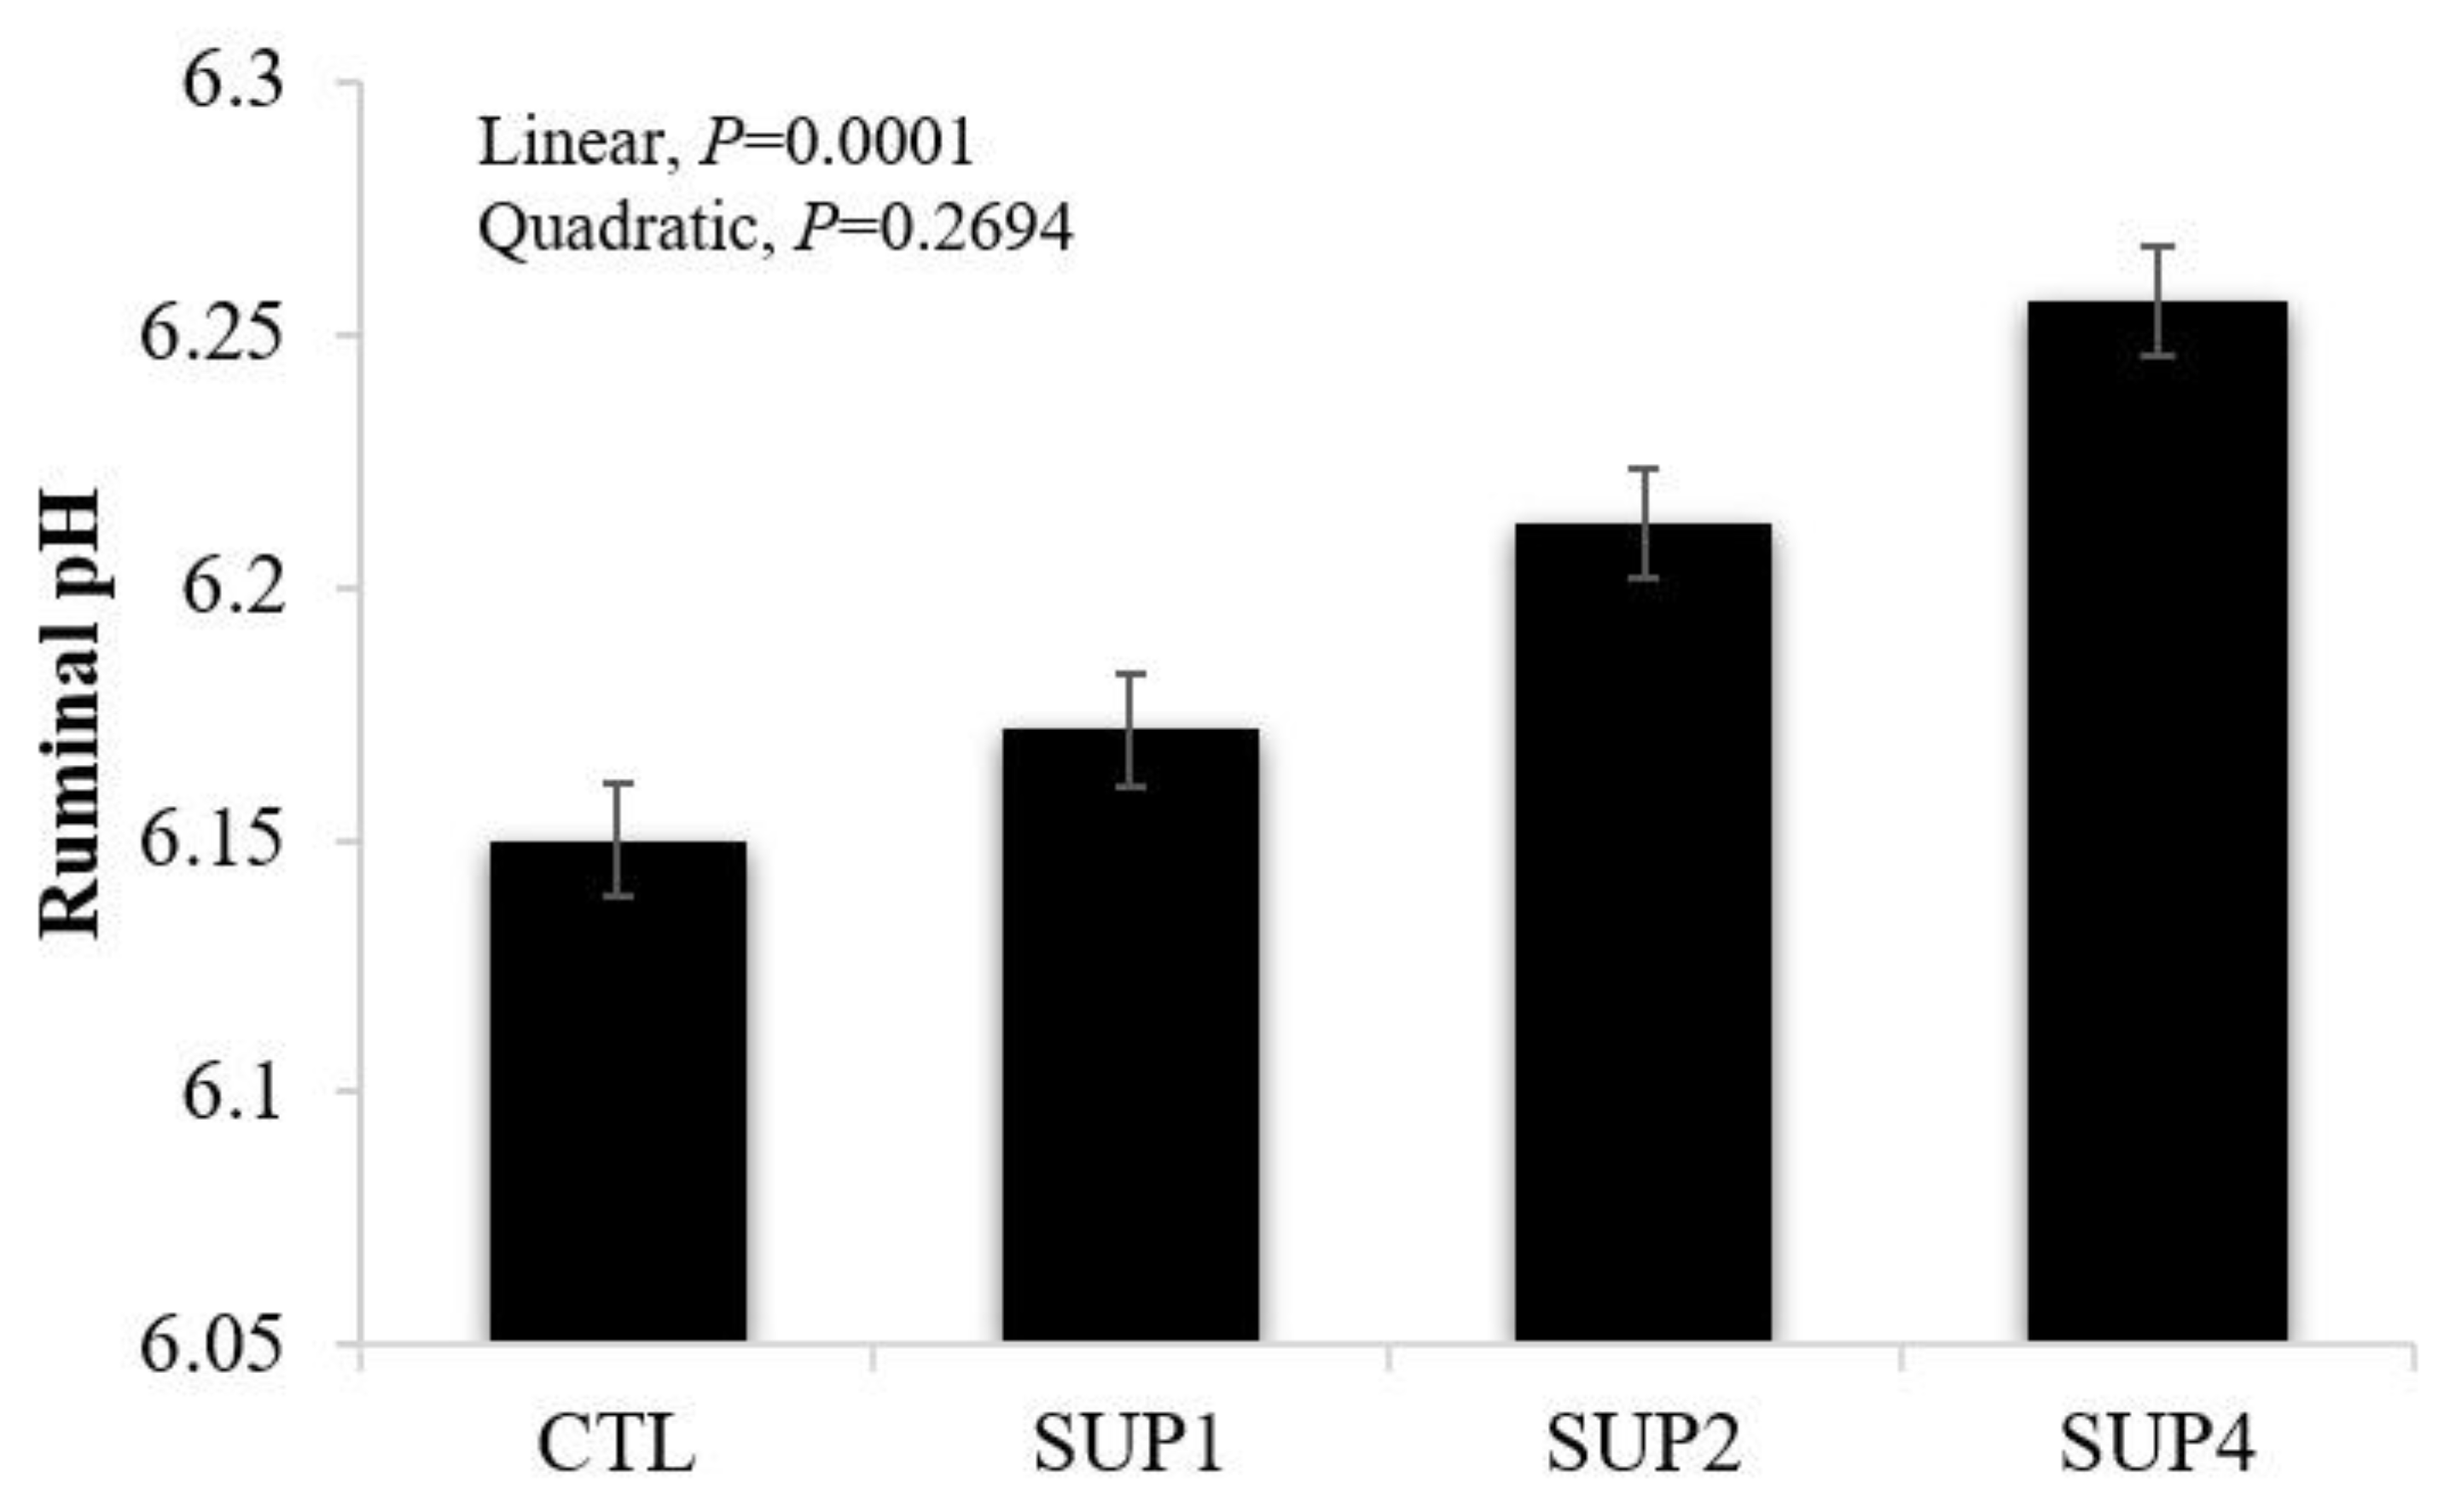
- In vitro rumen fluid pH
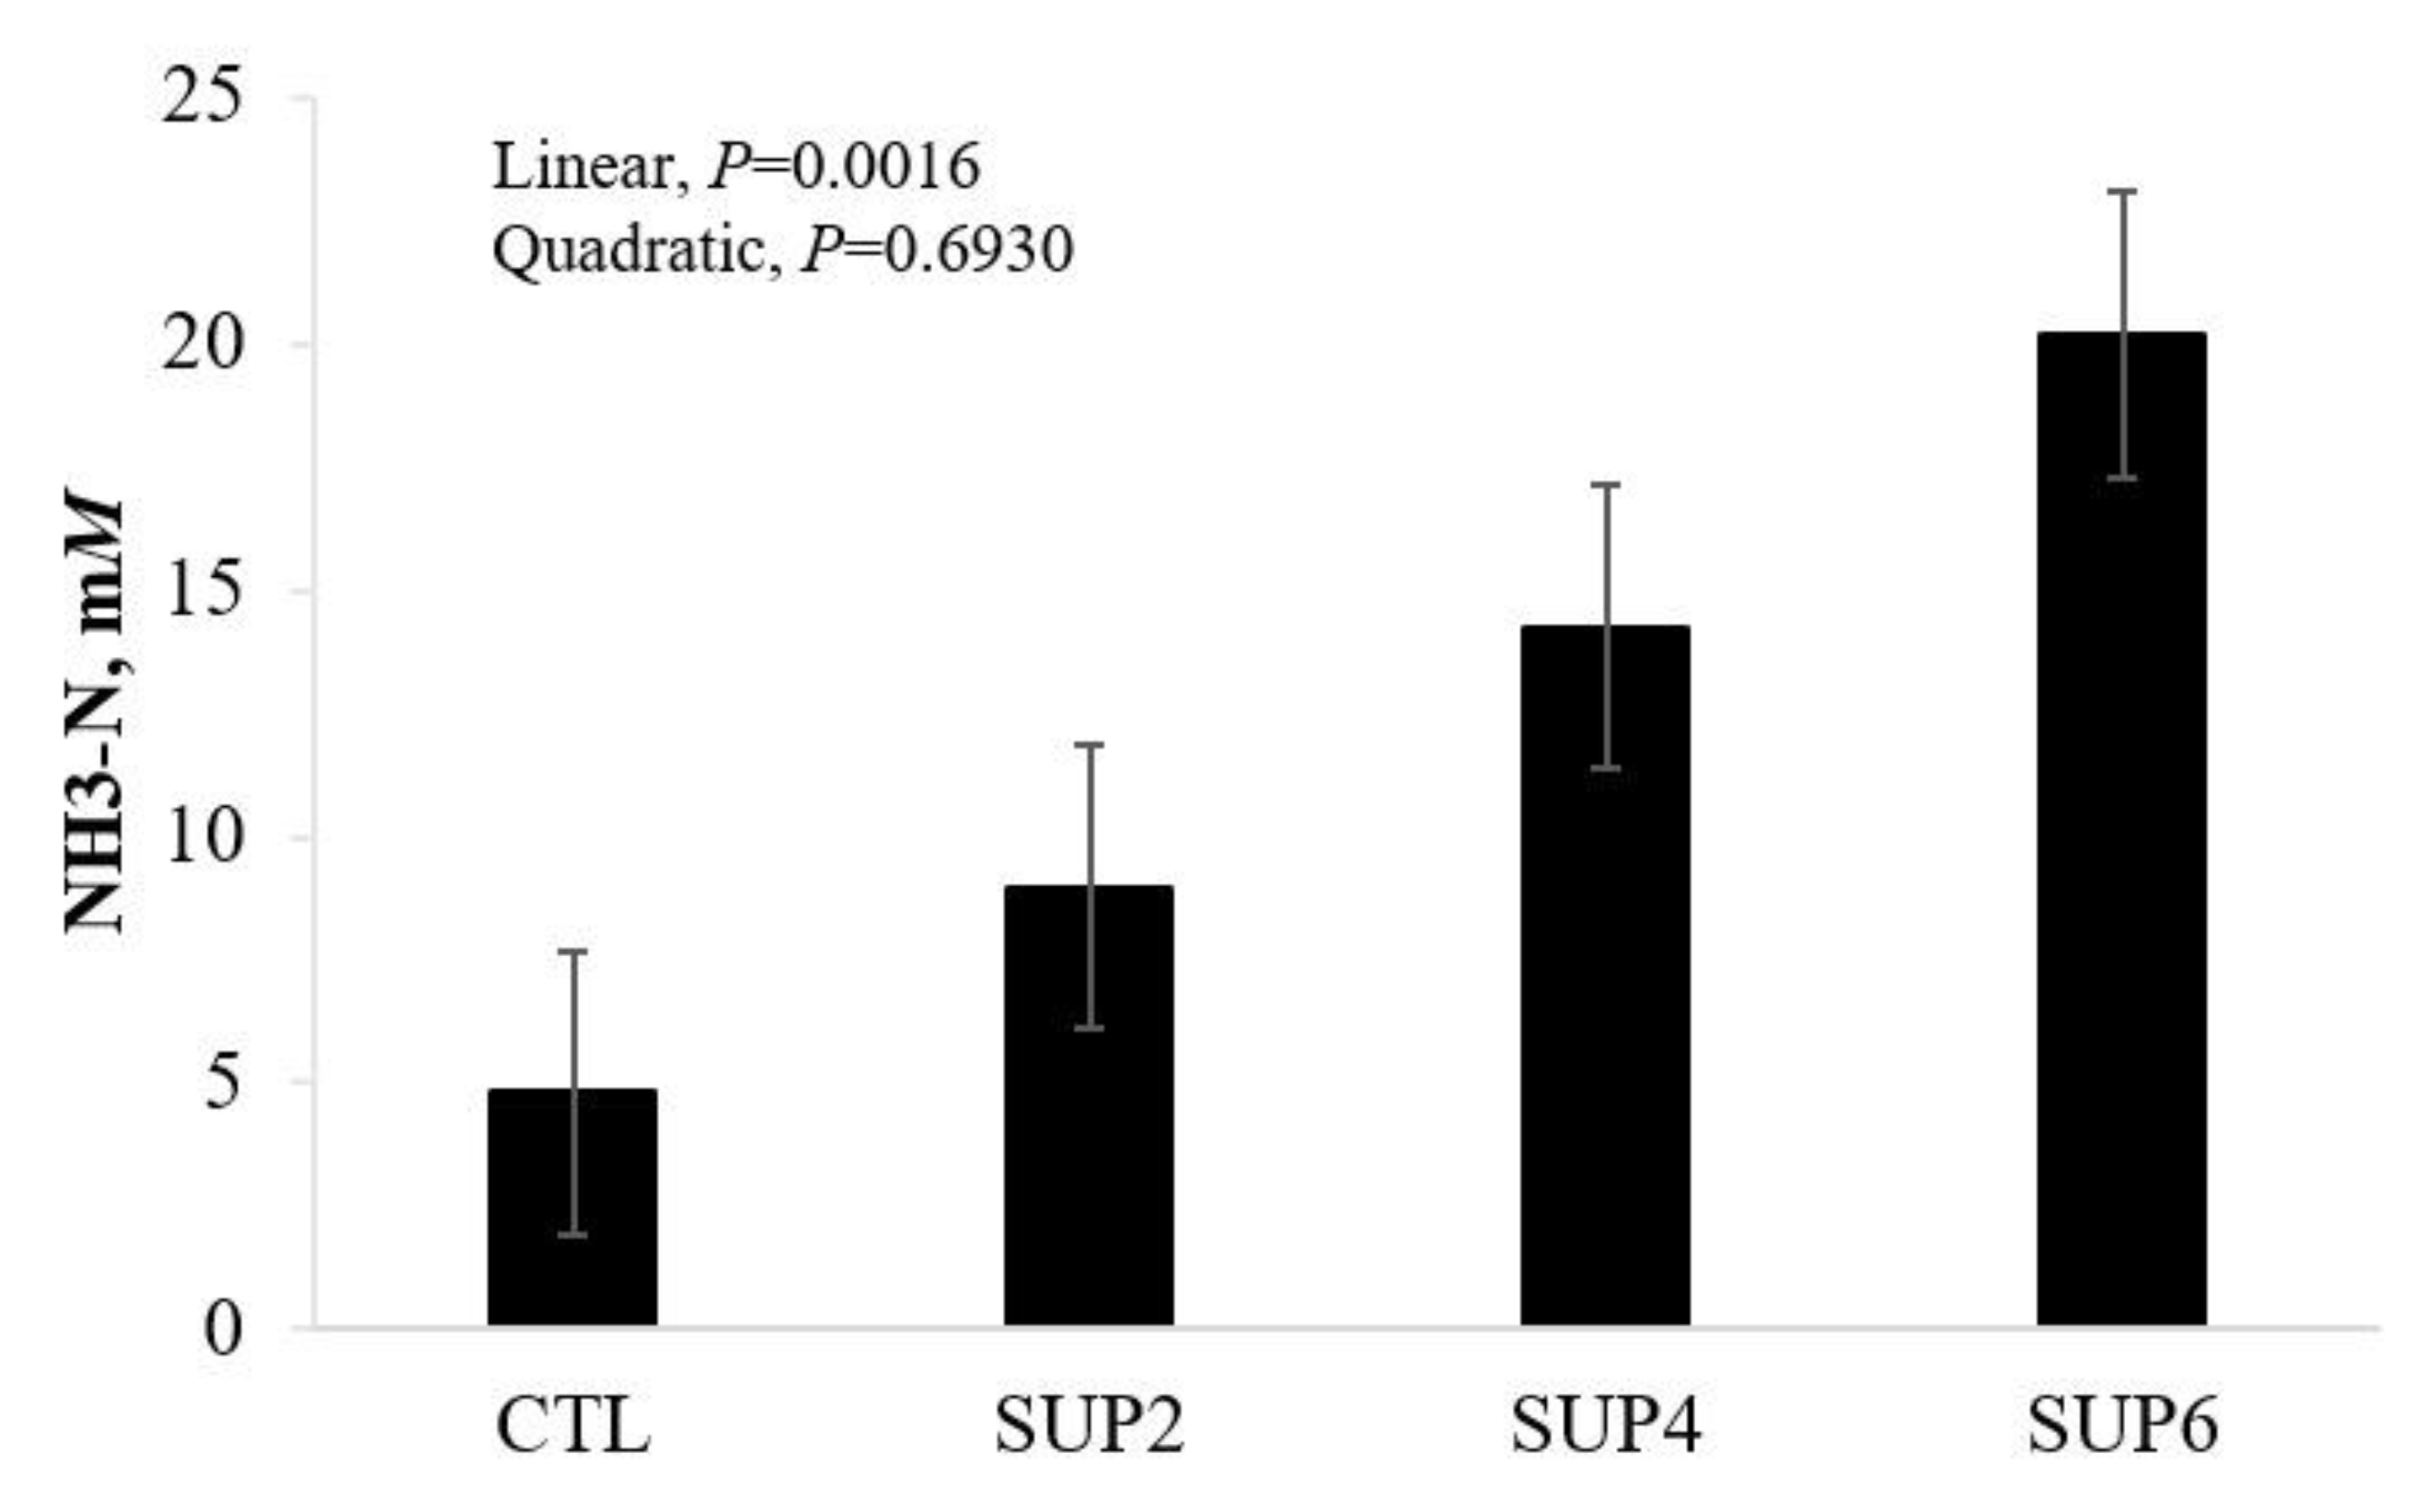
- Ammonia (NH3-N)
- Volatile fatty acids
4. Discussion
4.1. Experiment 1
4.1.1. Diet Intake
4.1.2. Nitrogen Uptake
4.1.3. Digestibility of Diets
4.1.4. Dynamics of In Vivo Ruminal Fermentation Indicators
- In vitro rumen fluid pH
- Ammonia
- Volatile fatty acids (VFA)
4.2. Experiment 2
Dynamics of In Vitro Ruminal Fermentation Indicators
- Gas production
- Ruminal pH
- Ammonia
- Volatile fatty acids
5. Conclusions
Author Contributions
Funding
Institutional Review Board Statement
Informed Consent Statement
Data Availability Statement
Acknowledgments
Conflicts of Interest
References
- Bowman, J.; Sowell, B.F.; Paterson, J. Liquid Supplementation for Ruminants Fed Low-Quality Forage Diets: A Review. Anim. Feed Sci. Technol. 1995, 55, 105–138. [Google Scholar] [CrossRef]
- Figueiras, J.; Detmann, E.; Valadares Filho, S.; Paulino, M.; Batista, E.; Rufino, L.; Valente, T.; Reis, W.; Franco, M. Desempenho Nutricional De Bovinos Em Pastejo Durante O Período De Transição Seca-Águas Recebendo Suplementação Proteica. Arch. Zootec. 2015, 64, 269–276. [Google Scholar] [CrossRef]
- Reis, R.A.; Ruggieri, A.C.; Casagrande, D.R.; Páscoa, A.G. Suplementação Da Dieta De Bovinos De Corte Como Estratégia Do Manejo Das Pastagens. Rev. Bras. Zootec. 2009, 38, 147–159. [Google Scholar] [CrossRef]
- Hersom, M.; Alva, E.; Thrift, T.; Yelich, J. Strategic Supplementation of Beef Cows to Correct for Nutritional Imbalances; University of Florida: Gainesville, FL, USA, 2011; pp. 150–163. [Google Scholar]
- Ciriaco, F.; Henry, D.; Mercadante, V.; Schulmeister, T.; Ruiz-Moreno, M.; Lamb, G.; DiLorenzo, N. Effects of different levels of supplementation of a 50: 50 mixture of molasses: Crude glycerol on performance, bermuda grass hay intake, and nutrient digestibility of beef cattle. J. Anim. Sci. 2015, 93, 2428–2438. [Google Scholar] [CrossRef]
- Soder, K.; Hoffman, K.; Brito, A. Effect of Molasses, Corn Meal, or a Combination of Molasses plus Corn Meal on Ruminal Fermentation of Orchardgrass Pasture During Continuous Culture Fermentation. Prof. Anim. Sci. 2010, 26, 167–174. [Google Scholar] [CrossRef]
- Hemsley, J.; Moir, R. The Influence of Higher Volatile Fattty Acids on the Intake of Urea-Supplemented Low Quality Cereal Hay by sheep. Aust. J. Agric. Res. 1963, 14, 509–517. [Google Scholar] [CrossRef]
- Preston, T.R.; Elias, A.; Willis, M.B.; Sutherland, T.M.; Preston, A.E.T.R. Intensive Beef Production from Molasses and Urea. Nature 1967, 216, 721–722. [Google Scholar] [CrossRef]
- Oba, M. Review: Effects of Feeding Sugars on Productivity of Lactating Dairy Cows. Can. J. Anim. Sci. 2011, 91, 37–46. [Google Scholar] [CrossRef]
- Havekes, C.; Duffield, T.; Carpenter, A.; DeVries, T. Effects of Molasses-Based Liquid Feed Supplementation to A High-Straw Dry Cow Diet on Feed Intake, Health, And Performance of Dairy Cows Across the Transition Period. J. Dairy Sci. 2020, 103, 5070–5089. [Google Scholar] [CrossRef]
- Owens, F.N.; Secrist, D.S.; Hill, W.J.; Gill, D.R. Acidosis in Cattle: A Review. J. Anim. Sci. 1998, 76, 275–286. [Google Scholar] [CrossRef]
- Mordenti, A.L.; Giaretta, E.; Campidonico, L.; Parazza, P.; Formigoni, A. A Review Regarding the Use of Molasses in Animal Nutrition. Animals 2021, 11, 115. [Google Scholar] [CrossRef] [PubMed]
- Aguiar, A.D.; Vendramini, J.M.B.; Arthington, J.D.; Sollenberger, L.E.; DiLorenzo, N.; Hersom, M.J. Performance of Beef Cows and Calves Fed Different Sources of Rumen-Degradable Protein When Grazing Stockpiled Limpograss Pastures. J. Anim. Sci. 2015, 93, 1923–1932. [Google Scholar] [CrossRef] [PubMed]
- Wanapat, M.; Polyorach, S.; Boonnop, K.; Mapato, C.; Cherdthong, A. Effects of Treating Rice Straw with Urea or Urea and Calcium Hydroxide Upon Intake, Digestibility, Rumen Fermentation and Milk Yield of Dairy Cows. Livest. Sci. 2009, 125, 238–243. [Google Scholar] [CrossRef]
- Allison, M.J. Biosynthesis of Amino Acids by Ruminal Microorganisms. J. Anim. Sci. 1969, 29, 797–807. [Google Scholar] [CrossRef]
- Mehrez, A.Z.; Ørskov, E.R.; McDonald, I. Rates of Rumen Fermentation in Relation to Ammonia Concentration. Br. J. Nutr. 1977, 38, 437–443. [Google Scholar] [CrossRef]
- Silva, L.G.; Benedeti, P.D.B.; Paula, E.M.; Malekjahani, F.; Amaral, P.M.; Mariz, L.D.S.; Shenkoru, T.; Faciola, A.P. Effects of Carbohydrate and Nitrogen Supplementation on Fermentation of Cheatgrass (Bromus Tectorum) in a Dual-Flow Continuous Culture System1. J. Anim. Sci. 2017, 95, 1335–1344. [Google Scholar] [CrossRef]
- Malafaia, P.; Cabral, L.D.S.; Vieira, R.A.M.; Costa, R.M.; Carvalho, C.D. Suplementação Protéico-Energética Para Bovinos Criados Em Pastagens: Aspectos Teóricos E Principais Resultados Publicados No Brasil. Livest. Res. Rural. Dev. 2003, 15, 1–32. [Google Scholar]
- Moretti, M.H.; Reis, R.A.; Casagrande, D.R.; Ruggieri, A.C.; Oliveira, R.V.; Berchielli, T.T. Suplementação Protéica Energética No Desempenho De Novilhas Em Pastejo Durante a Fase De Terminação. Ciência E Agrotecnologia 2011, 35, 606–612. [Google Scholar] [CrossRef]
- Krizsan, S.; Huhtanen, P. Effect of Diet Composition and Incubation Time on Feed Indigestible Neutral Detergent Fiber Concentration in Dairy Cows. J. Dairy Sci. 2013, 96, 1715–1726. [Google Scholar] [CrossRef]
- Van Soest, P.J.; Robertson, J.B.; Lewis, B.A. Methods for dietary fiber, neutral detergent fiber, and nonstarch polysaccharides in relation to animal nutrition. J. Dairy Sci. 1991, 74, 3583–3597. [Google Scholar] [CrossRef]
- Association of official agricultural chemists. Official Methods of Analysis; AOAC: Washington, DC, USA, 1995. [Google Scholar]
- Broderick, G.A.; Kang, J.H. Automated Simultaneous Determination of Ammonia and Total Amino Acids in Ruminal Fluid and In Vitro Media. J. Dairy Sci. 1980, 63, 64–75. [Google Scholar] [CrossRef]
- McDougall, E. Studies on Ruminant Saliva. 1. The Composition and Output of Sheep’s Saliva. Biochem. J. 1948, 43, 99. [Google Scholar] [CrossRef] [PubMed]
- Tilley, J.M.A.; Terry, R.A. A Two-Stage Technique for the In Vitro Digestion of Forage Crops. J. Br. Grassl. Soc. 1963, 18, 104–111. [Google Scholar] [CrossRef]
- Holden, L. Comparison of Methods of In Vitro Dry Matter Digestibility for Ten Feeds. J. Dairy Sci. 1999, 82, 1791–1794. [Google Scholar] [CrossRef]
- Mould, F.; Ørskov, E.; Mann, S. Associative Effects of Mixed Feeds. I. Effects of Type and Level of Supplementation and the Influence of the Rumen Fluid Ph on Cellulolysis In Vivo And Dry Matter Digestion of Various Roughages. Anim. Feed Sci. Technol. 1983, 10, 15–30. [Google Scholar] [CrossRef]
- Stierwalt, M.; Blalock, H.; Felix, T. Effects of the Interaction of Forage and Supplement Type on Digestibility and Ruminal Fermentation in Beef Cattle. J. Anim. Sci. 2017, 95, 892–900. [Google Scholar] [CrossRef] [PubMed]
- Kozloski, G.V. Bioquímica Dos Ruminantes; Fundação De Apoio a Tecnologia E Ciencia-Editora UFSM: Santa Maria, RS, Brazil, 2017. [Google Scholar]
- Huber, J.; Kung Jr, L. Protein and Nonprotein Nitrogen Utilization in Dairy Cattle. J. Dairy Sci. 1981, 64, 1170–1195. [Google Scholar] [CrossRef]
- Oliveira, A.S.d.; Detmann, E.; Campos, J.M.d.S.; Pina, D.d.S.; Souza, S.M.d.; Costa, M.G. Meta-Análise Do Impacto Da Fibra Em Detergente Neutro Sobre O Consumo, A Digestibilidade E O Desempenho De Vacas Leiteiras Em Lactação. Rev. Bras. Zootec. 2011, 40, 1587–1595. [Google Scholar] [CrossRef]
- Van Soest, P.J. Nutritional Ecology of the Ruminant, 2nd ed.; Cornell University Press: Ithaca, NY, USA, 1994; pp. 334–336. [Google Scholar] [CrossRef]
- Lund, P.; Weisbjerg, M.; Hvelplund, T. Digestible NDF is selectively retained in the rumen of dairy cows compared to indigestible NDF. Anim. Feed Sci. Technol. 2007, 134, 1–17. [Google Scholar] [CrossRef]
- Dutra, A.R.; Queiroz, A.C.d.; Pereira, J.C.; Valadares Filho, S.d.C.; Thiébaut, J.T.L.; Matos, F.N.; Ribeiro, C. Efeitos Dos Níveis De Fibra E Das Fontes De Proteínas Sobre a Síntese De Compostos Nitrogenados Microbianos Em Novilhos. Rev. Bras. Zootec. 1997, 26, 797–805. [Google Scholar]
- Tamminga, S.; Schulze, H.; Van Bruchem, J.; Huisman, J. The Nutritional Significance of Endogenous N-Losses Along the Gastrointestinal Tract of Farm Animals. Arch. Tierernahr. 1995, 48, 9–22. [Google Scholar] [CrossRef] [PubMed]
- Bristow, A.W.; Whitehead, D.C.; E Cockburn, J. Nitrogenous Constituents in the Urine of Cattle, Sheep and Goats. J. Sci. Food Agric. 1992, 59, 387–394. [Google Scholar] [CrossRef]
- Owen, E.C.; Smith, J.A.B.; Wright, N.C. Urea as a Partial Protein Substitute in the Feeding of Dairy Cattle. Biochem. J. 1943, 37, 44–53. [Google Scholar] [CrossRef]
- Council, N.R. Ruminant Nitrogen Usage; National Academies Press: Washington, DC, USA, 1985. [Google Scholar]
- Voigt, J.; Krawielitzki, K.; Zwierz, P.-M.; Prym, R.; Weissbach, F.; Krawielitzki, R. Digestibility of Nitrogen in Sheep Fed Heat Damaged Protein. Livest. Prod. Sci. 1994, 39, 93–96. [Google Scholar] [CrossRef]
- Heldt, J.S.; Cochran, R.C.; Stokka, G.L.; Farmer, C.G.; Mathis, C.P.; Titgemeyer, E.C.; Nagaraja, T.G. Effects of Different Supplemental Sugars and Starch Fed in Combination with Degradable Intake Protein on Low-Quality Forage Use by Beef Steers. J. Anim. Sci. 1999, 77, 2793–2802. [Google Scholar] [CrossRef]
- Russell, J.B. Strategies That Ruminal Bacteria Use to Handle Excess Carbohydrate. J. Anim. Sci. 1998, 76, 1955–1963. [Google Scholar] [CrossRef]
- Osuji, P.; Khalili, H. The Effect of Replacement of Wheat Bran by Graded Levels of Molasses on Feed Intake, Organic Matter Digestion, Rumen Fermentation and Nitrogen Utilization in Crossbred (Bos Taurus × Bos Indicus) Steers Fed Native Grass Hay. Anim. Feed Sci. Technol. 1994, 48, 153–163. [Google Scholar] [CrossRef]
- Satter, L.D.; Slyter, L.L. Effect of Ammonia Concentration on Rumen Microbial Protein Production In Vitro. Br. J. Nutr. 1974, 32, 199–208. [Google Scholar] [CrossRef]
- Henry, D.D.; Ciriaco, F.M.; Araujo, R.C.; Fontes, P.L.; Oosthuizen, N.; Mejia-Turcios, S.E.; Garcia-Ascolani, M.E.; Rostoll-Cangiano, L.; Schulmeister, T.M.; Dubeux Jr, J.C. Effects of bismuth subsalicylate and encapsulated calcium ammonium nitrate on ruminal fermentation of beef cattle. J. Anim. Sci. 2020, 98, skaa199. [Google Scholar] [CrossRef]
- Tuyen, D.V.; Tolosa, X.M.; Poppi, D.P.; McLennan, S.R. Effect of Varying the Proportion of Molasses in the Diet on Intake, Digestion and Microbial Protein Production by Steers. Anim. Prod. Sci. 2015, 55, 17–26. [Google Scholar] [CrossRef]
- Ciriaco, F.M.; Henry, D.D.; Mercadante, V.R.G.; Schulmeister, T.M.; Ruiz-Moreno, M.; Lamb, G.C.; DiLorenzo, N. Effects of Molasses and Crude Glycerol Combined in A Liquid Supplement on Ruminal Fermentation in Beef Steers Consuming Bermudagrass hay12. J. Anim. Sci. 2016, 94, 3851–3863. [Google Scholar] [CrossRef] [PubMed]
- Chen, S.; Paengkoum, P.; Xia, X.; Na-Lumpang, P. Effects of Dietary Protein on Ruminal Fermentation, Nitrogen Utilization and Crude Protein Maintenance in Growing Thai-indigenous Beef Cattle Fed Rice Straw as Roughage. J. Anim. Veter. Adv. 2010, 9, 2396–2400. [Google Scholar] [CrossRef]
- Janssen, P.H. Influence of Hydrogen on Rumen Methane Formation and Fermentation Balances Through Microbial Growth Kinetics and Fermentation Thermodynamics. Anim. Feed Sci. Technol. 2010, 160, 1–22. [Google Scholar] [CrossRef]
- Khattab, I.; Salem, A.; Abdel-Wahed, A.; Kewan, K. Effects of Urea Supplementation on Nutrient Digestibility, Nitrogen Utilisation and Rumen Fermentation in Sheep Fed Diets Containing Dates. Livest. Sci. 2013, 155, 223–229. [Google Scholar] [CrossRef]
- Vargas, L.H.; Lana, R.d.P.; Jham, G.N.; Santos, F.L.; Queiroz, A.C.d.; Mancio, A.B. Adição De Lipídios Na Ração De Vacas Leiteiras: Parâmetros Fermentativos Ruminais, Produção E Composição Do Leite. Rev. Bras. Zootec. 2002, 31, 522–529. [Google Scholar] [CrossRef]
- Ferraro, S.; Mendoza, G.; Miranda, L.; Gutiérrez, C. In Vitro Gas Production and Ruminal Fermentation of Glycerol, Propylene Glycol and Molasses. Anim. Feed Sci. Technol. 2009, 154, 112–118. [Google Scholar] [CrossRef]
- Getachew, G.; Blümmel, M.; Makkar, H.; Becker, K. In Vitro Gas Measuring Techniques for Assessment of Nutritional Quality of Feeds: A Review. Anim. Feed Sci. Technol. 1998, 72, 261–281. [Google Scholar] [CrossRef]
- Ouellet, D.; Valkeners, D.; Holtrop, G.; Lobley, G.; Lapierre, H. In Contribution of Endogenous Nitrogen Secretions and Urea Recycling to Nitrogen Metabolism. In Proceedings of the 2007 Cornell Nutrition Conference for Feed Manufacturers, Syracuse, Italy, 23–25 October 2007. [Google Scholar]
- Zinn, R.A.; Barrajas, R.; Montano, M.; Ware, R.A. Influence of Dietary Urea Level on Digestive Function and Growth Performance of Cattle Fed Steam-Flaked Barley-Based Finishing Diets. J. Anim. Sci. 2003, 81, 2383–2389. [Google Scholar] [CrossRef]
- Ceconi, I.; Ruiz-Moreno, M.J.; DiLorenzo, N.; DiCostanzo, A.; Crawford, G.I. Effect of Urea Inclusion in Diets Containing Corn Dried Distillers Grains on Feedlot Cattle Performance, Carcass Characteristics, Ruminal Fermentation, Total Tract Digestibility, And Purine Derivatives-To-Creatinine Index. J. Anim. Sci. 2015, 93, 357–369. [Google Scholar] [CrossRef]
- Kazemi-Bonchenari, M.; Rezayazdi, K.; Nikkhah, A.; Kohram, H.; Dehghan-Banadaky, M. The Effects of Different Levels of Sodium Caseinate on Rumen Fermentation Pattern, Digestibility and Microbial Protein Synthesis of Holstein Dairy Cows. Afr. J. Biotechnol. 2010, 9, 1990–1998. [Google Scholar] [CrossRef]
- Giang, N.T.T.; Wanapat, M.; Phesatcha, K.; Kang, S. Level of Leucaena Leucocephala Silage Feeding on Intake, Rumen Fermentation, And Nutrient Digestibility in Dairy Steers. Trop. Anim. Heal. Prod. 2016, 48, 1057–1064. [Google Scholar] [CrossRef] [PubMed]
- Bond, J.; Rumsey, T.S. Liquid Molasses-Urea or Biuret (NPN) Feed Supplements for Beef Cattle: Wintering Performance, Ruminal Differences and Feeding Patterns. J. Anim. Sci. 1973, 37, 593–598. [Google Scholar] [CrossRef]
- Leng, R.; Preston, T. Sugar Cane for Cattle Production: Present Constraints, Perspectives and Research Priorities. Trop. Anim. Prod. 1976, 1, 1–22. [Google Scholar]
- Marty, R.; Preston, T. Molar Proportions of the Short Chain Volatile Fatty Acids (Vfa) Produced in the Rumen of Cattle Given High-Molasses Diets. Rev. Cuba. Cienc. Agric. 1970, 4, 183–186. [Google Scholar]
- Olbrich, S.E.; Wayman, O. Effect of Feeding Raw Sugar on Growth, Performance and Rumen Fluid Parameters of Fattening Beef Cattle. J. Anim. Sci. 1972, 34, 820–825. [Google Scholar] [CrossRef]


| Item | Hay | Liquid Supplement 2 |
|---|---|---|
| DM% | 92.9 | 68.8 |
| OM, %DM | 64.5 | 57.9 |
| CP, %DM | 3.9 | 45.5 |
| NDF, %DM | 79.1 | - |
| ADF, %DM | 42.6 | - |
| TDN, %DM | 54 | 73 |
| Calcium, %DM | 0.2 | 1.30 |
| Phosphorus, %DM | 0.17 | 1.56 |
| Magnesium, %DM | 0.13 | 0.47 |
| Potassium, %DM | 0.68 | 4.28 |
| Sodium, %DM | 0.042 | 0.136 |
| Sulfur,%DM | 0.14 | 1.61 |
| Treatments 1 | Contrast p-Value 3 | |||||||
|---|---|---|---|---|---|---|---|---|
| CTL | SUP2 | SUP4 | SUP6 | SEM 2 | TRT | L | Q | |
| 4-day Intake, kg d−1 | ||||||||
| DM | ||||||||
| Hay | 3.85 § | 3.90 | 2.80 | 4.90 | 1.337 | 0.2799 | 0.541 | 0.167 |
| Liquid supplementation | 0 | 0.61 c | 1.16 b | 1.52 a | 0.088 | <0.0001 | <0.0001 | 0.034 |
| Total | 3.85 | 4.51 | 3.96 | 6.42 | 1.407 | 0.093 | 0.044 | 0.229 |
| OM | ||||||||
| Hay | 3.75 | 3.79 | 2.72 | 4.76 | 1.302 | 0.280 | 0.546 | 0.167 |
| Liquid supplementation | 0 | 0.51 c | 0.97 b | 1.27 a | 0.074 | <0.0001 | <0.0001 | 0.034 |
| Total | 3.75 | 4.3 | 3.69 | 6.03 | 1.361 | 0.121 | 0.068 | 0.219 |
| CP | 0.08 d | 0.38 c | 0.62 b | 0.83 a | 0.039 | <0.0001 | <0.0001 | 0.160 |
| NDF | 3.24 b | 3.77 ab | 3.30 b | 5.26 a | 0.755 | 0.023 | 0.016 | 0.126 |
| Treatments 1 | Contrast p-Value 3 | |||||||
|---|---|---|---|---|---|---|---|---|
| CTL | SUP2 | SUP4 | SUP6 | SEM 2 | TRT | L | Q | |
| δ15N, ‰ | ||||||||
| Feces | 5.8 § | 6.3 | 6.6 | 6.3 | 0.19 | 0.069 | 0.064 | 0.063 |
| Hay | 4.3 | 4.3 | 4.8 | 4.6 | 0.17 | 0.152 | 0.128 | 0.626 |
| Liquid supplementation | 0.8 | 0.8 | 0.8 | 0.8 | -- | -- | -- | -- |
| % contribution of dietary N in feces | ||||||||
| Hay | 100 a | 23.3 b | 10.4 c | 11.5 c | 2.41 | <0.0001 | <0.0001 | <0.0001 |
| Liquid supplementation | 0 c | 76.7 b | 89.6 a | 88.5 a | 2.41 | <0.0001 | <0.0001 | <0.0001 |
| Treatments 1 | Contrast p-Value 3 | |||||||
|---|---|---|---|---|---|---|---|---|
| CTL | SUP2 | SUP4 | SUP6 | SEM 2 | TRT | L | Q | |
| Digestibility, % | ||||||||
| DM | 28.5 § | 33.4 | 28.5 | 25.2 | 2.08 | 0.087 | 0.135 | 0.064 |
| OM | 34.6 | 38.9 | 35.7 | 31.2 | 1.93 | 0.085 | 0.141 | 0.035 |
| CP | 59.2 b | 92.1 a | 93.8 a | 95.0 a | 3.59 | <0.0001 | <0.0001 | 0.0003 |
| NDF | 41.6 | 45.7 | 44.7 | 39.7 | 1.58 | 0.056 | 0.358 | 0.009 |
| ADF | 31.7 ab | 36.4 a | 35.3 a | 26.3 b | 1.77 | 0.004 | 0.043 | 0.001 |
| Item | Treatament 1 | Contrast p-Value 3 | ||||||||
|---|---|---|---|---|---|---|---|---|---|---|
| CTL | SUP2 | SUP4 | SUP6 | SEM 2 | TRT | T | TRT × T | L | Q | |
| VFA, mol/100 mol | ||||||||||
| Acetate | 71.10 | 70.77 | 71.10 | 70.65 | 0.262 | 0.572 | 0.743 | 0.145 | 0.439 | 0.827 |
| Propionate | 16.31 | 16.66 | 16.45 | 16.83 | 0.160 | 0.219 | 0.697 | 0.025 | 0.114 | 0.937 |
| Isobutyrate | 0.56 | 0.46 | 0.45 | 0.74 | 0.074 | 0.115 | 0.004 | 0.021 | 0.173 | 0.033 |
| Butyrate | 10.21 | 9.90 | 9.85 | 9.61 | 0.218 | 0.380 | 0.165 | 0.916 | 0.114 | 0.878 |
| Isovalerate | 0.81 b,§ | 0.93 ab | 0.95 a | 0.91 ab | 0.028 | 0.031 | 0.004 | 0.005 | 0.044 | 0.027 |
| Valerate | 0.59 | 0.73 | 0.70 | 0.77 | 0.041 | 0.088 | 0.999 | 0.212 | 0.034 | 0.496 |
| Total VFA, mM | 84.70 | 93.26 | 91.32 | 95.65 | 3.207 | 0.183 | 0.274 | 0.431 | 0.079 | 0.531 |
| Item | Treatment 1 | Contrast p-Value 3 | ||||||
|---|---|---|---|---|---|---|---|---|
| CTL | SUP2 | SUP4 | SUP6 | SEM 2 | TRT | L | Q | |
| VFA, mol/100 mol | ||||||||
| Acetate | 69.59 § | 69.38 | 68.60 | 68.33 | 0.407 | 0.054 | 0.011 | 0.928 |
| Propionate | 20.52 b | 20.82 b | 21.59 ab | 22.10 a | 0.353 | 0.013 | 0.002 | 0.684 |
| Isobutyrate | 0.65 a | 0.63 a | 0.62 a | 0.58 b | 0.013 | 0.001 | 0.0002 | 0.107 |
| Butyrate | 7.35 | 7.30 | 7.40 | 7.28 | 0.053 | 0.104 | 0.369 | 0.320 |
| Isovalerate | 1.11 a | 1.11 a | 1.06 a | 0.95 b | 0.002 | 0.002 | 0.001 | 0.016 |
| Valerate | 0.76 | 0.75 | 0.73 | 0.76 | 0.022 | 0.765 | 0.766 | 0.427 |
| Total VFA, mM | 88.42 b | 90.71 b | 101.88 a | 105.24 a | 2.213 | 0.003 | 0.001 | 0.801 |
Publisher’s Note: MDPI stays neutral with regard to jurisdictional claims in published maps and institutional affiliations. |
© 2022 by the authors. Licensee MDPI, Basel, Switzerland. This article is an open access article distributed under the terms and conditions of the Creative Commons Attribution (CC BY) license (https://creativecommons.org/licenses/by/4.0/).
Share and Cite
Abreu, D.; Dubeux, J.C.B., Jr.; Queiroz, L.D.; Jaramillo, D.; Da Silva Santos, E.R.; van Cleef, F.; Vela-Garcia, C.; DiLorenzo, N.; Ruiz-Moreno, M. Supplementation of Molasses-Based Liquid Feed for Cattle Fed on Limpograss Hay. Animals 2022, 12, 2227. https://doi.org/10.3390/ani12172227
Abreu D, Dubeux JCB Jr., Queiroz LD, Jaramillo D, Da Silva Santos ER, van Cleef F, Vela-Garcia C, DiLorenzo N, Ruiz-Moreno M. Supplementation of Molasses-Based Liquid Feed for Cattle Fed on Limpograss Hay. Animals. 2022; 12(17):2227. https://doi.org/10.3390/ani12172227
Chicago/Turabian StyleAbreu, Daciele, José C. B. Dubeux, Jr., Luana Dantas Queiroz, David Jaramillo, Erick Rodrigo Da Silva Santos, Flávia van Cleef, Carlos Vela-Garcia, Nicolas DiLorenzo, and Martin Ruiz-Moreno. 2022. "Supplementation of Molasses-Based Liquid Feed for Cattle Fed on Limpograss Hay" Animals 12, no. 17: 2227. https://doi.org/10.3390/ani12172227
APA StyleAbreu, D., Dubeux, J. C. B., Jr., Queiroz, L. D., Jaramillo, D., Da Silva Santos, E. R., van Cleef, F., Vela-Garcia, C., DiLorenzo, N., & Ruiz-Moreno, M. (2022). Supplementation of Molasses-Based Liquid Feed for Cattle Fed on Limpograss Hay. Animals, 12(17), 2227. https://doi.org/10.3390/ani12172227