
Hoof Impact and Foot-Off Accelerations in Galloping Thoroughbred Racehorses Trialling Eight Shoe–Surface Combinations

 ,
,
Abstract
:Simple Summary
Abstract
1. Introduction
2. Materials and Methods
2.1. Ethics
2.2. Horse and Jockey Participants
2.3. Trial Conditions
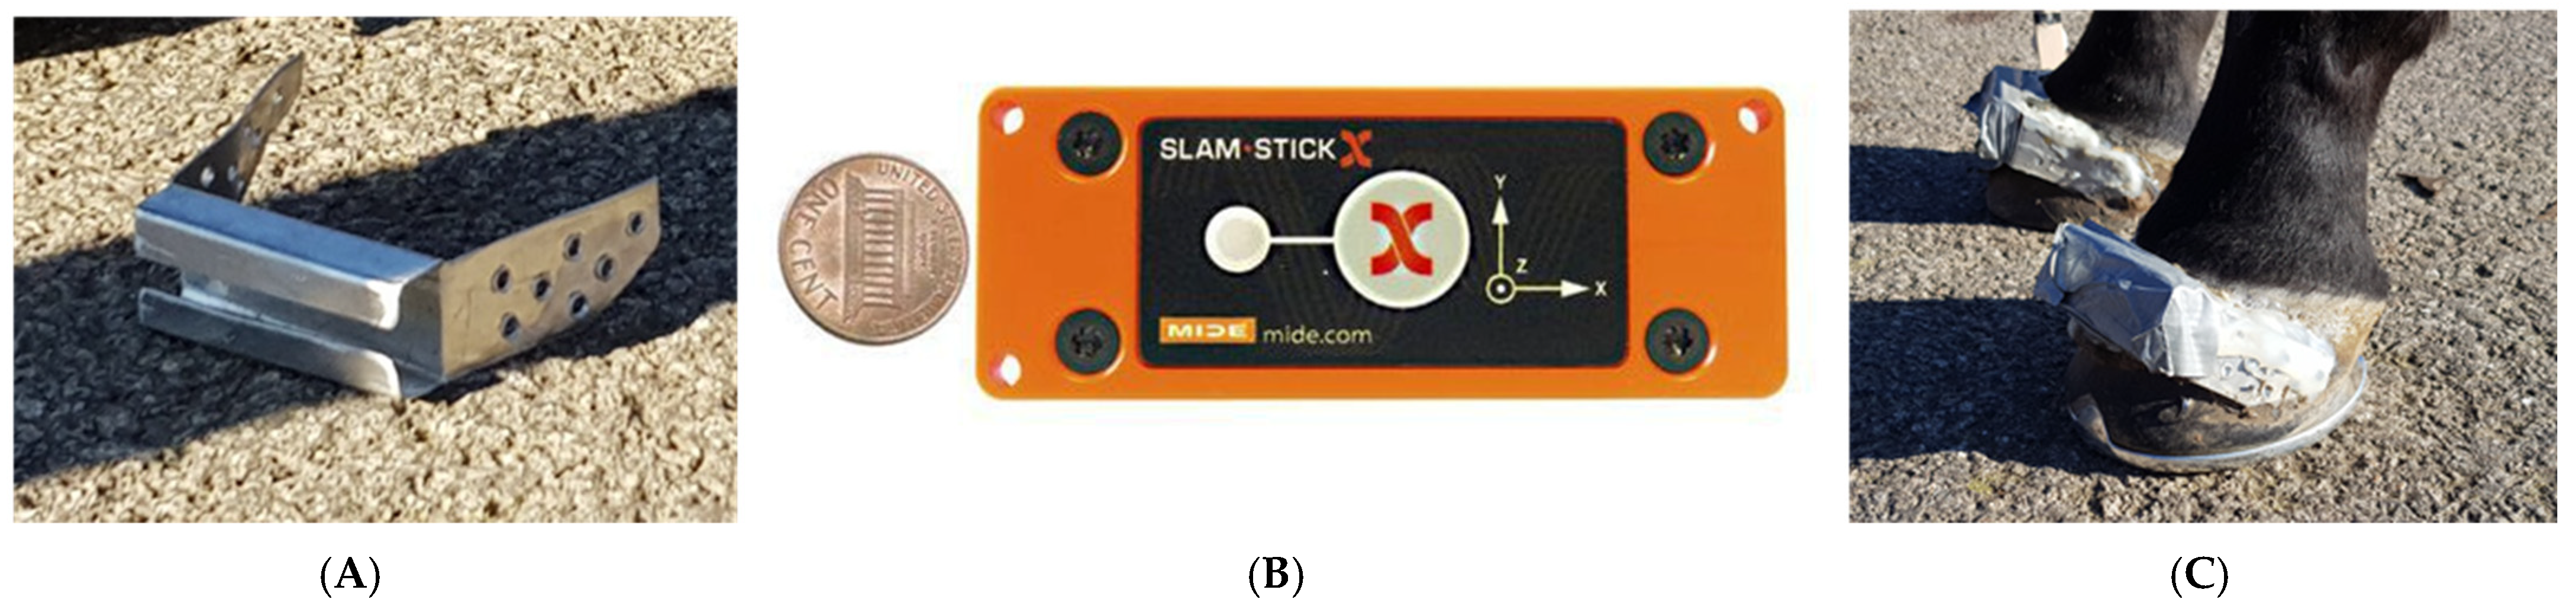
2.4. Equipment
2.5. Data Processing
2.6. Statistics
3. Results
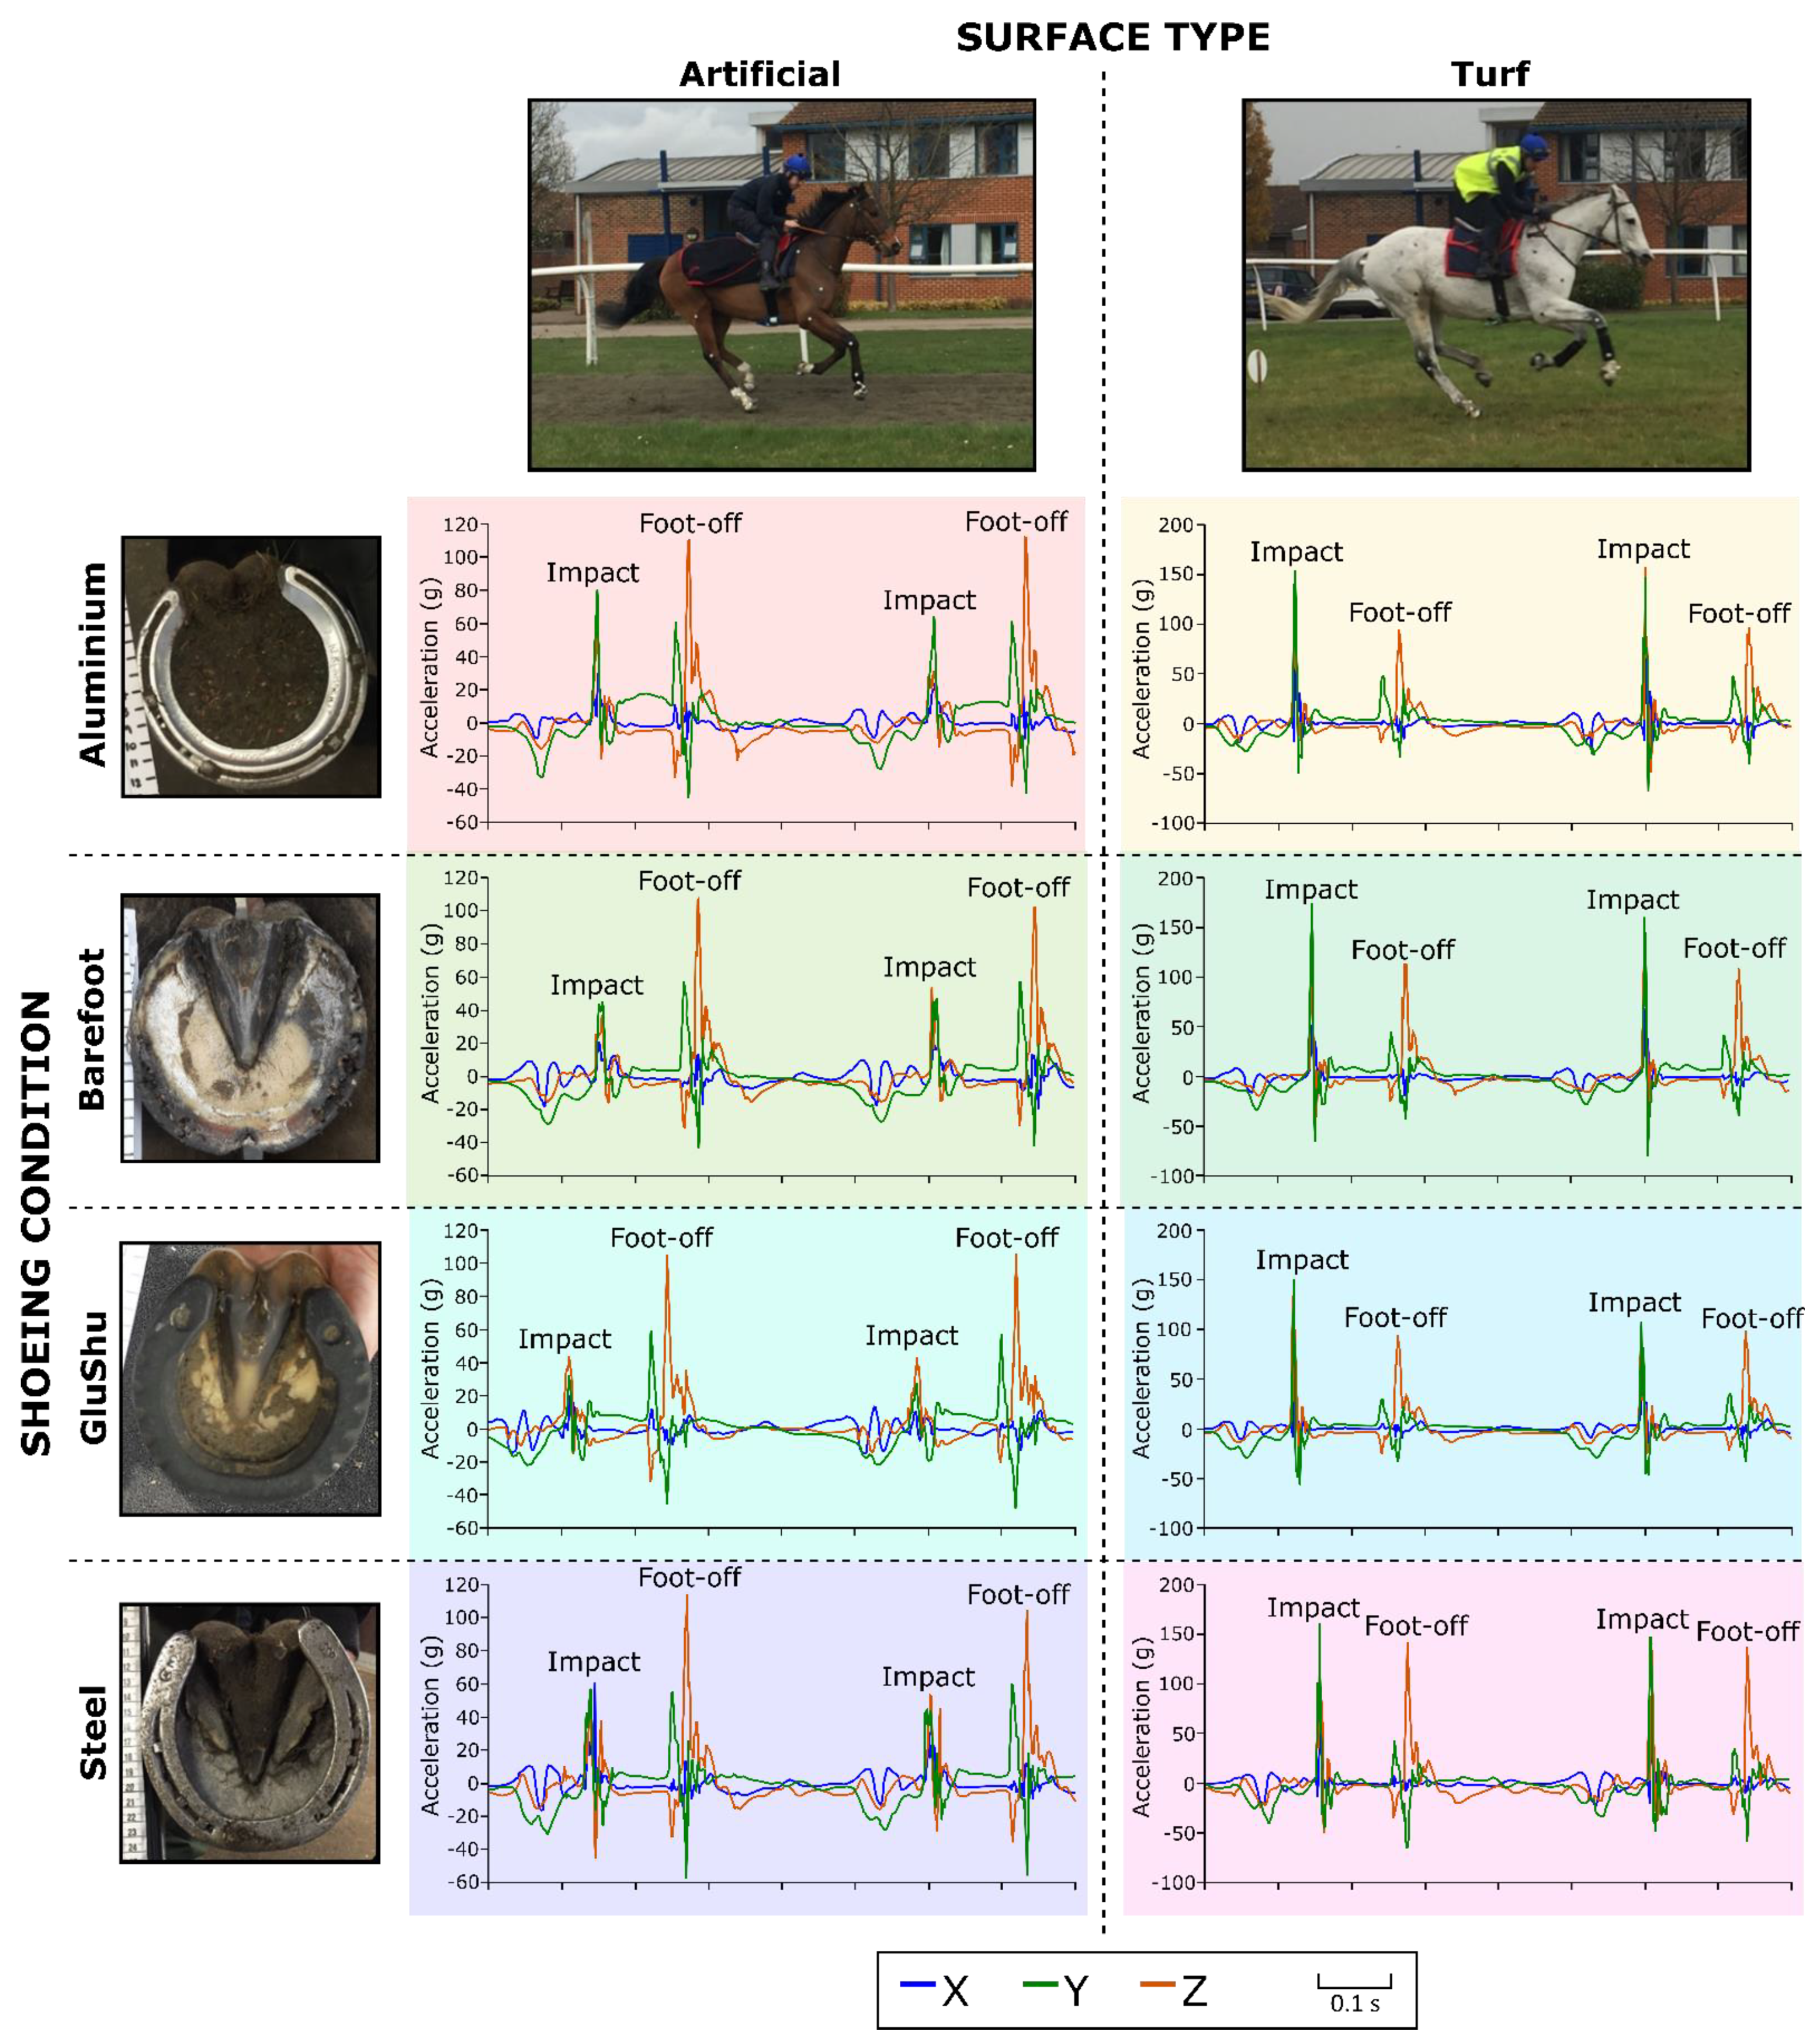
3.1. Overview
3.2. Forelimbs
3.2.1. Impact
3.2.2. Foot-Off
3.3. Hindlimbs
3.3.1. Impact
3.3.2. Foot-Off
3.4. Summary of Shoeing Condition Effect
3.4.1. Impact
3.4.2. Foot-Off
3.5. Summary of Surface Effect
3.5.1. Impact
3.5.2. Foot-Off
3.6. Shoe–Surface Interactions
3.6.1. Impact
3.6.2. Foot-Off
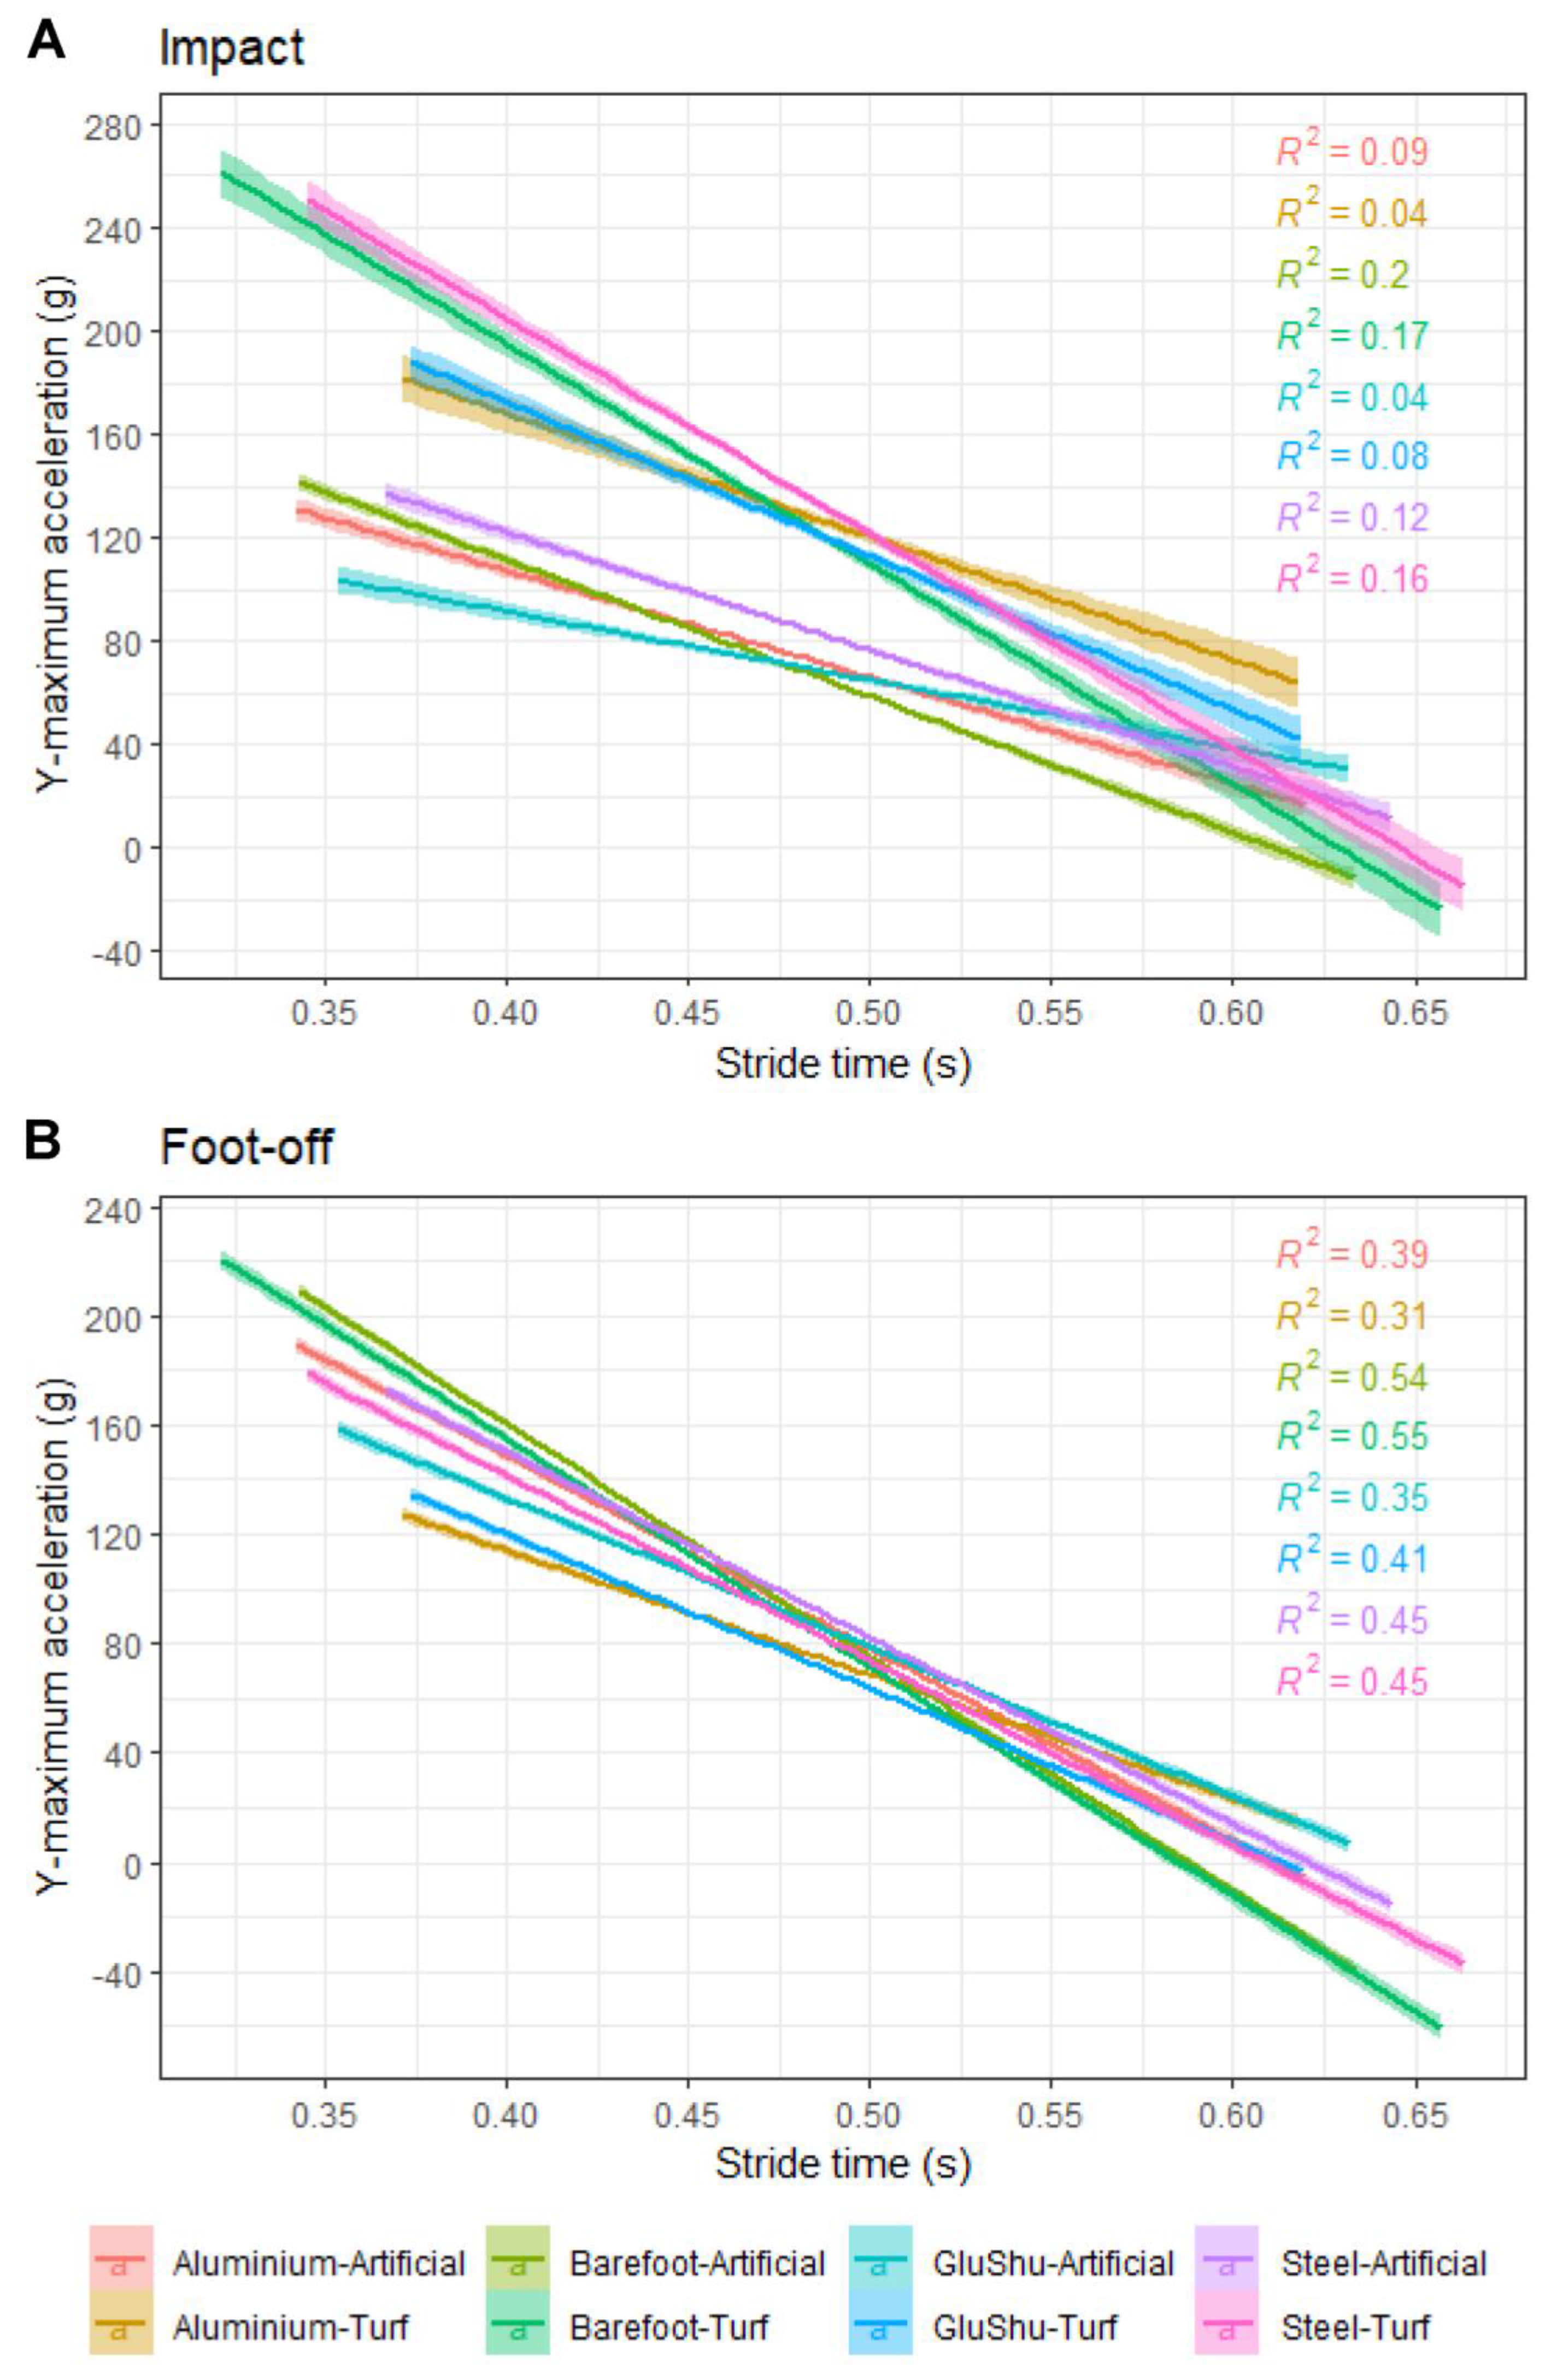
3.7. Stride Time
4. Discussion
4.1. Impact
4.2. Foot-Off
5. Conclusions
Supplementary Materials
Author Contributions
Funding
Institutional Review Board Statement
Data Availability Statement
Acknowledgments
Conflicts of Interest
Appendix A. Supplementary Information
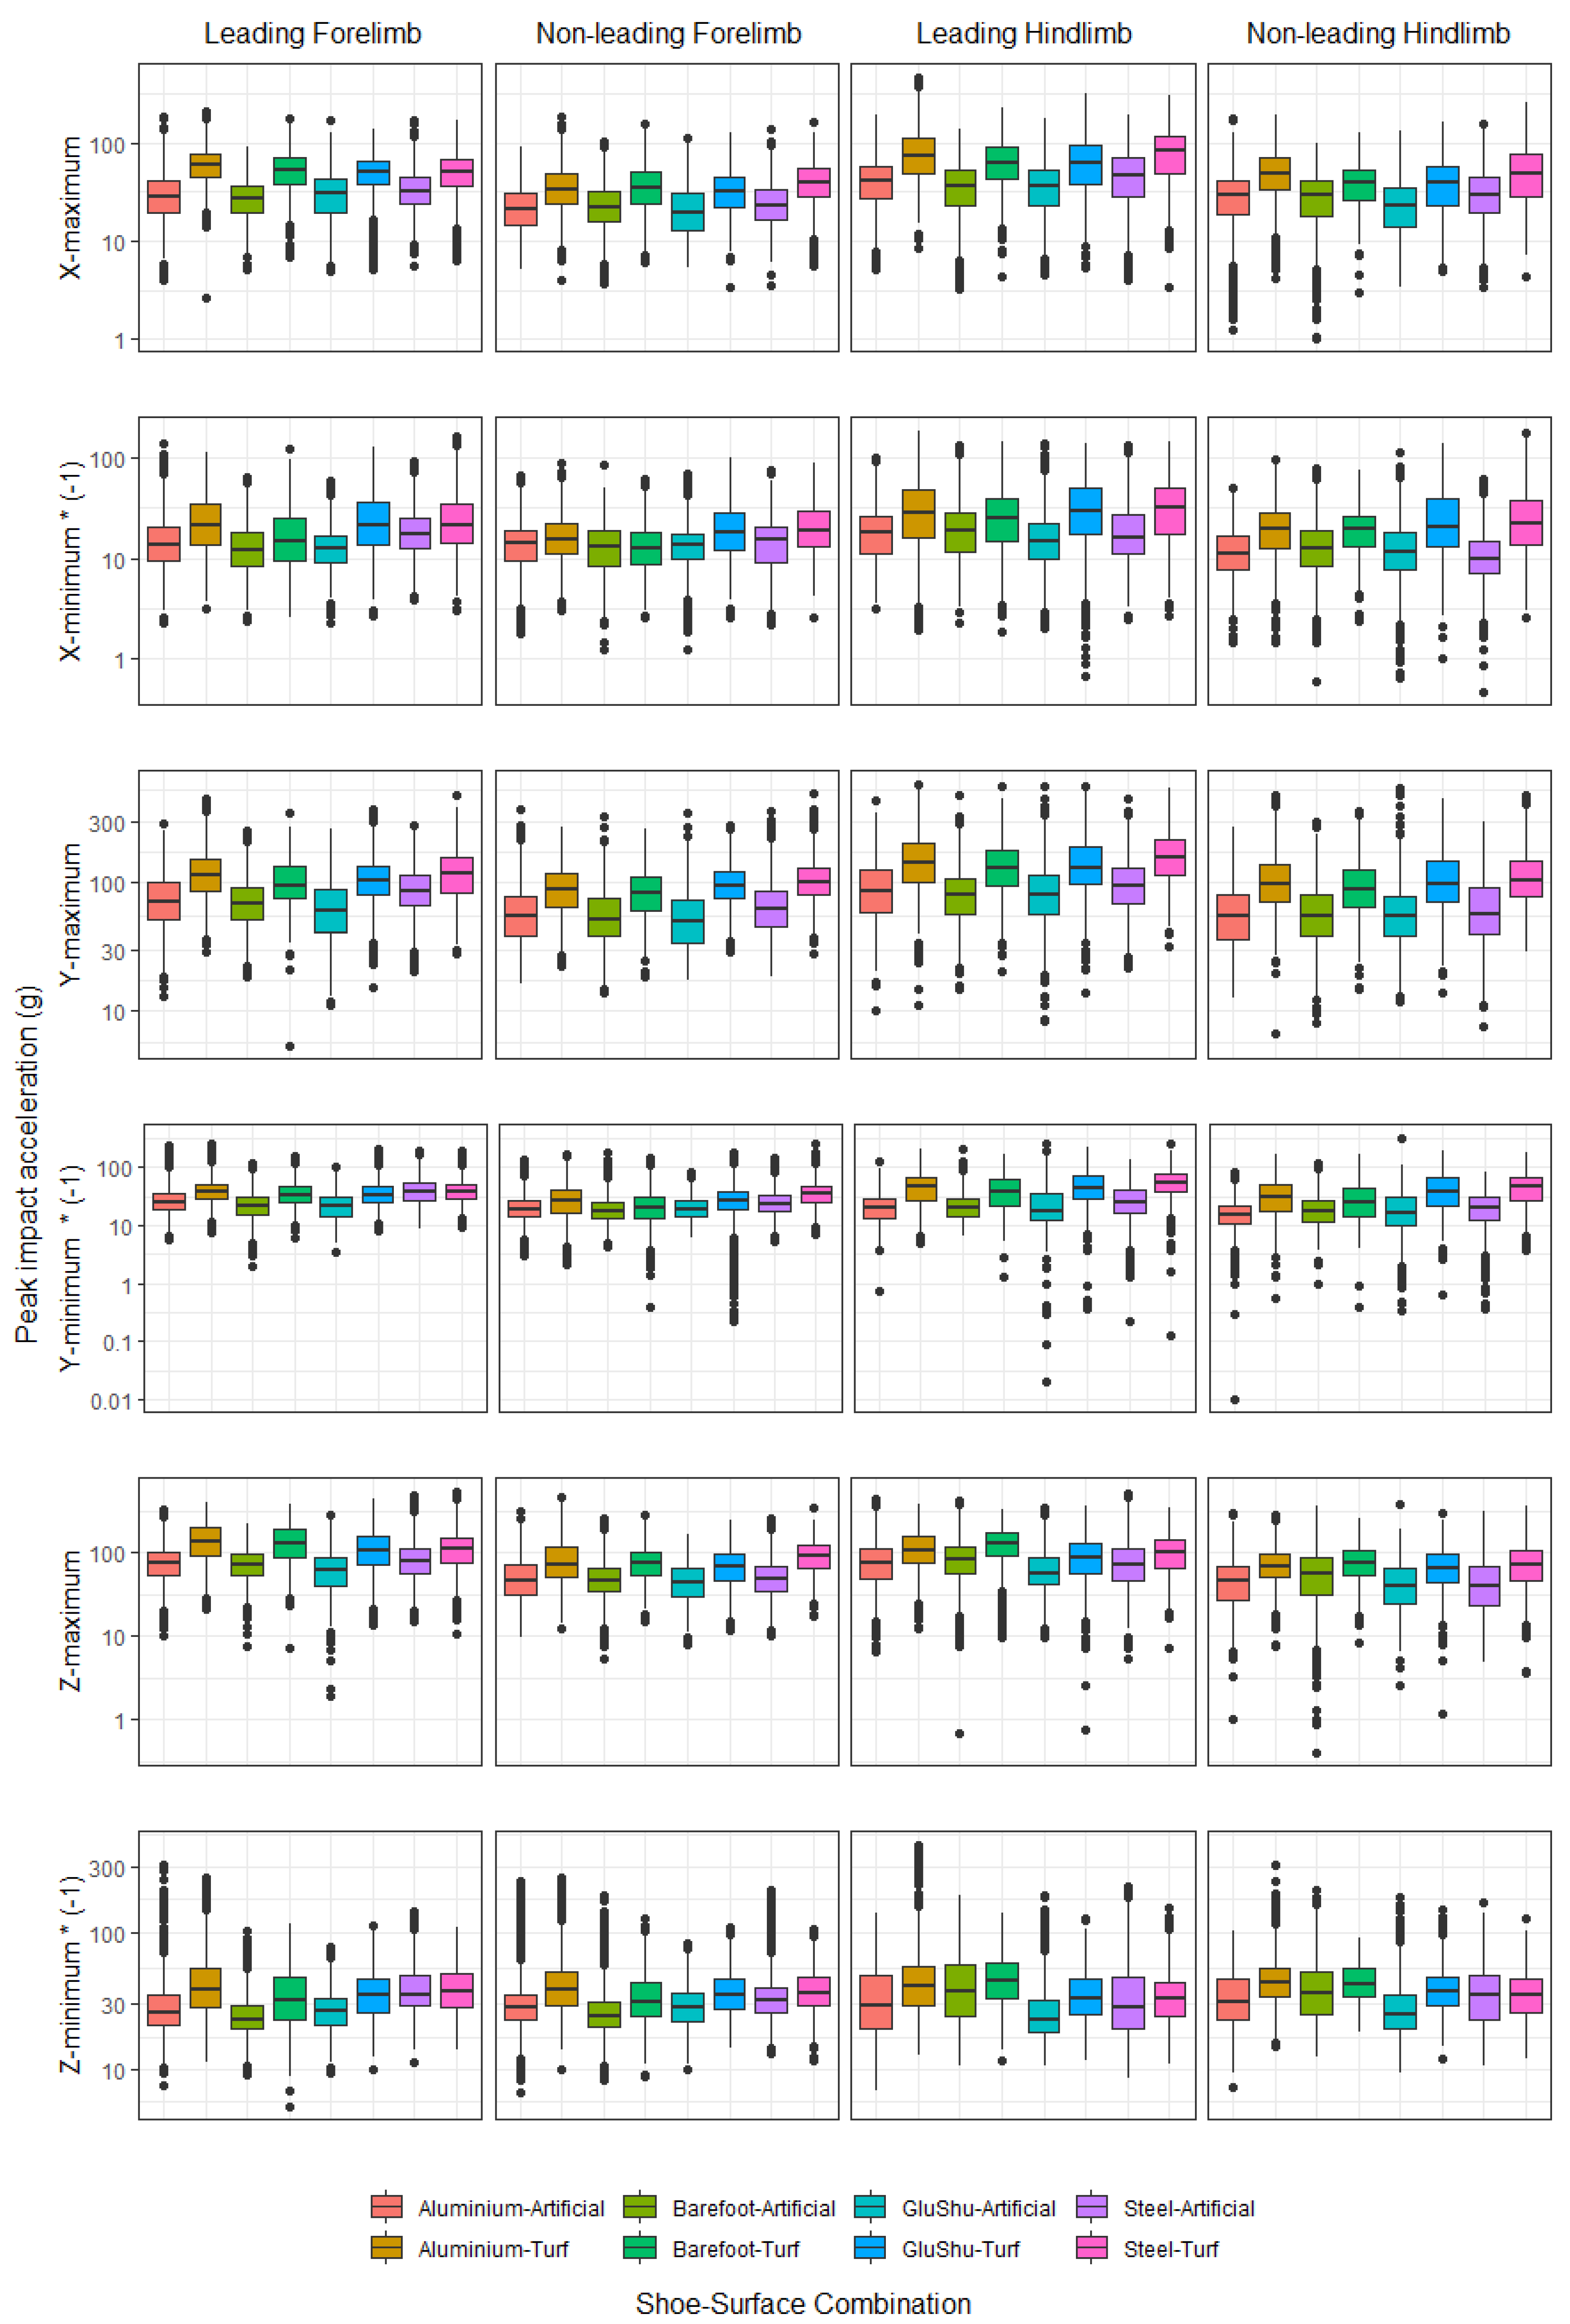
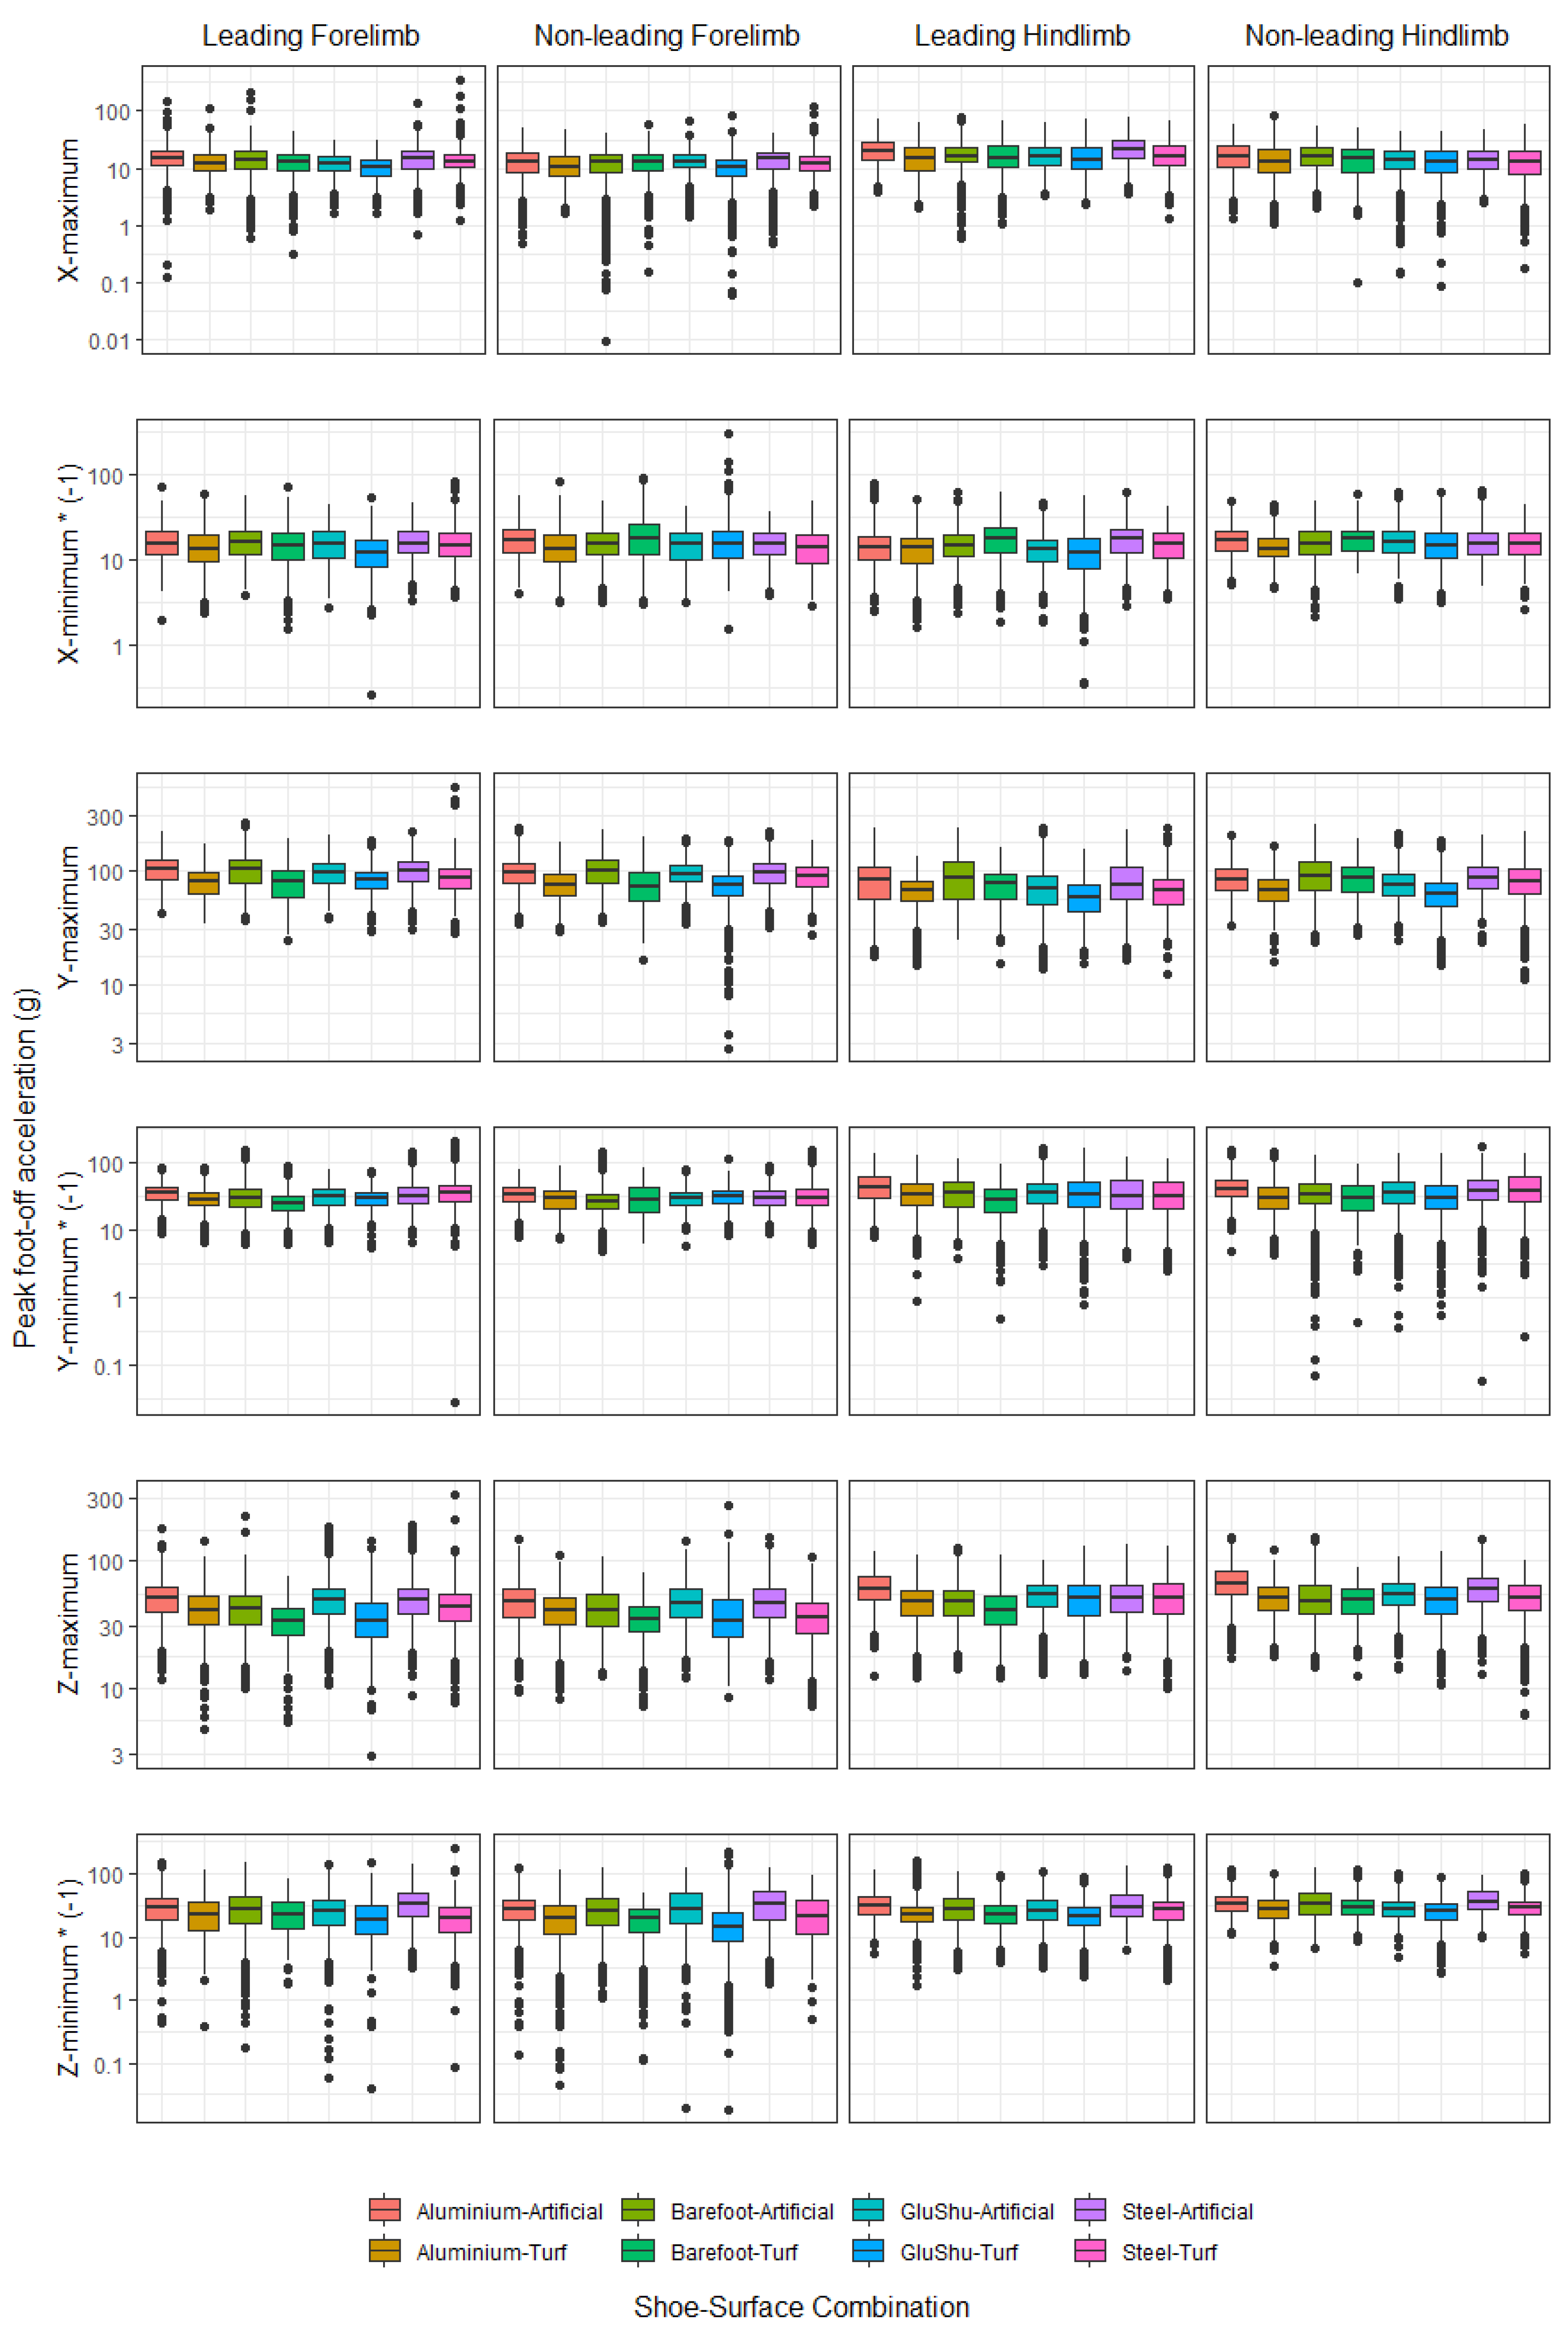
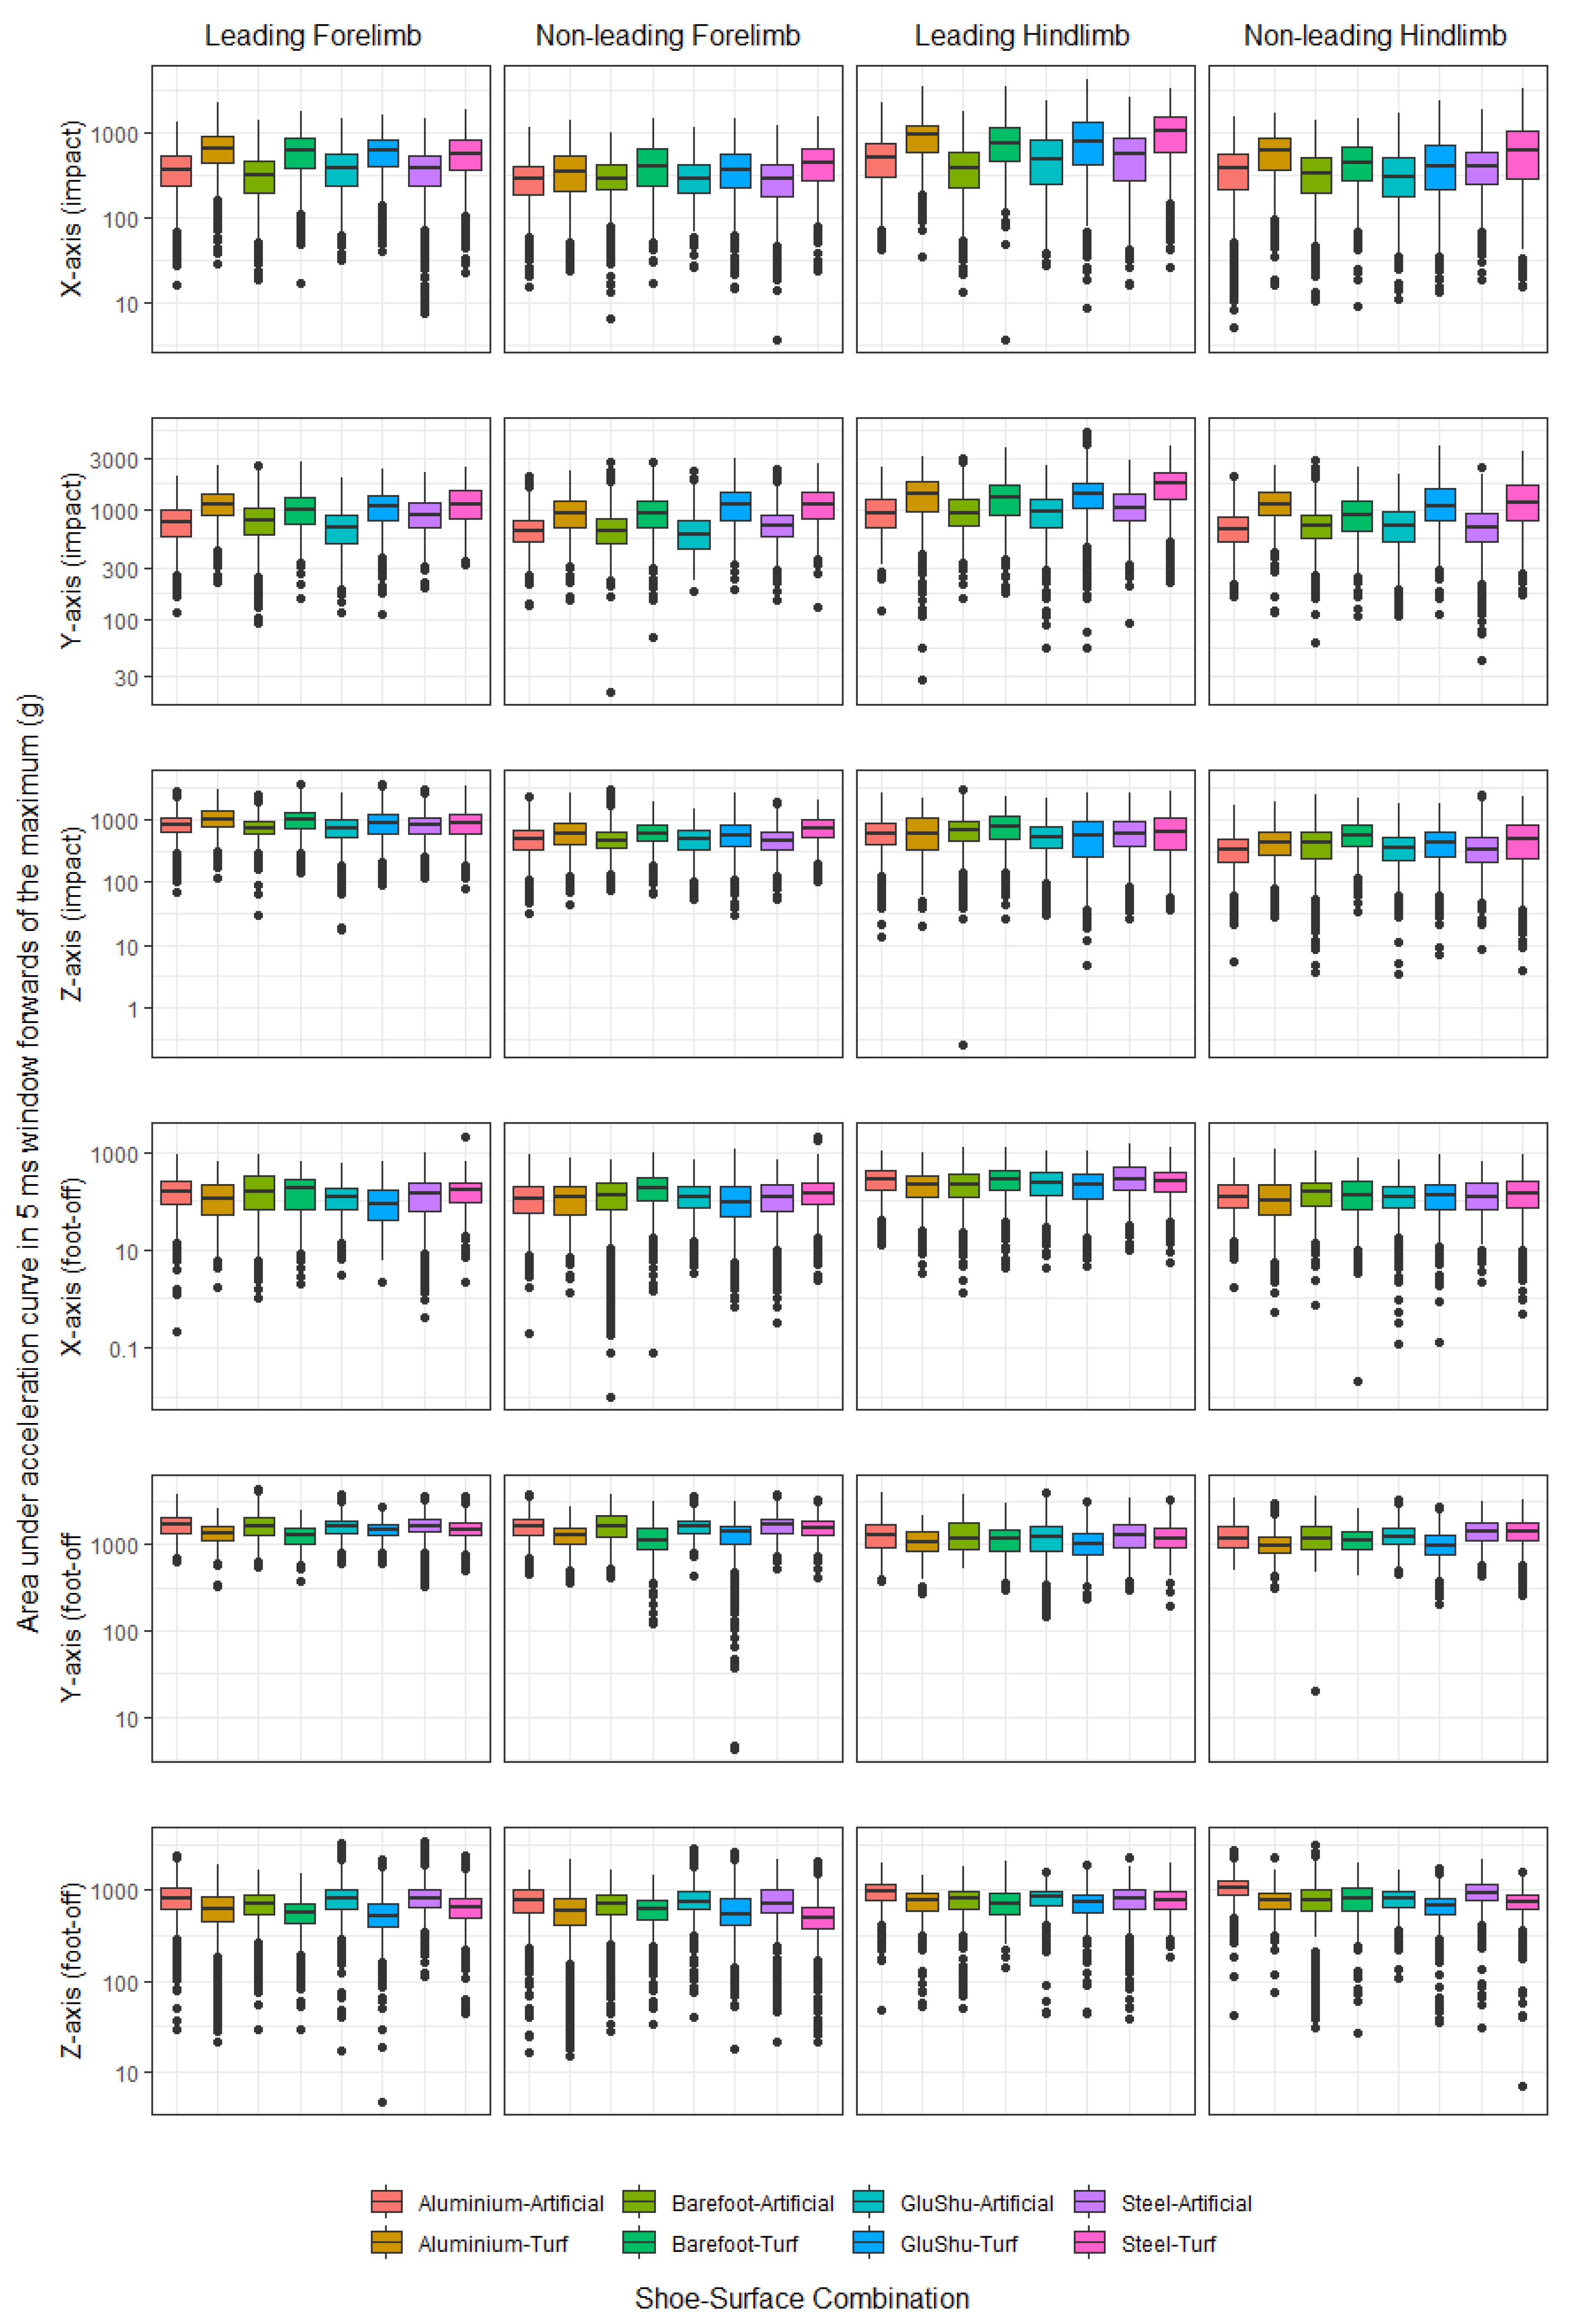
Appendix A.1. Peak Impact and Foot-Off Accelerations across All Acceleration Parameters
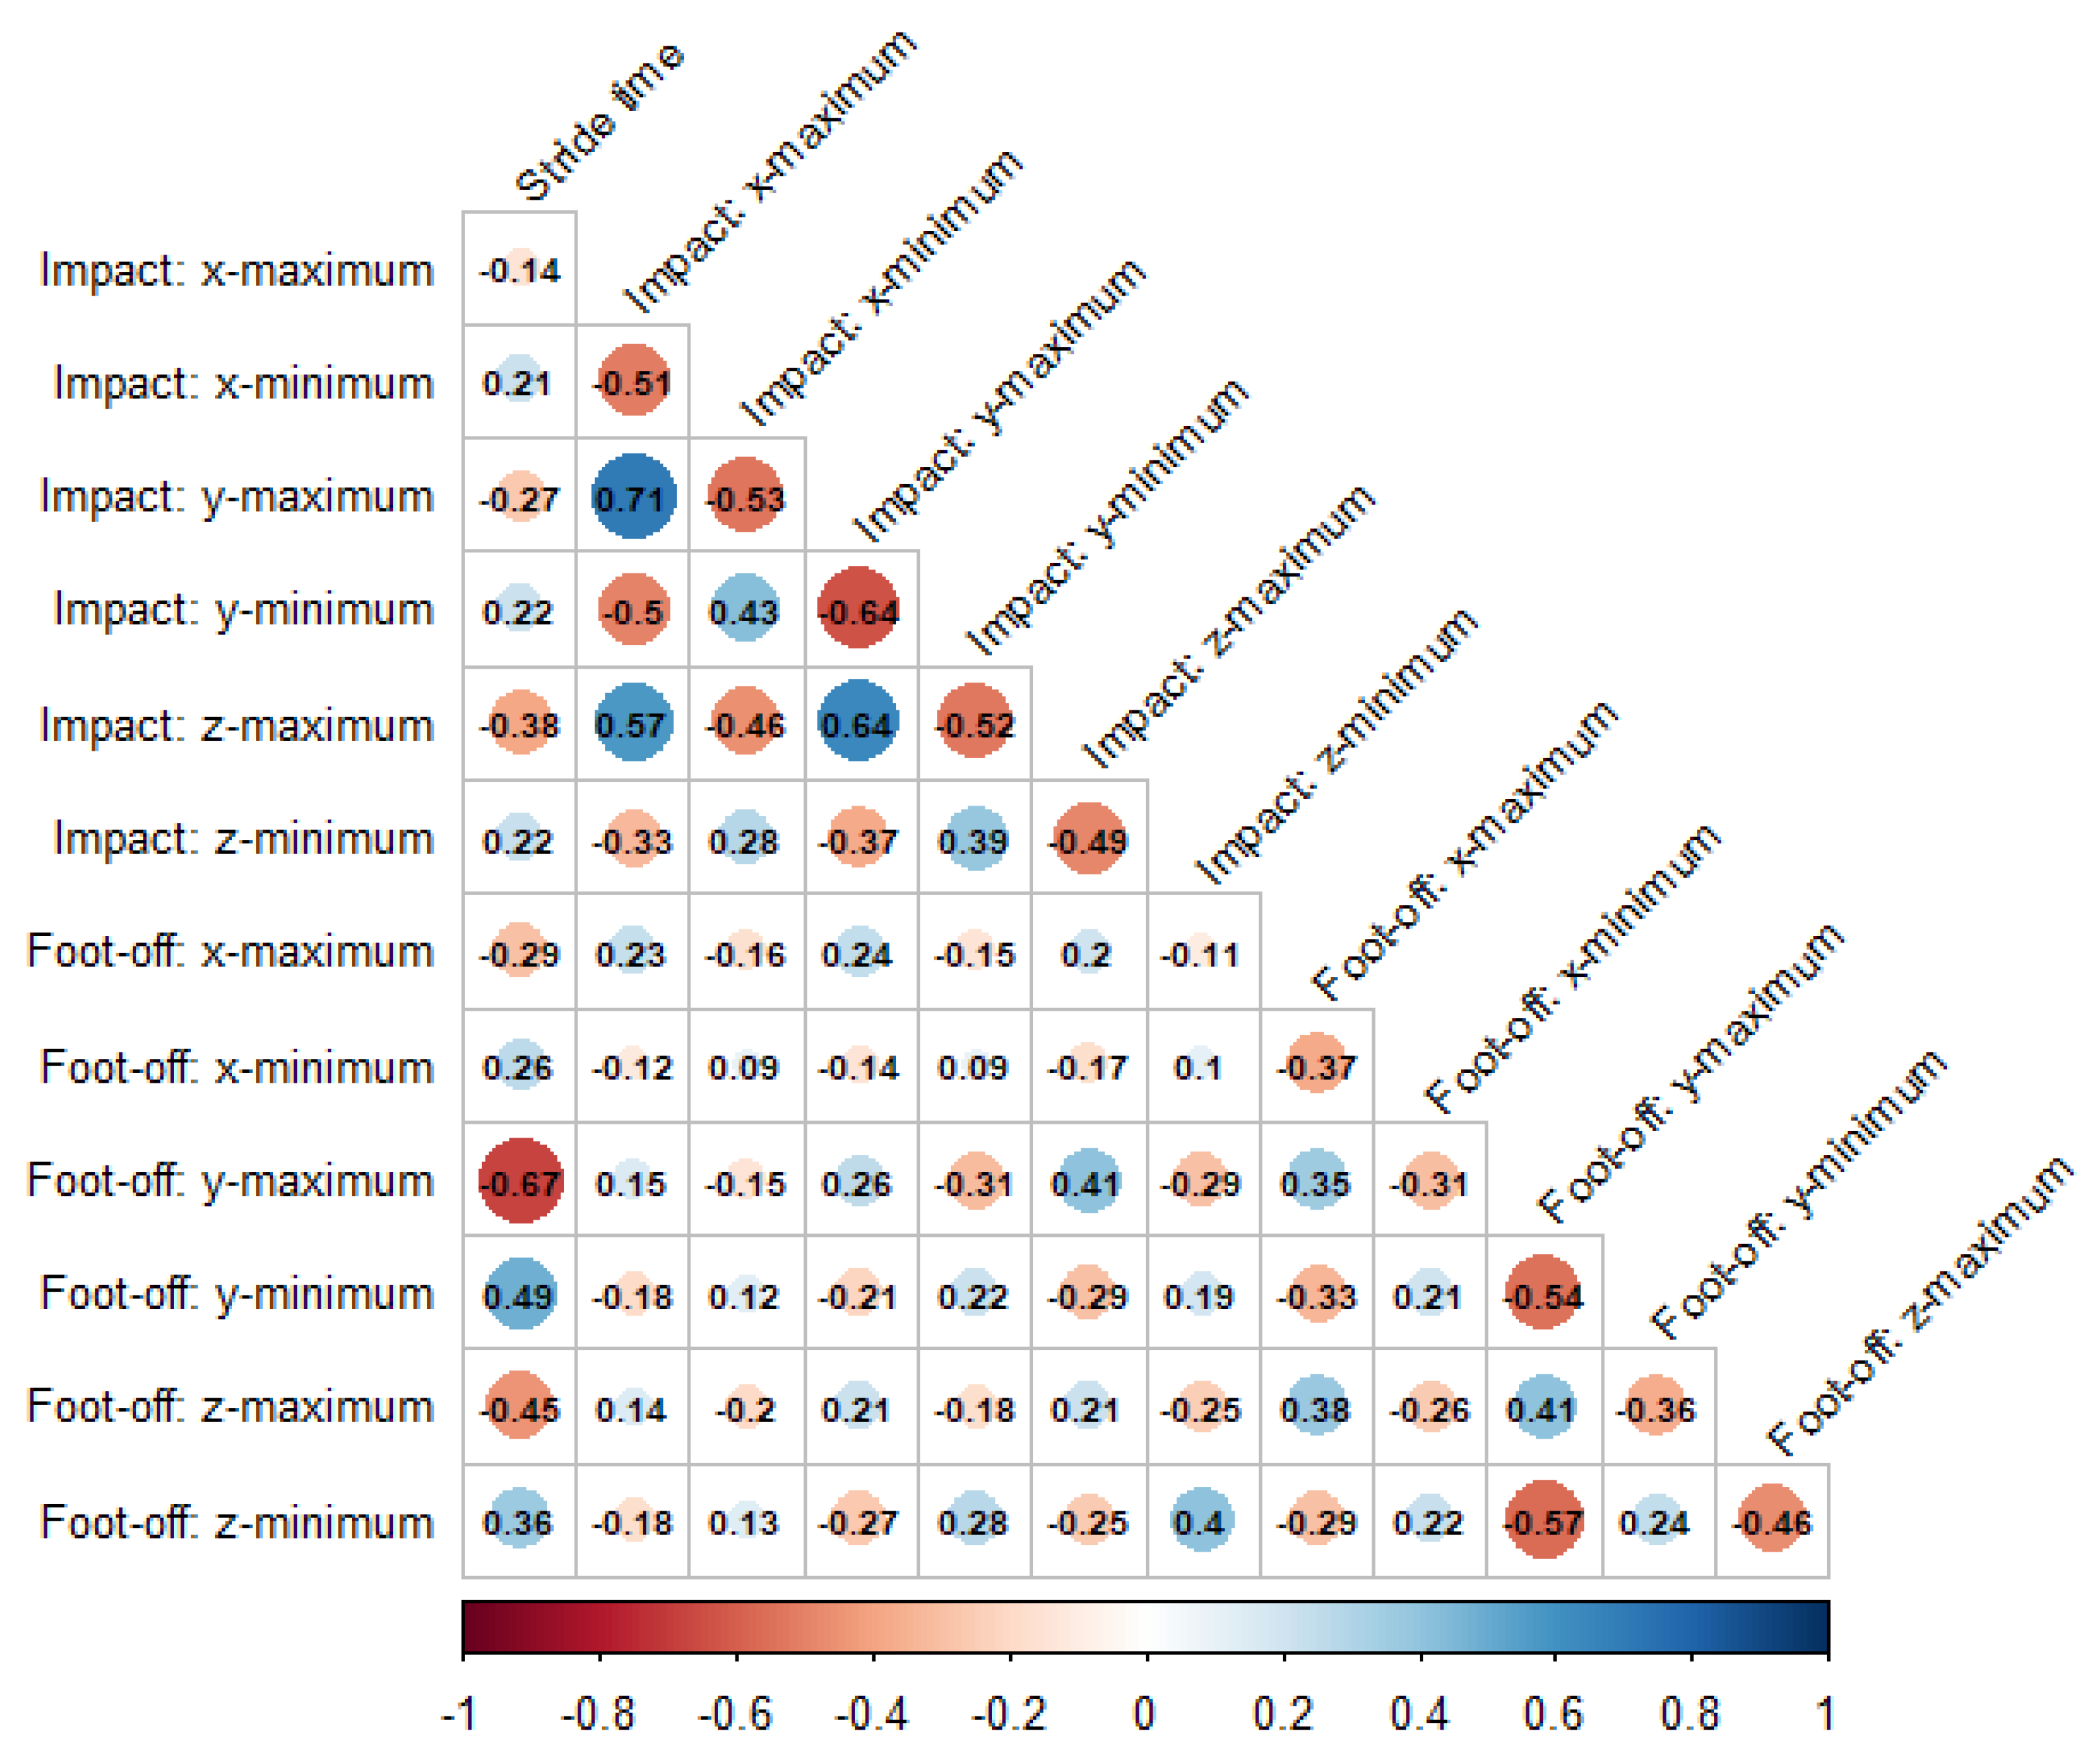
Appendix A.2. Peak Impact and Foot-Off Correlations
Appendix A.3. Relationship between Stride Time and Impact and Foot-Off Correlations

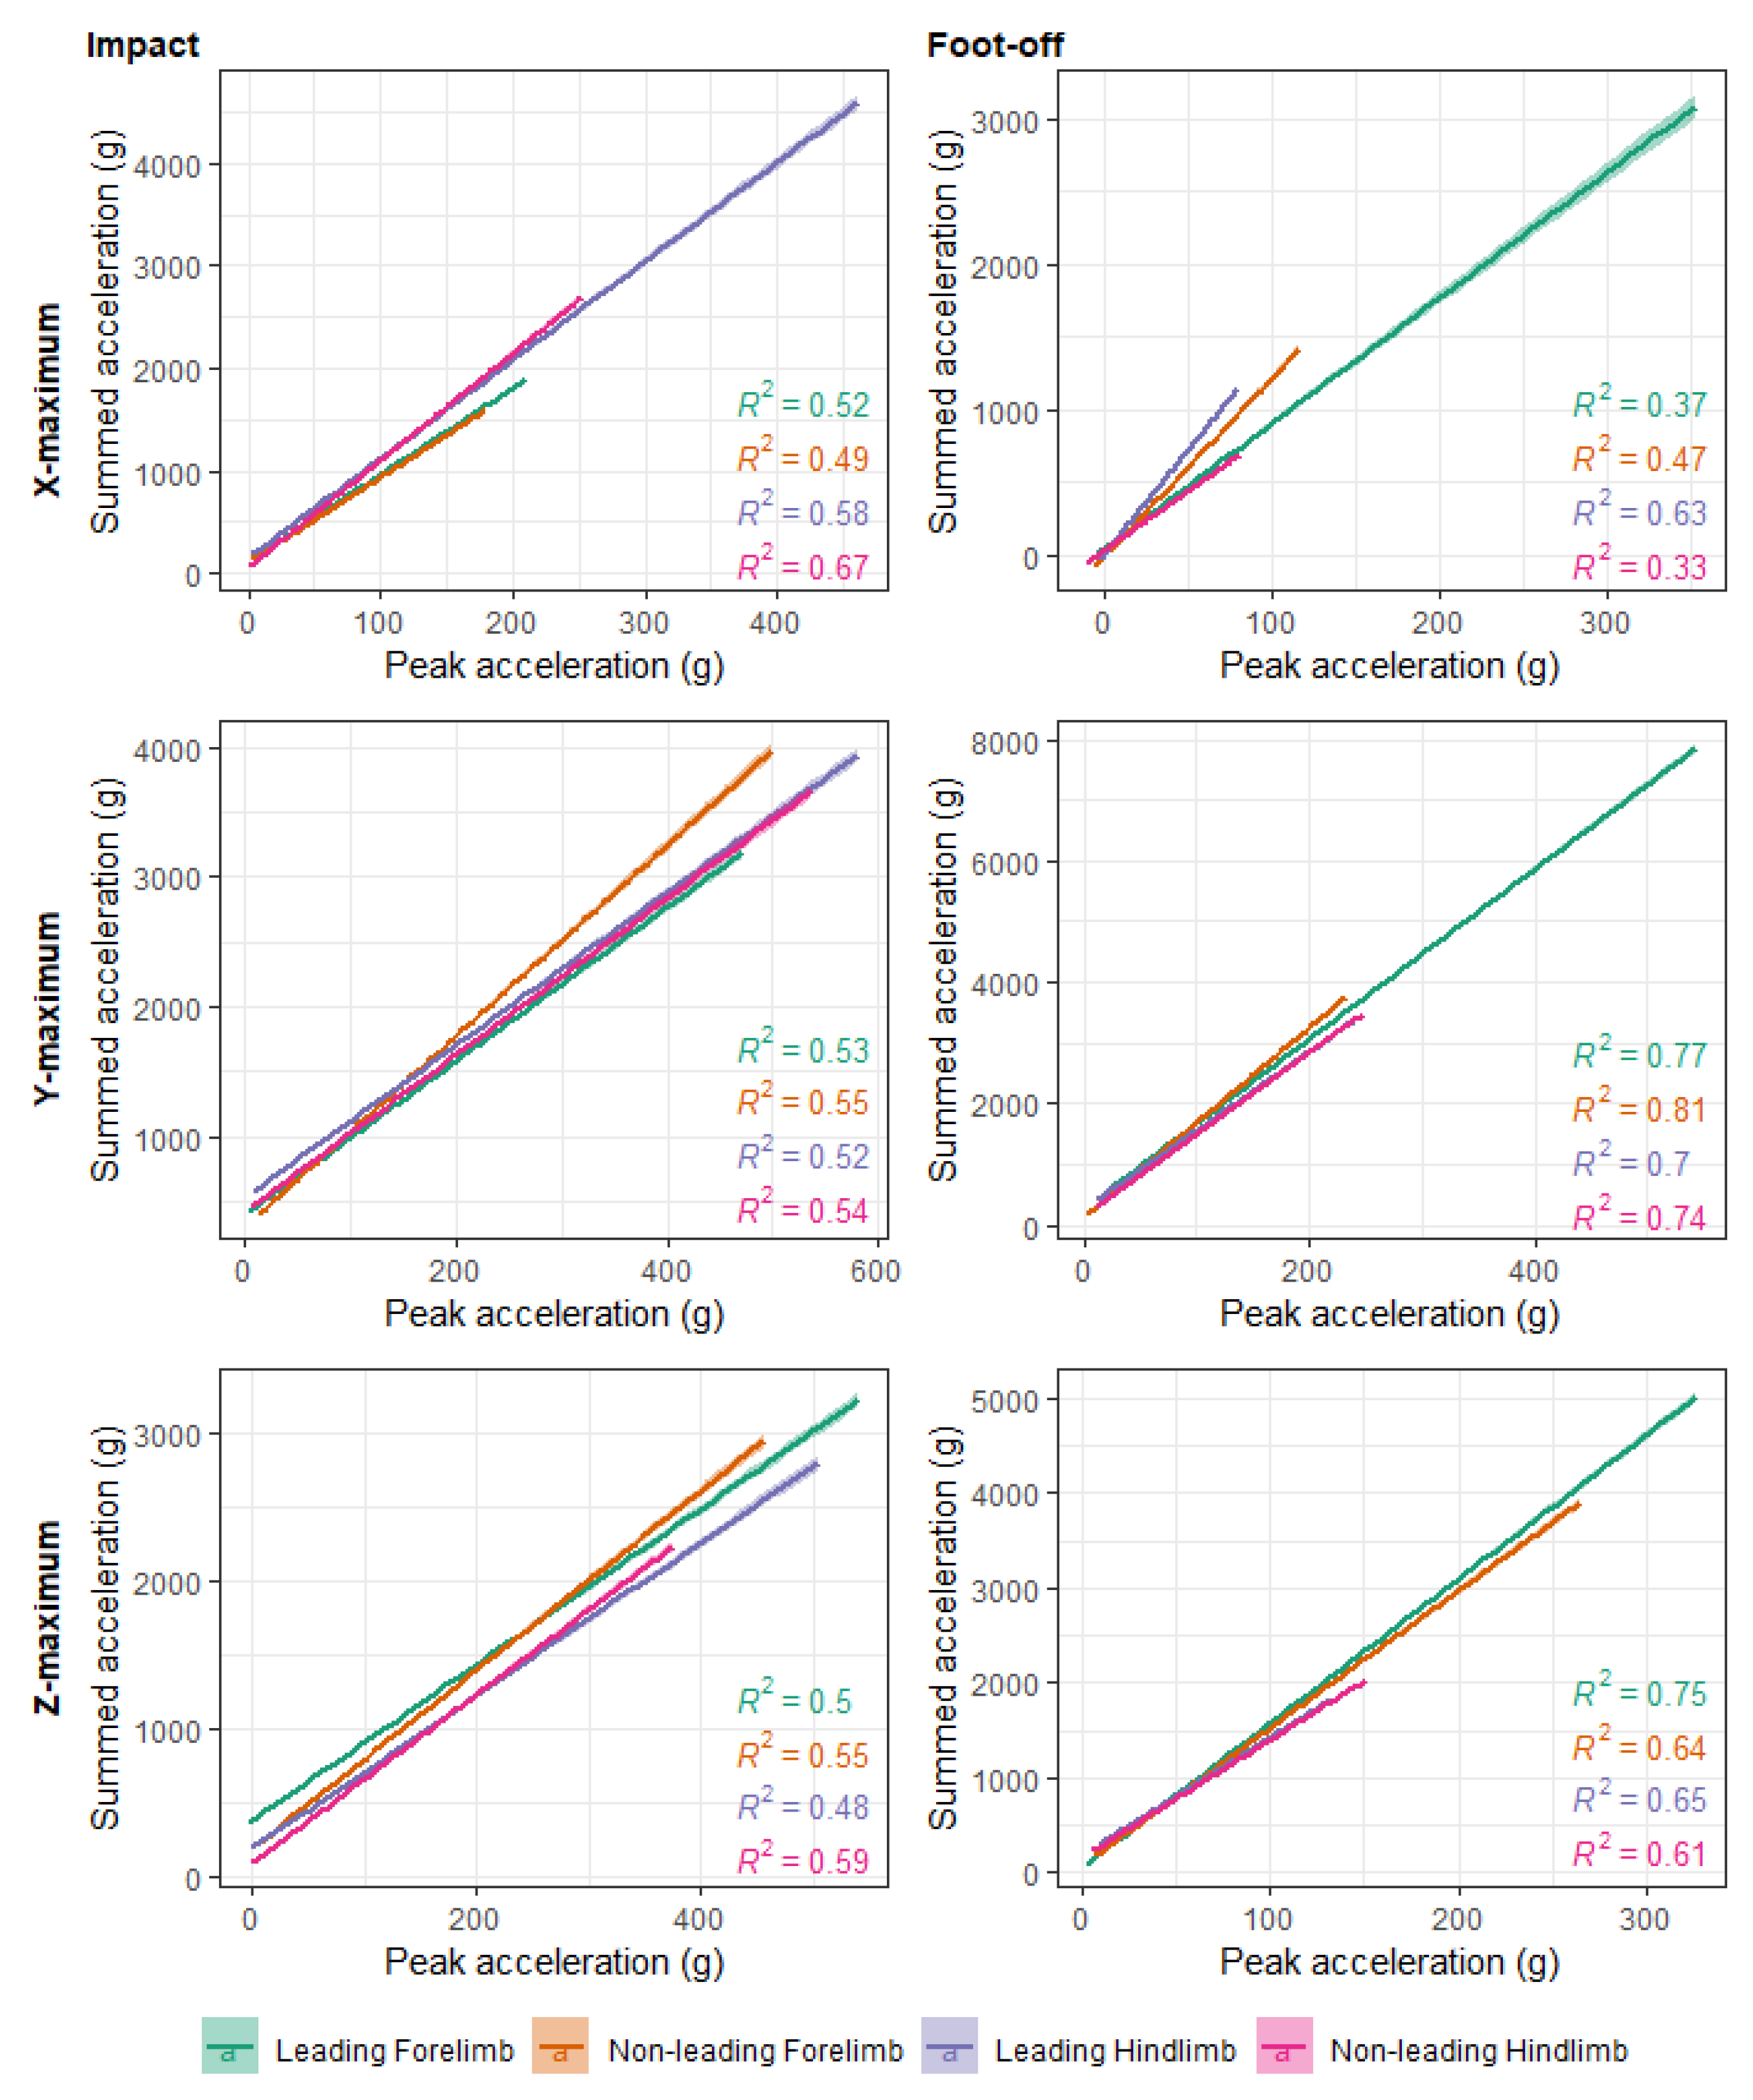
Appendix A.4. Peak Accelerations versus Areas
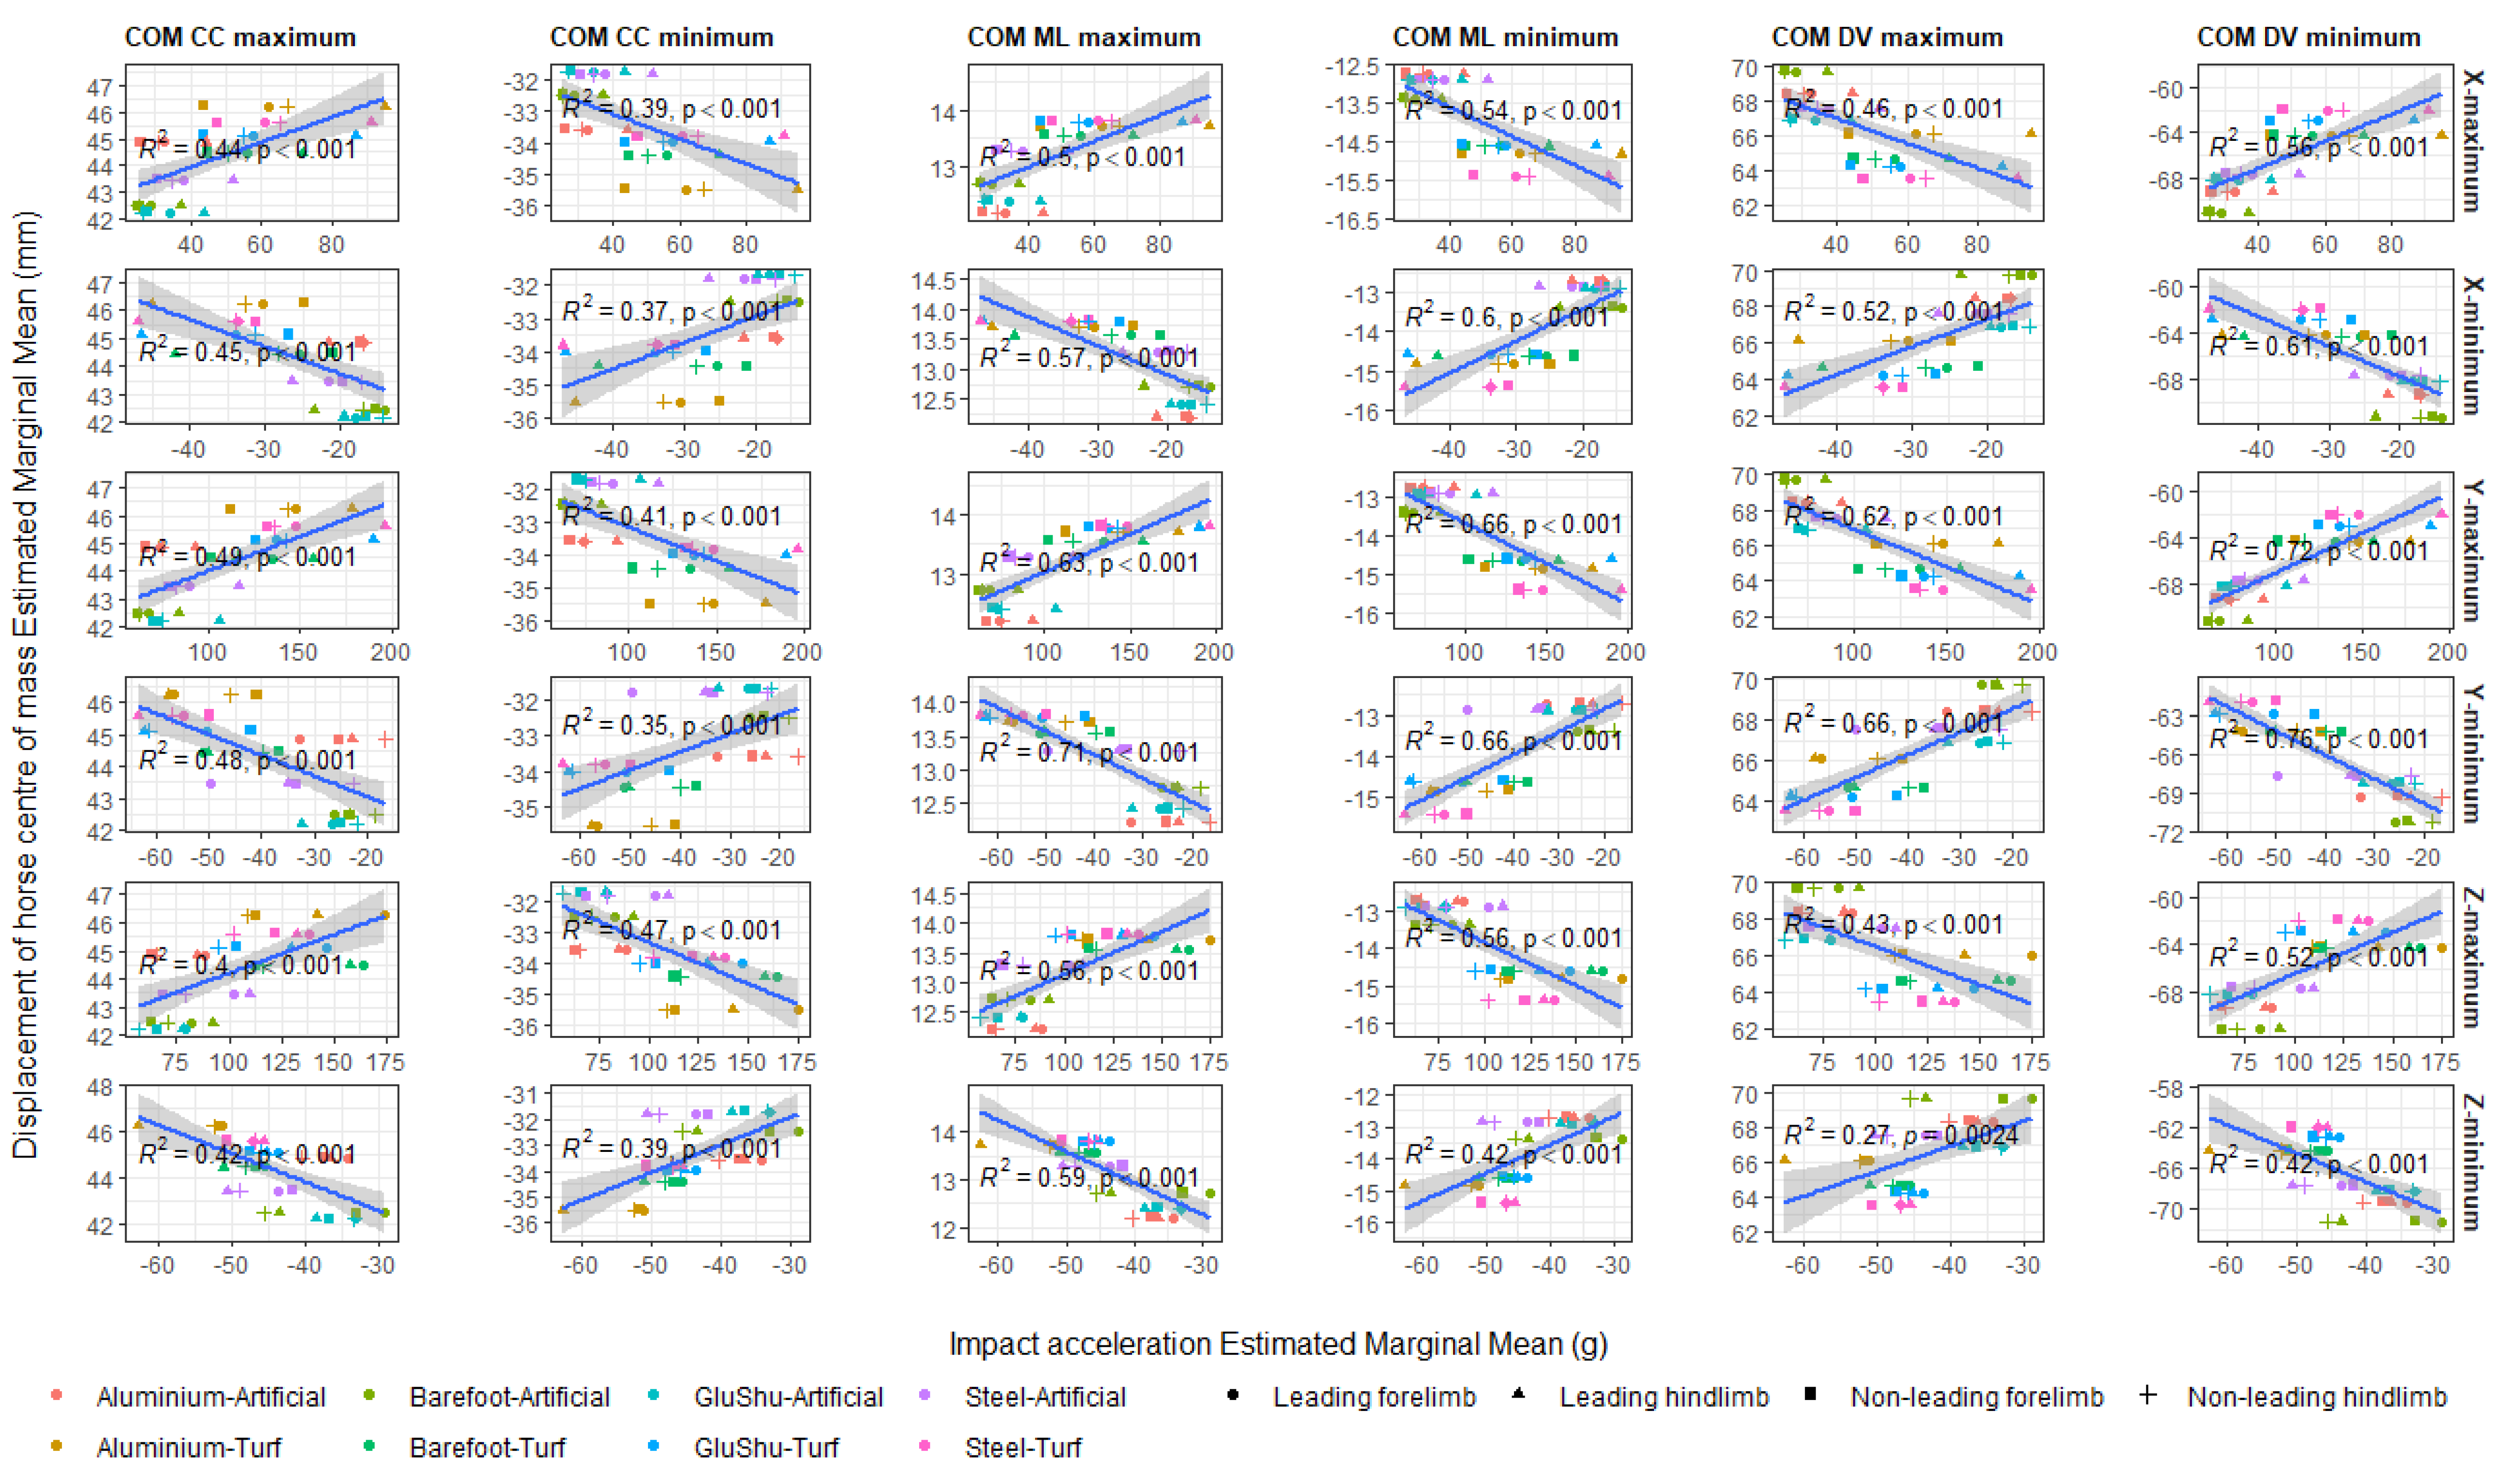
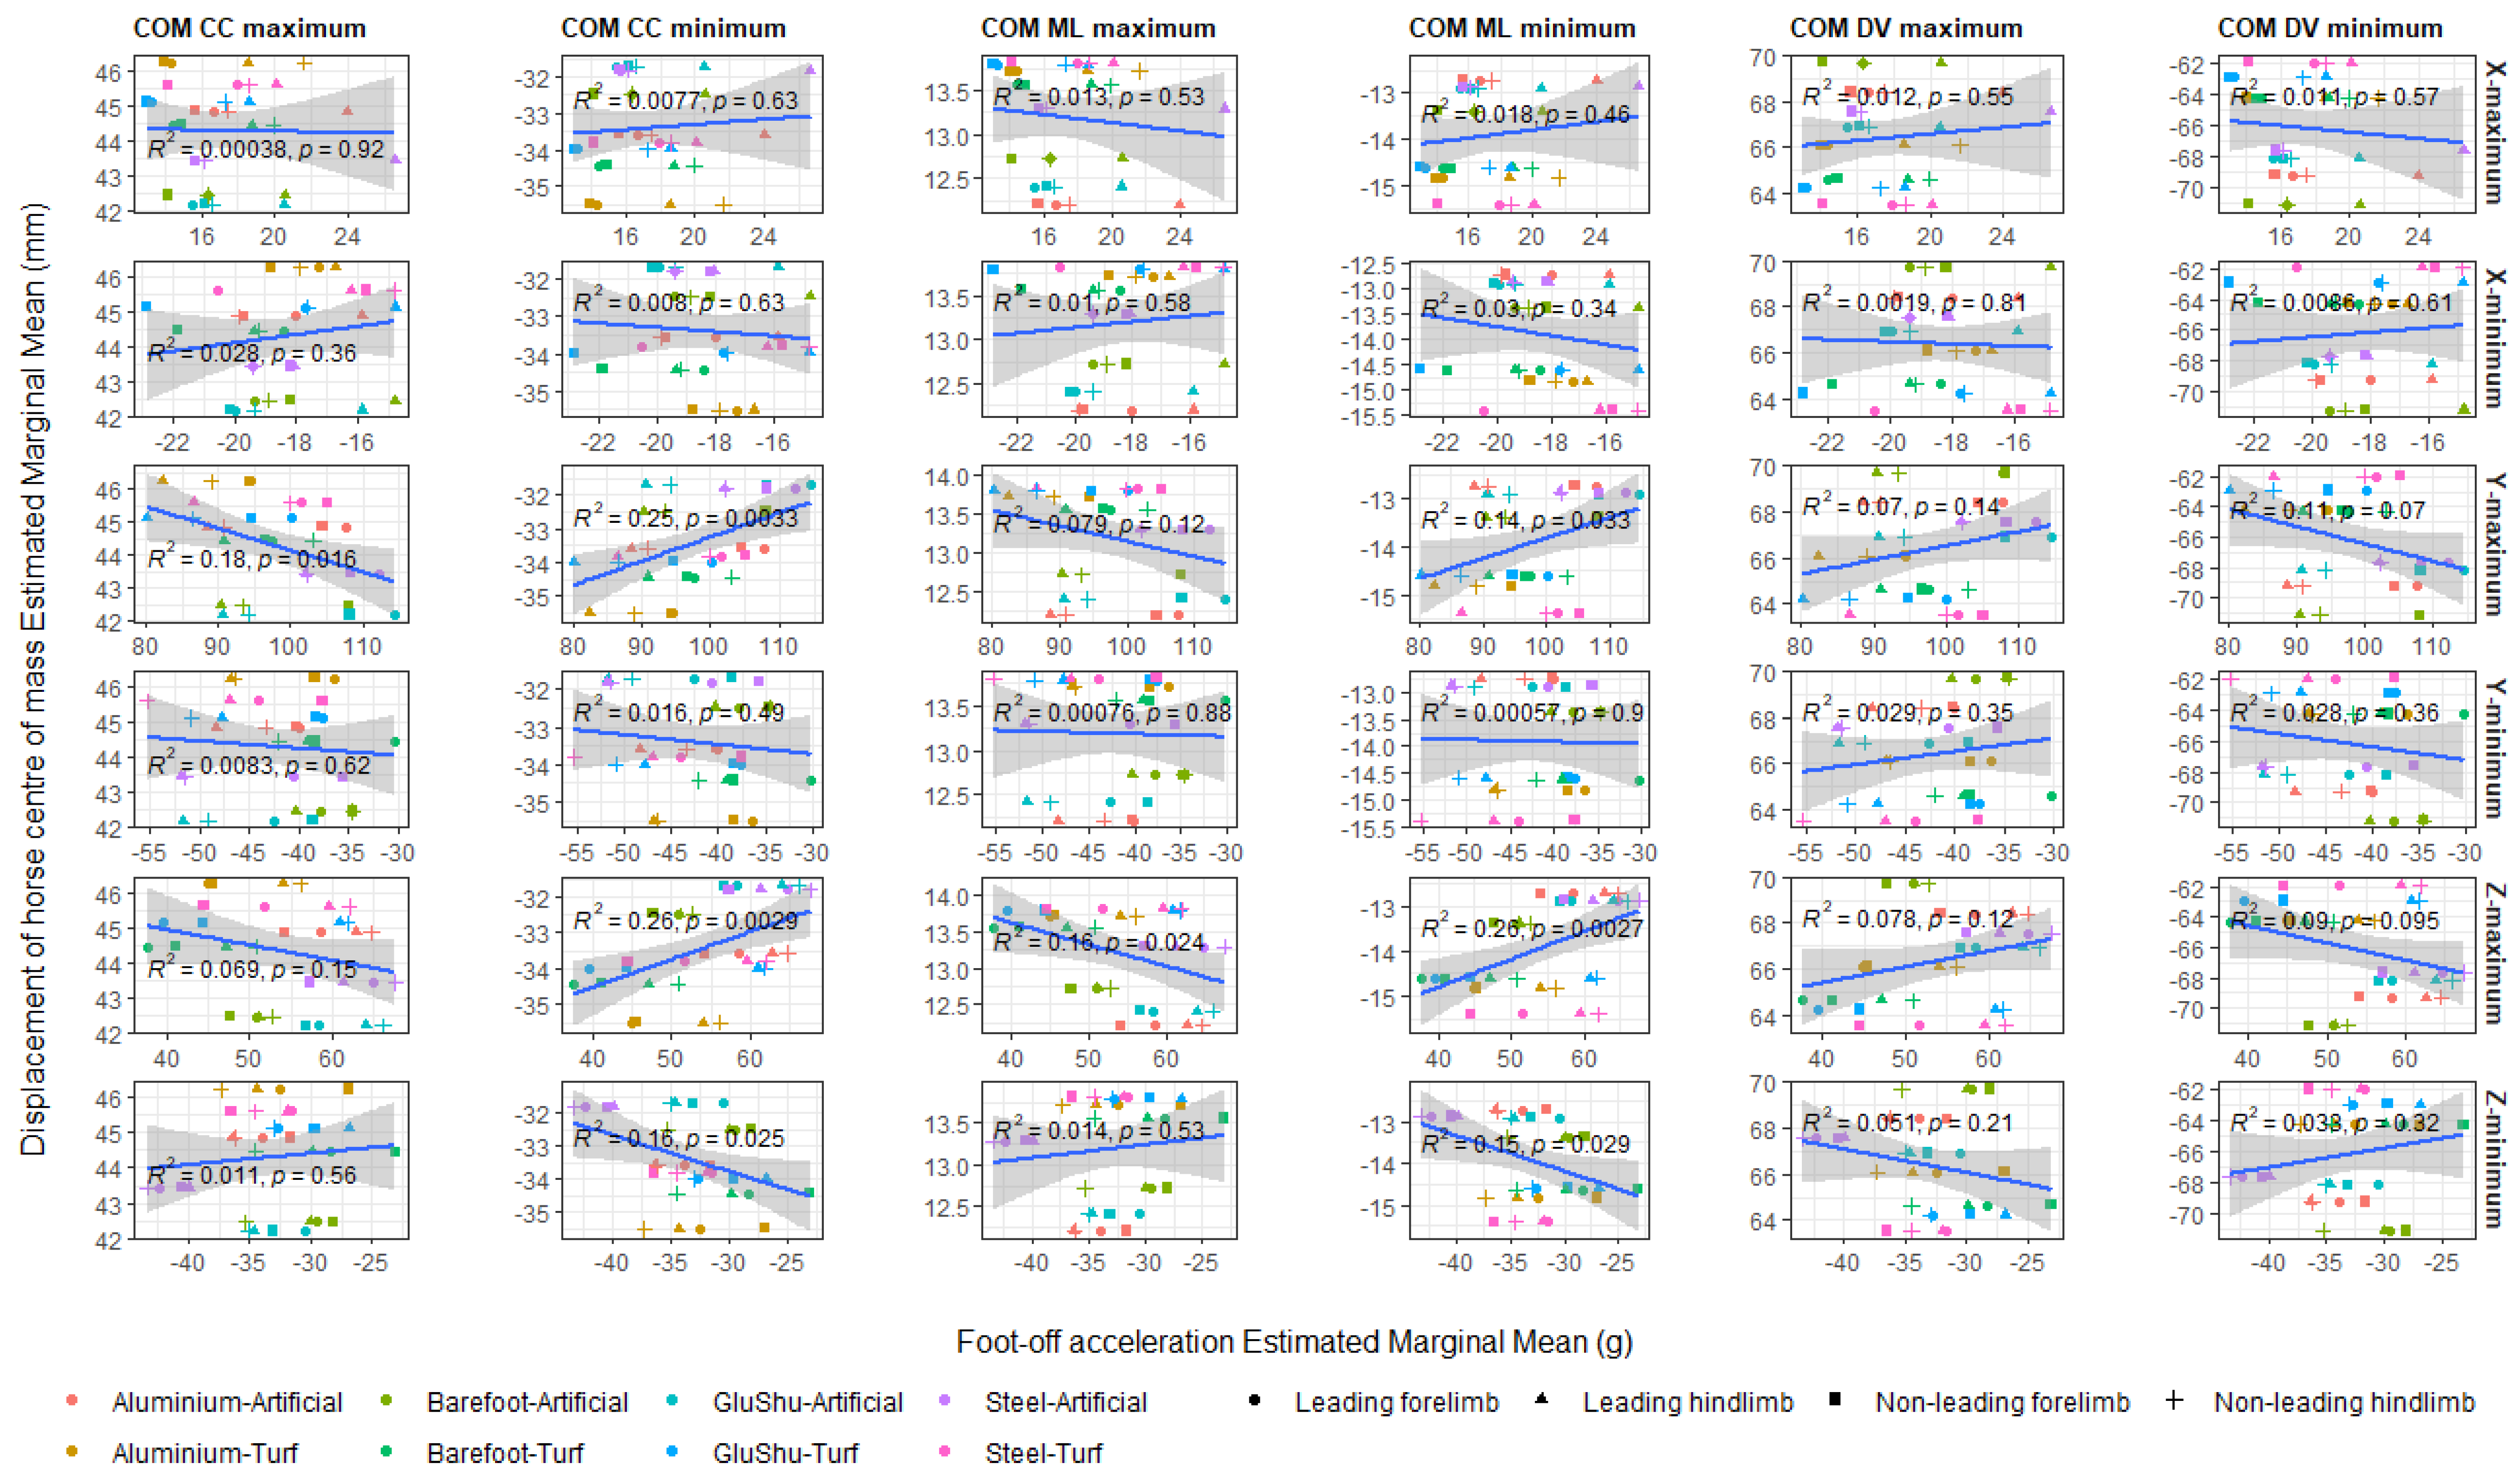
Appendix A.5. Relationship between Hoof Accelerometry Data and Centre of Mass Displacements
References
- Hitchens, P.L.; Morrice-West, A.V.; Stevenson, M.A.; Whitton, R.C. Meta-analysis of risk factors for racehorse catastrophic musculoskeletal injury in flat racing. Vet. J. 2019, 245, 29–40. [Google Scholar] [CrossRef] [PubMed]
- Williams, R.B.; Harkins, L.S.; Hammond, C.J.; Wood, J.L.N. Racehorse injuries, clinical problems and fatalities recorded on British racecourses from flat racing and National Hunt racing during 1996, 1997 and 1998. Equine Vet. J. 2001, 33, 478–486. [Google Scholar] [CrossRef] [PubMed]
- Parkin, T.D.H. Epidemiology of Racetrack Injuries in Racehorses. Vet. Clin. North Am. Equine Pract. 2008, 24, 1–19. [Google Scholar] [CrossRef] [PubMed]
- Cogger, N.; Perkins, N.; Hodgson, D.R.; Reid, S.W.J.; Evans, D.L. Risk factors for musculoskeletal injuries in 2-year-old Thoroughbred racehorses. Prev. Vet. Med. 2006, 74, 36–43. [Google Scholar] [CrossRef]
- Ely, E.R.; Avella, C.S.; Price, J.S.; Smith, R.K.W.; Wood, J.L.N.; Verheyen, K.L.P. Descriptive epidemiology of fracture, tendon and suspensory ligament injuries in National Hunt racehorses in training. Equine Vet. J. 2009, 41, 372–378. [Google Scholar] [CrossRef]
- Self Davies, Z.T.; Spence, A.J.; Wilson, A.M. Ground reaction forces of overground galloping in ridden Thoroughbred racehorses. J. Exp. Biol. 2019, 222, jeb204107. [Google Scholar] [CrossRef] [Green Version]
- Witte, T.H.; Knill, K.; Wilson, A.M. Determination of peak vertical ground reaction force from duty factor in the horse (Equus caballus). J. Exp. Biol. 2004, 207, 3639–3648. [Google Scholar] [CrossRef] [Green Version]
- Thomason, J.J.; Peterson, M.L. Biomechanical and Mechanical Investigations of the Hoof-Track Interface in Racing Horses. Vet. Clin. North Am.-Equine Pract. 2008, 24, 57–77. [Google Scholar] [CrossRef]
- Wilson, A.M.; McGuigan, M.P.; Su, A. Horses damp the spring in their step. Nature 2001, 414, 895–899. [Google Scholar] [CrossRef] [Green Version]
- Gustas, P.; Johnston, C. In vivo transmission of impact shock waves in the distal forelimb of the horse. Equine Vet. J. 2001, 33, 11–15. [Google Scholar] [CrossRef]
- Willemen, M.A.; Jacobs, M.W.H.; Schamhardt, H.C. In vitro transmission and attenuation of impact vibrations in the distal forelimb. Equine Exerc. Physiol. 1999, 30, 245–248. [Google Scholar] [CrossRef] [PubMed]
- Benoit, P.; Barrey, E.; Regnault, J.C.; Brochet, J.L. Comparison of the damping effect of different shoeing by the measurement of hoof acceleration. Acta Anat. 1993, 146, 109–113. [Google Scholar] [CrossRef]
- Barrey, E.; Landjerit, В.; Wolter, R. Shock and vibration during the hoof impact on different track surfaces. Equine Exerc. Physiol. 1991, 1, 97–106. [Google Scholar]
- Burn, J.F.; Wilson, A.; Nason, G.P. Impact during equine locomotion: Techniques for measurement and analysis. Equine Vet. J. Suppl. 1997, 23, 9–12. [Google Scholar] [CrossRef] [PubMed]
- Burn, J.F. Time domain characteristics of hoof-ground interaction at the onset of stance phase. Equine Vet. J. 2006, 38, 657–663. [Google Scholar] [CrossRef] [PubMed]
- Setterbo, J.J.; Garcia, T.C.; Campbell, I.P.; Reese, J.L.; Morgan, J.M.; Kim, S.Y.; Hubbard, M.; Stover, S.M. Hoof accelerations and ground reaction forces of Thoroughbred racehorses measured on dirt, synthetic, and turf track surfaces. Am. J. Vet. Res. 2009, 70, 1220–1229. [Google Scholar] [CrossRef]
- Chateau, H.; Robin, D.; Falala, S.; Pourcelot, P.; Valette, J.P.; Ravary, B.; Denoix, J.M.; Crevier-Denoix, N. Effects of a synthetic all-weather waxed track versus a crushed sand track on 3D acceleration of the front hoof in three horses trotting at high speed. Equine Vet. J. 2009, 41, 247–251. [Google Scholar] [CrossRef]
- Ryan, C.T.; Dallap Schaer, B.L.; Nunamaker, D.M. A novel wireless data acquisition system for the measurement of hoof accelerations in the exercising horse. Equine Vet. J. 2006, 38, 671–674. [Google Scholar] [CrossRef]
- Pratt, G.W. Model for injury to the foreleg of the Thoroughbred racehorse. Equine Vet. J. 1997, 29, 30–32. [Google Scholar] [CrossRef]
- Orlande, O.; Hobbs, S.J.; Martin, J.H.; Owen, A.G.; Northrop, A.J. Measuring hoof slip of the leading limb on jump landing over two different equine arena surfaces. Comp. Exerc. Physiol. 2012, 8, 33–39. [Google Scholar] [CrossRef]
- Gustås, P.; Johnston, C.; Drevemo, S. Ground reaction force and hoof deceleration patterns on two different surfaces at the trot. Equine Comp. Exerc. Physiol. 2006, 3, 209–216. [Google Scholar] [CrossRef]
- Ruina, A.; Bertram, J.E.A.; Srinivasan, M. A collisional model of the energetic cost of support work qualitatively explains leg sequencing in walking and galloping, pseudo-elastic leg behavior in running and the walk-to-run transition. J. Theor. Biol. 2005, 237, 170–192. [Google Scholar] [CrossRef] [PubMed]
- Hobbs, S.J.; Clayton, H.M. Sagittal plane ground reaction forces, centre of pressure and centre of mass in trotting horses. Vet. J. 2013, 198, 14–19. [Google Scholar] [CrossRef] [PubMed]
- Johnston, C.; Back, W. Hoof ground interaction: When biomechanical stimuli challenge the tissues of the distal limb. Equine Vet. J. 2006, 38, 634–641. [Google Scholar] [CrossRef] [PubMed]
- Reiser-II, R.F.; Peterson, M.L.; McIlwraith, C.W.; Woodward, B. Simulated effects of racetrack material properties on the vertical loading of the equine forelimb. Sports Eng. 2000, 3, 1–11. [Google Scholar] [CrossRef]
- Horan, K.; Coburn, J.; Kourdache, K.; Day, P.; Harborne, D.; Brinkley, L.; Carnall, H.; Hammond, L.; Peterson, M.; Millard, S.; et al. Influence of speed, ground surface and shoeing Condition on hoof breakover duration in galloping Thoroughbred racehorses. Animals 2021, 11, 2588. [Google Scholar]
- Radin, E.L. Subchondral bone changes and cartilage damage. Equine Vet. J. 1999, 31, 94–95. [Google Scholar] [CrossRef]
- Whitton, R.C.; Ayodele, B.A.; Hitchens, P.L.; Mackie, E.J. Subchondral bone microdamage accumulation in distal metacarpus of Thoroughbred racehorses. Equine Vet. J. 2018, 50, 766–773. [Google Scholar] [CrossRef]
- Firth, E.C.; Delahunt, J.; Wichtel, J.W.; Birch, H.L.; Goodship, A.E. Galloping exercise induces regional changes in bone density within the third and radial carpal bones of Thoroughbred horses. Equine Vet. J. 1999, 31, 111–115. [Google Scholar] [CrossRef]
- Cheney, J.A.; Liou, S.Y.; Wheat, J.D. Cannon-bone fracture in the thoroughbred racehorse. Med. Biol. Eng. 1973, 11, 613–620. [Google Scholar] [CrossRef]
- Drevemo, S.; Hjerten, G.; Johnston, C. Drop hammer tests of Scandinavian harness racetracks. Equine Vet. J. 1994, 26, 35–38. [Google Scholar] [CrossRef]
- Crevier-Denoix, N.; Pourcelot, P.; Ravary, B.; Robin, D.; Falala, S.; Uzel, S.; Grison, A.C.; Valette, J.P.; Denoix, J.M.; Chateau, H. Influence of track surface on the equine superficial digital flexor tendon loading in two horses at high speed trot. Equine Vet. J. 2009, 41, 257–261. [Google Scholar] [CrossRef] [PubMed] [Green Version]
- Crevier-Denoix, N.; Ravary-Plumioën, B.; Vergari, C.; Camus, M.; Holden-Douilly, L.; Falala, S.; Jerbi, H.; Desquilbet, L.; Chateau, H.; Denoix, J.M.; et al. Comparison of superficial digital flexor tendon loading on asphalt and sand in horses at the walk and trot. Vet. J. 2013, 198, e130–e136. [Google Scholar] [CrossRef] [PubMed]
- Radin, E.L.; Orr, R.B.; Kelman, J.L.; Paul, I.L.; Rose, R.M. Effect of prolonged walking on concrete on the knees of sheep. J. Biomech. 1982, 15, 487–492. [Google Scholar] [CrossRef] [PubMed]
- Simon, S.R.; Radin, E.L.; Paul, I.L.; Rose, R.M. The response of joints to impact loading. II. In vivo behavior of subchondral bone. J. Biomech. 1972, 5, 267–272. [Google Scholar] [CrossRef]
- Hernandez, J.; Hawkins, D.L.; Scollay, M.C. Race-start characteristics and risk of catastrophic musculoskeletal injury in Thoroughbred racehorses. J. Am. Vet. Med. Assoc. 2001, 218, 83–86. [Google Scholar] [CrossRef]
- Peterson, M.; Sanderson, W.; Kussainov, N.; Hobbs, S.J.; Miles, P.; Scollay, M.C.; Clayton, H.M. Effects of racing surface and turn radius on fatal limb fractures in thoroughbred racehorses. Sustainability 2021, 13, 539. [Google Scholar] [CrossRef]
- Northrop, A.J.; Martin, J.H.; Holt, D.; Hobbs, S.J. Operational temperatures of all-weather thoroughbred racetracks influence surface functional properties. Biosyst. Eng. 2020, 193, 37–45. [Google Scholar] [CrossRef]
- Peterson, M.L.; Reiser, R.F.; Kuo, P.H.; Radford, D.W.; McIlwraith, C.W. Effect of temperature on race times on a synthetic surface. Equine Vet. J. 2010, 42, 351–357. [Google Scholar] [CrossRef]
- Mahaffey, C.A.; Peterson, M.L.; Roepstorff, L. The effects of varying cushion depth on dynamic loading in shallow sand thoroughbred horse dirt racetracks. Biosyst. Eng. 2013, 114, 178–186. [Google Scholar] [CrossRef]
- Oikawa, M.; Kusunose, R. Fractures sustained by racehorses in Japan during flat racing with special reference to track condition and racing time. Vet. J. 2005, 170, 369–374. [Google Scholar] [CrossRef] [PubMed]
- Bolwell, C.; Rogers, C.; Gee, E.; McIlwraith, W. Epidemiology of musculoskeletal injury during racing on New Zealand racetracks 2005-2011. Animals 2017, 7, 62. [Google Scholar] [CrossRef] [Green Version]
- Rosanowski, S.M.; Chang, Y.M.; Stirk, A.J.; Verheyen, K.L.P. Descriptive epidemiology of veterinary events in flat racing Thoroughbreds in Great Britain (2000 to 2013). Equine Vet. J. 2017, 49, 275–281. [Google Scholar] [CrossRef] [PubMed] [Green Version]
- Bailey, C.J.; Reidt, S.W.J.; Hodgson, D.R.; Bourke, J.M.; Rose, R.J. Flat, hurdle and steeple racing: Risk factors for musculoskeletal injury. Equine Vet. J. 1998, 30, 498–503. [Google Scholar] [CrossRef]
- Henley, W.E.; Rogers, K.; Harkins, L.; Wood, J.L.N. A comparison of survival models for assessing risk of racehorse fatality. Prev. Vet. Med. 2006, 74, 3–20. [Google Scholar] [CrossRef] [PubMed]
- Boden, L.A.; Anderson, G.A.; Charles, J.A.; Morgan, K.L.; Morton, J.M.; Parkin, T.D.H.; Clarke, A.F.; Slocombe, R.F. Risk factors for Thoroughbred racehorse fatality in flat starts in Victoria, Australia (1989–2004). Equine Vet. J. 2007, 39, 430–437. [Google Scholar] [CrossRef] [PubMed]
- Parkin, T.D.H.; Clegg, P.D.; French, N.P.; Proudman, C.J.; Riggs, C.M.; Singer, E.R.; Webbon, P.M.; Morgan, K.L. Risk of fatal distal limb fractures among Thoroughbreds involved in the five types of racing in the United Kingdom. Vet. Rec. 2004, 154, 493–497. [Google Scholar] [CrossRef]
- Reardon, R.J.M.; Boden, L.; Stirk, A.J.; Parkin, T.D.H. Accuracy of distal limb fracture diagnosis at british racecourses 1999-2005. Vet. Rec. 2014, 174, 477. [Google Scholar] [CrossRef]
- Parkin, T.D.H.; Clegg, P.D.; French, N.P.; Proudman, C.J.; Riggs, C.M.; Singer, E.R.; Webbon, P.M.; Morgan, K.L. General Articles Risk factors for fatal lateral condylar fracture of the third metacarpus/metatarsus in UK racing. Equine Vet. J. 2004, 37, 192–199. [Google Scholar] [CrossRef]
- Georgopoulos, S.P.; Parkin, T.D.H. Risk factors for equine fractures in Thoroughbred flat racing in North America. Prev. Vet. Med. 2017, 139, 99–104. [Google Scholar] [CrossRef] [Green Version]
- Kristoffersen, M.; Parkin, T.D.H.; Singer, E.R. Catastrophic biaxial proximal sesamoid bone fractures in UK Thoroughbred races (1999–2004): Horse characteristics and racing history. Equine Vet. J. 2010, 42, 420–424. [Google Scholar] [CrossRef] [PubMed]
- Parkin, T.D.H.; Clegg, P.D.; French, N.P.; Proudman, C.J.; Riggs, C.M.; Singer, E.R.; Webbon, P.M.; Morgan, K.L. Catastrophic fracture of the lateral condyle of the third descriptions and pre-existing pathology. Vet. J. 2006, 171, 157–165. [Google Scholar] [CrossRef] [PubMed]
- Kane, A.J.; Stover, S.M.; Gardner, I.A.; Case, J.T.; Johnson, B.J.; Read, D.H.; Ardans, A.A. Horseshoe characteristics as possible risk factors for fatal musculoskeletal injury of Thoroughbred racehorses. Am. J. Vet. Res. 1996, 57, 1147–1152. [Google Scholar]
- Hill, A.E.; Gardner, I.A.; Carpenter, T.E.; Stover, S.M. Effects of injury to the suspensory apparatus, exercise, and horseshoe characteristics on the risk of lateral condylar fracture and suspensory apparatus failure in forelimbs of Thoroughbred racehorses. Am. J. Vet. Res. 2004, 65, 1508–1517. [Google Scholar] [CrossRef] [PubMed]
- Hernandez, J.A.; Scollay, M.C.; Hawkins, D.L.; Corda, J.A.; Krueger, T.M. Evaluation of horseshoe characteristics and high-speed exercise history as possible risk factors for catastrophic musculoskeletal injury in Thoroughbred racehorses. Am. J. Vet. Res. 2005, 66, 1314–1320. [Google Scholar] [CrossRef] [PubMed] [Green Version]
- Peel, J.A.; Peel, M.B.; Davies, H.M.S. The effect of gallop training on hoof angle in Thoroughbred racehorses. Equine Vet. J. 2006, 38, 431–434. [Google Scholar] [CrossRef]
- Dabareiner, R.M.; Carter, G.K. Diagnosis, treatment, and farriery for horses with chronic heel pain. Vet. Clin. North Am.-Equine Pract. 2003, 19, 417–441. [Google Scholar] [CrossRef]
- Kane, A.J.; Stover, S.M.; Gardner, I.A.; Bock, K.B.; Case, J.T.; Johnson, B.J.; Anderson, M.L.; Barr, B.C.; Daft, B.M.; Kinde, H.; et al. Hoof size, shape, and balance as possible risk factors for catastrophic musculoskeletal injury of Thoroughbred racehorses. Am. J. Vet. Res. 1998, 59, 1545–1552. [Google Scholar]
- Anderson, T.M.; McIlwraith, C.W.; Douay, P. The role of conformation in musculoskeletal problems in the racing Thoroughbred. Equine Vet. J. 2004, 36, 571–575. [Google Scholar] [CrossRef]
- Holroyd, K.; Dixon, J.J.; Mair, T.; Bolas, N.; Bolt, D.M.; David, F.; Weller, R. Variation in foot conformation in lame horses with different foot lesions. Vet. J. 2013, 195, 361–365. [Google Scholar] [CrossRef]
- Eliashar, E.; McGuigan, M.P.; Wilson, A.M. Relationship of foot conformation and force applied to the navicular bone of sound horses at the trot. Equine Vet. J. 2004, 36, 431–435. [Google Scholar] [CrossRef] [PubMed]
- Day, P.; Butts, D.; Pfau, T.; Pardoe, C.; Weller, R. Does hoof deformation differ between horses with collapsed heels and horses with non-collapsed heels? J. Equine Vet. Sci. 2013, 10, 859. [Google Scholar] [CrossRef]
- Yoshihara, E.; Takahashi, T.; Otsuka, N.; Isayama, T.; Tomiyama, T.; Hiraga, A.; Wada, S. Heel movement in horses: Comparison between glued and nailed horse shoes at different speeds. Equine Vet. J. 2010, 42, 431–435. [Google Scholar] [CrossRef] [PubMed]
- Mahaffey, C.A.; Peterson, M.L.; Thomason, J.J.; McIlwraith, C.W. Dynamic testing of horseshoe designs at impact on synthetic and dirt Thoroughbred racetrack materials. Equine Vet. J. 2016, 48, 97–102. [Google Scholar] [CrossRef] [PubMed]
- Pardoe, C.H.; Mcguigan, M.P.; Rogerst, K.M.; Rowet, L.L.; Wilson, A.M.; Basic, V.; Royal, T.; College, V.; Mymms, N. The effect of shoe material on the kinetics and kinematics of foot slip at impact on concrete. Equine Vet. J. 2001, 33, 70–73. [Google Scholar] [CrossRef] [PubMed]
- Balch, O.K.; Clayton, H.M.; Lanovaz, J.L. Weight- and length- induced changes in limb kinematics in trotting horses. Proc. Am. Assoc. Equine Pract. 1996, 42, 218–219. [Google Scholar]
- Willemen, M.A.; Savelberg, H.H.C.M.; Barneveld, A. The improvement of the gait quality of sound trotting warmblood horses by normal shoeing and its effect on the load on the lower forelimb. Livest. Prod. Sci. 1997, 52, 145–153. [Google Scholar] [CrossRef]
- Day, P.; Collins, L.; Horan, K.; Weller, R.; Pfau, T. The Effect of Tungsten Road Nails on Upper Body Movement Asymmetry in Horses Trotting on Tarmac. J. Equine Vet. Sci. 2020, 90, 1–5. [Google Scholar] [CrossRef]
- British Horseracing Authority. British Horseracing Authority Rules of Racing 2 May 2022, version 2022.2. p. 69. Available online: https://rules.britishhorseracing.com/#!/book/34 (accessed on 20 August 2022).
- Horan, K.; Kourdache, K.; Coburn, J.; Day, P.; Carnall, H.; Harborne, D.; Brinkley, L.; Hammond, L.; Millard, S.; Lancaster, B.; et al. The effect of horseshoes and surfaces on horse and jockey centre of mass displacements at gallop. PLoS ONE 2021, 16, e0257820. [Google Scholar] [CrossRef]
- Horan, K.; Kourdache, K.; Coburn, J.; Day, P.; Brinkley, L.; Carnall, H.; Harborne, D.; Hammond, L.; Millard, S.; Pfau, T. Jockey Perception of Shoe and Surface Effects on Hoof-Ground Interactions and Implications for Safety in the Galloping Thoroughbred Racehorse. J. Equine Vet. Sci. 2021, 97, 103327. [Google Scholar] [CrossRef]
- Witte, T.H.; Hirst, C.V.; Wilson, A.M. Effect of speed on stride parameters in racehorses at gallop in field conditions. J. Exp. Biol. 2006, 209, 4389–4397. [Google Scholar] [CrossRef] [PubMed] [Green Version]
- Barrey, E.; Evans, S.E.; Evans, D.L.; Curtis, R.A.; Quinton, R.; Rose, R.J. Locomotion evaluation for racing in thoroughbreds. Equine Vet. J. 2001, 33, 99–103. [Google Scholar] [CrossRef] [PubMed]
- Robilliard, J.J.; Pfau, T.; Wilson, A.M. Gait characterisation and classification in horses. J. Exp. Biol. 2007, 210, 187–197. [Google Scholar] [CrossRef] [PubMed] [Green Version]
- Johnson, J.L.; Moore-Colyer, M. The relationship between range of motion of lumbosacral flexion-extension and canter velocity of horses on a treadmill. Equine Vet. J. 2009, 41, 301–303. [Google Scholar] [CrossRef] [PubMed]
- Barstow, A. Does ‘ hacking ’ surface type affect equine forelimb foot placement, movement symmetry or hoof impact deceleration during ridden walk and trot exercise? Equine Vet. J. 2019, 51, 108–114. [Google Scholar] [CrossRef]
- Chateau, H.; Holden, L.; Robin, D.; Falala, S.; Pourcelot, P.; Estoup, P.; Denoix, J.M.; Crevier-Denoix, N. Biomechanical analysis of hoof landing and stride parameters in harness trotter horses running on different tracks of a sand beach (from wet to dry) and on an asphalt road. Equine Vet. J. 2010, 42, 488–495. [Google Scholar] [CrossRef]
- Ratzlaff, M.H.; Wilson, P.D.; Hutton, D.V.; Slinker, B.K. Relationships between hoof-acceleration patterns of galloping horses and dynamic properties of the track. Am. J. Vet. Res. 2005, 66, 589–595. [Google Scholar] [CrossRef]
- Clanton, C.; Kobluk, C.; Robinson, R.A.; Gordon, B. Monitoring surface conditions of a Thoroughbred racetrack. J. Am. Vet. Med. Assoc. 1991, 198, 613–620. [Google Scholar]
- Setterbo, J.J.; Fyhrie, P.B.; Hubbard, M.; Upadhyaya, S.K.; Stover, S.M. Dynamic properties of a dirt and a synthetic equine racetrack surface measured by a track-testing device. Equine Vet. J. 2013, 45, 25–30. [Google Scholar] [CrossRef]
- Bertram, J.E.A.; Gutmann, A. Motions of the running horse and cheetah revisited: Fundamental mechanics of the transverse and rotary gallop. J. R. Soc. Interface 2009, 6, 549–559. [Google Scholar] [CrossRef] [Green Version]
- Pfau, T.; Witte, T.H.; Wilson, A.M. Centre of mass movement and mechanical energy fluctuation during gallop locomotion in the Thoroughbred racehorse. J. Exp. Biol. 2006, 209, 3742–3757. [Google Scholar] [CrossRef] [PubMed] [Green Version]
- Tabor, D. The physical meaning of indentation and scratch hardness. Br. J. Appl. Phys. 1956, 7, 159–166. [Google Scholar] [CrossRef]
- Roepstorff, L.; Johnston, C.; Drevemo, S. The effect of shoeing on kinetics and kinematics during the stance phase. Equine Vet. J. 1999, 31, 279–285. [Google Scholar] [CrossRef] [PubMed]
- Back, W.; van Schie, M.H.; Pol, J.N. Synthetic shoes attenuate hoof impact in the trotting warmblood horse. Equine Comp. Exerc. Physiol. 2006, 3, 143–151. [Google Scholar] [CrossRef] [Green Version]
- Willemen, M.A.; Savelberg, H.H.C.M.; Barneveld, A. The effect of orthopaedic shoeing on the force exerted by the deep digital flexor tendon on the navicular bone in horses. Equine Vet. J. 1999, 31, 25–30. [Google Scholar] [CrossRef]
- Huang, W.; Yaraghi, N.A.; Yang, W.; Velazquez-olivera, A.; Li, Z.; Ritchie, R.O.; Kisailus, D.; Stover, S.M.; Mckittrick, J. A natural energy absorbent polymer composite: The equine hoof wall. Acta Biomater. 2019, 90, 267–277. [Google Scholar] [CrossRef]
- Roepstorff, L.; Johnston, C.; Drevemo, S. In vivo and in vitro heel expansion in relation to shoeing and frog pressure. Equine Vet. J. 2001, 33, 54–57. [Google Scholar] [CrossRef]
- Hagen, J.; Hüppler, M.; Geiger, S.M.; Mäder, D.; Häfner, F.S. Modifying the Height of Horseshoes: Effects of Wedge Shoes, Studs, and Rocker Shoes on the Phalangeal Alignment, Pressure Distribution, and Hoof-Ground Contact During Motion. J. Equine Vet. Sci. 2017, 53, 8–18. [Google Scholar] [CrossRef]
- Chateau, H.; Degueurce, C.; Denoix, J.-M. Effects of egg-bar shoes on the 3-dimensional kinematics of the distal forelimb in horses walking on a sand track. Equine Vet. J. 2006, 38, 377–382. [Google Scholar] [CrossRef]
- Clayton, H.M.; Starke, S.D.; Merritt, J.S. Individual Limb Contributions to Centripetal Force Generation during Circular Trot. Equine Vet. J. 2014, 46, 38. [Google Scholar] [CrossRef] [Green Version]
- Clayton, H.M. Comparison of the stride of trotting horses trimmed with a normal and a broken-back hoof axis. Proc. Annu. Conv. Am. Assoc. Equine Pract. 1987, 33, 289–298. [Google Scholar]

| Horse–Jockey Pair ID | Shoe–Surface Combination | |||||||
|---|---|---|---|---|---|---|---|---|
| Aluminium–Artificial | Aluminium–Turf | Barefoot–Artificial | Barefoot–Turf | GluShu–Artificial | GluShu–Turf | Steel– Artificial | Steel–Turf | |
| 1 | 403 | 376 | 435 | 365 | 354 | 360 | 477 | 345 |
| 2 | 389 | 574 | 826 | 341 | ||||
| 3 | 903 | 379 | 465 | 582 | 332 | 307 | 670 | 811 |
| 4 | 397 | 411 | 332 | 378 | 386 | 552 | 291 | 537 |
| 5 | 776 | 655 | ||||||
| 6 | 506 | 344 | 371 | 590 | 423 | |||
| 7 | 210 | 627 | 409 | 249 | ||||
| 8 | 665 | 479 | 1054 | 339 | 315 | 664 | 684 | 449 |
| 9 | 443 | 533 | ||||||
| 10 | 499 | 605 | 480 | 488 | 637 | 534 | 425 | 538 |
| 11 | 922 | 432 | 473 | 299 | 616 | 504 | 915 | 361 |
| 13 | 571 | 622 | 414 | 350 | 416 | 495 | 404 | 544 |
| 14 | 382 | 350 | 271 | 275 | 389 | 331 | 294 | 365 |
| 15 | 319 | 586 | 384 | 930 | ||||
| Limb | Acceleration Parameter | Impact Mean (g) | 2 SD | Foot-Off Mean (g) | 2 SD | n | Mean Stride Time | 2 SD |
|---|---|---|---|---|---|---|---|---|
| All limbs | X-maximum | 44.16 | 67.85 | 16.55 | 20.65 | 41,183 | 2399.15 | 344.46 |
| X-minimum | −21.79 | 35.13 | −17.17 | 17.85 | 41,183 | |||
| Y-maximum | 98.31 | 127.82 | 89.22 | 72.21 | 40,844 | |||
| Y-minimum | −34.27 | 54.32 | −38.11 | 44.08 | 40,844 | |||
| Z-maximum | 88.73 | 128.02 | 49.93 | 41.13 | 40,691 | |||
| Z-minimum | −38.83 | 49.25 | −30.46 | 39.28 | 40,691 | |||
| Combined Forelimb | X-maximum | 36.96 | 47.27 | 14.57 | 18.60 | 20,882 | 2403.59 | 350.90 |
| X-minimum | −19.62 | 28.35 | −17.26 | 18.47 | 20,882 | |||
| Y-maximum | 87.68 | 99.21 | 95.46 | 66.70 | 20,543 | |||
| Y-minimum | −33.89 | 51.21 | −34.88 | 36.67 | 20,543 | |||
| Z-maximum | 89.23 | 120.27 | 45.76 | 40.39 | 20,882 | |||
| Z-minimum | −37.13 | 45.88 | −28.97 | 42.96 | 20,882 | |||
| Leading Forelimb | X-maximum | 42.38 | 49.43 | 14.61 | 20.08 | 8781 | 2411.34 | 334.76 |
| X-minimum | −20.72 | 31.83 | −16.69 | 16.91 | 8781 | |||
| Y-maximum | 94.42 | 97.16 | 95.70 | 64.88 | 8633 | |||
| Y-minimum | −36.57 | 51.39 | −34.53 | 34.30 | 8633 | |||
| Z-maximum | 102.19 | 123.69 | 46.83 | 44.98 | 8781 | |||
| Z-minimum | −35.39 | 38.42 | −29.86 | 43.14 | 8781 | |||
| Non-Leading Forelimb | X-maximum | 30.72 | 37.07 | 13.32 | 14.47 | 8641 | 2405.54 | 342.77 |
| X-minimum | −17.37 | 22.84 | −17.33 | 19.64 | 8641 | |||
| Y-maximum | 78.00 | 83.84 | 91.63 | 63.04 | 8450 | |||
| Y-minimum | −27.69 | 38.68 | −32.79 | 31.60 | 8450 | |||
| Z-maximum | 67.93 | 85.40 | 43.83 | 36.58 | 8641 | |||
| Z-minimum | −36.64 | 48.57 | −27.94 | 41.75 | 8641 | |||
| Combined Hindlimb | X-maximum | 51.56 | 81.29 | 18.58 | 21.84 | 20,301 | 2394.59 | 337.47 |
| X-minimum | −24.02 | 40.47 | −17.09 | 17.19 | 20,301 | |||
| Y-maximum | 109.06 | 148.30 | 82.91 | 75.31 | 20,301 | |||
| Y-minimum | −34.65 | 57.29 | −41.38 | 49.64 | 20,301 | |||
| Z-maximum | 88.20 | 135.71 | 54.32 | 40.06 | 19,809 | |||
| Z-minimum | −40.62 | 52.34 | −32.03 | 34.71 | 19,809 | |||
| Leading Hindlimb | X-maximum | 59.38 | 85.87 | 19.82 | 22.62 | 8719 | 2405.71 | 321.97 |
| X-minimum | −27.07 | 42.25 | −16.27 | 17.18 | 8719 | |||
| Y-maximum | 123.44 | 150.61 | 77.82 | 72.50 | 8719 | |||
| Y-minimum | −37.45 | 55.64 | −39.76 | 46.93 | 8719 | |||
| Z-maximum | 98.53 | 120.37 | 51.75 | 36.95 | 8606 | |||
| Z-minimum | −41.37 | 62.88 | −30.21 | 35.67 | 8606 | |||
| Non-Leading Hindlimb | X-maximum | 39.53 | 57.21 | 16.25 | 19.08 | 8384 | 2401.12 | 321.97 |
| X-minimum | −19.05 | 32.45 | −17.20 | 14.84 | 8384 | |||
| Y-maximum | 87.07 | 120.04 | 83.80 | 67.21 | 8384 | |||
| Y-minimum | −30.82 | 52.33 | −40.37 | 45.89 | 8384 | |||
| Z-maximum | 65.58 | 89.33 | 55.99 | 40.33 | 8223 | |||
| Z-minimum | −39.20 | 39.22 | −33.47 | 32.39 | 8223 |
Publisher’s Note: MDPI stays neutral with regard to jurisdictional claims in published maps and institutional affiliations. |
© 2022 by the authors. Licensee MDPI, Basel, Switzerland. This article is an open access article distributed under the terms and conditions of the Creative Commons Attribution (CC BY) license (https://creativecommons.org/licenses/by/4.0/).
Share and Cite
Horan, K.; Coburn, J.; Kourdache, K.; Day, P.; Carnall, H.; Brinkley, L.; Harborne, D.; Hammond, L.; Peterson, M.; Millard, S.; et al. Hoof Impact and Foot-Off Accelerations in Galloping Thoroughbred Racehorses Trialling Eight Shoe–Surface Combinations. Animals 2022, 12, 2161. https://doi.org/10.3390/ani12172161
Horan K, Coburn J, Kourdache K, Day P, Carnall H, Brinkley L, Harborne D, Hammond L, Peterson M, Millard S, et al. Hoof Impact and Foot-Off Accelerations in Galloping Thoroughbred Racehorses Trialling Eight Shoe–Surface Combinations. Animals. 2022; 12(17):2161. https://doi.org/10.3390/ani12172161
Chicago/Turabian StyleHoran, Kate, James Coburn, Kieran Kourdache, Peter Day, Henry Carnall, Liam Brinkley, Dan Harborne, Lucy Hammond, Mick Peterson, Sean Millard, and et al. 2022. "Hoof Impact and Foot-Off Accelerations in Galloping Thoroughbred Racehorses Trialling Eight Shoe–Surface Combinations" Animals 12, no. 17: 2161. https://doi.org/10.3390/ani12172161
APA StyleHoran, K., Coburn, J., Kourdache, K., Day, P., Carnall, H., Brinkley, L., Harborne, D., Hammond, L., Peterson, M., Millard, S., & Pfau, T. (2022). Hoof Impact and Foot-Off Accelerations in Galloping Thoroughbred Racehorses Trialling Eight Shoe–Surface Combinations. Animals, 12(17), 2161. https://doi.org/10.3390/ani12172161