
Influence of Using Perforated Plastic Flooring Beneath the Waterline on Growth Performance, Litter Quality, and Footpad Health of Broiler Chickens: A Field Study

 , , and
Abstract
:Simple Summary
Abstract
1. Introduction
2. Materials and Methods
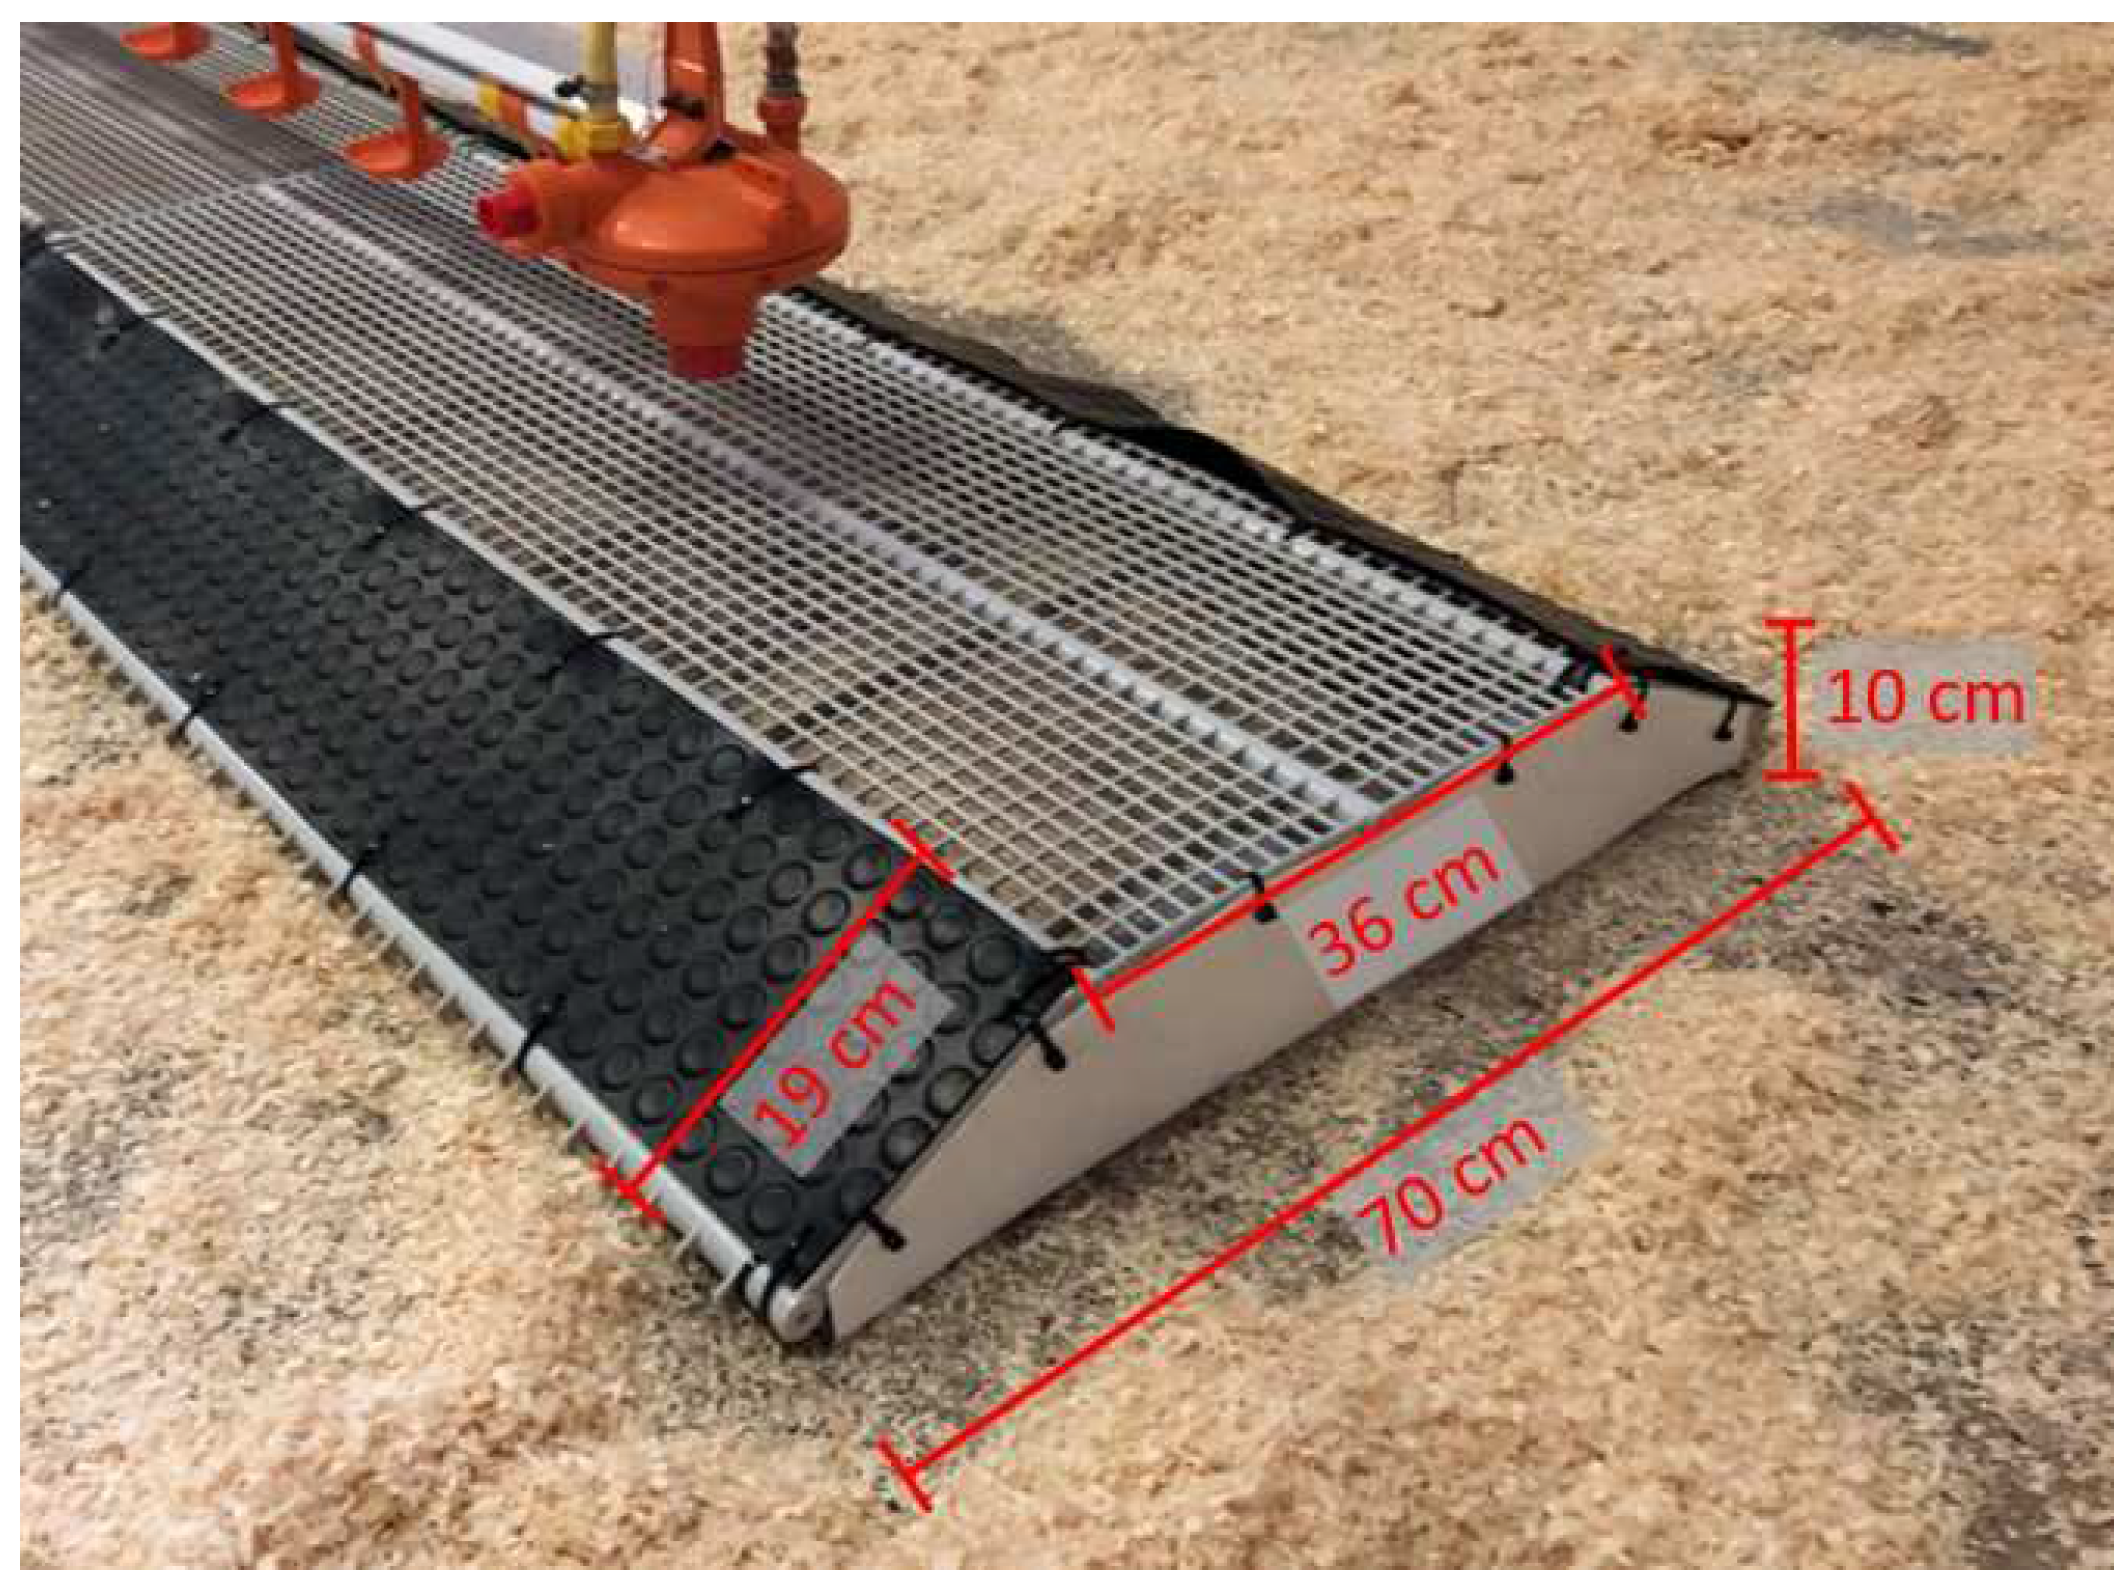
2.1. Animal Housing and Experimental Design
2.2. Diets
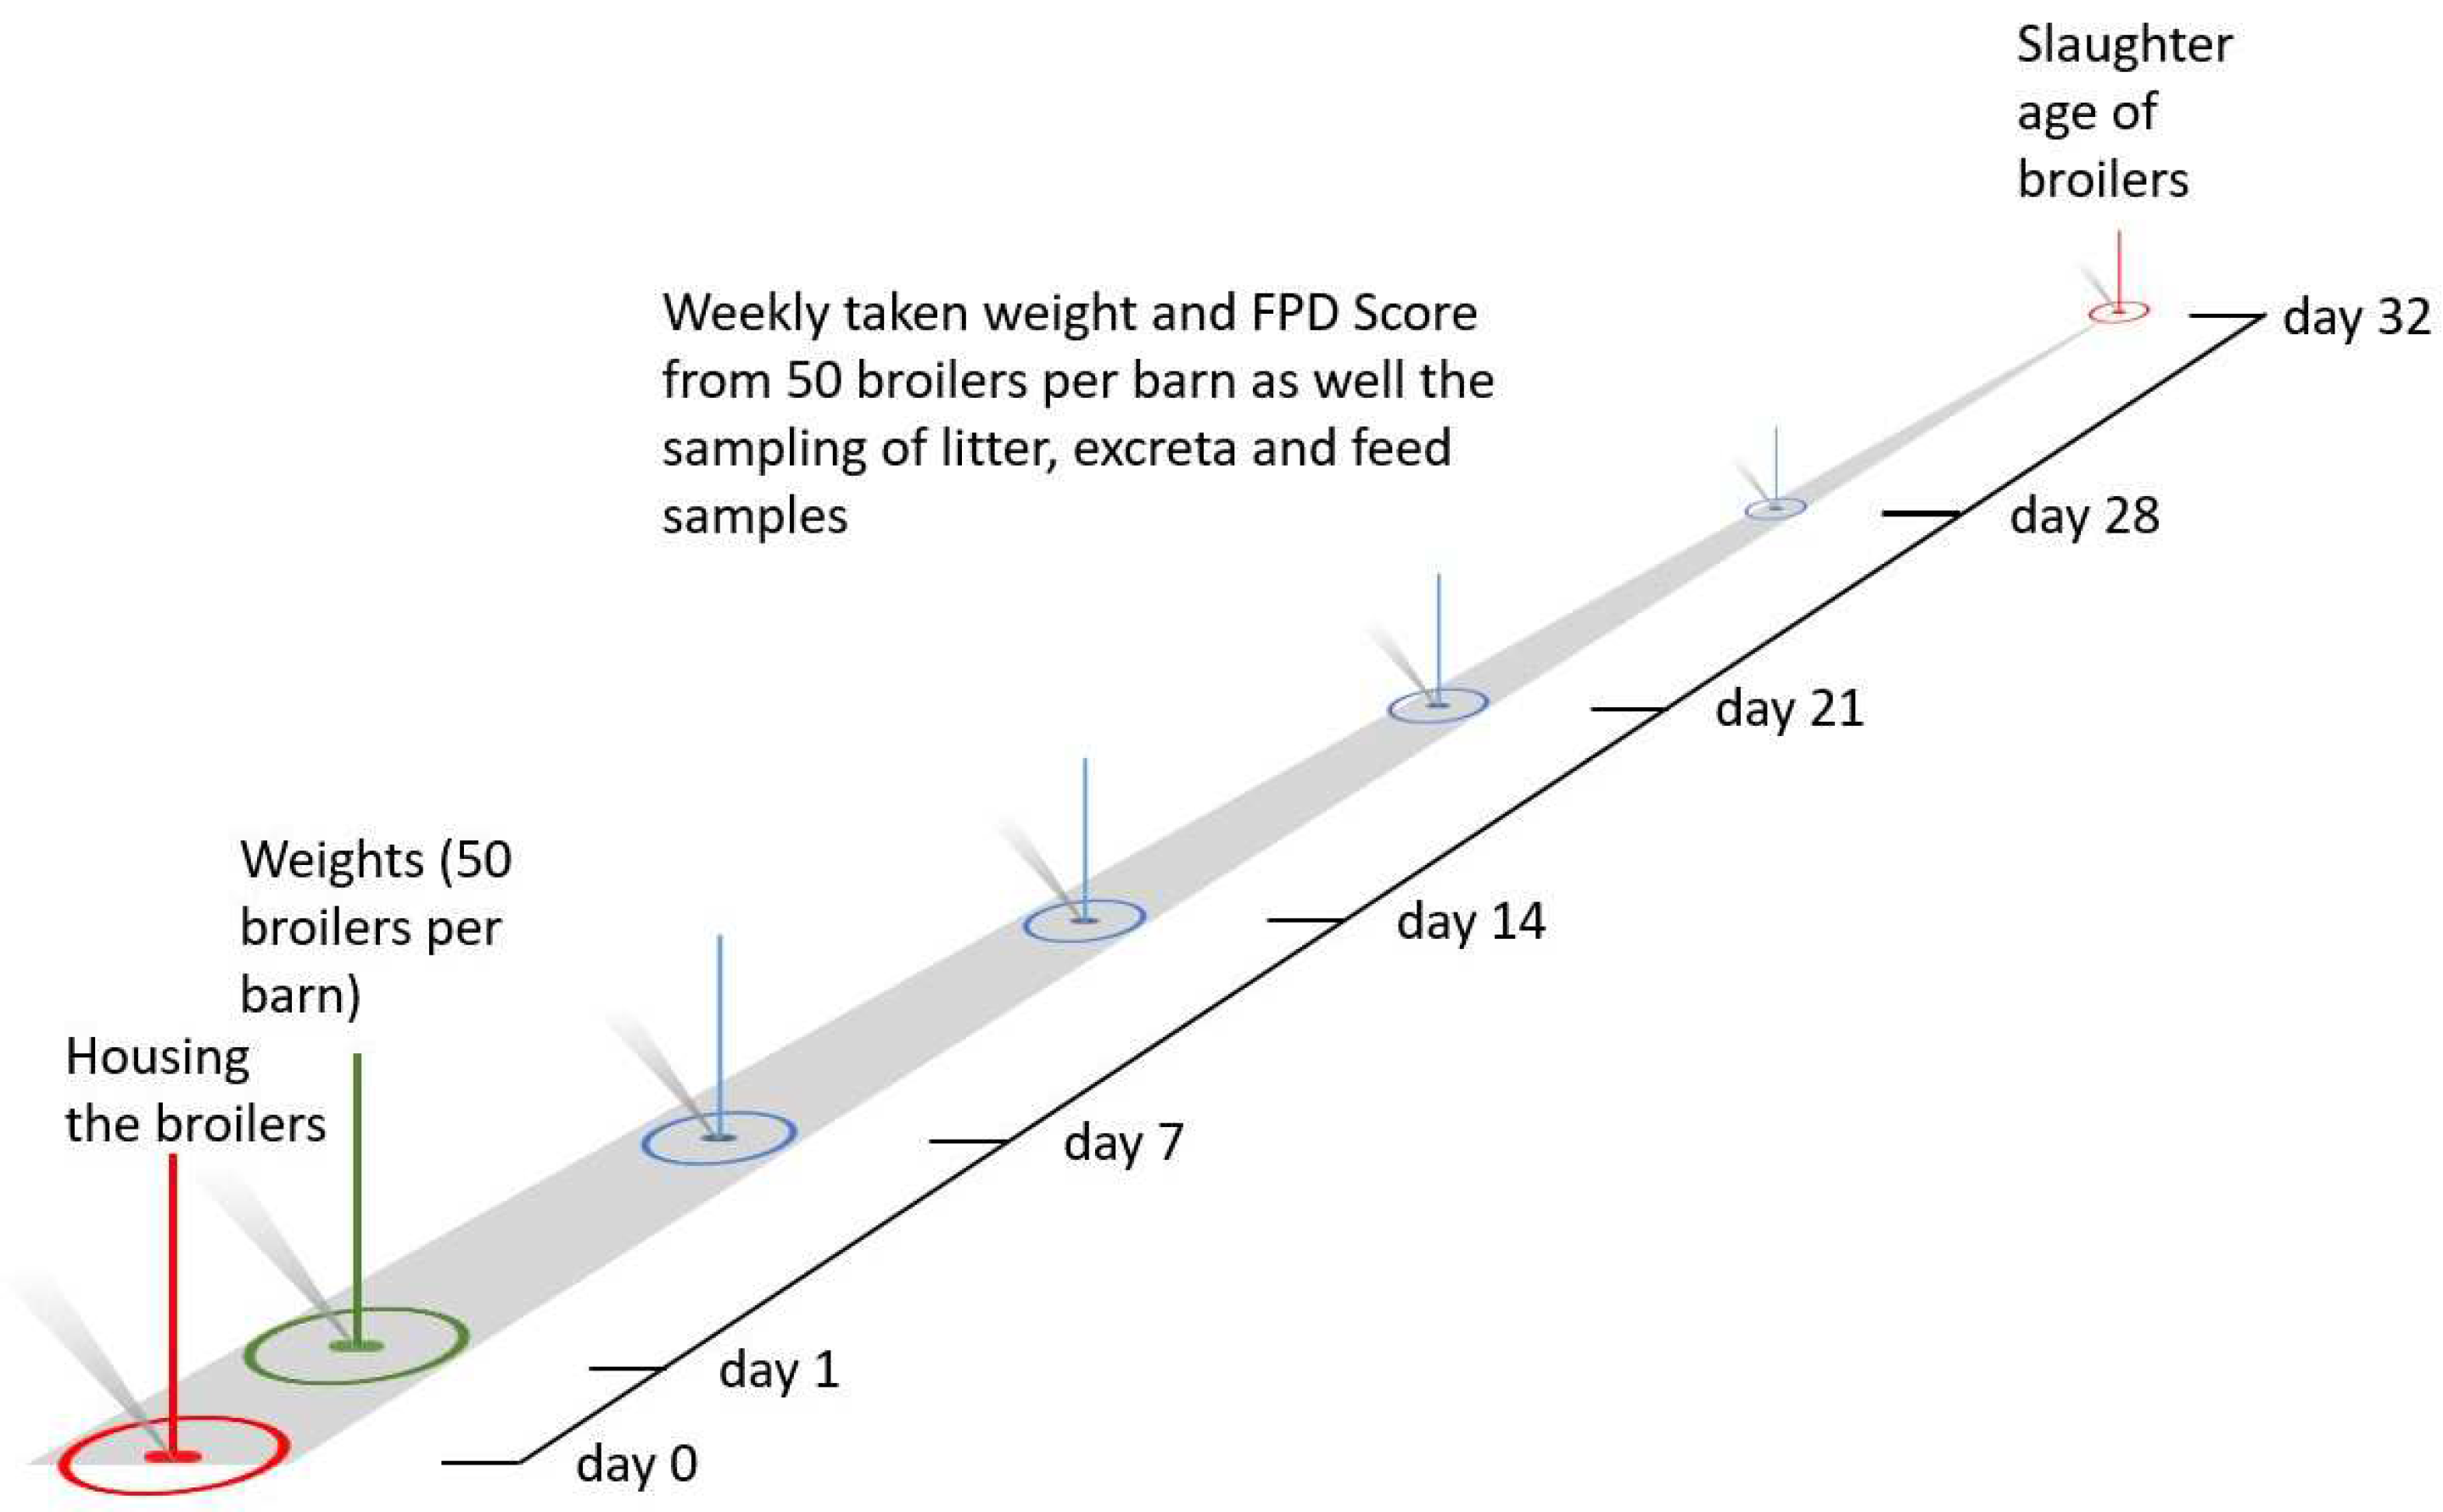
2.3. Measurements
2.3.1. Growth Performance
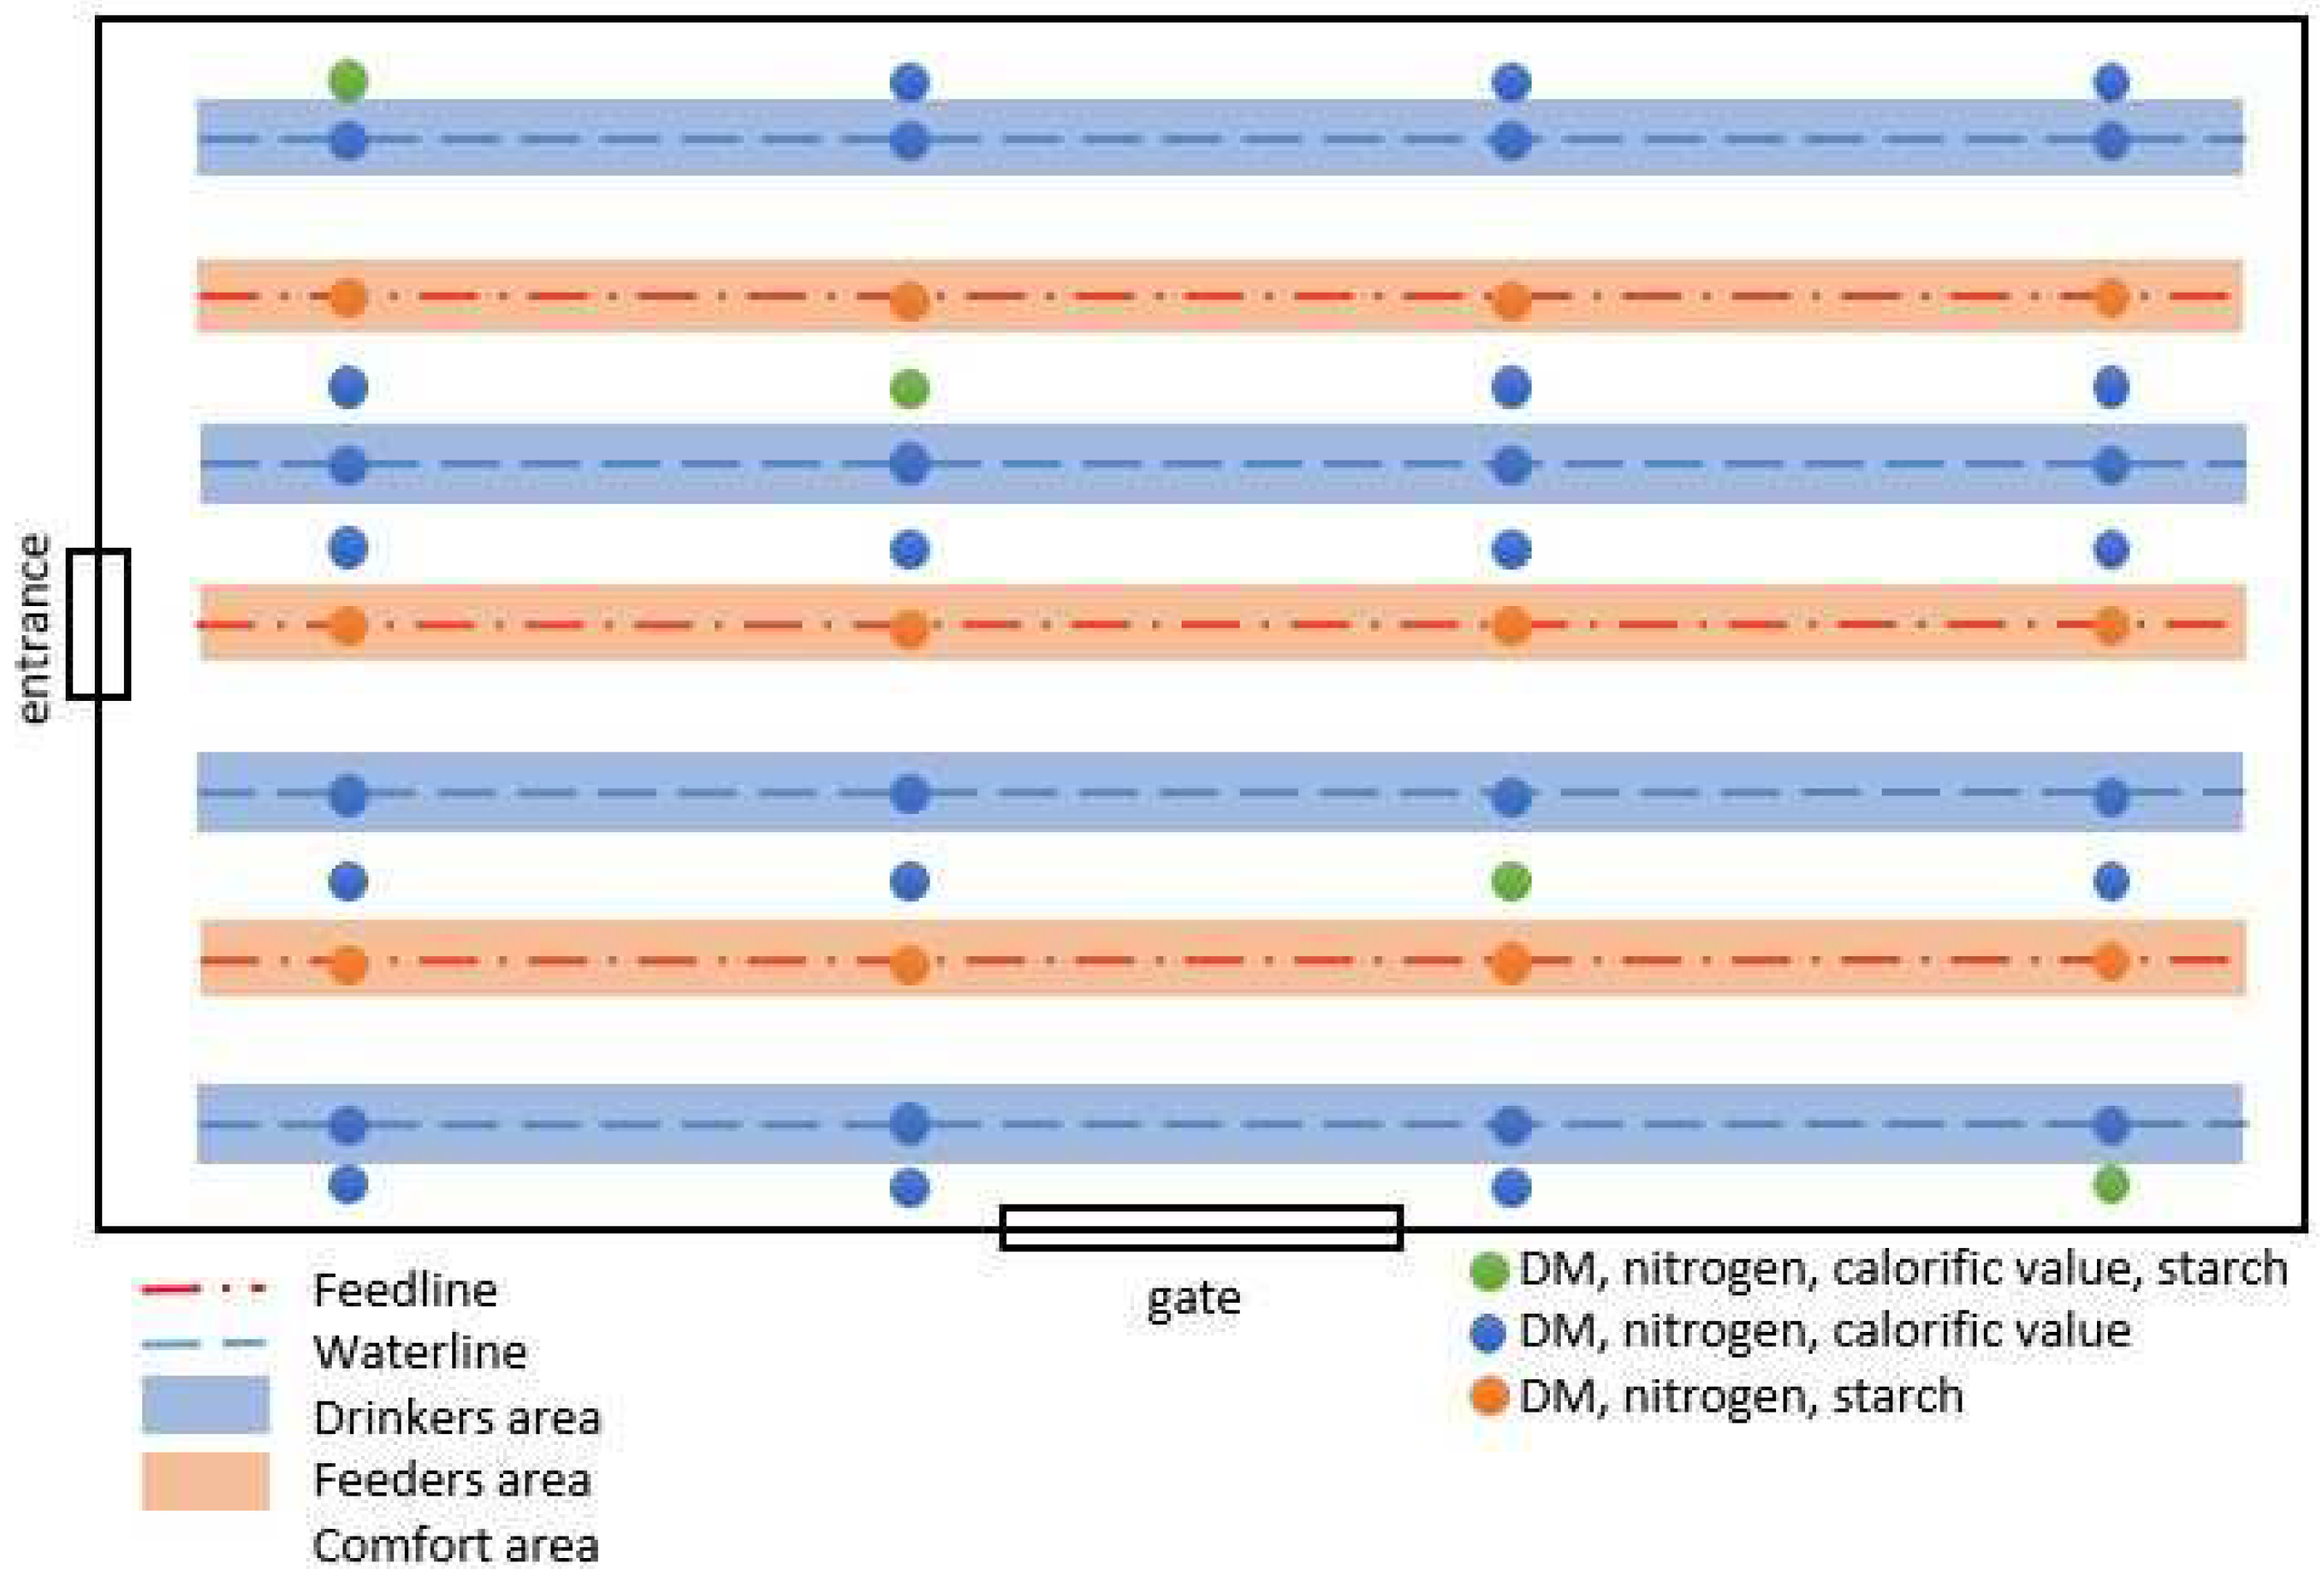
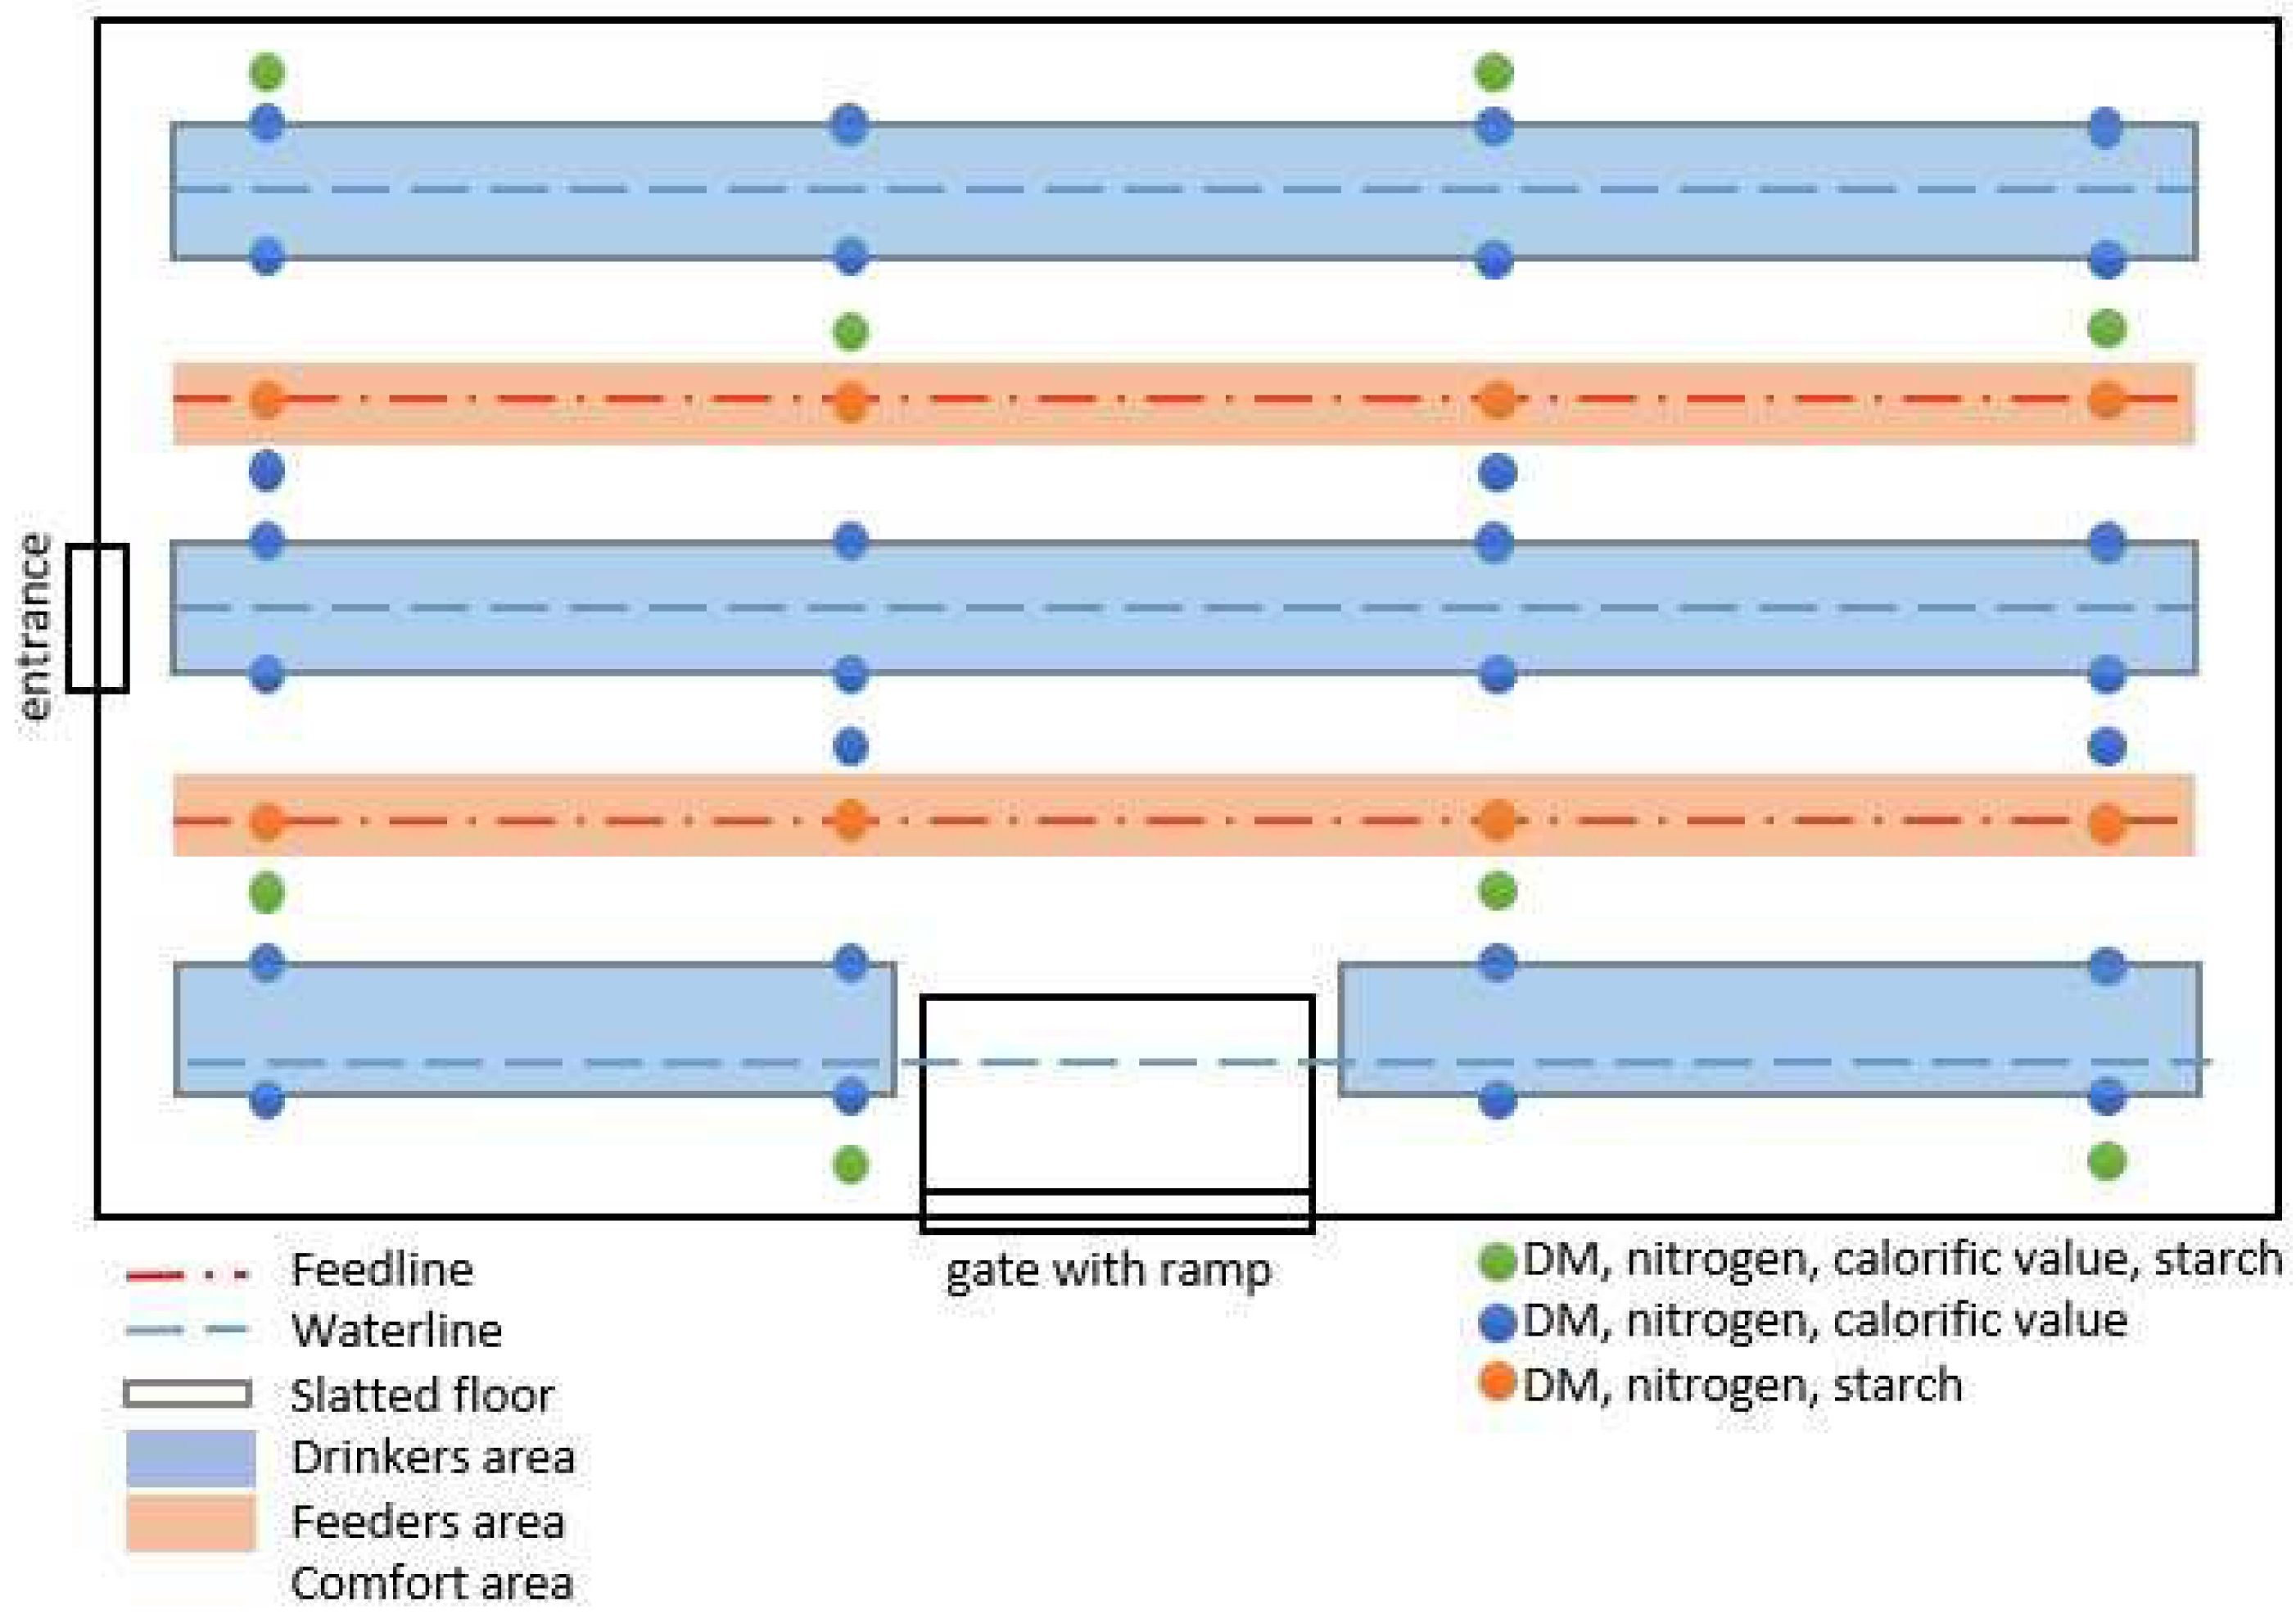
2.3.2. Excreta and Litter Quality and Foot Pad Scoring
2.4. Analysis
2.5. Statistcal Analysis
3. Results
3.1. Growth Performance
3.2. Litter Sampling
3.3. Footpad Health
4. Discussion
4.1. Impact on Growth Performance
4.2. Impact on Litter Quality
4.3. Impact on Footpad Dermatitis
5. Conclusions
Author Contributions
Funding
Institutional Review Board Statement
Informed Consent Statement
Data Availability Statement
Acknowledgments
Conflicts of Interest
References
- Bessei, W. Impact of animal welfare on worldwide poultry production. Worlds Poult. Sci. J. 2018, 74, 211–224. [Google Scholar] [CrossRef]
- Bergmann, S.; Schwarzer, A.; Wilutzky, K.; Louton, H.; Bachmeier, J.; Schmidt, P.; Erhard, M.; Rauch, E. Behavior as welfare indicator for the rearing of broilers in an enriched husbandry environment—A field study. J. Vet. Behav. 2017, 19, 90–101. [Google Scholar] [CrossRef]
- Council Directive 2007/43/EC of 28 June 2007 Laying down Minimum Rules for the Protection of Chickens Kept for Meat Production (Text with EEA Relevance). Article 2 Definitions. Available online: https://eur-lex.europa.eu/eli/dir/2007/43/oj (accessed on 4 May 2022).
- Bilgili, S.; Hess, J.; Blake, J.; Macklin, K.; Saenmahayak, B.; Sibley, J. Influence of bedding material on footpad dermatitis in broiler chickens. J. Appl. Poult. Res. 2009, 18, 583–589. [Google Scholar] [CrossRef]
- Bessei, W. Welfare of broilers: A review. Worlds Poult. Sci. J. 2006, 62, 455–466. [Google Scholar] [CrossRef]
- Sandilands, V.; Hocking, P.M. Alternative Systems for Poultry: Health, Welfare and Productivity; Centre for Agriculture and Bioscience: Oxfordshire, UK, 2012. [Google Scholar]
- Kamphues, J.; Youssef, I.; El-Wahab, A.A.; Üffing, B.; Witte, M.; Tost, M. Influences of feeding and housing on footpad health in hens and turkeys. Über. Tierernährung 2011, 39, 147–193. [Google Scholar]
- Shepherd, E.; Fairchild, B. Footpad dermatitis in poultry. Poult. Sci. 2010, 89, 2043–2051. [Google Scholar] [CrossRef]
- Martland, M.F. Wet litter as a cause of plantar pododermatitis, leading to foot ulceration and lameness in fattening turkeys. Avian Pathol. 1984, 13, 241. [Google Scholar] [CrossRef] [PubMed]
- Geraedts, L.H.J. Leg disorders caused by litter conditions and the influence of the type of litter and of litter cultivations on the results of turkeys. Turkeys 1983, 31, 20–25. [Google Scholar]
- Martrenchar, A.; Boilletot, E.; Huonnic, D.; Pol, F. Risk factors for foot pad dermatitis in chicken and turkey broilers in France. Prev. Vet. Med. 2002, 52, 213–226. [Google Scholar] [CrossRef]
- Mayne, R.K.; Else, R.W.; Hocking, P.M. High litter moisture alone is sufficient to cause footpad dermatitis in growing turkeys. Br. Poult. Sci. 2007, 48, 538–545. [Google Scholar] [CrossRef]
- Spindler, B.R.; Weber, M.; Hartung, J. Pathological and histological condition of leg bones of tom turkeys grown under different animal densities. In Proceedings of the 12th International Congress on Animal Hygiene 2 (ISAH): Animals and Environment, Warsaw, Poland, 4–8 September 2005; Krynski, A., Ed.; ISAH: Warsaw, Poland, 2005; pp. 32–36. [Google Scholar]
- De Jong, I.C.; Gunnink, H.; Van Harn, J. Wet litter not only induces footpad dermatitis but also reduces overall welfare, technical performance, and carcass yield in broiler chickens. J. Appl. Poult. Res. 2014, 23, 51–58. [Google Scholar] [CrossRef]
- De Jong, I.C.; Van Harn, J.; Gunnink, H.; Hindle, V.; Lourens, A. Footpad dermatitis in Dutch broiler flocks: Prevalence and factors of influence. Poult. Sci. 2012, 91, 1569–1574. [Google Scholar] [CrossRef] [PubMed]
- Toghyani, M.; Gheisari, A.; Modaresi, M.; Tabeidian, S.A.; Toghani, M. Effect of different litter material on performance and behavior of broiler chickens. Appl. Anim. Behav. Sci. 2010, 122, 48–52. [Google Scholar] [CrossRef]
- Collett, S.R. Nutrition and wet litter problems in poultry. Anim. Feed. Sci. Technol. 2012, 173, 65–75. [Google Scholar] [CrossRef]
- Schumacher, C.; Krautwald-Junghanns, M.-E.; Huebel, J.; Bergmann, S.; Maedl, N.; Erhard, M.H.; Berk, J.; Pees, M.; Truyen, U.; Bartels, T. Influence of litter moisture around drinkers and feeders on foot pad health status of fattening turkeys during the early rearing period. Berl. Munch. Tierarztl. Wochenschr. 2012, 125, 379–385. [Google Scholar] [PubMed]
- Thomas, D.; Ravindran, V.; Thomas, D.; Camden, B.; Cottam, Y.; Morel, P.; Cook, C. Influence of stocking density on the performance, carcass characteristics and selected welfare indicators of broiler chickens. N. Z. Vet. J. 2004, 52, 76–81. [Google Scholar] [CrossRef] [PubMed]
- Youssef, I.M.; Beineke, A.; Rohn, K.; Kamphues, J. Effects of high dietary levels of soybean meal and its constituents (potassium, oligosaccharides) on foot pad dermatitis in growing turkeys housed on dry and wet litter. Arch. Anim. Nutr. 2011, 65, 148–162. [Google Scholar] [CrossRef] [PubMed]
- Mayne, R.K. A review of the aetiology and possible causative factors of foot pad dermatitis in growing turkeys and broilers. Worlds Poult. Sci. J. 2005, 61, 256–267. [Google Scholar] [CrossRef]
- Jensen, L.S.; Martinson, R.; Schumaier, G. A foot pad dermatitis in turkey poults associated with soybean meal. Poult. Sci. 1970, 49, 76–82. [Google Scholar] [CrossRef]
- Eichner, G.; Vieira, S.; Torres, C.; Coneglian, J.; Freitas, D.; Oyarzabal, O. Litter moisture and footpad dermatitis as affected by diets formulated on an all-vegetable basis or having the inclusion of poultry by-product. J. Appl. Poult. Res. 2007, 16, 344–350. [Google Scholar] [CrossRef]
- Youssef, I.; Beineke, A.; Rohn, K.; Kamphues, J. Experimental study on effects of litter material and its quality on footpad dermatitis in growing turkeys. Int. J. Poult. Sci. 2010, 9, 1125–1135. [Google Scholar] [CrossRef] [Green Version]
- Abd El-Wahab, A.; Visscher, C.; Beineke, A.; Beyerbach, M.; Kamphues, J. Effects of high electrolyte contents in the diet and using floor heating on development and severity of foot pad dermatitis in young turkeys. J. Anim. Physiol. Anim. Nutr. 2013, 97, 39–47. [Google Scholar] [CrossRef]
- Jacobs, L.; Persia, M.E.; Siman-Tov, N.; McCoy, J.; Ahmad, M.; Lyman, J.; Good, L. Impact of water sanitation on broiler chicken production and welfare parameters. J. Appl. Poult. Res. 2020, 29, 258–268. [Google Scholar] [CrossRef]
- Abd El-Wahab, A.; Beineke, A.; Beyerbach, M.; Visscher, C.F.; Kamphues, J. Effects of floor heating and litter quality on the development and severity of foot pad dermatitis in young turkeys. Avian Dis. 2011, 55, 429–434. [Google Scholar] [CrossRef]
- Chuppava, B.; Visscher, C.; Kamphues, J. Effect of different flooring designs on the performance and foot pad health in broilers and Turkeys. Animals 2018, 8, 70. [Google Scholar] [CrossRef] [PubMed] [Green Version]
- Martland, M.F. Ulcerative dermatitis in broiler chickens: The effects of wet litter. Avian Pathol. 1985, 14, 353. [Google Scholar] [CrossRef]
- Ekstrand, C.; Algers, B.; Svedberg, J. Rearing conditions and footpad dermatitis in Swedish broiler chickens. Prev. Vet. Med. 1997, 31, 167–174. [Google Scholar] [CrossRef]
- Farghly, M.F.; Mahrose, K.M.; Cooper, R.G.; Ullah, Z.; Rehman, Z.; Ding, C. Sustainable floor type for managing turkey production in a hot climate. Poult. Sci. 2018, 97, 3884–3890. [Google Scholar] [CrossRef]
- Da Costa, M.J.; Grimes, J.L.; Oviedo-Rondón, E.O.; Barasch, I.; Evans, C.; Dalmagro, M.; Nixon, J. Footpad dermatitis severity on turkey flocks and correlations with locomotion, litter conditions, and body weight at market age. J. Appl. Poult. Res. 2014, 23, 268–279. [Google Scholar] [CrossRef]
- Li, H.; Wen, X.; Alphin, R.; Zhu, Z.; Zhou, Z. Effects of two different broiler flooring systems on production performances, welfare, and environment under commercial production conditions. Poult. Sci. 2017, 96, 1108–1119. [Google Scholar] [CrossRef]
- De Almeida, E.A.; Arantes de Souza, L.F.; Sant’Anna, A.C.; Bahiense, R.N.; Macari, M.; Furlan, R.L. Poultry rearing on perforated plastic floors and the effect on air quality, growth performance, and carcass injuries—Experiment 1: Thermal comfort. Poult. Sci. 2017, 96, 3155–3162. [Google Scholar] [CrossRef] [PubMed]
- Çavuşoğlu, E.; Petek, M.; Abdourhamane, I.M.; Akkoc, A.; Topal, E. Effects of different floor housing systems on the welfare of fast-growing broilers with an extended fattening period. Arch. Anim. Breed. 2018, 61, 9–16. [Google Scholar] [CrossRef] [Green Version]
- Heerkens, J.L.; Delezie, E.; Kempen, I.; Zoons, J.; Ampe, B.; Rodenburg, T.B.; Tuyttens, F.A. Specific characteristics of the aviary housing system affect plumage condition, mortality and production in laying hens. Poult. Sci. 2015, 94, 2008–2017. [Google Scholar] [CrossRef] [PubMed]
- Bilal, K.; Mehmood, S.; Akram, M.; Imran, S.; Sahota, A.; Javed, K.; Hussain, J.; Ashfaq, H. Growth performance of broilers under two rearing systems in three different housing zones in an environmentally controlled house during winter. J. Anim. Plant Sci. 2014, 24, 1039–1044. [Google Scholar]
- Dawkins, M.S.; Donnelly, C.; Jones, T. Chicken welfare is influenced more by housing conditions than by stocking density. Nature 2004, 427, 342–344. [Google Scholar] [CrossRef]
- Welfare Quality®. Assessment Protocol for Poultry (Broilers, Laying Hens); Welfare Quality® Consortium: Lelystad, The Netherlands, 2009. [Google Scholar]
- Aviagen. ROSS 308: Broiler Performance Objectives. 2019. Available online: http://eu.aviagen.com/tech-center/download/1339/Ross308-308FF-BroilerPO2019-EN.pdf (accessed on 22 February 2022).
- Lingens, J.B.; Abd El-Wahab, A.; Ahmed, M.; Schubert, D.C.; Sürie, C.; Visscher, C. Effects of Early Nutrition of Hatched Chicks on Welfare and Growth Performance: A Pilot Study. Animals 2021, 11, 2888. [Google Scholar] [CrossRef]
- Dersjant-Li, Y.; Awati, A.; Kromm, C.; Evans, C. A direct fed microbial containing a combination of three-strain Bacillus sp. can be used as an alternative to feed antibiotic growth promoters in broiler production. J. Appl. Anim. Nutr. 2013, 2, e11. [Google Scholar] [CrossRef] [Green Version]
- Leitfaden Befunddaten in der Geflügelschlachtung. 2022. Available online: https://www.q-s.de/futter-tiere-fleisch/fleisch-und-fleischwaren-schlachtung-zerlegung.html (accessed on 23 April 2022).
- Naumann, C.; Bassler, R. Methoden der landwirtschaftlichen Forschungs-und Untersuchungsanstalt, Biochemische Untersuchung von Futtermitteln. In Methodenbuch III (Einschließlich der Achten Ergänzungen); VDLUFA: Darmstadt, Germany, 2012. [Google Scholar]
- Haug, R.T. The Practical Handbook of Compost Engineering; Lewis Publishers: Boca Raton, FL, USA, 1993. [Google Scholar]
- Animal Feeding Stuffs, Animal Products, and Faeces or Urine—Determination of Gross Calorific Value—Bomb Calorimeter Method (ISO 9831:1998); German Version EN ISO 9831:2003. Available online: https://www.din.de/de/mitwirken/normenausschuesse/nal/veroeffentlichungen/wdc-beuth:din21:66176845 (accessed on 24 April 2022).
- Schmatz, M.J.; Siqueira, J.A.C.; Nogueira, C.E.C.; de Souza, S.N.M.; Tokura, L.K.; Menezes, K.L.; dos Santos, D.B. Evaluation of the gross and net claorific value of residues of wood pine and araucaria from reforestation. Afr. J. Agric. Res. Okt. 2016, 11, 4157–4161. [Google Scholar]
- Havenstein, G.B.; Ferket, P.R.; Qureshi, M.A. Growth, livability, and feed conversion of 1957 versus 2001 broilers when fed representative 1957 and 2001 broiler diets. Poult. Sci. 2003, 82, 1500–1508. [Google Scholar] [CrossRef]
- Engberg, R.M.; Hedemann, M.S.; Steenfeldt, S.; Jensen, B.B. Influence of whole wheat and xylanase on broiler performance and microbial composition and activity in the digestive tract. Poult. Sci. 2004, 83, 925–938. [Google Scholar] [CrossRef]
- Pedroso, A.A.; Menten, J.F.; Lambais, M.R.; Racanicci, A.M.; Longo, F.A.; Sorbara, J.O. Intestinal bacterial community and growth performance of chickens fed diets containing antibiotics. Poult. Sci. 2006, 85, 747–752. [Google Scholar] [CrossRef] [PubMed]
- Coates, M.E.; Fuller, R.; Harrison, G.F.; Lev, M.; Suffolk, S.F. A comparison of the growth of chicks in the Gustafsson germ-free apparatus and in a conventional environment, with and without dietary supplements of penicillin. Br. J. Nutr. 1963, 17, 150. [Google Scholar] [CrossRef] [PubMed]
- Blokhuis, H.J. The effect of a sudden change in floor type on pecking behaviour in chicks. Appl. Anim. Behav. Sci. 1989, 22, 65–73. [Google Scholar] [CrossRef]
- Garcês, A.; Afonso, S.M.S.; Chilundo, A.; Jairoce, C.T.S. Evaluation of different litter materials for broiler production in a hot and humid environment: 1. Litter characteristics and quality. J. Appl. Poult. Res. 2013, 22, 168–176. [Google Scholar] [CrossRef]
- Norring, M.; Kaukonen, E.; Valros, A. The use of perches and platforms by broiler chickens. Appl. Anim. Behav. Sci. 2016, 184, 91–96. [Google Scholar] [CrossRef]
- Pereira, D.F.; Nääs, I.; Romanini, C.; Salgado, D.; Pereira, G. Broiler breeder behavior and egg production as function of environmental temperature. Rev. Bras. Cienc. Avic. 2007, 9, 9–16. [Google Scholar] [CrossRef] [Green Version]
- Braun, E.J. Osmoregulatory system of birds. In Sturkie’s Avian Physiology; Braun, E.J., Ed.; Academic Press: London, UK, 2015; pp. 285–300. [Google Scholar]
- Qafoku, O.S.; Cabrera, M.L.; Windham, W.R.; Hill, N.S. Rapid Methods to Determine Potentially Mineralizable Nitrogen in Broiler Litter. J. Environ. Qual. 2001, 30, 217–221. [Google Scholar] [CrossRef]
- Ahn, H.K.; Richard, T.L.; Choi, H.L. Mass and thermal balance during composting of poultry manure—Wood shavings mixture at different aeration rates. Process Biochem. 2007, 42, 215–223. [Google Scholar] [CrossRef]
- Almeida, E.A.; Anna, A.C.S.; Growe, T.G.; Macari, M.; Furlan, R.L. Poultry Rearing on Perforated Plastic Floors and the Effect on Air Quality, Growth Performance, and Carcass injuries—Experiment 2: Heat Stress Situation. Poult. Sci. 2018, 97, 1954–1960. [Google Scholar] [CrossRef]


| Item (%) | Starter | Rearing I | Rearing II | Finisher |
|---|---|---|---|---|
| Crude protein | 21.60 | 19.00 | 19.00 | 19.50 |
| Crude fat | 5.80 | 4.50 | 4.70 | 8.20 |
| Crude fiber | 2.50 | 3.50 | 3.20 | 3.30 |
| Crude ash | 5.50 | 5.20 | 5.10 | 4.70 |
| Calcium | 0.90 | 0.75 | 0.70 | 0.60 |
| Phosphorus | 0.65 | 0.55 | 0.50 | 0.40 |
| Sodium | 0.16 | 0.16 | 0.15 | 0.14 |
| Lysine | 1.36 | 1.12 | 1.12 | 1.14 |
| Methionine | 0.60 | 0.52 | 0.54 | 0.29 |
| Methionine hydroxy-analog | 0.00 | 0.00 | 0.00 | 0.23 |
| 1 Metabolizable energy (MJ/kg) | 12.60 | 12.20 | 12.60 | 13.20 |
| Day of Life | Groups | p-Value | |
|---|---|---|---|
| CON | EG | ||
| 1 | 51.1 a ± 2.56 | 49.1 a ± 4.25 | 0.4025 |
| 7 | 198 a ± 19.4 | 197 a ± 8.90 | 0.8825 |
| 14 | 516 a ± 44.0 | 514 a ± 19.5 | 0.9224 |
| 21 | 1030 a ± 65.7 | 1006 a ± 91.8 | 0.6496 |
| 28 | 1658 a ± 78.9 | 1665 a ± 87.5 | 0.9011 |
| 32 (slaughterhouse data) | 2072 a ± 88.2 | 2013 a ± 71.1 | 0.2750 |
| Item | Groups | p-Value | |
|---|---|---|---|
| CON | EG | ||
| Feed intake (g/b/d) | 92.1 a ± 2.85 | 86.1 b ± 3.99 | 0.0324 |
| Water intake (ml/b/d) | 206.1 a ± 4.15 | 197.1 a ± 18.28 | 0.3176 |
| Water-feed ratio | 2.24 a ± 0.09 | 2.25 a ± 0.14 | 0.8824 |
| FCR | 1.48 a ± 0.02 | 1.40 b ± 0.03 | 0.0078 |
| ADG (g) | 62.7 a ± 2.65 | 61.0 a ± 2.22 | 0.3237 |
| Item | Day of Life (n = CON/EG) | Groups | p-Value | |
|---|---|---|---|---|
| CON | EG | |||
| DM (g/kg) | 7 (n = 255/235) | 703 b ± 169 | 760 a ± 165 | 0.0002 |
| 14 (n = 255/235) | 636 b ± 198 | 690 a ± 167 | 0.0013 | |
| 21 (n = 255/235) | 640 a ± 215 | 627 a ± 182 | 0.4583 | |
| 28 (n = 255/235) | 604 a ± 207 | 594 a ± 183 | 0.5676 | |
| Nitrogen (g/kg DM) | 7 (n = 255/235) | 27.7 a ± 6.08 | 26.6 a ± 7.67 | 0.0736 |
| 14 (n = 255/235) | 34.2 a ± 2.84 | 33.4 b ± 2.71 | 0.0018 | |
| 21 (n = 255/235) | 38.0 b ± 2.56 | 38.7 a ± 3.56 | 0.0159 | |
| 28 (n = 255/235) | 41.8.0 b ± 2.56 | 43.8 a ± 3.04 | 0.0001 | |
| Calorific value (J/g DM) | 7 (n = 195) | 18137 a ± 732 | 17974 b ± 771 | 0.0334 |
| 14 (n = 195) | 17352 a ± 321 | 17251 b ± 309 | 0.0018 | |
| 21 (n = 195) | 17122 a ± 321 | 16950 b ± 340 | 0.0001 | |
| 28 (n = 195) | 17421 a ± 415 | 16975 b ± 333 | 0.0001 | |
| Starch (g/kg DM) | 7 (n = 95) | 24.7 a ± 17.2 | 20.0 b ± 13.9 | 0.0437 |
| 14 (n = 95) | 20.7 a ± 7.25 | 21.6 a ± 12.6 | 0.5537 | |
| 21 (n = 95) | 22.8 b ± 4.05 | 28.7 a ± 13.6 | 0.0001 | |
| 28 (n = 95) | 35.6 a ± 10.4 | 32.3 b ± 9.43 | 0.0254 | |
| Area | Day of Life (n = CON/EG) | Groups | p-Value | |
|---|---|---|---|---|
| CON | EG | |||
| Comfort | 7 (n = 100/60) | 779 b ± 49.7 | 833 a ± 65.8 | 0.0001 |
| 14 (n = 100/60) | 722 b ± 76.6 | 772 a ± 61.4 | 0.0001 | |
| 21 (n = 100/60) | 749 a ± 77.6 | 729 a ± 87.0 | 0.1351 | |
| 28 (n = 100/60) | 693 a ± 133 | 714 a ± 86.7 | 0.2795 | |
| Drinkers | 7 (n = 80/120) | 606 b ± 96.9 | 756 a ± 85.1 | 0.0001 |
| 14 (n = 80/120) | 450 b ± 83.8 | 650 a ± 95.8 | 0.0001 | |
| 21 (n = 80/120) | 416 b ± 51.9 | 548 a ± 106 | 0.0001 | |
| 28 (n = 80/120) | 422 b ± 78.9 | 495 a ± 79.0 | 0.0001 | |
| Feeders | 7 (n = 60/40) | 834 b ± 39.2 | 867 a ± 37.9 | 0.0001 |
| 14 (n = 60/40) | 844 a ± 39.4 | 858 a ± 75.8 | 0.2217 | |
| 21 (n = 60/40) | 864 a ± 26.6 | 860 a ± 30.0 | 0.5313 | |
| 28 (n = 60/40) | 774 b ± 160 | 846 a ± 35.1 | 0.0069 | |
| Area | Day of Life (n = CON/EG) | Groups | p-Value | |
|---|---|---|---|---|
| CON | EG | |||
| Comfort | 7 (n = 100/60) | 24.5a ± 6.39 | 21.2 b ± 6.83 | 0.0023 |
| 14 (n = 100/60) | 33.9 a ± 2.30 | 32.5 b ± 2.15 | 0.0001 | |
| 21 (n = 100/60) | 37.1 b ± 1.54 | 37.9 a ± 1.60 | 0.0036 | |
| 28 (n = 100/60) | 41.1 a ± 2.73 | 41.5 a ± 2.43 | 0.3764 | |
| Drinkers | 7 (n = 80/120) | 30.5 a ± 4.97 | 29.3 a ± 6.29 | 0.1475 |
| 14 (n = 80/120) | 36.1 a ± 2.60 | 34.7 b ± 2.56 | 0.0003 | |
| 21 (n = 80/120) | 40.6 a ± 1.87 | 40.0 b ± 2.18 | 0.0344 | |
| 28 (n = 80/120) | 43.0 b ± 1.89 | 44.9 a ± 2.42 | 0.0001 | |
| Feeders | 7 (n = 60/40) | 27.7 a ± 4.03 | 22.7 b ± 6.04 | 0.0001 |
| 14 (n = 60/40) | 32.0 a ± 2.19 | 31.7 a ± 2.37 | 0.4673 | |
| 21 (n = 60/40) | 36.0 b ± 1.34 | 37.1 a ± 1.47 | 0.0001 | |
| 28 (n = 60/40) | 40.9 a ± 1.82 | 40.9 a ± 1.39 | 0.8863 | |
| Area | Day of Life (n = CON/EG) | Groups | p-Value | |
|---|---|---|---|---|
| CON | EG | |||
| Comfort | 7 (n = 100/60) | 18282 a ± 610 | 18427 a ± 880 | 0.2238 |
| 14 (n = 100/60) | 17365 a ± 293 | 17308 a ± 262 | 0.2228 | |
| 21 (n = 100/60) | 17052 a ± 244 | 17019 a ± 288 | 0.4330 | |
| 28 (n = 100/60) | 17356 a ± 386 | 17039 b ± 305 | 0.0001 | |
| Drinkers | 7 (n = 80/120) | 18206 a ± 682 | 17879 b ± 537 | 0.0002 |
| 14 (n = 80/120) | 17410 a ± 299 | 17281 b ± 287 | 0.0026 | |
| 21 (n = 80/120) | 17268 a ± 339 | 16963 b ± 340 | 0.0001 | |
| 28 (n = 80/120) | 17542 a ± 404 | 16998 b ± 304 | 0.0001 | |
| Day of Life | Groups | p-Value | |
|---|---|---|---|
| CON | EG | ||
| 7 | 0.73 b ± 0.84 | 1.47 a ± 1.17 | 0.0001 |
| 14 | 1.46 b ± 1.23 | 2.31 a ± 1.32 | 0.0001 |
| 21 | 2.56 a ± 1.68 | 1.91 b ± 1.48 | 0.0001 |
| 28 | 2.88 a ± 1.82 | 2.11 b ± 1.51 | 0.0001 |
Publisher’s Note: MDPI stays neutral with regard to jurisdictional claims in published maps and institutional affiliations. |
© 2022 by the authors. Licensee MDPI, Basel, Switzerland. This article is an open access article distributed under the terms and conditions of the Creative Commons Attribution (CC BY) license (https://creativecommons.org/licenses/by/4.0/).
Share and Cite
Sonnabend, S.-J.; Spieß, F.; Reckels, B.; Ahmed, M.F.E.; El-Wahab, A.A.; Sürie, C.; Lingens, J.B.; Visscher, C. Influence of Using Perforated Plastic Flooring Beneath the Waterline on Growth Performance, Litter Quality, and Footpad Health of Broiler Chickens: A Field Study. Animals 2022, 12, 1749. https://doi.org/10.3390/ani12141749
Sonnabend S-J, Spieß F, Reckels B, Ahmed MFE, El-Wahab AA, Sürie C, Lingens JB, Visscher C. Influence of Using Perforated Plastic Flooring Beneath the Waterline on Growth Performance, Litter Quality, and Footpad Health of Broiler Chickens: A Field Study. Animals. 2022; 12(14):1749. https://doi.org/10.3390/ani12141749
Chicago/Turabian StyleSonnabend, Sylvan-Justin, Fabian Spieß, Bernd Reckels, Marwa F. E. Ahmed, Amr Abd El-Wahab, Christian Sürie, Jan Berend Lingens, and Christian Visscher. 2022. "Influence of Using Perforated Plastic Flooring Beneath the Waterline on Growth Performance, Litter Quality, and Footpad Health of Broiler Chickens: A Field Study" Animals 12, no. 14: 1749. https://doi.org/10.3390/ani12141749
APA StyleSonnabend, S.-J., Spieß, F., Reckels, B., Ahmed, M. F. E., El-Wahab, A. A., Sürie, C., Lingens, J. B., & Visscher, C. (2022). Influence of Using Perforated Plastic Flooring Beneath the Waterline on Growth Performance, Litter Quality, and Footpad Health of Broiler Chickens: A Field Study. Animals, 12(14), 1749. https://doi.org/10.3390/ani12141749