Article

Ad Libitum Feeding in Broiler Breeder Hens Alters the Transcriptome of Granulosa Cells of Pre-Hierarchal Follicles

by
Laurie Francoeur
,
Claire S. Stephens
and
Patricia A. Johnson
*
Department of Animal Science, College of Agriculture and Life Sciences, Cornell University, Ithaca, NY 14853, USA
*
Author to whom correspondence should be addressed.
Animals 2021, 11(9), 2706; https://doi.org/10.3390/ani11092706
Submission received: 28 July 2021 / Revised: 1 September 2021 / Accepted: 9 September 2021 / Published: 16 September 2021
(This article belongs to the Special Issue Nutritional and Reproductive Efficiency in Poultry)

Abstract

:

Simple Summary

Broiler breeds of chickens have been bred for fast growth and feed efficiency, while laying breeds have been bred for optimal egg production. As a consequence of intense selective breeding in broiler breeds, egg production is greatly reduced and leads to inefficient reproduction. One strategy used by producers to improve egg production in broiler breeds has been to limit feed allowance. In this study, we aimed to identify differences in ovarian gene expression between broiler breeder hens fed high (ad libitum) and low feed allowances. Several differences in gene expression were identified, which may explain the decreased egg production seen in broiler breeder hens fed ad libitum. These results inform the poultry industry on the biology of broiler breeder hens fed ad libitum and how levels of high feed intake affect reproductive efficiency.

Abstract

Intense selective breeding of chickens has resulted in suboptimal egg production in broiler breeder hens. This reproductive phenotype is exacerbated by ad libitum feeding, which leads to excessive and disorganized follicular growth. One strategy used to improve broiler breeder hens’ reproductive efficiency is restricted feeding. In this study, we sought to identify transcriptional changes, which translate the level of dietary intake into increased follicle selection. Broiler breeder hens (n = 16 per group) were raised according to commercial guidelines until 28 weeks of age and then randomly assigned to an ad libitum diet (FF) or continued on a restricted diet (RF) for 6 weeks. Following dietary treatment, FF hens (n = 2) with excessive follicle selection and RF hens (n = 3) with normal follicle selection were selected for RNA-sequencing. Transcriptomes of granulosa cells from 6–8-mm follicles were sequenced to identify transcriptional differences in the follicle population from which selection was made for the preovulatory stage. Differential expression analysis identified several genes known to play a role in follicle development (CYP11A1, STAR, INHA, and INHBB) that are upregulated in FF hens. These changes in gene expression suggest earlier granulosa cell differentiation and steroidogenic competency in the granulosa layer from FF hens.

1. Introduction

Broiler chickens are selected for fast growth and feed efficiency, and laying hens are selected for optimal egg production. Selection pressure for ideal production traits has resulted in vastly different reproductive efficiencies between broiler breeders and laying hens. Although laying hens can lay almost one egg per day, broiler hens have aberrant follicle growth which often leads to erratic laying, multiple ovulations, and poor-quality eggs [1]. These events contribute to suboptimal reproduction in these hens. One strategy used to improve broiler breeder hens’ reproductive efficiency is restricted feeding, which results in an ovarian phenotype more like that of the laying hen. While restricting feed (RF) results in improved egg production compared to ad libitum feeding (FF), dietary change alone is not sufficient to reach the egg-laying efficiency seen in layer breeds. At the ovarian follicle level, FF broiler breeder hens have multiple hierarchies and significantly more preovulatory follicles than hens on a restricted diet [2,3]. Despite excessive follicle development, ovulation is erratic, resulting in low egg production. It is not known how feeding level directly impacts follicle selection and growth.
Follicle selection occurs when one follicle from a pool of growing follicles begins to become dominant and continues maturation until it ovulates [4]. In the hen, follicle selection is characterized by two important events: granulosa cell differentiation and the initiation of progesterone synthesis. Prior to selection, granulosa cells are said to be undifferentiated and steroidogenically incompetent [5]. Undifferentiated granulosa cells express low levels of the steroidogenic acute regulatory protein (STAR), luteinizing hormone receptor (LHR), cytochrome P450scc (CYP11A1), and follicle stimulating hormone receptor (FSHR) [6,7] (reviewed in [8]). At the time of selection, granulosa cells undergo transcriptional changes in key regulators and receptors. STAR and CYP11A1 expression increases [6,9] and follicles begin to produce progesterone [10], with the largest preovulatory follicle producing the highest amount of progesterone and stimulating the LH surge for ovulation [11,12]. In a reproductively efficient hen, the largest preovulatory follicle will ovulate each day and one 6–8-mm follicle will be selected to replace it and replenish the preovulatory follicle pool (reviewed in [4,8]). In the FF broiler breeder hen, there is a large number of unorganized preovulatory follicles [2], which contributes to the reproductive inefficiency of these birds. Although factors associated with follicle selection in laying hens have been identified [4,6,9], differences in pre-hierarchal follicle transcriptomes have not yet been studied in broiler breeder hens in response to dietary treatment.
In this study, we investigated transcriptional changes in granulosa cells of 6–8-mm follicles to identify factors that may be disrupting normal follicle selection in FF broiler breeder hens. Specifically, we hypothesized that the increased feed intake in these hens disrupts important regulators of follicle development, resulting in increased follicle numbers.

2. Materials and Methods

2.1. Animals

One-day-old broiler breeder chicks (Cobb 700, n = 32) were donated by Cobb-Vantress and raised in floor pens in Cornell University’s Poultry Facility according to commercial guidelines [13]. Birds were kept on a light cycle of 15 h of light and 9 h of dark. At 28 weeks of age, hens were randomly assigned to one of two pens and fed either an ad libitum diet (FF, n = 16) or were continued on a restricted feed diet of 146 g/day/bird (RF, n = 16) for an additional 6 weeks according to commercial guidelines [13] and as previously described in Stephens and Johnson, 2017 [14]. Throughout the length of the experiment, egg production per pen was measured daily. During the sixth week of the dietary treatment, hens were weighed, euthanized using CO2, and samples were collected. Egg production was calculated as eggs/hen/days in a one-week period. Egg production during weeks 1–5 are reported as these represented full weeks for both treatment groups. All animal procedures were approved by the Institutional Animal Care and Use Committee of Cornell University (protocol number 2009-0036).

2.2. Sample Collection

The liver, fat pad, and ovary were removed from the hen and weighed. Organ weights were normalized to the body weight. Upon collection, the ovary was placed in ice cold Krebs-Ringer bicarbonate buffer and follicles were collected and separated by size. Follicles from the 3–5-mm, 6–8-mm, and >9-mm size categories were counted and 6–8-mm follicles were removed. Granulosa cells were collected and pooled following the procedure outlined in Wang et al. [15] and stored in RLT lysis buffer at −80 °C until further processing.

2.3. RNA Extraction

Total RNA was extracted from granulosa cells using an RNeasy Mini kit with optional on-column DNase treatment (Qiagen Inc., Valencia, CA, USA). The quantity and purity of the samples were analyzed using spectrophotometry (Implen, Munich, Germany). RNA integrity was then determined by a Fragment Analyzer (Advanced Analytical, Ames, IA, USA). All samples had a RQN of >9.9.

2.4. RNA Sequencing and Quality Control

Samples were selected for RNA-sequencing based on the number of preovulatory follicles (>9-mm). For the FF group (n = 3), hens with more than 10 preovulatory follicles were selected to represent an excessive follicle selection phenotype. For the RF group (n = 3), hens with 6–7 preovulatory follicles were selected to represent a normal follicle selection phenotype. The granulosa cell layer from 6–8-mm follicles of these two phenotypes was collected as described above and used for RNA sequencing.
RNA samples were submitted to Cornell’s Transcriptional Regulation and Expression Facility for cDNA library preparation. Samples were enriched by PolyA+ RNA isolation using the NEBNext Poly(A) mRNA Magnetic Isolation Module (New England Biolabs, Ipswich, MA, USA). Libraries were then generated using the NEBNext Ultra II [Directional] RNA Library Prep Kit (New England Biolabs, Ipswich, MA, USA). Before sequencing, libraries were quantified using a Qubit 2.0 (dsDNA HS kit; Thermo Fisher, Waltham, MA, USA). cDNA libraries were sequenced on Illumina’s NextSeq500 (Illumina, San Diego, CA, USA) at a depth of 75 bp for a minimum of 31M reads per sample. FastQ files were first processed through trim-galore (Barbraham Institute, Cambridge, UK) as a quality control step to trim adaptors and filter for low quality reads. The sample files were then aligned to the Galgal6 genome using the RNA-seq aligner STAR [16]. A minimum of 91.7% reads were mapped to the genome in each sample (Table S1).
To verify for sample clustering by biological replicates, hclust in R was used [17]. This analysis identified one outlier in the FF group which was discarded in further analyses for a final sample of n = 2 in this group. A principle component analysis (PCA) was utilized to visualize the variance among samples.

2.5. RNA Sequencing Analysis

Differential expression analysis was conducted to identify differentially expressed genes (DEGs) between FF and RF hens using DeSEQ2. Criteria for DEGs were a false discovery rate (FDR) of <0.05, a log fold change of >1, and a minimum read count of 200. Gene ontology enrichment analysis with an FDR cutoff of 0.05 using ShinyGo v0.61 [18] was conducted on DEGs upregulated in FF and RF hens and generated the ten most significant terms. Additionally, Qiagen’s Ingenuity Pathway Analysis (IPA) was used to identify the predicted upstream regulators [19,20] of DEGs.

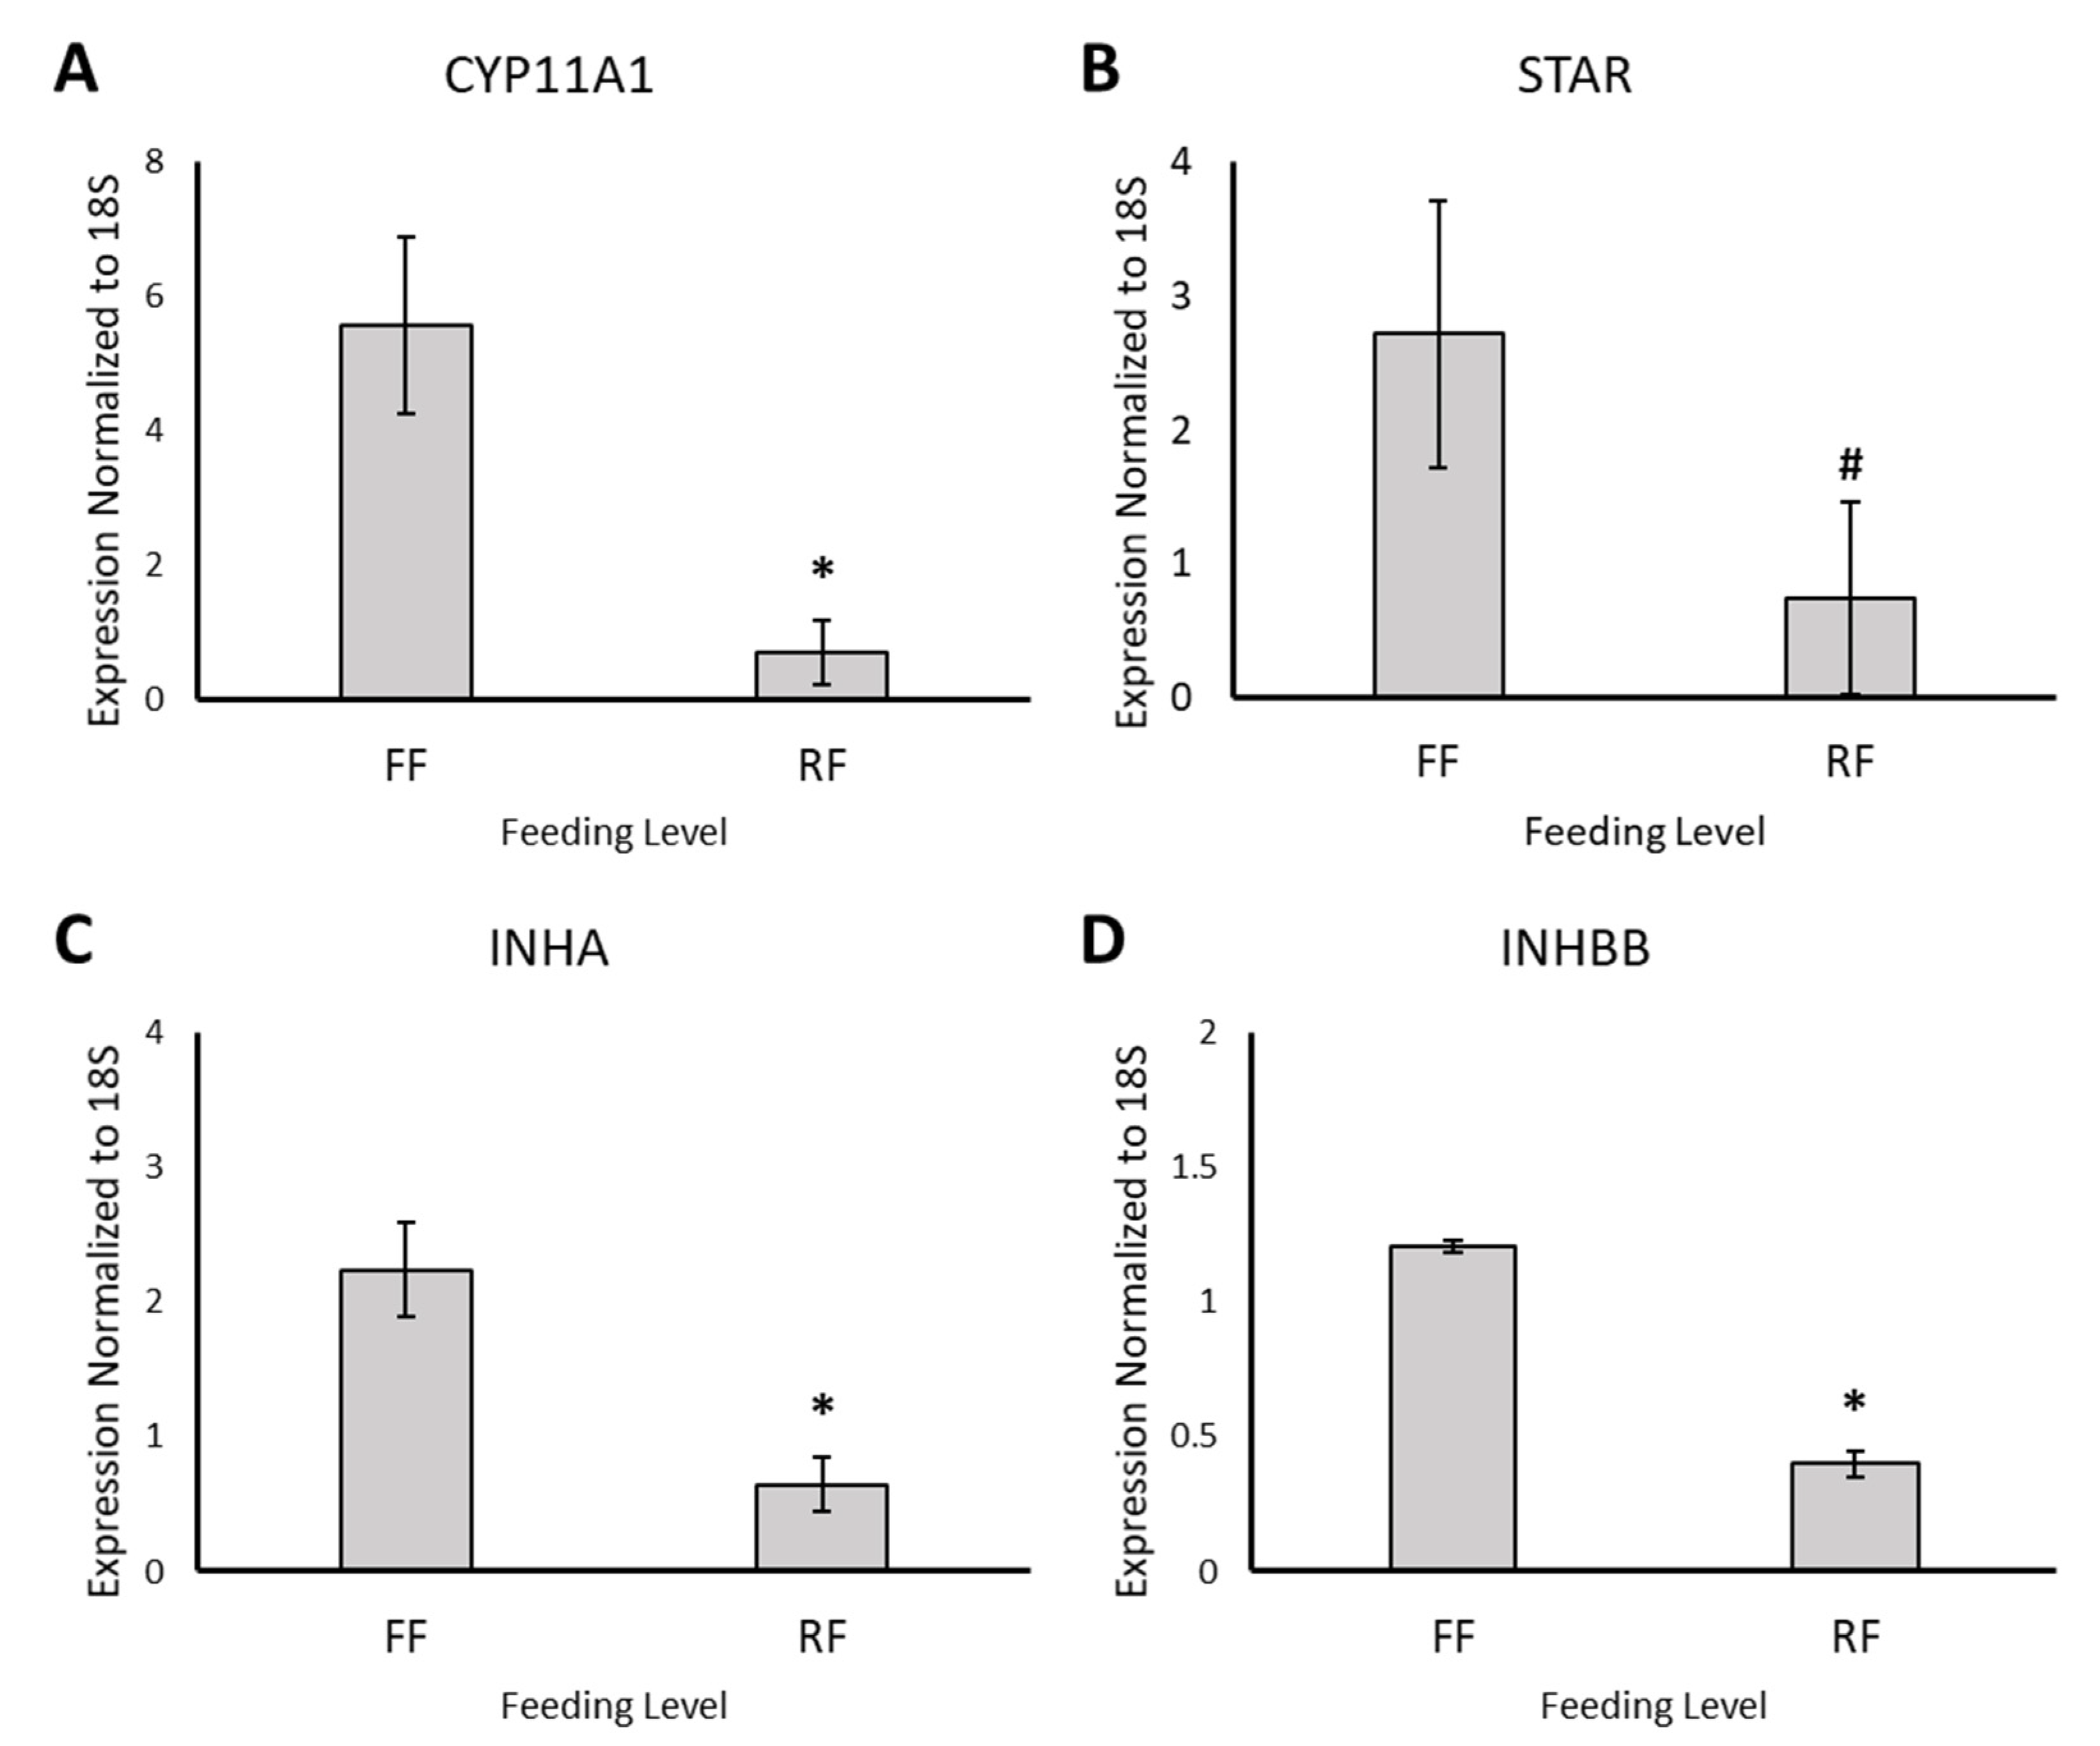
2.6. cDNA Synthesis and Real-Time qPCR

Gene expression of select DEGs (CYP11A1, STAR, INHA, and INHBB) was quantified using real-time qPCR to validate RNA-sequencing results. Total RNA from granulosa cells was extracted as described above. One µg of total RNA from each sample was reverse transcribed to cDNA in a 20-µL reaction using the High-Capacity cDNA Reverse Transcription kit (Applied Biosystems, Foster City, CA, USA).
The AB StepOnePlus Real-Time PCR System (Applied Biosystems, Foster City, CA, USA) was used for quantitative PCR. Each sample was analyzed in a 25-µL volume reaction with a final concentration of 1X for the Power SYBR Green (Applied Biosystems, Foster City, CA, USA) and 300 nM for the primers. Each reaction consisted of 1 µL of cDNA and samples, standards, no template controls, and reactions lacking reverse transcriptase were assessed in duplicates. Sample expression for each gene was determined from the standard curve and normalized to 18S expression. To measure the housekeeping gene, 18S primers from Ambion® QuantumRNA™ 18S Internal Standard (ThermoFisher Scientific, Waltham, MA, USA) were used. Previously published primer sequences were used for CYP11A1 and STAR [21]. Primers for INHA and INHBB were designed to span exon-exon junctions using Primer-BLAST [22]. Primer sequences for gene targets can be found in Table 1.

2.7. Statistical Analysis

All body parameters and mRNA expression data were compared between the RF and FF groups using PROC GLM of the SAS 9.4 software (SAS Institute Inc., Cary, NC, USA). Week was included as a fixed effect in the generalized linear model for egg production.

3. Results

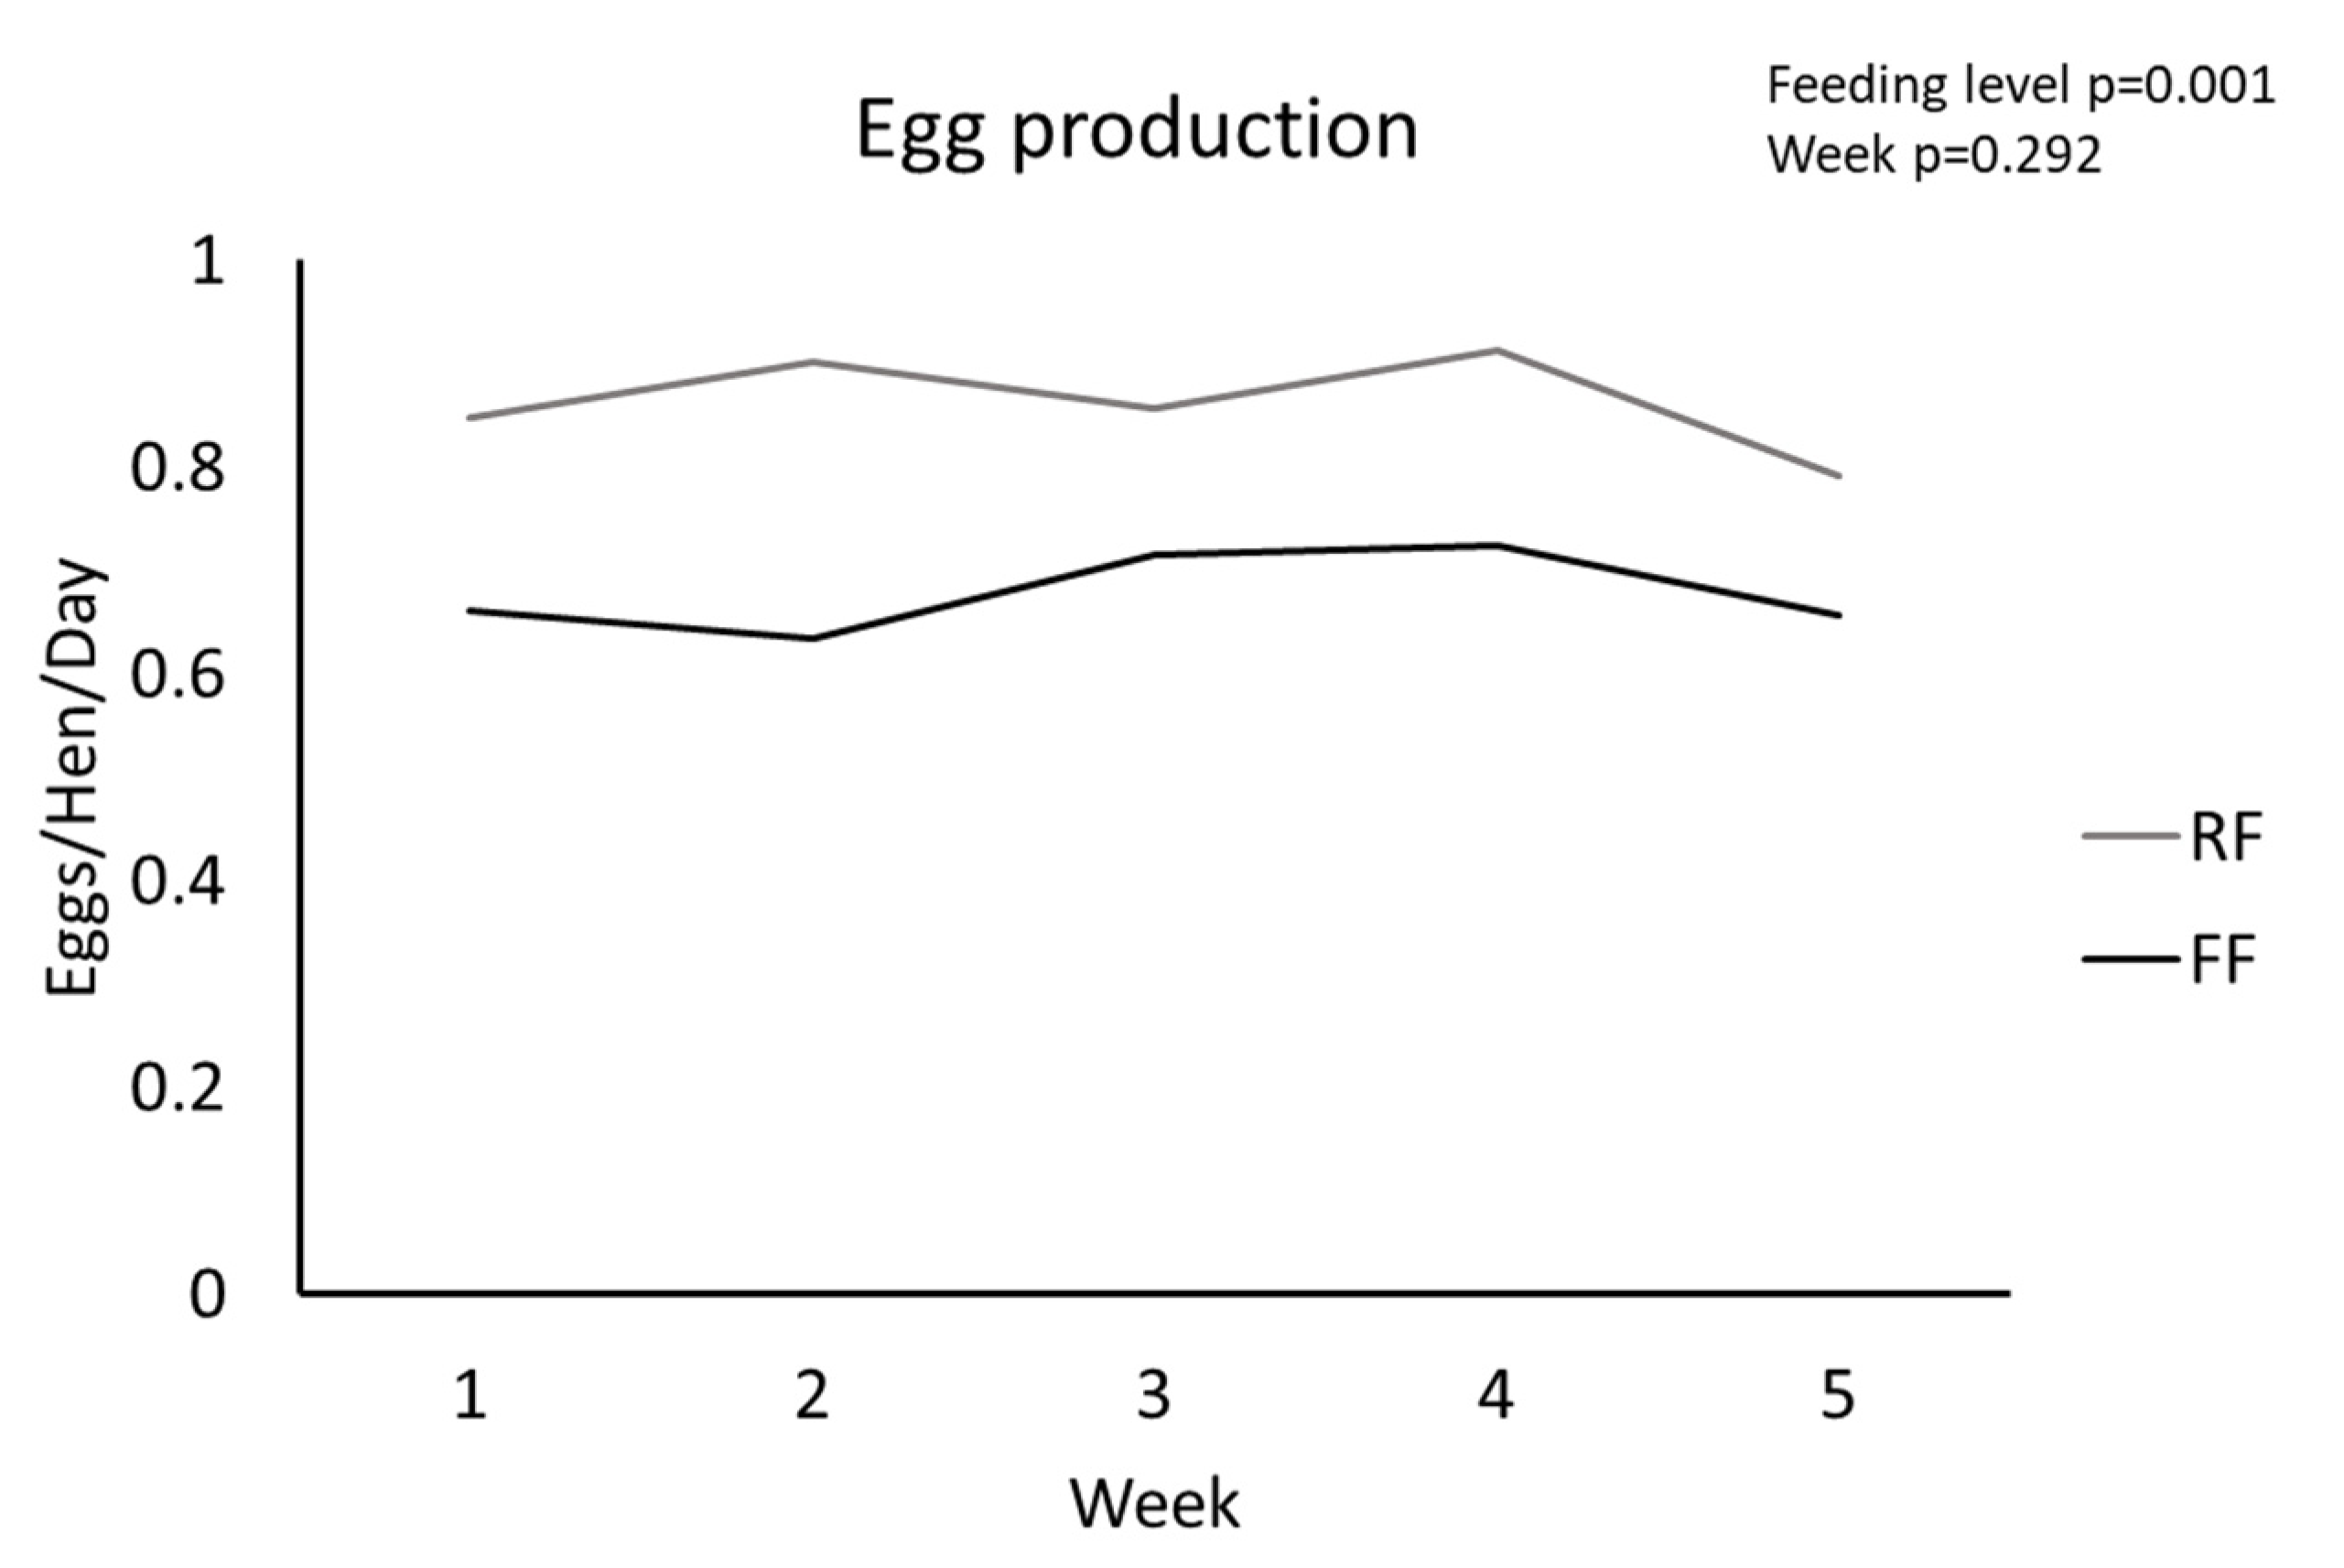
3.1. Body Parameters and Ovarian Morphology

Following 6 weeks of dietary treatment, FF hens had significantly higher live body weights than RF hens (p < 0.001, Table 2). Both fat pad and liver weights were also significantly higher in FF hens compared to RF hens when normalized to body weight (p < 0.001, Table 2).
FF hens had significantly more follicles greater than 9-mm in diameter compared to RF hens (p = 0.002, Table 2), indicating an increase in the number of follicles selected into the preovulatory hierarchy. Ovarian weight normalized to body weight was not different between RF and FF hens (p = 0.101, Table 2). Egg production was significantly higher for RF hens than FF hens throughout the course of the experiment (p = 0.013, Table 2 and Figure 1).

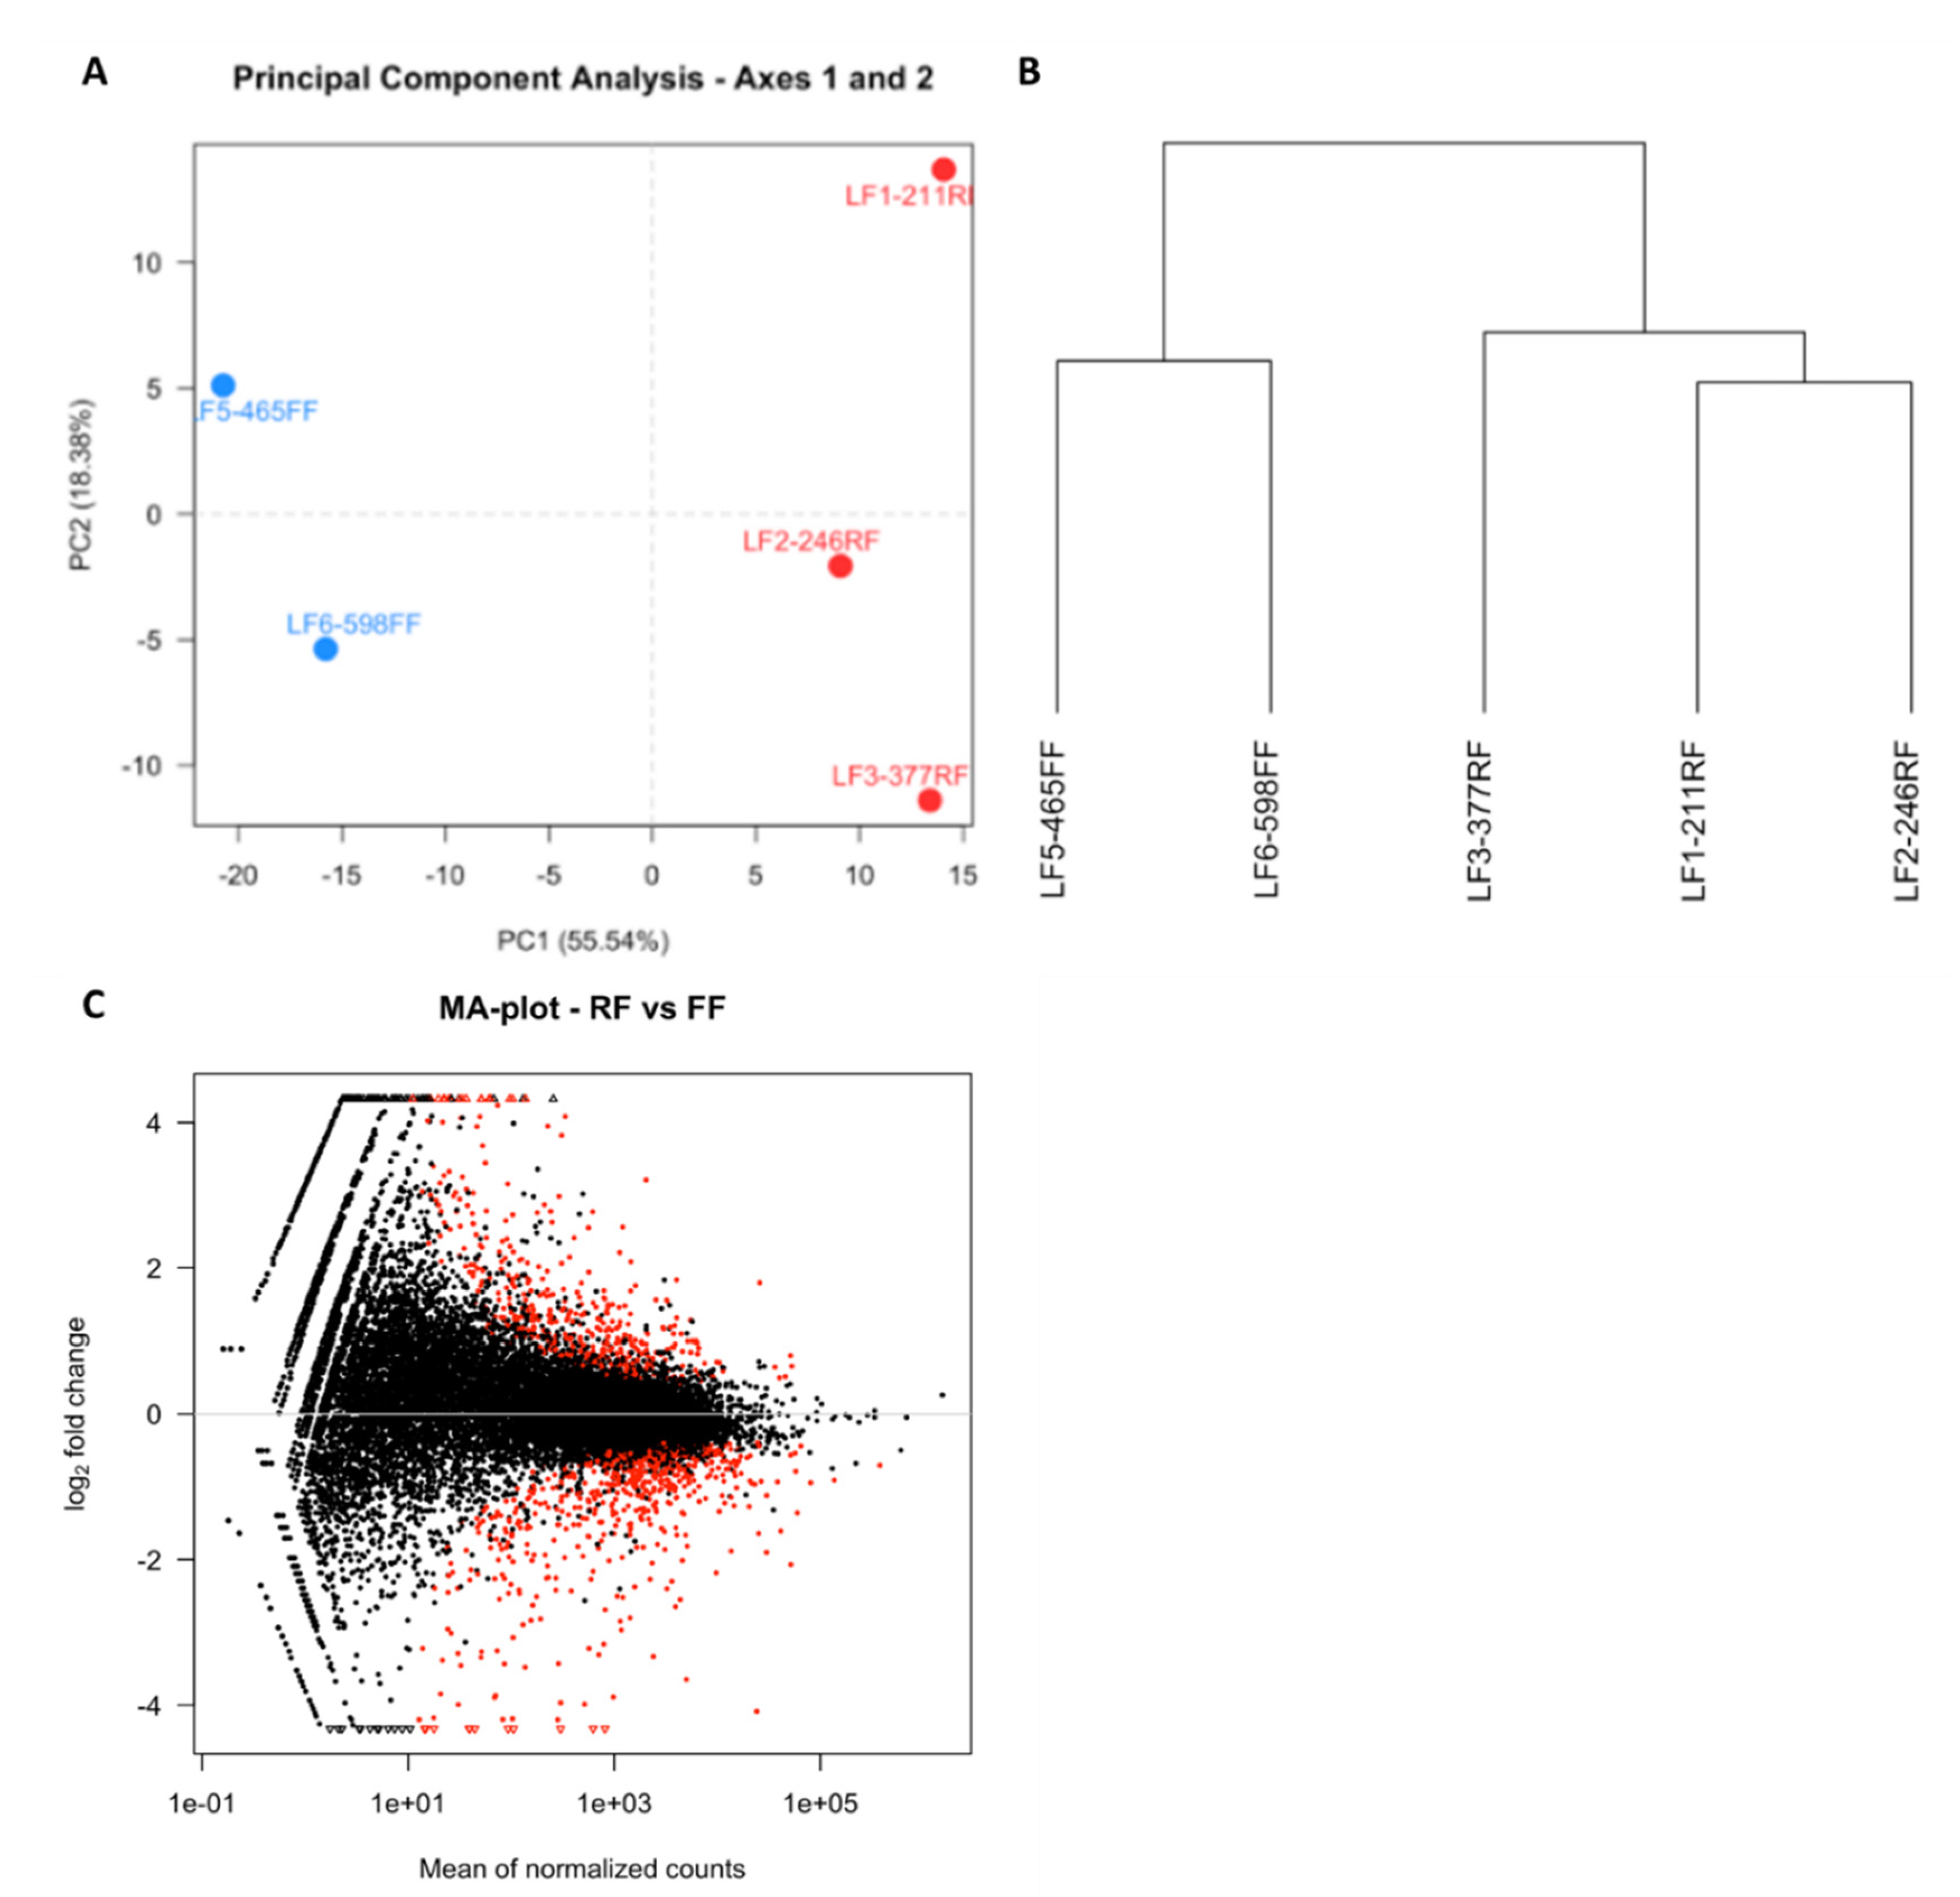
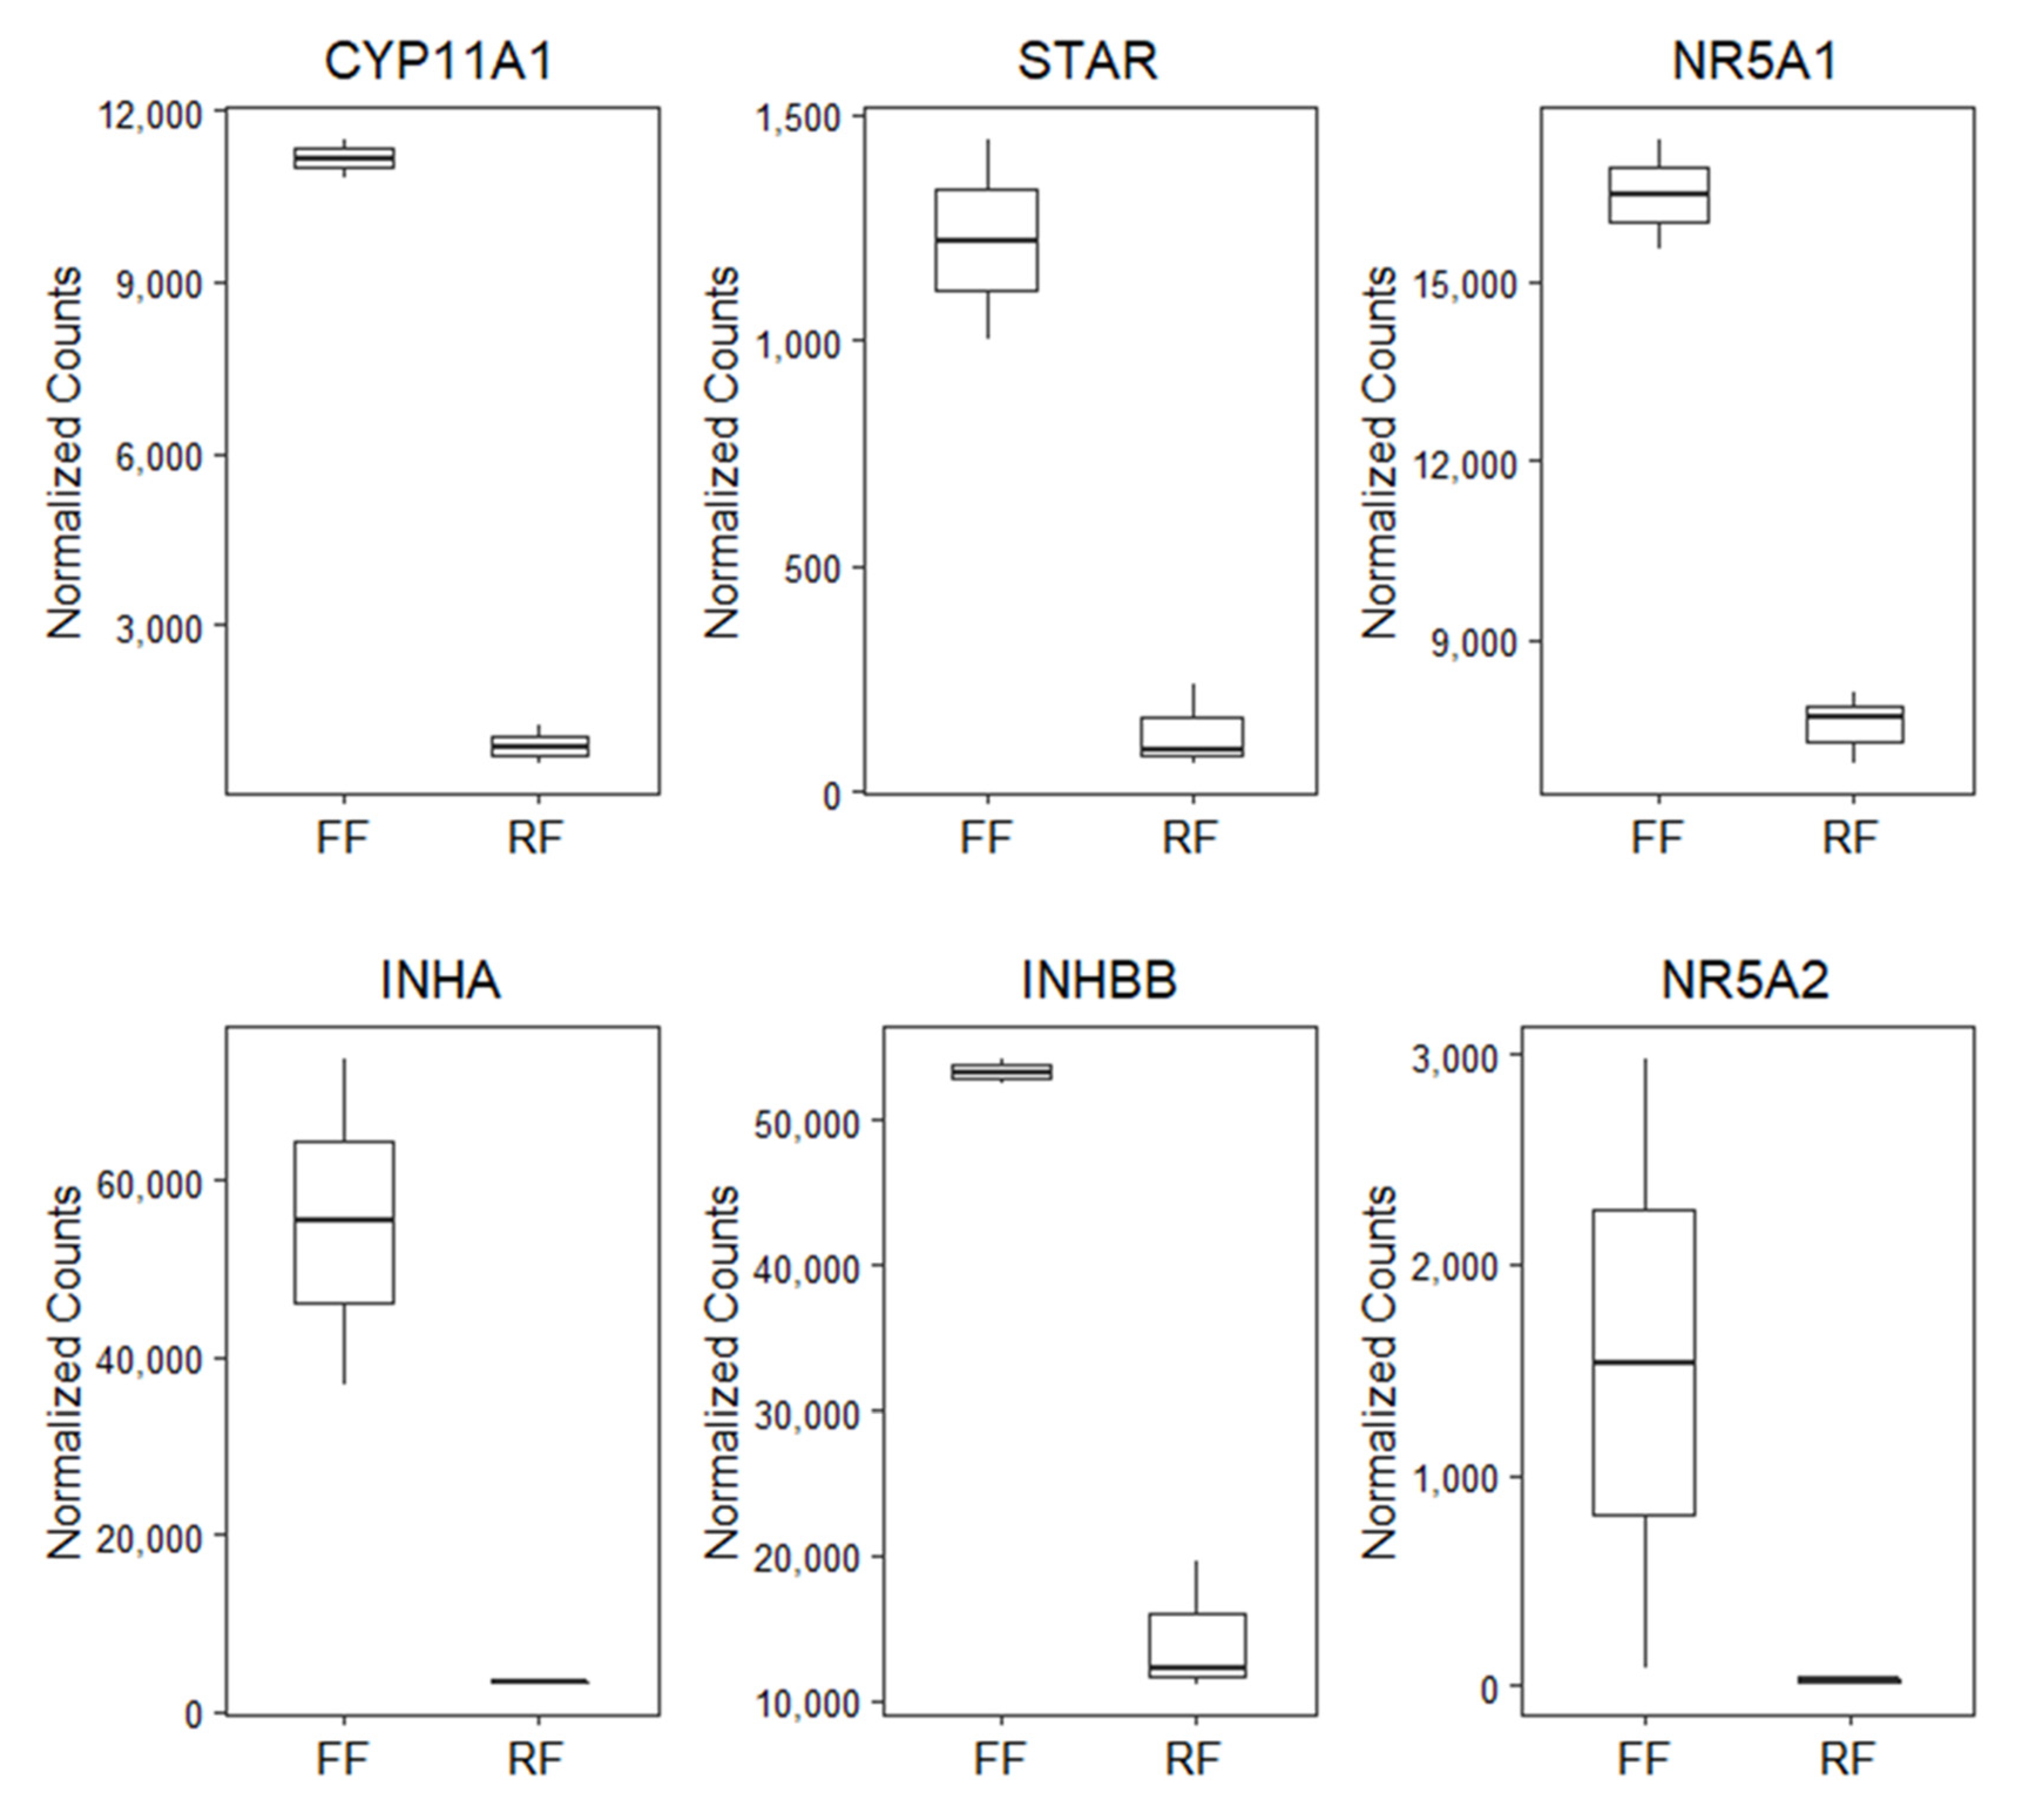
3.2. RNA Sequencing and Differential Gene Expression

PCA revealed that samples clustered with biological replicates along the first component (Figure 2A) and this was confirmed by hierarchal clustering (Figure 2B). Differential gene expression analysis resulted in 350 DEGs, of which 207 and 143 were upregulated in FF hens and RF hens, respectively (Figure 2C). The top 50 upregulated genes in FF and RF hens are listed in Table 3 and Table 4, respectively. Of the genes upregulated in the granulosa cells of 6–8-mm follicles of FF hens, several are known to be important for steroidogenesis (CYP11A1, STAR, NR5A1, and NR5A2) and in regulating FSH (INHA and INHBB) (Figure 3). CYP11A1, STAR, INHA, and INHBB mRNA expression were measured using qPCR to validate RNA-sequencing results. CYP11A1, INHA, and INHBB expression was significantly higher (p < 0.01) and STAR expression tended to be higher in granulosa cells of 6–8-mm follicles of FF hens (p = 0.08, Figure 4).

3.3. Enrichment Analysis

Enrichment analysis categorized DEGs by functional category. The top ten significant terms associated with DEGs upregulated in FF and RF hens are listed in Table 5 and Table 6, respectively. Several DEGs upregulated in FF hens are associated with terms related to lipid metabolism such as “lipid catabolic process” and “cellular lipid catabolic process” (Table 5). The term “transmembrane transport” categorized the most upregulated DEGs in FF hens (Table 5). Other terms of note reflect cellular reorganization in the granulosa cells of 6–8-mm follicles in FF hens including “positive regulation of actin filament bundle assembly” and “positive regulation of cellular component biogenesis” (Table 5). DEGs upregulated in RF hens are associated with cellular homeostasis. Several of the top functional terms are associated with ion transport: “ion transport”, “cation transport”, “metal ion transport”, and “ion transmembrane transport” (Table 6). Other terms are associated with maintaining cell physiology, such as “regulation of system process” and “positive regulation of cell size” (Table 6).

3.4. Upstream Regulators

Using IPA’s upstream regulator analysis, several transcriptional regulators were predicted to be upstream of DEGs. Among them are gonadotropins (LH, CG, and FSH), and growth factors (TGFB1, BMP6, AGT, BMP4, GDF9, HGF, IGF1, and BMP7) (Figure 5A). Two predicted upstream regulators of note are FSH with 23 downstream DEGs (Figure 5B) and Insulin-like Growth Factor 1 (IGF1) with 20 downstream DEGs (Figure 5C). Of the DEGs, seven genes (CYP11A1, EDN, IGFBP4, INHA, NR5A, STAR, and WT1) are predicted by IPA to be regulated by both FSH and IGF1.

4. Discussion

Broiler breeder hens fed ad libitum have increased follicle selection and excessive follicular growth, which results in decreased egg production. Commercial producers can increase egg production by restricting the dietary intake in these hens, resulting in a more regulated follicle hierarchy. In this study, we sought to generate hypotheses for the increased follicle development observed in FF hens by identifying differences in the transcriptomes of granulosa cells from 6–8-mm follicles, the stage of follicle selection.
Consistent with a previous study in our lab, we found that the preovulatory follicle number was significantly higher in FF hens when compared to RF hens [23]. Although we have previously found a significantly higher number of 3–5-mm and 6–8-mm follicles in FF hens compared to RF hens [23], we did not observe this in the present study. Another group using a similar experimental protocol also indicated no difference of numbers in these follicle size categories [24]. Our finding of a higher number of preovulatory follicles in FF hens is consistent with the hypothesis of increased follicle selection in response to increased dietary intake. At the time of follicle selection, granulosa cells become differentiated and gain the capacity to produce progesterone [25]. In the laying hen, one 6–8-mm follicle is selected approximately each day. This follicle enters the preovulatory stage to replace the recently ovulated follicle and this permits both an organized follicle hierarchy and efficient egg production. Given the increased number of preovulatory follicles observed in FF hens, the process of follicle selection is likely increased. We found transcriptional changes in the granulosa cell layer of 6–8-mm follicles, the stage at which follicle selection occurs.
In laying hens, the transcriptomes of granulosa cells from a 6-mm follicle and those from the most recently selected preovulatory follicle (F5) have been sequenced to investigate the transcriptional changes during the transition from unselected to selected follicles [26]. Of the top 50 DEGs identified in the granulosa cells of the recently selected follicle of the laying hen, 22 overlap with those we identified in the granulosa cells (6–8-mm follicles) of the FF hen. Among the notable genes in common between these two groups are CYP11A1 and STAR. CYP11A1 and STAR are important for the production of progesterone, an important functional change acquired at the time of follicle selection [10]. Given the strong overlap in gene expression between these two populations, it is possible that granulosa cells of 6–8-mm follicles of FF hens are more differentiated than those of RF hens. This early differentiation may occur in the granulosa layers of multiple 6–8-mm follicles, thereby disrupting the follicle hierarchy.
In the laying hen, granulosa cells begin to produce progesterone from cholesterol following selection into the preovulatory follicle stage [10]. This steroidogenic competency is associated with an increase in STAR and CYP11A1 expression [6,9]. Given the increased expression of STAR and CYP11A1 in granulosa cells from 6–8-mm follicles of the FF hen, progesterone production may increase earlier in follicle development than in laying hens or RF hens. Furthermore, two transcriptional activators, namely NR5A1 (synonym SF-1) and NR5A2 (synonym LRH-1), were found to be upregulated in the FF hen. NR5A1 binds to the promotor of CYP11A1 to increase its transcription and the production of progesterone in the granulosa cells of rats [27]. A second transcription factor, NR5A2, also increases CYP11A1-promoter activity in human granulosa cells [28] and in the presence of FSH, increases CYP11A1 mRNA and progesterone synthesis in cultured rat granulosa cells [29]. The increased STAR, CYP11A1, NR5A1, and NR5A2 expression in granulosa cells of 6–8-mm follicles of FF hens suggests that the production of progesterone may be initiated at this stage of follicle development, earlier than observed in laying hens. It has previously been proposed that production of progesterone may be initiated earlier in follicle development in FF hens [30]. Both the F1 and F2 follicles in FF hens have been shown to secrete higher progesterone in FF hens compared to RF hens, where only the F1 follicle secretes high progesterone levels [30]. Alternatively, these hens may be gaining the machinery for steroidogenesis during the 6–8-mm follicle stage and producing higher levels of progesterone once they enter the preovulatory stage. Dysregulation in the production of progesterone may be stimulating multiple ovulations and therefore be contributing to the double ovulations that are often observed in FF hens.
In addition to changes in the ovary, we found that full-feeding increased body weight, liver weight/BW, and fat pad weight/BW, as we have previously shown [23]. Increased dietary intake results in increased adiposity, with FF hens showing increased fat pad weight and increased plasma triglyceride and cholesterol levels compared to RF hens [23]. Enrichment analysis showed “lipid catabolic process” and “cellular lipid catabolic process” as some of the most significant terms for granulosa cells of 6–8-mm follicles from FF hens. This suggests that granulosa cells of 6–8-mm follicles may adjust their physiology to accommodate the increased amount of plasma lipids. Interestingly, the DEG with the highest fold change in both the granulosa cells of the most recently selected follicle of the laying hen [26] and the granulosa cells of 6–8-mm from FF broiler breeder hens is Carboxyl Ester Lipase (CEL). CEL is known to be excreted from the pancreas and has effects on lipid absorption in the intestine (reviewed in [31]). Among its roles, CEL functions in cholesterol absorption, in the reverse transport to the liver, and potentially in the cholesterol uptake by cells (reviewed in [31]). In the chicken, CEL is mainly expressed in the pancreas [32]. CEL expression in the pancreas has been shown to be influenced by dietary cholesterol in rats [33]; however, to our knowledge, our study is the first demonstrating that diet influences CEL expression in gonads. Although the role of CEL has not yet been investigated in the ovary, it may facilitate cholesterol transport in the cell. Two other lipid transporters, namely ABCA12 and SLC25A1, a mitochondrial transporter important for downstream endogenous cholesterol synthesis (summarized in [34]), are also increased in granulosa cells of 6–8-mm follicles of FF hens. Upregulation of CEL, ABCA12, and SLC25A1 may be increasing cholesterol availability to granulosa cells of 6–8-mm follicles in FF hens with higher levels of plasma cholesterol and facilitating enhanced progesterone production.
Although dietary intake affects the transcriptomes of granulosa cells of 6–8-mm follicles, the factors directly contributing to these changes remain unclear. The upstream regulator analysis predicted FSH and IGF1 to have effects on several DEGs upregulated in FF hens. In the hen, granulosa cells become responsive to FSH at the time of selection and one of the 6–8-mm follicles shows an increase in FSHR mRNA [7]. FSH increases cAMP levels to stimulate STAR and CYP11A1 transcription [6,9]. In the current study, INHBB, INHA, STAR, and CYP11A1 were upregulated in granulosa cells of 6–8-mm follicles from FF hens and predicted to be downstream of FSH. Reported plasma FSH levels in RF and FF hens are variable as some studies found no difference [2], elevated levels [35,36,37], or decreased FSH plasma levels in FF compared to RF hens [24]. More research is needed to determine the effect of increased dietary intake on FSH plasma levels.
In a previous study, we investigated liver transcriptome differences between FF and RF hens and showed that FF hens have elevated liver IGF1 mRNA and protein compared to RF hens [23]. At the preovulatory follicle stage, IGF1 can increase progesterone production and expression of STAR, CYP11A1, and 3βHSD in chicken granulosa cells [38]. In granulosa cells of pre-hierarchal follicles, IGF1 increases cell proliferation [39]. In mammals, FSH and IGF1 have been shown to increase CYP11A1 and STAR expression synergistically [40,41,42,43]. Using upstream regulator analysis, we found seven genes (CYP11A1, EDN, IGFBP4, INHA, NR5A, STAR, and WT1) downstream of both FSH and IGF1. These genes could be targets for synergistic effects of FSH and IGF1 in the hen, and elevated IGF1 in FF hens [23] may synergize with FSH in FF hens to enhance follicle development.

5. Conclusions

This is the first study to investigate differences in the transcriptome of pre-hierarchal follicles between broiler breeder hens fed at different levels. Three hundred and fifty genes were found to be differentially expressed between FF and RF hens in granulosa cells from 6–8-mm follicles. Several genes involved in follicle selection were upregulated in pre-hierarchal follicles of FF hens, suggesting an ovarian effect of dietary treatment at early stages in follicle development. Findings from this study suggest that granulosa cells of 6–8-mm follicles may mature earlier in FF hens than in RF hens, particularly with respect to capacity for progesterone synthesis. In addition, increased plasma cholesterol levels, FSH, and IGF1 may be involved in some of these transcriptional changes. These hypotheses have opened new research avenues which we are actively pursuing. Ultimately, this research helps clarify the processes contributing to the reproductive inefficiencies observed in broiler breeder hens. A greater understanding of the etiology of these reproductive inefficiencies can provide targets for treatment and genetic selection to improve the reproductive health and welfare of these hens.

Supplementary Materials

The following are available online at https://www.mdpi.com/article/10.3390/ani11092706/s1, Table S1: RNA-Seq Alignment Summary.

Author Contributions

Conceptualization, L.F., C.S.S. and P.A.J.; data curation, C.S.S. and L.F.; formal analysis, L.F.; funding acquisition, P.A.J.; investigation, L.F. and C.S.S.; methodology development, L.F., C.S.S. and P.A.J.; project administration, P.A.J.; resources provision, L.F., C.S.S. and P.A.J.; software programming, L.F.; supervision, P.A.J.; validation, L.F. and P.A.J.; visualization, L.F.; writing—original draft preparation, L.F.; writing—review and editing, L.F., C.S.S. and P.A.J. All authors have read and agreed to the published version of the manuscript.

Funding

This project was supported by the AFRI Competitive Grant number 2017-67015-26453 from the USDA NIFA and Multistate Project number NYC-127853 from USDA/NIFA.

Institutional Review Board Statement

Protocol 2009-0036, titled ‘Follicle Selection and Development in Chickens’, was originally approved by the IACUC in 2009 and most recently approved IACUC on 12/17/2020. An approval by the IACUC means that the use of animals for the project has been approved. Cornell University operates its Animal Care and Use program under the Animal Welfare Assurance A3347-01 on file with the Office of Laboratory Animal Welfare (OLAW).

Data Availability Statement

The data presented in this study are openly available on NCBI’s Gene Expression Omnibus (Edgar et al., 2002) and are accessible through GEO Series accession number GSE175887 (https://www.ncbi.nlm.nih.gov/geo/query/acc.cgi?acc=GSE175887).

Acknowledgments

We are grateful for the undergraduate assistance from Brian Jurgielewicz and Jaclyn Ahern. We would also like to thank Cornell University’s Poultry Facility staff for their animal care and assistance throughout the course of this experiment.

Conflicts of Interest

The authors declare no conflict of interest.

References

  1. Yu, M.W.; Robinson, F.E.; Charles, R.G.; Weingardt, R. Effect of feed allowance during rearing and breeding on female broiler breeders. 2. Ovarian morphology and production. Poult. Sci. 1992, 71, 1750–1761. [Google Scholar] [CrossRef] [PubMed]
  2. Renema, R.A.; Robinson, F.E.; Proudman, J.A.; Newcombe, M.; Mckay, R.I. Effects of Body Weight and Feed Allocation During Sexual Maturation in Broiler Breeder Hens. 2. Ovarian Morphology and Plasma Hormone Profiles. Poult. Sci. 1999, 78, 629–639. [Google Scholar] [CrossRef]
  3. Hocking, P.M.; Gilbert, A.B.; Walker, M.; Waddington, D. Ovarian follicular structure of White Leghorns fed ad libitum and dwarf and normal broiler breeders fed ad libitum or restricted until point of lay. Br. Poult. Sci. 1987, 28, 493–506. [Google Scholar] [CrossRef] [PubMed]
  4. Johnson, P. Follicle Selection in the Avian Ovary. Reprod. Domest. Anim. 2012, 47, 283–287. [Google Scholar] [CrossRef]
  5. Robinson, F.E.; Etches, R.J. Ovarian Steroidogenesis During Foillicular Maturation in the Domestic Fowl (Gallus Domesticus). Biol. Reprod. 1986, 35, 1096–1105. [Google Scholar] [CrossRef]
  6. Johnson, A.L.; Bridgham, J.T. Regulation of Steroidogenic Acute Regulatory Protein and Luteinizing Hormone Receptor Messenger Ribonucleic Acid in Hen Granulosa Cells. Endocrinology 2001, 142, 3116–3124. [Google Scholar] [CrossRef] [PubMed]
  7. Woods, D.C.; Johnson, A.L. Regulation of Follicle-Stimulating Hormone-Receptor Messenger RNA in Hen Granulosa Cells Relative to Follicle Selection. Biol. Reprod. 2005, 72, 643–650. [Google Scholar] [CrossRef]
  8. Johnson, A.; Woods, D.C. Ovarian dynamics and follicle development. In Reproductive Biology and Phylogeny of Birds; Jamieson, B.G.M., Ed.; Science Publishers, Inc.: Enfield, NH, USA, 2007; pp. 243–277. [Google Scholar]
  9. Li, Z.; Johnson, A.L. Regulation of P450 Cholesterol Side-Chain Cleavage Messenger Ribonucleic Acid Expression and Progesterone Production in Hen Granulosa Cells. Biol. Reprod. 1993, 49, 463–469. [Google Scholar] [CrossRef]
  10. Tilly, J.L.; Kowalski, K.I.; Johnson, A.L. Stage of Ovarian Follicular Development Associated with the Initiation of Steroidogenic Competence in Avian Granulosa Cells. Biol. Reprod. 1991, 44, 305–314. [Google Scholar] [CrossRef]
  11. Yu, M.W.; Robinson, F.E.; Etches, R.J. Quantification of ovarian steroidogenesis in the domestic fowl by incubation of intact large follicles. Poult. Sci. 1992, 71, 346–351. [Google Scholar] [CrossRef]
  12. Johnson, P.A.; Johnson, A.L.; van Tienhoven, A. Evidence for a positive feedback interaction between progesterone and luteinizing hormone in the induction of ovulation in the hen, Gallus domesticus. Gen. Comp. Endocrinol. 1985, 58, 478–485. [Google Scholar] [CrossRef]
  13. Cobb-Vantress, Cobb 700 Breeder Management Supplement. 2013.
  14. Stephens, C.S.; Johnson, P.A. Occludin expression and regulation in small follicles of the layer and broiler breeder hen. Gen. Comp. Endocrinol. 2017, 248, 106–113. [Google Scholar] [CrossRef]
  15. Wang, Y.; Li, J.; Ying Wang, C.; Yan Kwok, A.H.; Leung, F.C. Epidermal Growth Factor (EGF) Receptor Ligands in the Chicken Ovary: I. Evidence for Heparin-Binding EGF-Like Growth Factor (HB-EGF) as a Potential Oocyte-Derived Signal to Control Granulosa Cell Proliferation and HB-EGF and Kit Ligand Expression. Endocrinology 2007, 148, 3426–3440. [Google Scholar] [CrossRef]
  16. Dobin, A.; Davis, C.A.; Schlesinger, F.; Drenkow, J.; Zaleski, C.; Jha, S.; Batut, P.; Chaisson, M.; Gingeras, T.R. STAR: Ultrafast universal RNA-seq aligner. Bioinformatics 2013, 29, 15–21. [Google Scholar] [CrossRef]
  17. R Core Team. R: A Language and Environment for Statistical Computing; R Foundation for Statistical Computing: Vienna, Austria, 2021. [Google Scholar]
  18. Ge, S.X.; Jung, D.; Yao, R. ShinyGO: A graphical gene-set enrichment tool for animals and plants. Bioinformatics 2020, 36, 2628–2629. [Google Scholar] [CrossRef] [PubMed]
  19. Ingenuity Pathway Analysis. Available online: https://www.qiagenbioinformatics.com/products/ingenuitypathway-analysis (accessed on 19 January 2021).
  20. Krämer, A.; Green, J.; Pollard, J.; Tugendreich, S. Causal analysis approaches in ingenuity pathway analysis. Bioinformatics 2014, 30, 523–530. [Google Scholar] [CrossRef] [PubMed]
  21. Johnson, A.L.; Lee, J. Granulosa cell responsiveness to follicle stimulating hormone during early growth of hen ovarian follicles. Poult. Sci. 2016, 95, 108–114. [Google Scholar] [CrossRef]
  22. Ye, J.; Coulouris, G.; Zaretskaya, I.; Cutcutache, I.; Rozen, S.; Madden, T.L. Primer-BLAST: A tool to design target-specific primers for polymerase chain reaction. BMC Bioinform. 2012, 13, 134. [Google Scholar] [CrossRef] [PubMed] [Green Version]
  23. Stephens, C.S.; Hill-Ricciuti, A.; Francoeur, L.; Johnson, P.A. Feeding Level Is Associated With Altered Liver Transcriptome and Follicle Selection in the Hen. Biol. Reprod. 2021. in review. [Google Scholar]
  24. Ciccone, N.A.; Dunn, I.C.; Sharp, P.J. Increased food intake stimulates GnRH-I, glycoprotein hormone α-subunit and follistatin mRNAs, and ovarian follicular numbers in laying broiler breeder hens. Domest. Anim. Endocrinol. 2007, 33, 62–76. [Google Scholar] [CrossRef]
  25. Johnson, A.L.; Woods, D.C. Dynamics of avian ovarian follicle development: Cellular mechanisms of granulosa cell differentiation. Gen. Comp. Endocrinol. 2009, 163, 12–17. [Google Scholar] [CrossRef] [PubMed]
  26. Zhu, G.; Fang, C.; Li, J.; Mo, C.; Wang, Y.; Li, J. Transcriptomic Diversification of Granulosa Cells during Follicular Development in Chicken. Sci. Rep. 2019, 9, 1–16. [Google Scholar] [CrossRef]
  27. Saxena, D.; Escamilla-Hernandez, R.; Little-Ihrig, L.; Zeleznik, A.J. Liver Receptor Homolog-1 and Steroidogenic Factor-1 Have Similar Actions on Rat Granulosa Cell Steroidogenesis. Endocrinology 2007, 148, 726–734. [Google Scholar] [CrossRef] [PubMed] [Green Version]
  28. Kim, J.W.; Havelock, J.C.; Carr, B.R.; Attia, G.R. The Orphan Nuclear Receptor, Liver Receptor Homolog-1, Regulates Cholesterol Side-Chain Cleavage Cytochrome P450 Enzyme in Human Granulosa Cells. J. Clin. Endocrinol. Metab. 2005, 90, 1678–1685. [Google Scholar] [CrossRef] [Green Version]
  29. Saxena, D.; Safi, R.; Little-Ihrig, L.; Zeleznik, A.J. Liver receptor homolog-1 stimulates the progesterone biosynthetic pathway during follicle-stimulating hormone-induced granulosa cell differentiation. Endocrinology 2004, 145, 3821–3829. [Google Scholar] [CrossRef] [PubMed] [Green Version]
  30. Yu, M.W.; Robinson, F.E.; Etches, R.J. Effect of feed allowance during rearing and breeding on female broiler breeders. 3. Ovarian steroidogenesis. Poult. Sci. 1992, 71, 1762–1767. [Google Scholar] [CrossRef] [PubMed]
  31. Hui, D.Y.; Howles, P.N. Carboxyl ester lipase: Structure-function relationship and physiological role in lipoprotein metabolism and atherosclerosis. J. Lipid Res. 2002, 43, 2017–2030. [Google Scholar] [CrossRef] [Green Version]
  32. Sato, K.; Seol, H.S.; Kamada, T. Tissue distribution of lipase genes related to triglyceride metabolism in laying hens (Gallus gallus). Comp. Biochem. Physiol. B Biochem. Mol. Biol. 2010, 155, 62–66. [Google Scholar] [CrossRef]
  33. Brodt-Eppley, J.; Hui, D.Y. Dietary regulation of cholesterol esterase mRNA level in rat pancreas. J. Lipid Res. 1994, 35, 27–35. [Google Scholar] [CrossRef]
  34. Favara, D.M.; Zois, C.E.; Haider, S.; Pires, E.; Sheldon, H.; McCullagh, J.; Banham, A.H.; Harris, A.L. ADGRL4/ELTD1 silencing in endothelial cells induces ACLY and SLC25A1 and alters the cellular metabolic profile. Metabolites 2019, 9, 287. [Google Scholar] [CrossRef] [Green Version]
  35. Bruggeman, V.; D′Hondt, E.; Berghman, L.; Onagbesan, O.; Vanmontfort, D.; Vandesande, F.; Decuypere, E. The effect of food intake from 2 to 24 weeks of age on LHRH-I content in the median eminence and gonadotrophin levels in pituitary and plasma in female broiler breeder chickens. Gen. Comp. Endocrinol. 1998, 112, 200–209. [Google Scholar] [CrossRef] [PubMed]
  36. Hadinia, S.H.; Carneiro, P.R.O.; Fitzsimmons, C.J.; Bédécarrats, G.Y.; Zuidhof, M.J. Post-photostimulation energy intake accelerated pubertal development in broiler breeder pullets. Poult. Sci. 2020, 99, 2215–2229. [Google Scholar] [CrossRef]
  37. Onagbesan, O.M.; Metayer, S.; Tona, K.; Williams, J.; Decuypere, E.; Bruggeman, V. Effects of genotype and feed allowance on plasma luteinizing hormones, follicle-stimulating hormones, progesterone, estradiol levels, follicle differentiation, and egg production rates of broiler breeder hens. Poult. Sci. 2006, 85, 1245–1258. [Google Scholar] [CrossRef] [PubMed]
  38. Tosca, L.; Chabrolle, C.; Crochet, S.; Tesseraud, S.; Dupont, J. IGF-1 receptor signaling pathways and effects of AMPK activation on IGF-1-induced progesterone secretion in hen granulosa cells. Domest. Anim. Endocrinol. 2008, 34, 204–216. [Google Scholar] [CrossRef]
  39. Ahumada-Solórzano, S.M.; Martínez-Moreno, C.G.; Carranza, M.; Ávila-Mendoza, J.; Luna-Acosta, J.L.; Harvey, S.; Luna, M.; Arámburo, C. Autocrine/paracrine proliferative effect of ovarian GH and IGF-I in chicken granulosa cell cultures. Gen. Comp. Endocrinol. 2016, 234, 47–56. [Google Scholar] [CrossRef]
  40. Winters, T.A.; Hanten, J.A.; Veldhuis, J.D. In situ amplification of the cytochrome P-450 cholesterol side-chain cleavage enzyme mRNA in single porcine granulosa cells by IGF-1 and FSH acting alone or in concert. Endocrine 1998, 9, 57–63. [Google Scholar] [CrossRef]
  41. Adashi, E.Y.; Resnick, C.E.; Brodie, A.M.H.; Svoboda, M.E.; Van Wyk, J.J. Somatomedin-C-mediated potentiation of follicle-stimulating hormone-induced aromatase activity of cultured rat granulosa cells. Endocrinology 1985, 117, 2313–2320. [Google Scholar] [CrossRef] [PubMed]
  42. Eimerl, S.; Orly, J. Regulation of steroidogenic genes by insulin-like growth factor-1 and follicle-stimulating hormone: Differential responses of cytochrome P450 side-chain cleavage. Biol. Reprod. 2002, 67, 900–910. [Google Scholar] [CrossRef]
  43. Balasubramanian, K.; LaVoie, H.A.; Garmey, J.C.; Stocco, D.M.; Veldhuis, J.D. Regulation of Porcine Granulosa Cell Steroidogenic Acute Regulatory Protein (StAR) by Insulin-Like Growth Factor I: Synergism with Follicle-Stimulating Hormone or Protein Kinase A Agonist. Endocrinology 1997, 138, 433–439. [Google Scholar] [CrossRef]
Figure 1. Egg production (eggs/hen/day) of RF and FF hens in response to dietary treatment (n = 16 per group, p = 0.013). p-values for individual fixed effects are in the top right corner.
Animals 11 02706 g001
Figure 2. Principle component analysis, hierarchal clustering, and MA plot for RNA-sequencing data of granulosa cells from 6–8-mm follicles from RF and FF hens. (A) Principle component analysis comparing FF (n = 2, blue) and RF (n = 3, red) transcriptomes. (B) Hierarchal clustering of FF (n = 2) and RF (n = 3) samples. (C) MA plot comparing normalized counts in FF and RF hens. Black dots represent expressed genes and red dots indicate DEGs. Genes located below the x-axis represent genes more highly expressed in FF hens and genes located above the x-axis represent genes more highly expressed in RF hens.
Animals 11 02706 g002
Figure 3. Boxplots of normalized counts from RNA-seq analysis comparing FF (n = 2) and RF (n = 3) gene expression of select DEGs (CYP11A1, STAR, NR5A1, INHA, INHBB, and NR5A2).
Animals 11 02706 g003
Figure 4. CYP11A1, STAR, INHA, and INHBB mRNA expression in granulosa cells of 6–8-mm follicles in FF and RF hens. Bars represent the mean expression normalized to 18S ± SD in granulosa cells of 6–8-mm follicles in FF (n = 2) and RF hens (n = 3) (p > 0.01, *; p = 0.08, #). (A) CYP11A1 mRNA expression (p < 0.01); (B) STAR mRNA expression (p = 0.08); (C) INHA mRNA expression (p < 0.01); and (D) INHBB mRNA expression (p < 0.01).
Animals 11 02706 g004
Figure 5. Upstream regulator analysis of differentially expressed genes in RF and FF hens. (A) The top 25 predicted upstream regulators of DEGs from the granulosa cells of 6–8-mm follicles from FF and RF hens are shown. The upstream regulator, number of gene targets in the DEG dataset, total number of genes found in the IPA network for the specific regulator, z-score of activation, and p-value of overlap are indicated. (B) FSH network wheel of gene targets in dataset. Green shapes are upregulated and red shapes are downregulated in FF hens (z-score = −1.723). Line colors indicate the state of activation (blue = activation; orange = inhibition; yellow = findings inconsistent with downstream gene state; and grey = unpredicted effects). (C) IGF1 network wheel of gene targets in dataset (z-score = −1.175). Colors of the shapes and lines have the same meaning as in panel (B).
Animals 11 02706 g005
Table 1. Primer Sequences for RT-qPCR.
Target GenePrimer Sequence
CYP11A1F 5′-ACTTCAAGGGACTGAGCTTTGGGT-3′
R 5′ AGTTCTCCAGGATGTGCATGAGGA 3′
STARF 5′-TGCCTGAGCAGCAGGGATTTATCA- 3′
R 5′- TGGTTGATGATGGTCTTTGGCAGC-3′
INHAF 5′-TCTTCCCTTCCACAGACGTG- 3′
R 5′- CTGTAGAACCAGAGCTGGGC-3′
INHBBF 5′-TTCGCCGAGACAGACGAT- 3′
R 5′- TTACTTTTCGCCTGCTGCCT-3′
Table 2. Mean body weight, normalized fat pad, liver, and ovary weights, as well as follicle numbers (3–5-mm, 6–8-mm, and follicles >9-mm) and egg production (eggs/hen/day) for RF and FF hens in response to dietary treatment (n = 15–16 per group). Means are presented as means ± SD.
ParameterRFFFp-Value
Body weight (g)3389 ± 1624483 ± 359<0.0001
Fat pad weight/BW0.015 ± 0.0070.030 ± 0.008<0.0001
Liver weight/BW0.028 ± 0.0050.048 ± 0.010<0.0001
Ovary weight/BW0.018 ± 0.0030.021 ± 0.0050.101
3–5-mm follicles32.2 ± 11.036.3 ± 12.00.332
6–8-mm follicles11.6 ± 3.910.7 ± 3.70.519
Follicles > 9-mm6.3 ± 0.98.2 ± 2.00.002
Eggs/hen/day0.862 ± 0.0480.678 ± 0.0390.013
Table 3. Top 50 upregulated differentially expressed genes in FF hens, including the Ensembl gene ID, gene name, log2(FC), and FDR, and average normalized read counts for FF and RF groups are indicated for each gene.
GeneIDGene Namelog2(FC)FDRFF AverageRF Average
ENSGALG00000034436CEL−8.60.017492
ENSGALG00000002182NR5A2−6.4<0.01153118
ENSGALG00000038884SRL−4.9<0.012508
ENSGALG00000045327-−4.9<0.012228
ENSGALG00000026808TMEM72−4.8<0.01192270
ENSGALG00000006440-−4.2<0.0165235
ENSGALG00000050830SV2A−4.2<0.0123713
ENSGALG00000054770INHA−4.1<0.0155,4173271
ENSGALG00000010269KCNAB1−4.0<0.01117475
ENSGALG00000042836KCNH2−4.0<0.0168844
ENSGALG00000047771PGF−3.9<0.012220150
ENSGALG00000034982CYP11A1−3.6<0.0111,165893
ENSGALG00000029968GADD45B−3.5<0.0130027
ENSGALG00000001207PLCH2−3.40.0163059
ENSGALG00000006598SORL1−3.3<0.015205517
ENSGALG00000041932SLC5A5−3.3<0.011534155
ENSGALG00000003242STAR−3.2<0.011222132
ENSGALG00000010364AADAC−3.20.011694189
ENSGALG00000040355TCF24−3.1<0.0122026
ENSGALG00000004974PPARG−3.0<0.012454314
ENSGALG00000005884MAPKKK3L−2.9<0.0127037
ENSGALG00000011242OBSL1−2.8<0.012359328
ENSGALG00000042607RSPO3−2.8<0.0132145
ENSGALG00000014938ABHD3−2.8<0.0139656
ENSGALG00000038399PLEKHA6−2.8<0.012921420
ENSGALG00000050611-−2.7<0.011650257
ENSGALG00000041143UMOD−2.6<0.0179161266
ENSGALG00000011537PDE10A−2.6<0.0132553
ENSGALG00000008815LRRN4−2.5<0.0186781484
ENSGALG00000011608INF2−2.5<0.012394418
ENSGALG00000011803EMP1−2.5<0.0134761
ENSGALG00000019077-−2.5<0.012109372
ENSGALG00000043234HBA1−2.5<0.0123643
ENSGALG00000042929-−2.4<0.01746139
ENSGALG00000010326FLVCR2−2.4<0.0153098
ENSGALG00000006453TF−2.4<0.0123243
ENSGALG00000037603SESN2−2.4<0.0162981195
ENSGALG00000003750PLCG1−2.4<0.013056590
ENSGALG00000033683PHOSPHO1−2.3<0.0169241408
ENSGALG00000016415MAP7D2−2.3<0.014248882
ENSGALG00000044649P2RX2−2.3<0.011134235
ENSGALG00000016954RGCC−2.3<0.0141687
ENSGALG00000008537EPHB3−2.3<0.01516108
ENSGALG00000036728PRDM16−2.2<0.0143692
ENSGALG00000041708WNT4−2.2<0.0118,3244040
ENSGALG00000014734-−2.2<0.011166260
ENSGALG00000018803-−2.1<0.0141598
ENSGALG00000009512TFPI2−2.1<0.0194,94222,674
ENSGALG00000049157DOK4−2.0<0.0142741034
ENSGALG00000038458LOXL1−2.0<0.011624401
Table 4. Top 50 upregulated differentially expressed genes in RF hens, including the Ensembl gene ID, gene name, log2(FC) and FDR, and average normalized read counts for FF and RF groups are indicated for each gene.
GeneIDGene Namelog2(FC)FDRFF AverageRF Average
ENSGALG00000051980-6.50.012229
ENSGALG00000036798COL4A14.10.0232535
ENSGALG00000007819PDZRN34.0<0.0124361
ENSGALG00000015908COL12A13.8<0.0134491
ENSGALG00000043754GLUL3.2<0.013403158
ENSGALG00000010858LRP23.00.0356446
ENSGALG00000040755ANGPT42.9<0.0144320
ENSGALG00000048104-2.8<0.0154367
ENSGALG00000003670MAFB2.8<0.01137938
ENSGALG00000016843COL4A22.80.0140271
ENSGALG00000033338GPT22.6<0.0160374
ENSGALG00000030065TENM32.6<0.013061805
ENSGALG00000009405GRIA22.6<0.01143839
ENSGALG00000034453SAMD112.4<0.01113604
ENSGALG00000050840APCDD12.2<0.013551641
ENSGALG00000006172ABCC82.10.01120534
ENSGALG00000038364NOV2.1<0.014922083
ENSGALG00000016820GAS62.1<0.0149207
ENSGALG00000013697CNDP12.1<0.01106443
ENSGALG00000011200THBS22.0<0.0165264
ENSGALG00000014178-2.0<0.0182318
ENSGALG00000011623ADAMTS31.9<0.01208803
ENSGALG00000031916ZP11.80.0178283
ENSGALG00000000667EDN21.8<0.0115805639
ENSGALG00000026055PALM1.8<0.0160210
ENSGALG00000009687KCNK21.8<0.0110,36235,972
ENSGALG00000004812FAM129A1.80.0258203
ENSGALG00000007268-1.8<0.01192669
ENSGALG00000002671-1.8<0.016602230
ENSGALG00000032836-1.7<0.01137445
ENSGALG00000012595AGTPBP11.7<0.0196310
ENSGALG00000001768TENM21.70.013401095
ENSGALG00000011994SYNPO21.70.0266215
ENSGALG00000036883MET1.7<0.016191988
ENSGALG00000009612TGFB21.7<0.01188600
ENSGALG00000045776CPN21.70.0190282
ENSGALG00000002081MMP281.6<0.01112348
ENSGALG00000015542PLPPR11.6<0.01105324
ENSGALG00000017065-1.60.0584259
ENSGALG00000011145TRIL1.60.0199301
ENSGALG00000034085-1.60.01207627
ENSGALG00000031534ARID5B1.6<0.013601081
ENSGALG00000026981NHSL11.60.013701102
ENSGALG00000027514-1.6<0.0111683445
ENSGALG00000016251-1.6<0.0114854369
ENSGALG00000012115WT11.5<0.0115144420
ENSGALG00000010902CERS61.50.05153448
ENSGALG00000051001-1.50.01294844
ENSGALG00000009495FGFR21.5<0.01229648
ENSGALG00000012834AKR1D11.5<0.014601297
Table 5. Enrichment analysis of upregulated differentially expressed genes in FF hens. This table shows the top ten significant terms associated with DEGs found to be upregulated in FF granulosa cells of 6–8-mm follicles. The functional category, number of genes found in the DEG list, total number of genes found in the database for the specific functional category term, and the FDR are listed.
Functional CategoryGenesTotal GenesFDR
Lipid catabolic process101862.17 × 10−4
Heme export221.65 × 10−2
Positive regulation of actin filament bundle assembly4443.44 × 10−2
Cellular lipid catabolic process61263.44 × 10−2
Proteoglycan biosynthetic process4483.81 × 10−2
Inositol trisphosphate biosynthetic process3213.81 × 10−2
Positive regulation of cellular component biogenesis93453.81 × 10−2
Heme transport264.43 × 10−2
Inositol trisphosphate metabolic process3244.43 × 10−2
Transmembrane transport1711224.43 × 10−2
Table 6. Enrichment analysis of upregulated differentially expressed genes in RF hens. This table shows ten significant terms associated with DEGs found to be upregulated in RF granulosa cells of 6–8-mm follicles. The functional category, number of genes in the DEG list, total number of genes in the database for the specific functional category term, and the FDR are listed.
Functional CategoryGenesTotal GenesFDR
Ion transport1211173.26 × 10−2
Cation transport107573.26 × 10−2
Muscle contraction51713.26 × 10−2
Nitric oxide mediated signal transduction2113.26 × 10−2
Regulation of heart contraction41123.26 × 10−2
Regulation of nitric oxide mediated signal transduction263.26 × 10−2
Metal ion transport85453.26 × 10−2
Ion transmembrane transport107903.26 × 10−2
Regulation of system process62913.26 × 10−2
Positive regulation of cell size263.26 × 10−2
Publisher’s Note: MDPI stays neutral with regard to jurisdictional claims in published maps and institutional affiliations.

