
Evaluation of Changes in Metabolites of Saliva in Canine Obesity Using a Targeted Metabolomic Approach

 ,
, 
 ,
,  and
and
Abstract
:Simple Summary
Abstract
1. Introduction
2. Materials and Methods
2.1. Dogs
2.2. Saliva Sampling Procedures
2.3. Mass Spectroscopy Analysis (FIA-MS/MS and LC-MS/MS)
2.4. Statistical Analysis
2.5. Bioinformatics
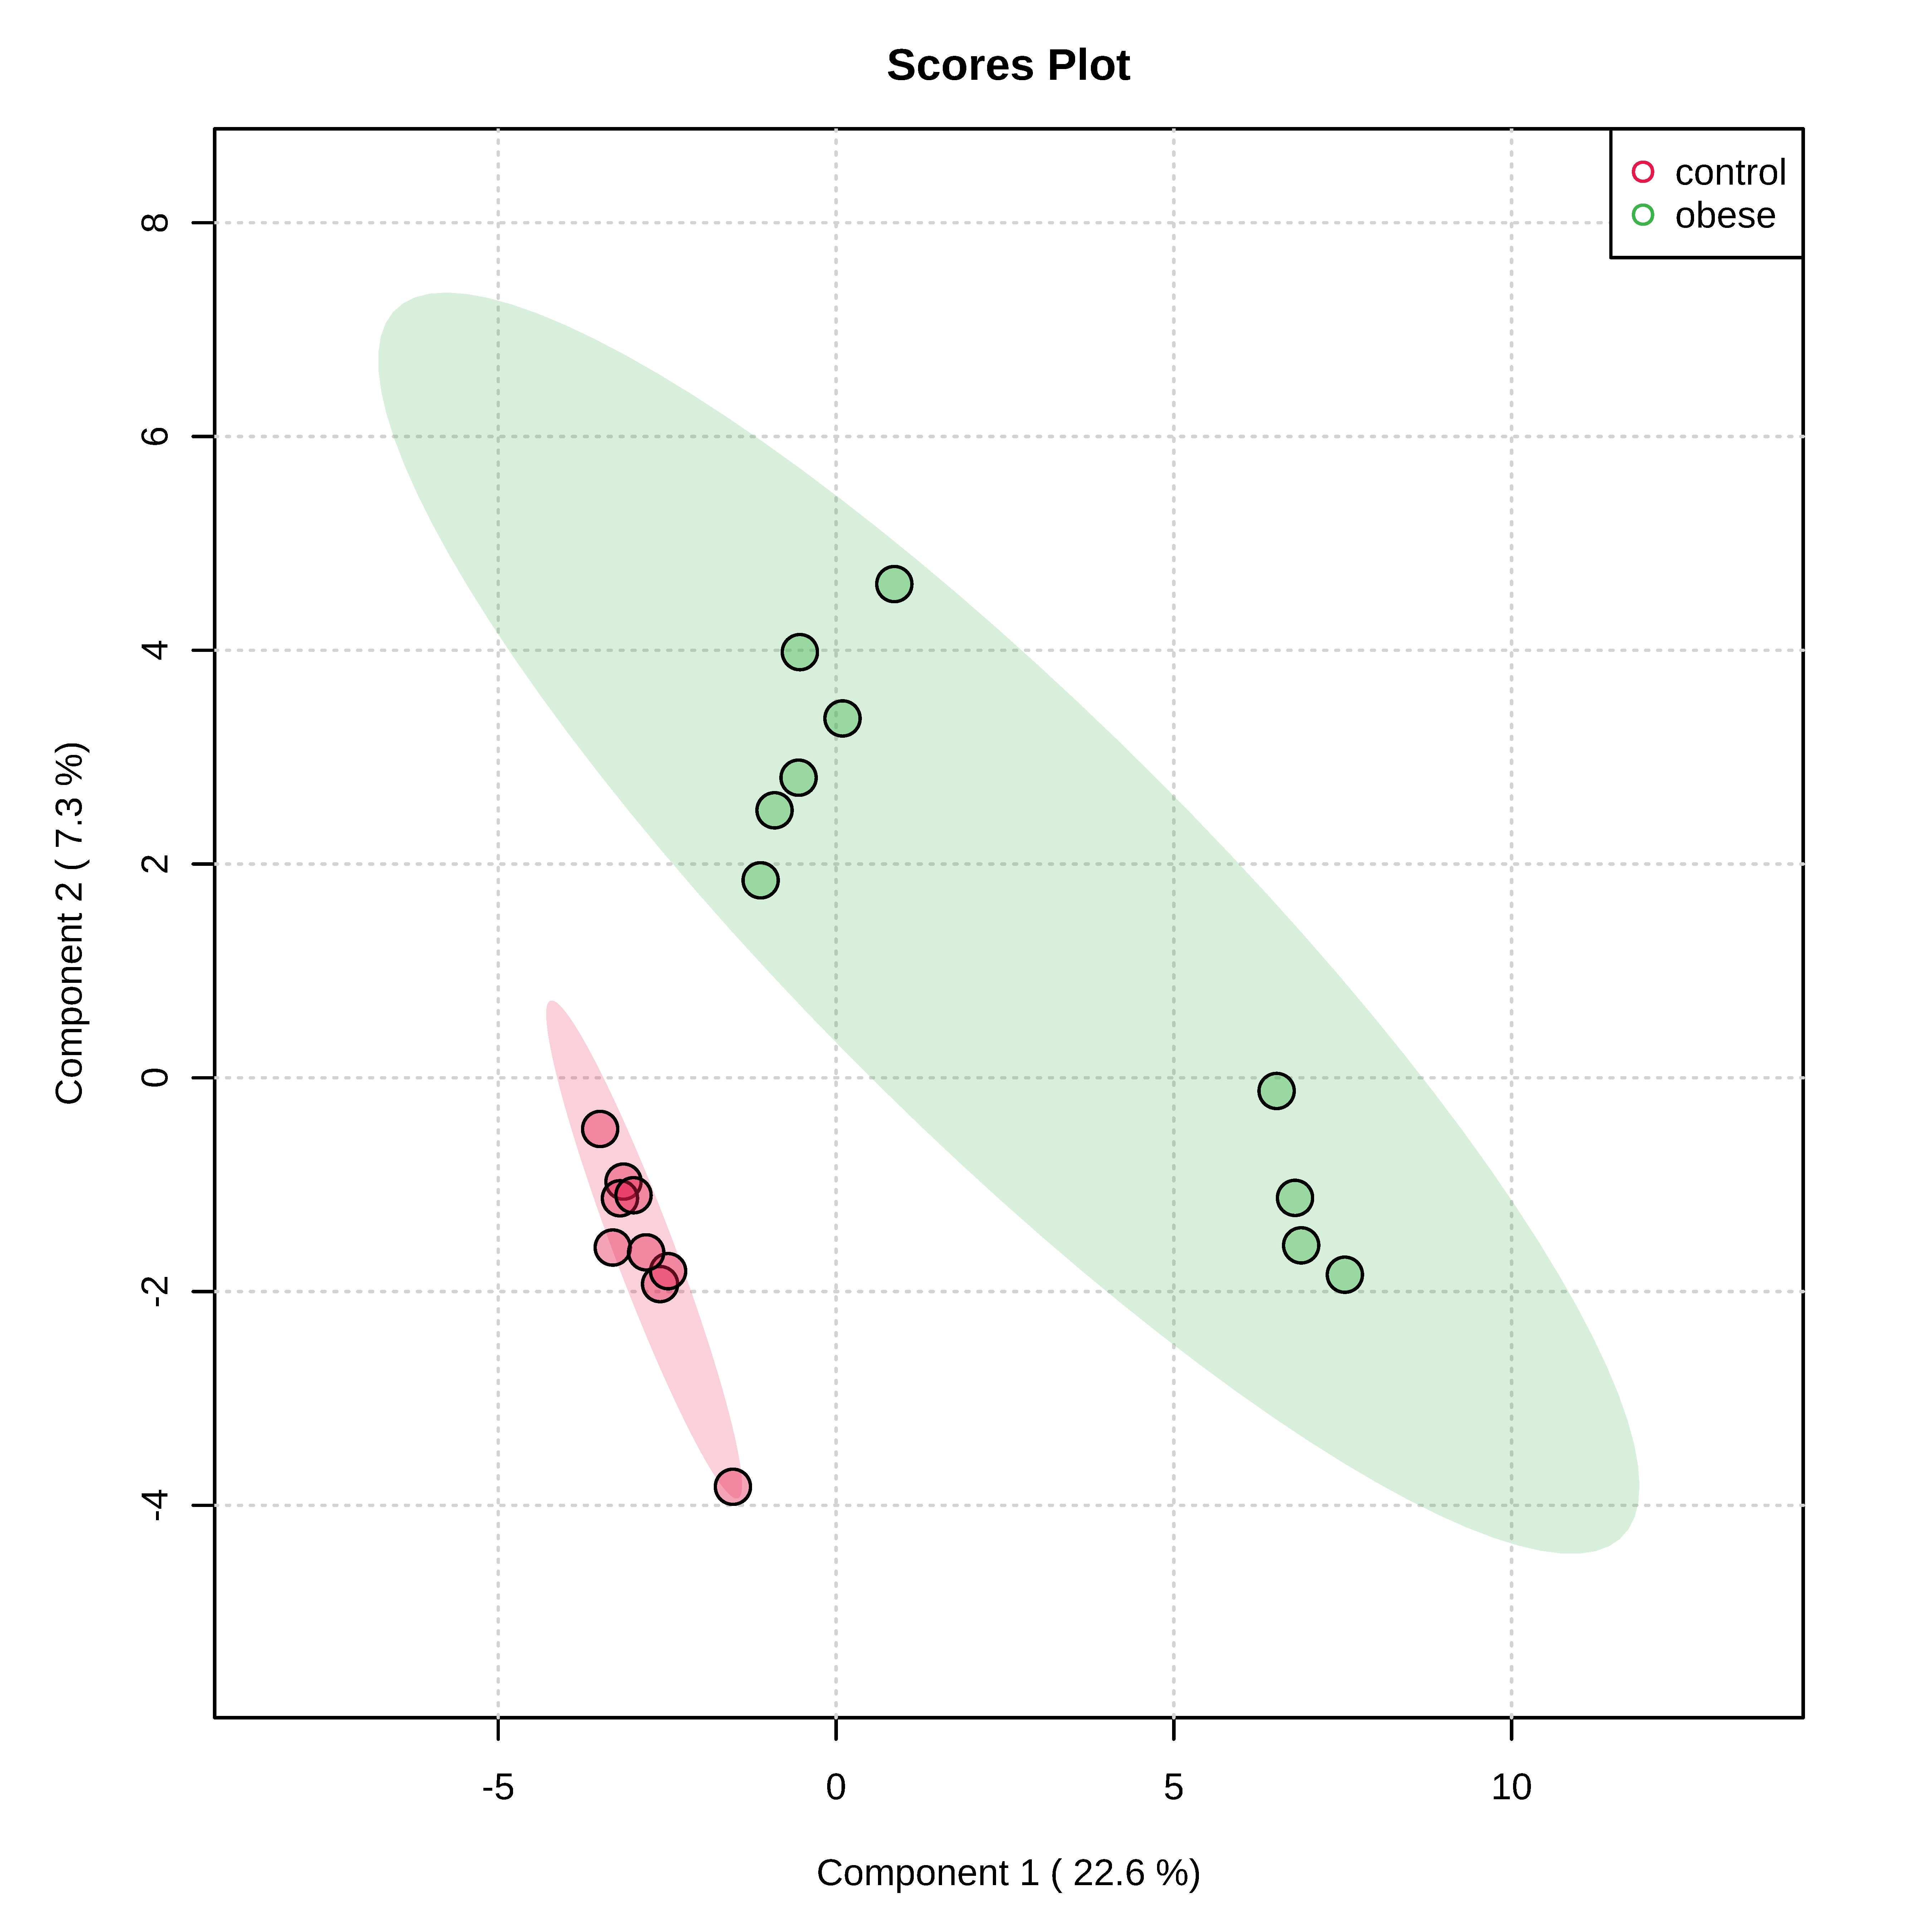
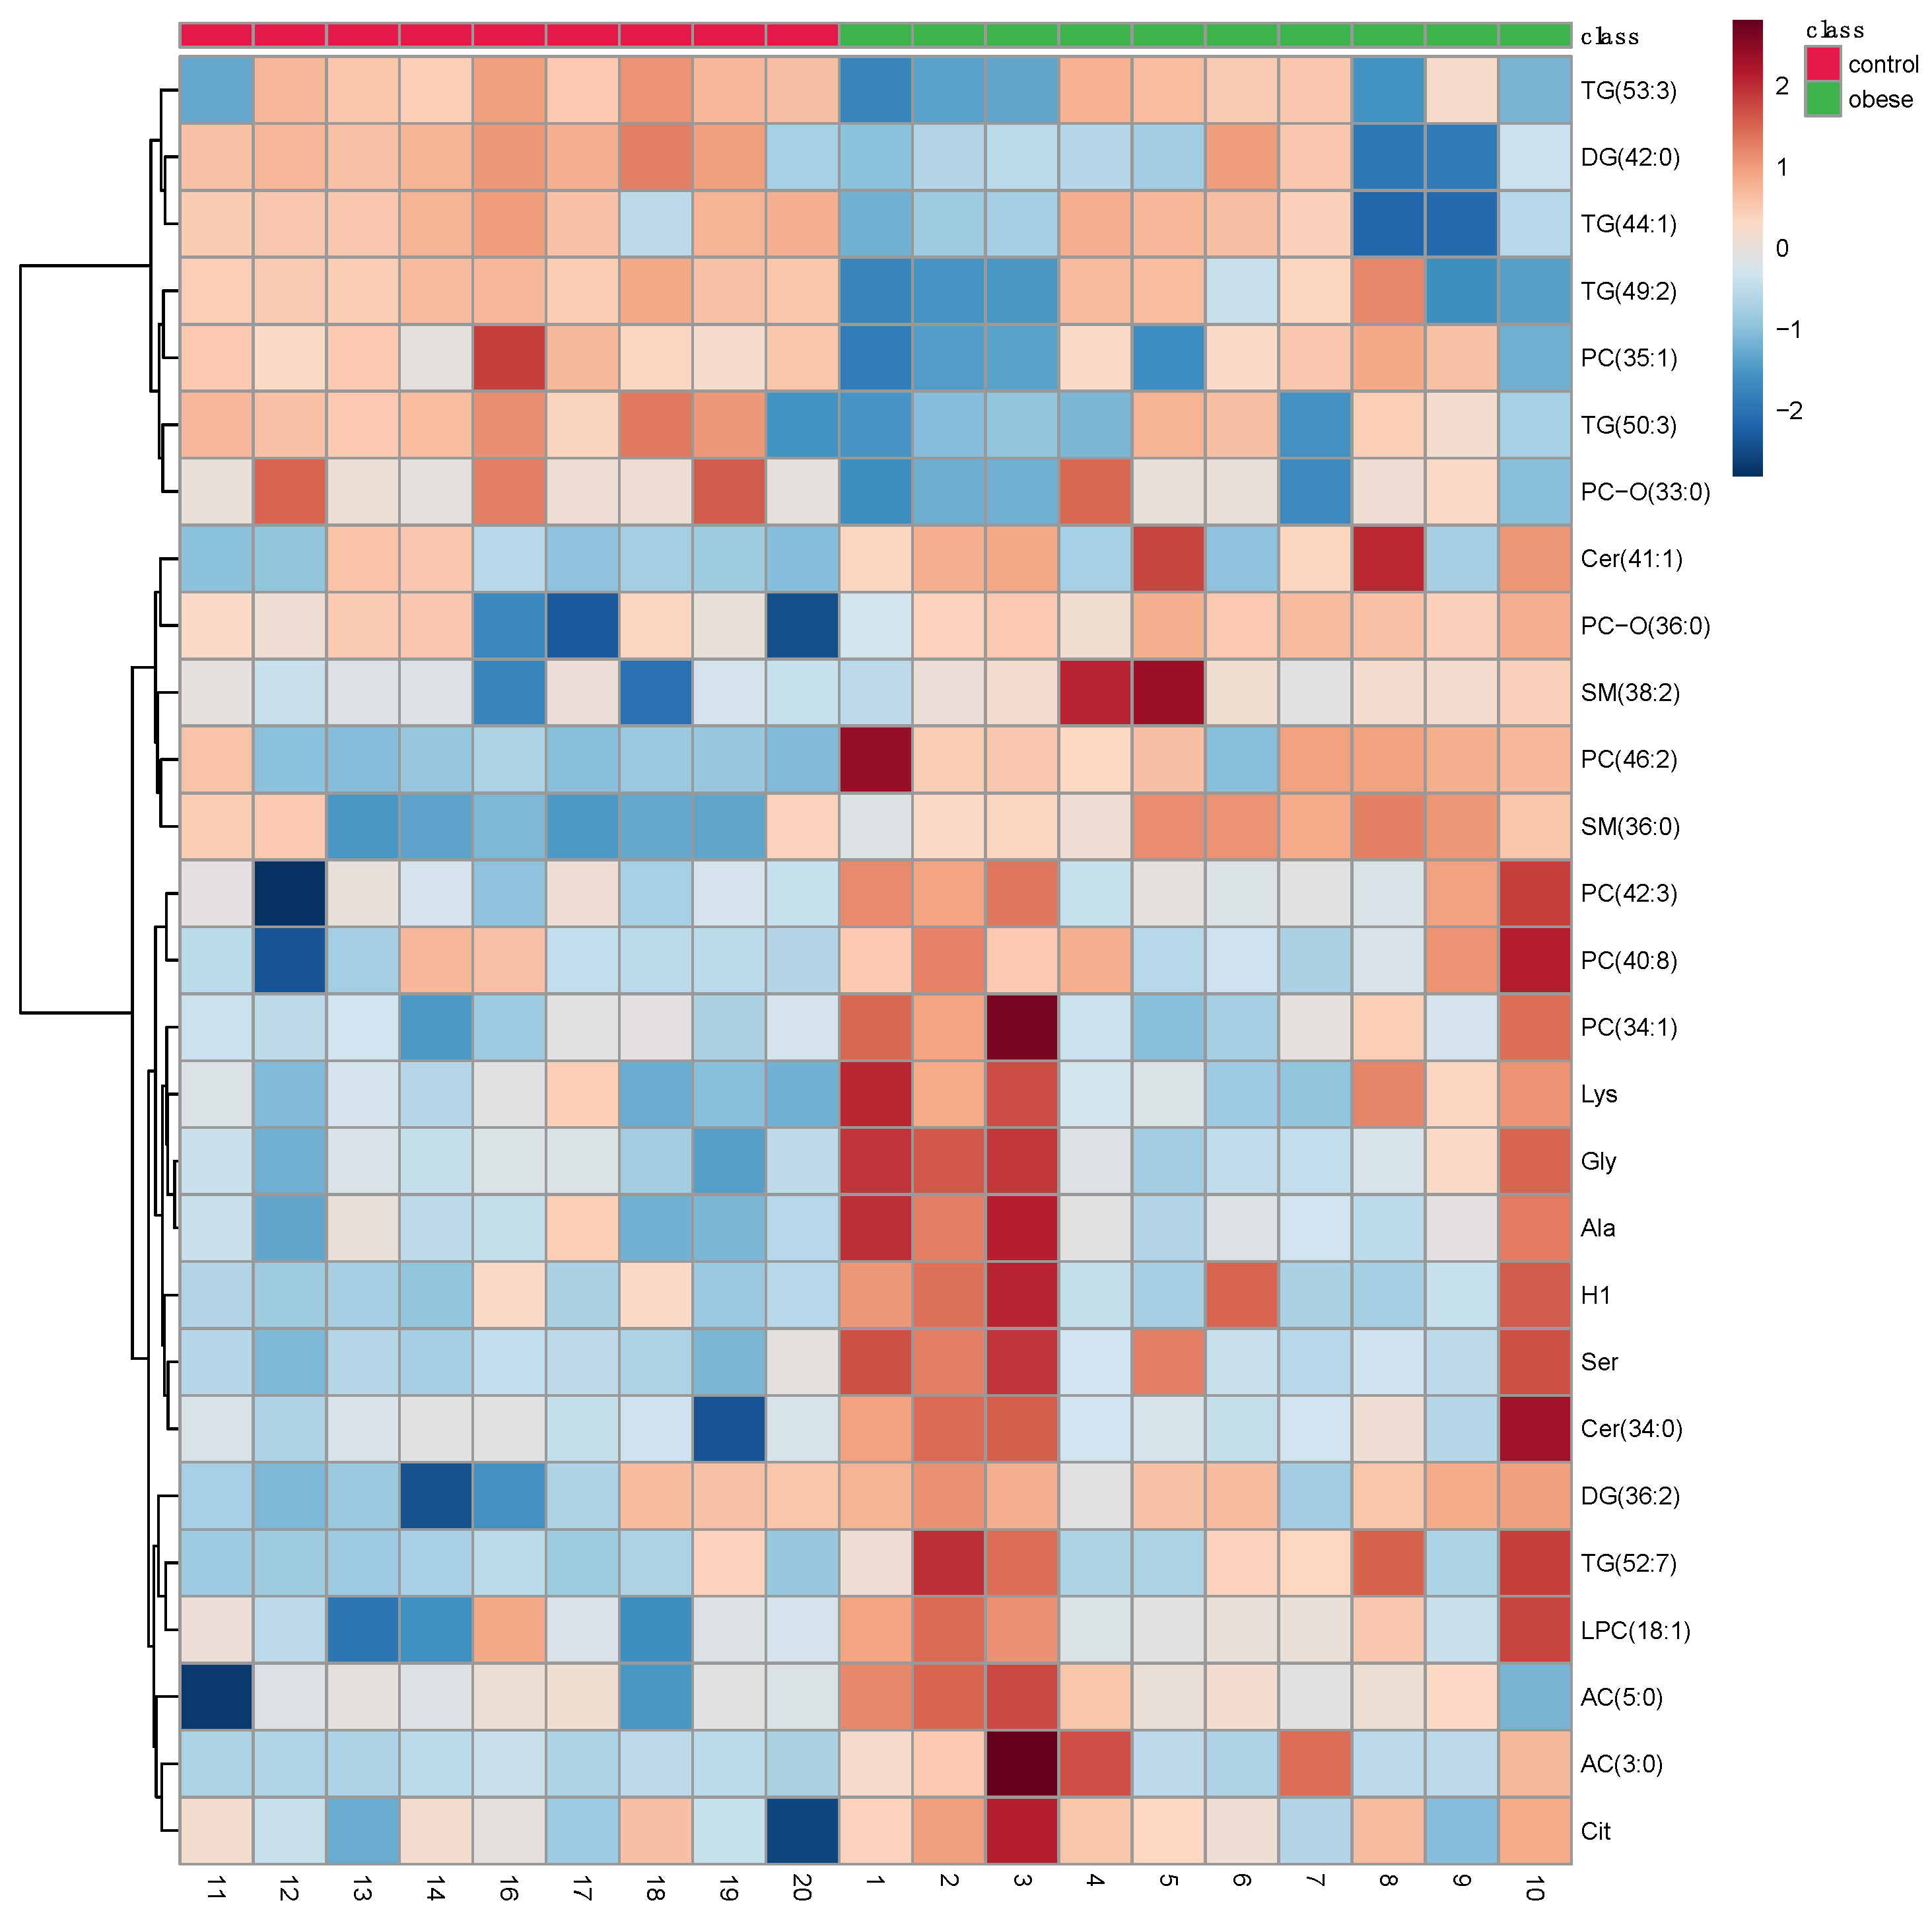
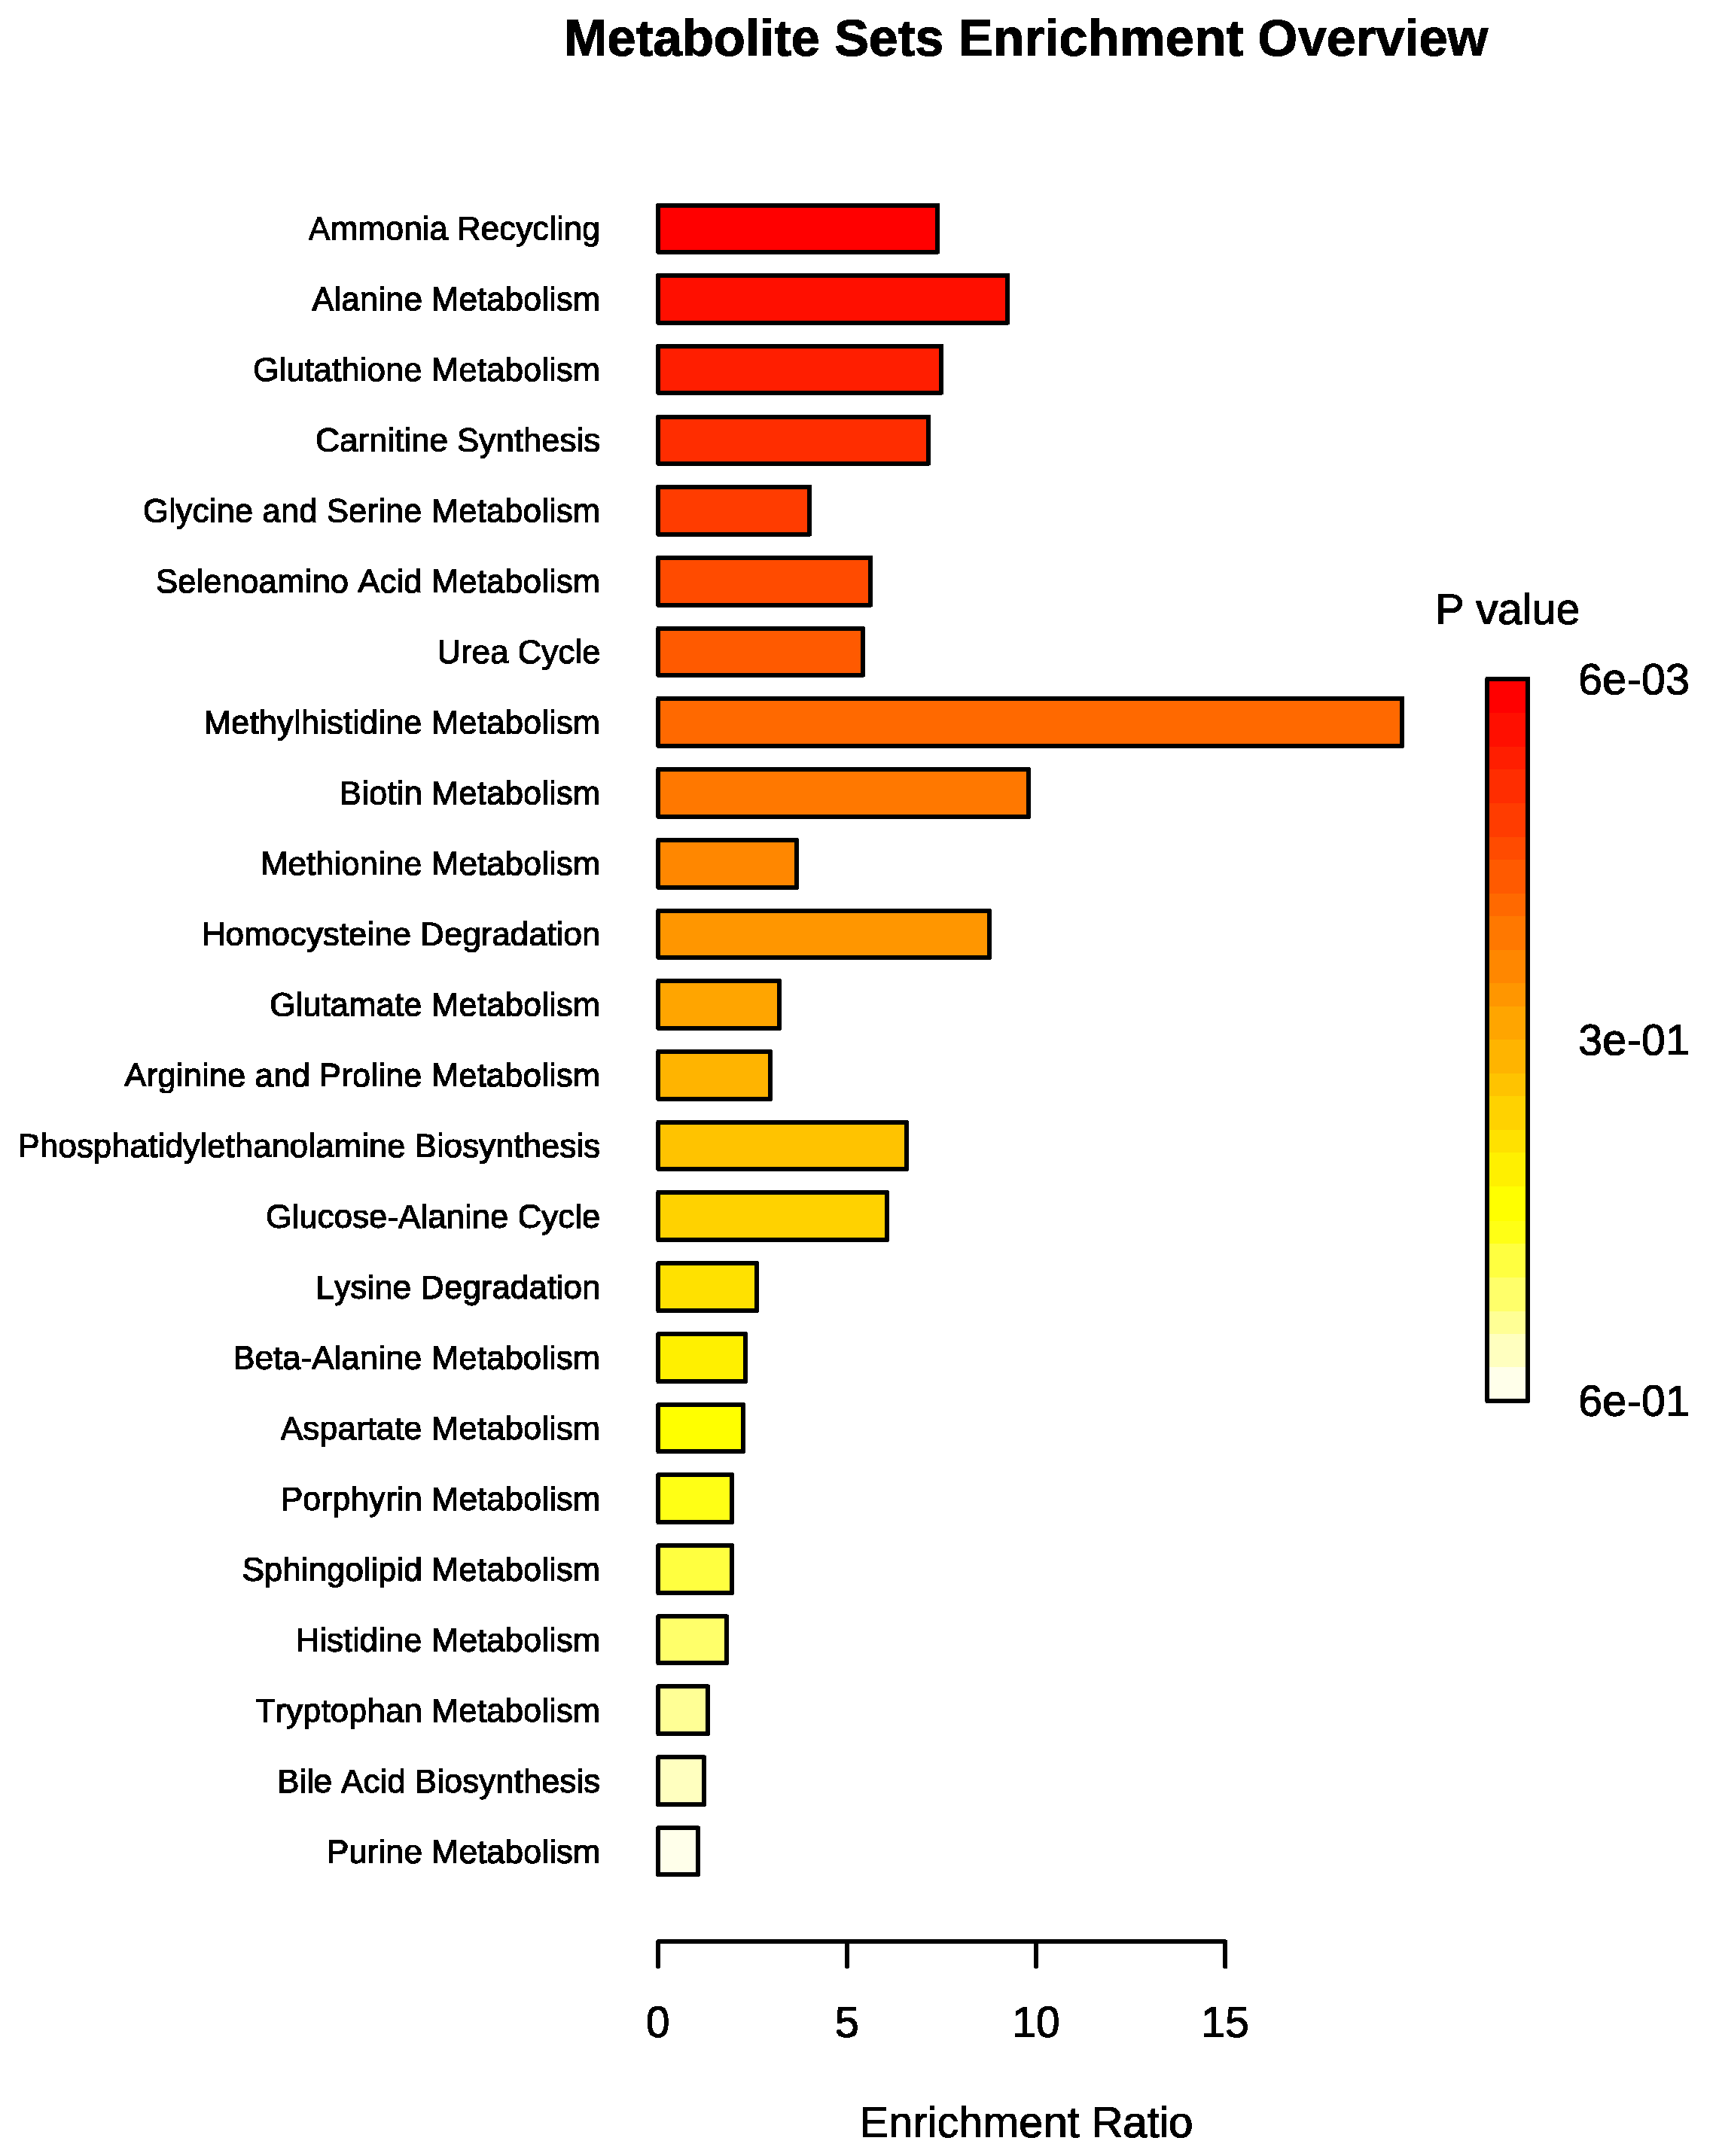
3. Results
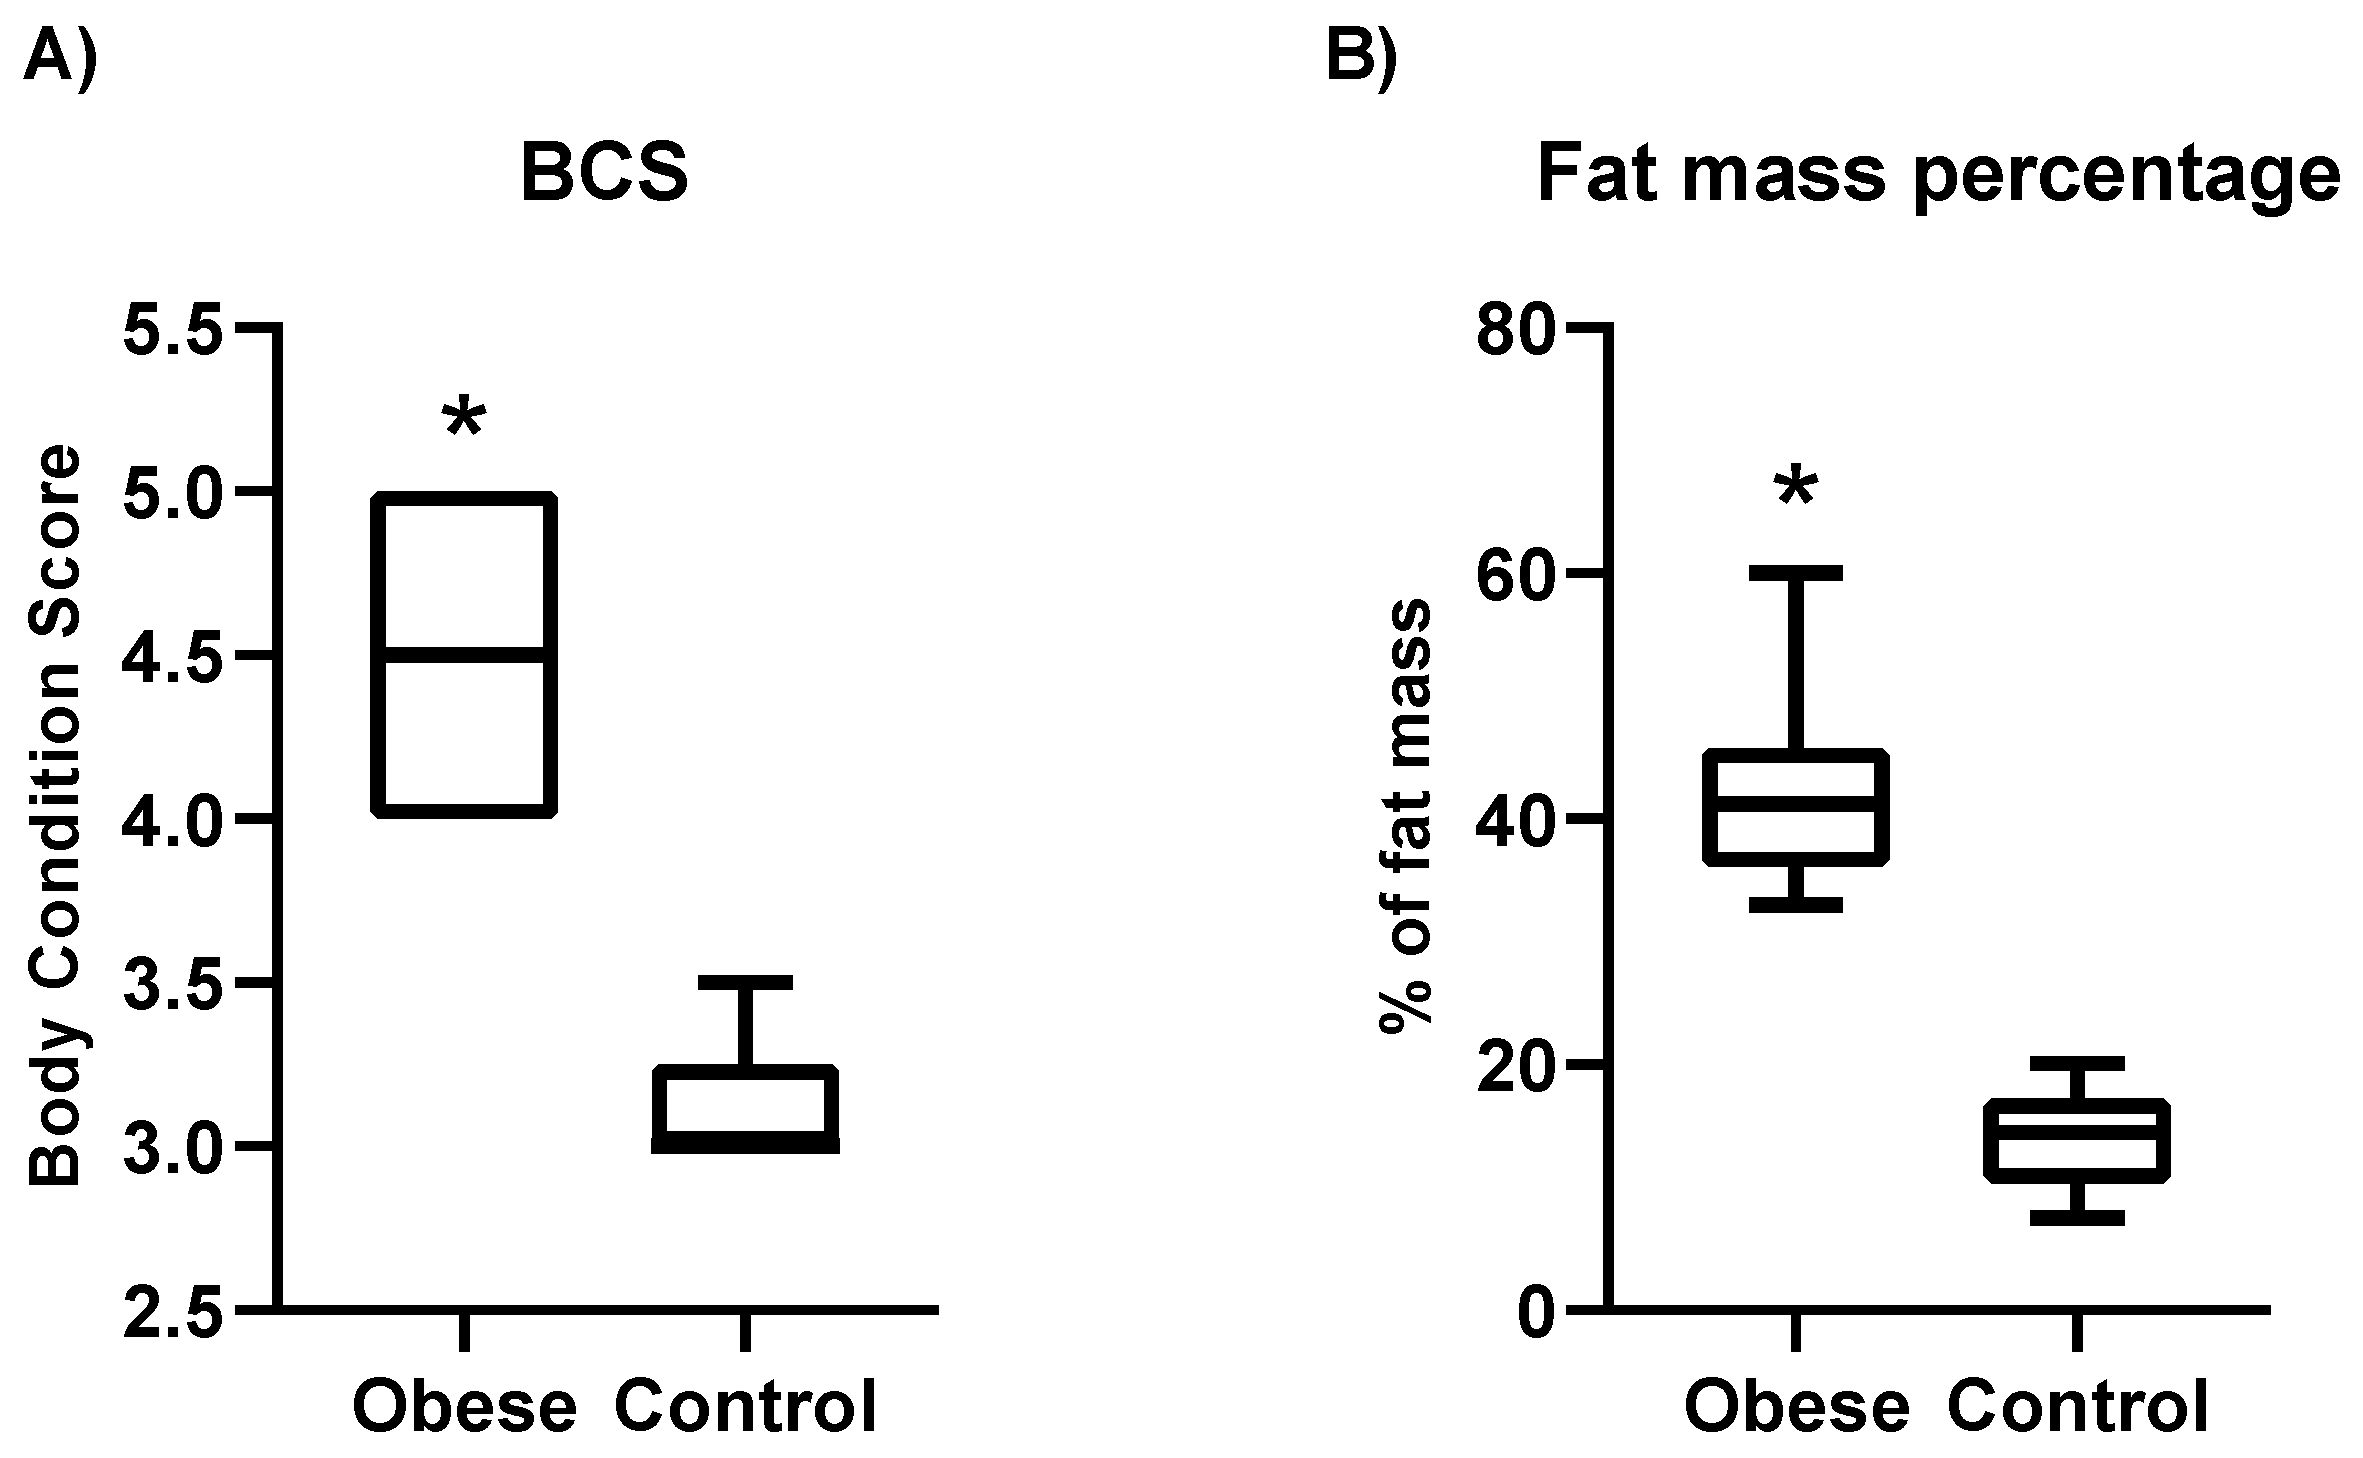
3.1. Characteristics of Dogs
3.2. Metabolomic Profile Differences between Obese and Control Dogs
4. Discussion
5. Conclusions
Supplementary Materials
Author Contributions
Funding
Institutional Review Board Statement
Conflicts of Interest
References
- Muñoz-Prieto, A.; Nielsen, L.R.; Dąbrowski, R.; Bjørnvad, C.R.; Söder, J.; Lamy, E.; Monkeviciene, I.; Ljubić, B.B.; Vasiu, I.; Savic, S.; et al. European dog owner perceptions of obesity and factors associated with human and canine obesity. Sci. Rep. 2018, 8, 13353. [Google Scholar] [CrossRef] [Green Version]
- Tvarijonaviciute, A.; Muñoz-Prieto, A.; Martinez-Subiela, S. Obesity in Humans and Dogs: Similarities, Links, and Differences BT. In Pets as Sentinels, Forecasters and Promoters of Human Health; Pastorinho, M.R., Sousa, A.C.A., Eds.; Springer International Publishing: Cham, Switzerland, 2020; pp. 143–172. ISBN 978-3-030-30734-9. [Google Scholar]
- German, A.J. The Growing Problem of Obesity in Dogs and Cats. J. Nutr. 2006, 136, 1940S–1946S. [Google Scholar] [CrossRef] [Green Version]
- Muñoz-Prieto, A.; Cerón, J.J.; Martínez-Subiela, S.; Mrljak, V.; Tvarijonaviciute, A. A Systematic Review and Meta-Analysis of Serum Adiponectin Measurements in the Framework of Dog Obesity. Animals 2020, 10, 1650. [Google Scholar] [CrossRef] [PubMed]
- Tropf, M.; Nelson, O.L.; Lee, P.M.; Weng, H.Y. Cardiac and Metabolic Variables in Obese Dogs. J. Vet. Intern. Med. 2017, 31, 1000–1007. [Google Scholar] [CrossRef] [PubMed]
- Tvarijonaviciute, A.; Tecles, F.; Martinez-Subiela, S.; Ceron, J.J. Effect of weight loss on inflammatory biomarkers in obese dogs. Vet. J. 2012, 193, 570–572. [Google Scholar] [CrossRef] [PubMed]
- German, A.J.; Hervera, M.; Hunter, L.; Holden, S.L.; Morris, P.; Biourge, V.J.; Trayhurn, P. Improvement in insulin resistance and reduction in plasma inflammatory adipokines after weight loss in obese dogs. Domest. Anim. Endocrinol. 2009, 37, 214–226. [Google Scholar] [CrossRef]
- Verkest, K.R.; Fleeman, L.M.; Morton, J.M.; Ishioka, K.; Rand, J.S. Compensation for obesity-induced insulin resistance in dogs: Assessment of the effects of leptin, adiponectin, and glucagon-like peptide-1 using path analysis. Domest. Anim. Endocrinol. 2011, 41, 24–34. [Google Scholar] [CrossRef]
- Cerón, J.J. Acute phase proteins, saliva and education in laboratory science: An update and some reflections. BMC Vet. Res. 2019, 15, 197. [Google Scholar] [CrossRef]
- Tvarijonaviciute, A.; Martinez-Subiela, S.; Ceron, J.J. Validation of 2 commercially available enzyme-linked immunosorbent assays for adiponectin determination in canine serum samples. Can. J. Vet. Res. 2010, 74, 279–285. [Google Scholar]
- Muñoz-Prieto, A.; Escribano, D.; Cerón, J.J.; Martínez-Subiela, S.; Tvarijonaviciute, A. Glucose, fructosamine, and insulin measurements in saliva of dogs: Variations after an experimental glucose administration. Domest. Anim. Endocrinol. 2018, 66, 64–71. [Google Scholar] [CrossRef]
- Abu Bakar, M.H.; Sarmidi, M.R.; Cheng, K.-K.; Ali Khan, A.; Suan, C.L.; Zaman Huri, H.; Yaakob, H. Metabolomics—The complementary field in systems biology: A review on obesity and type 2 diabetes. Mol. BioSyst. 2015, 11, 1742–1774. [Google Scholar] [CrossRef]
- Roberts, L.D.; Souza, A.L.; Gerszten, R.E.; Clish, C.B. Targeted Metabolomics. Curr. Protoc. Mol. Biol. 2012, 98, 30.2.1–30.2.24. [Google Scholar] [CrossRef]
- Xiao, J.F.; Zhou, B.; Ressom, H.W. Metabolite identification and quantitation in LC-MS/MS-based metabolomics. TRAC Trends Anal. Chem. 2012, 32, 1–14. [Google Scholar] [CrossRef] [Green Version]
- Vendramini, T.H.A.; Macedo, H.T.; Zafalon, R.V.A.; Macegoza, M.V.; Pedrinelli, V.; Risolia, L.W.; Ocampos, F.M.M.; Jeremias, J.T.; Pontieri, C.F.F.; Ferriolli, E.; et al. Serum metabolomics analysis reveals that weight loss in obese dogs results in a similar metabolic profile to dogs in ideal body condition. Metabolomics 2021, 17, 27. [Google Scholar] [CrossRef] [PubMed]
- Söder, J.; Höglund, K.; Dicksved, J.; Hagman, R.; Eriksson Röhnisch, H.; Moazzami, A.A.; Wernersson, S. Plasma metabolomics reveals lower carnitine concentrations in overweight Labrador Retriever dogs. Acta Vet. Scand. 2019, 61, 10. [Google Scholar] [CrossRef] [Green Version]
- Lund, E.M.; Armstrong, P.J.; Kirk, C.A.; Klausner, J.S. Prevalence and risk factors for obesity. Int. J. Appl. Res. Vet. Med. 2006, 4, 177–186. [Google Scholar]
- Son, H.R.; D’Avignon, D.A.; Laflamme, D.P. Comparison of dual-energy x-ray absorptiometry and measurement of total body water content by deuterium oxide dilution for estimating body composition in dogs. Am. J. Vet. Res. 1998, 59, 529–532. [Google Scholar]
- Tvarijonaviciute, A.; Ceron, J.J.; Holden, S.L.; Cuthbertson, D.J.; Biourge, V.; Morris, P.J.; German, A.J. Obesity-related metabolic dysfunction in dogs: A comparison with human metabolic syndrome. BMC Vet. Res. 2012, 8, 8. [Google Scholar] [CrossRef] [Green Version]
- Yoon, M.-S. The Emerging Role of Branched-Chain Amino Acids in Insulin Resistance and Metabolism. Nutrients 2016, 8, 405. [Google Scholar] [CrossRef] [Green Version]
- Jourdan, C.; Petersen, A.-K.; Gieger, C.; Döring, A.; Illig, T.; Wang-Sattler, R.; Meisinger, C.; Peters, A.; Adamski, J.; Prehn, C.; et al. Body Fat Free Mass Is Associated with the Serum Metabolite Profile in a Population-Based Study. PLoS ONE 2012, 7, e40009. [Google Scholar] [CrossRef] [PubMed] [Green Version]
- Wang, T. The Natriuretic Peptides and Fat Metabolism. N. Engl. J. Med. 2012, 367, 377–378. [Google Scholar] [CrossRef]
- Kojta, I.; Chacińska, M.; Błachnio-Zabielska, A. Obesity, Bioactive Lipids, and Adipose Tissue Inflammation in Insulin Resistance. Nutrients 2020, 12, 1305. [Google Scholar] [CrossRef]
- Fikri, A.M.; Smyth, R.; Kumar, V.; Al-Abadla, Z.; Abusnana, S.; Munday, M.R. Pre-diagnostic biomarkers of type 2 diabetes identified in the UAE’s obese national population using targeted metabolomics. Sci. Rep. 2020, 10, 17616. [Google Scholar] [CrossRef]
- Sokolowska, E.; Blachnio-Zabielska, A. The Role of Ceramides in Insulin Resistance. Front. Endocrinol. 2019, 10, 577. [Google Scholar] [CrossRef] [Green Version]
- Kayser, B.D.; Lhomme, M.; Belda, E.; Dao, M.-C.; Aron-Wisnewsky, J.; Kontush, A.; Zucker, J.-D.; Rizkalla, S.W.; Dugail, I.; Clément, K.; et al. Elevated serum ceramides are linked with obesity-associated gut dysbiosis and impaired glucose metabolism. Metabolomics 2019, 15, 140. [Google Scholar] [CrossRef] [PubMed]
- Vance, J.E. Phosphatidylserine and phosphatidylethanolamine in mammalian cells: Two metabolically related aminophospholipids. J. Lipid Res. 2008, 49, 1377–1387. [Google Scholar] [CrossRef] [Green Version]
- Petkevicius, K.; Virtue, S.; Bidault, G.; Jenkins, B.; Cubuk, C.; Morgantini, C.; Aouadi, M.; Dopazo, J.; Serlie, M.J.; Koulman, A.; et al. Accelerated phosphatidylcholine turnover in macrophages promotes adipose tissue inflammation in obesity. eLife 2019, 8, e47990. [Google Scholar] [CrossRef]
- de Godoy, M.R.C.; Pappan, K.L.; Swanson, R.W.G.; Swanson, K.S. Plasma Metabolite Profiling and Search for Biomarkers of Metabolic Dysfunction in Dogs Undergoing Rapid Weight Gain. Curr. Metab. 2015, 3, 102–121. [Google Scholar] [CrossRef]
- Wang, G.; Sun, Q.; Liang, L.; Clash, C.; Zhang, C.; Hong, X.; Ji, Y.; Radovick, S.; Pearson, C.; Bartell, T.R.; et al. Inter-generational link of obesity in term and preterm births: Role of maternal plasma acylcarnitines. Int. J. Obes. 2019, 43, 1967–1977. [Google Scholar] [CrossRef] [PubMed]


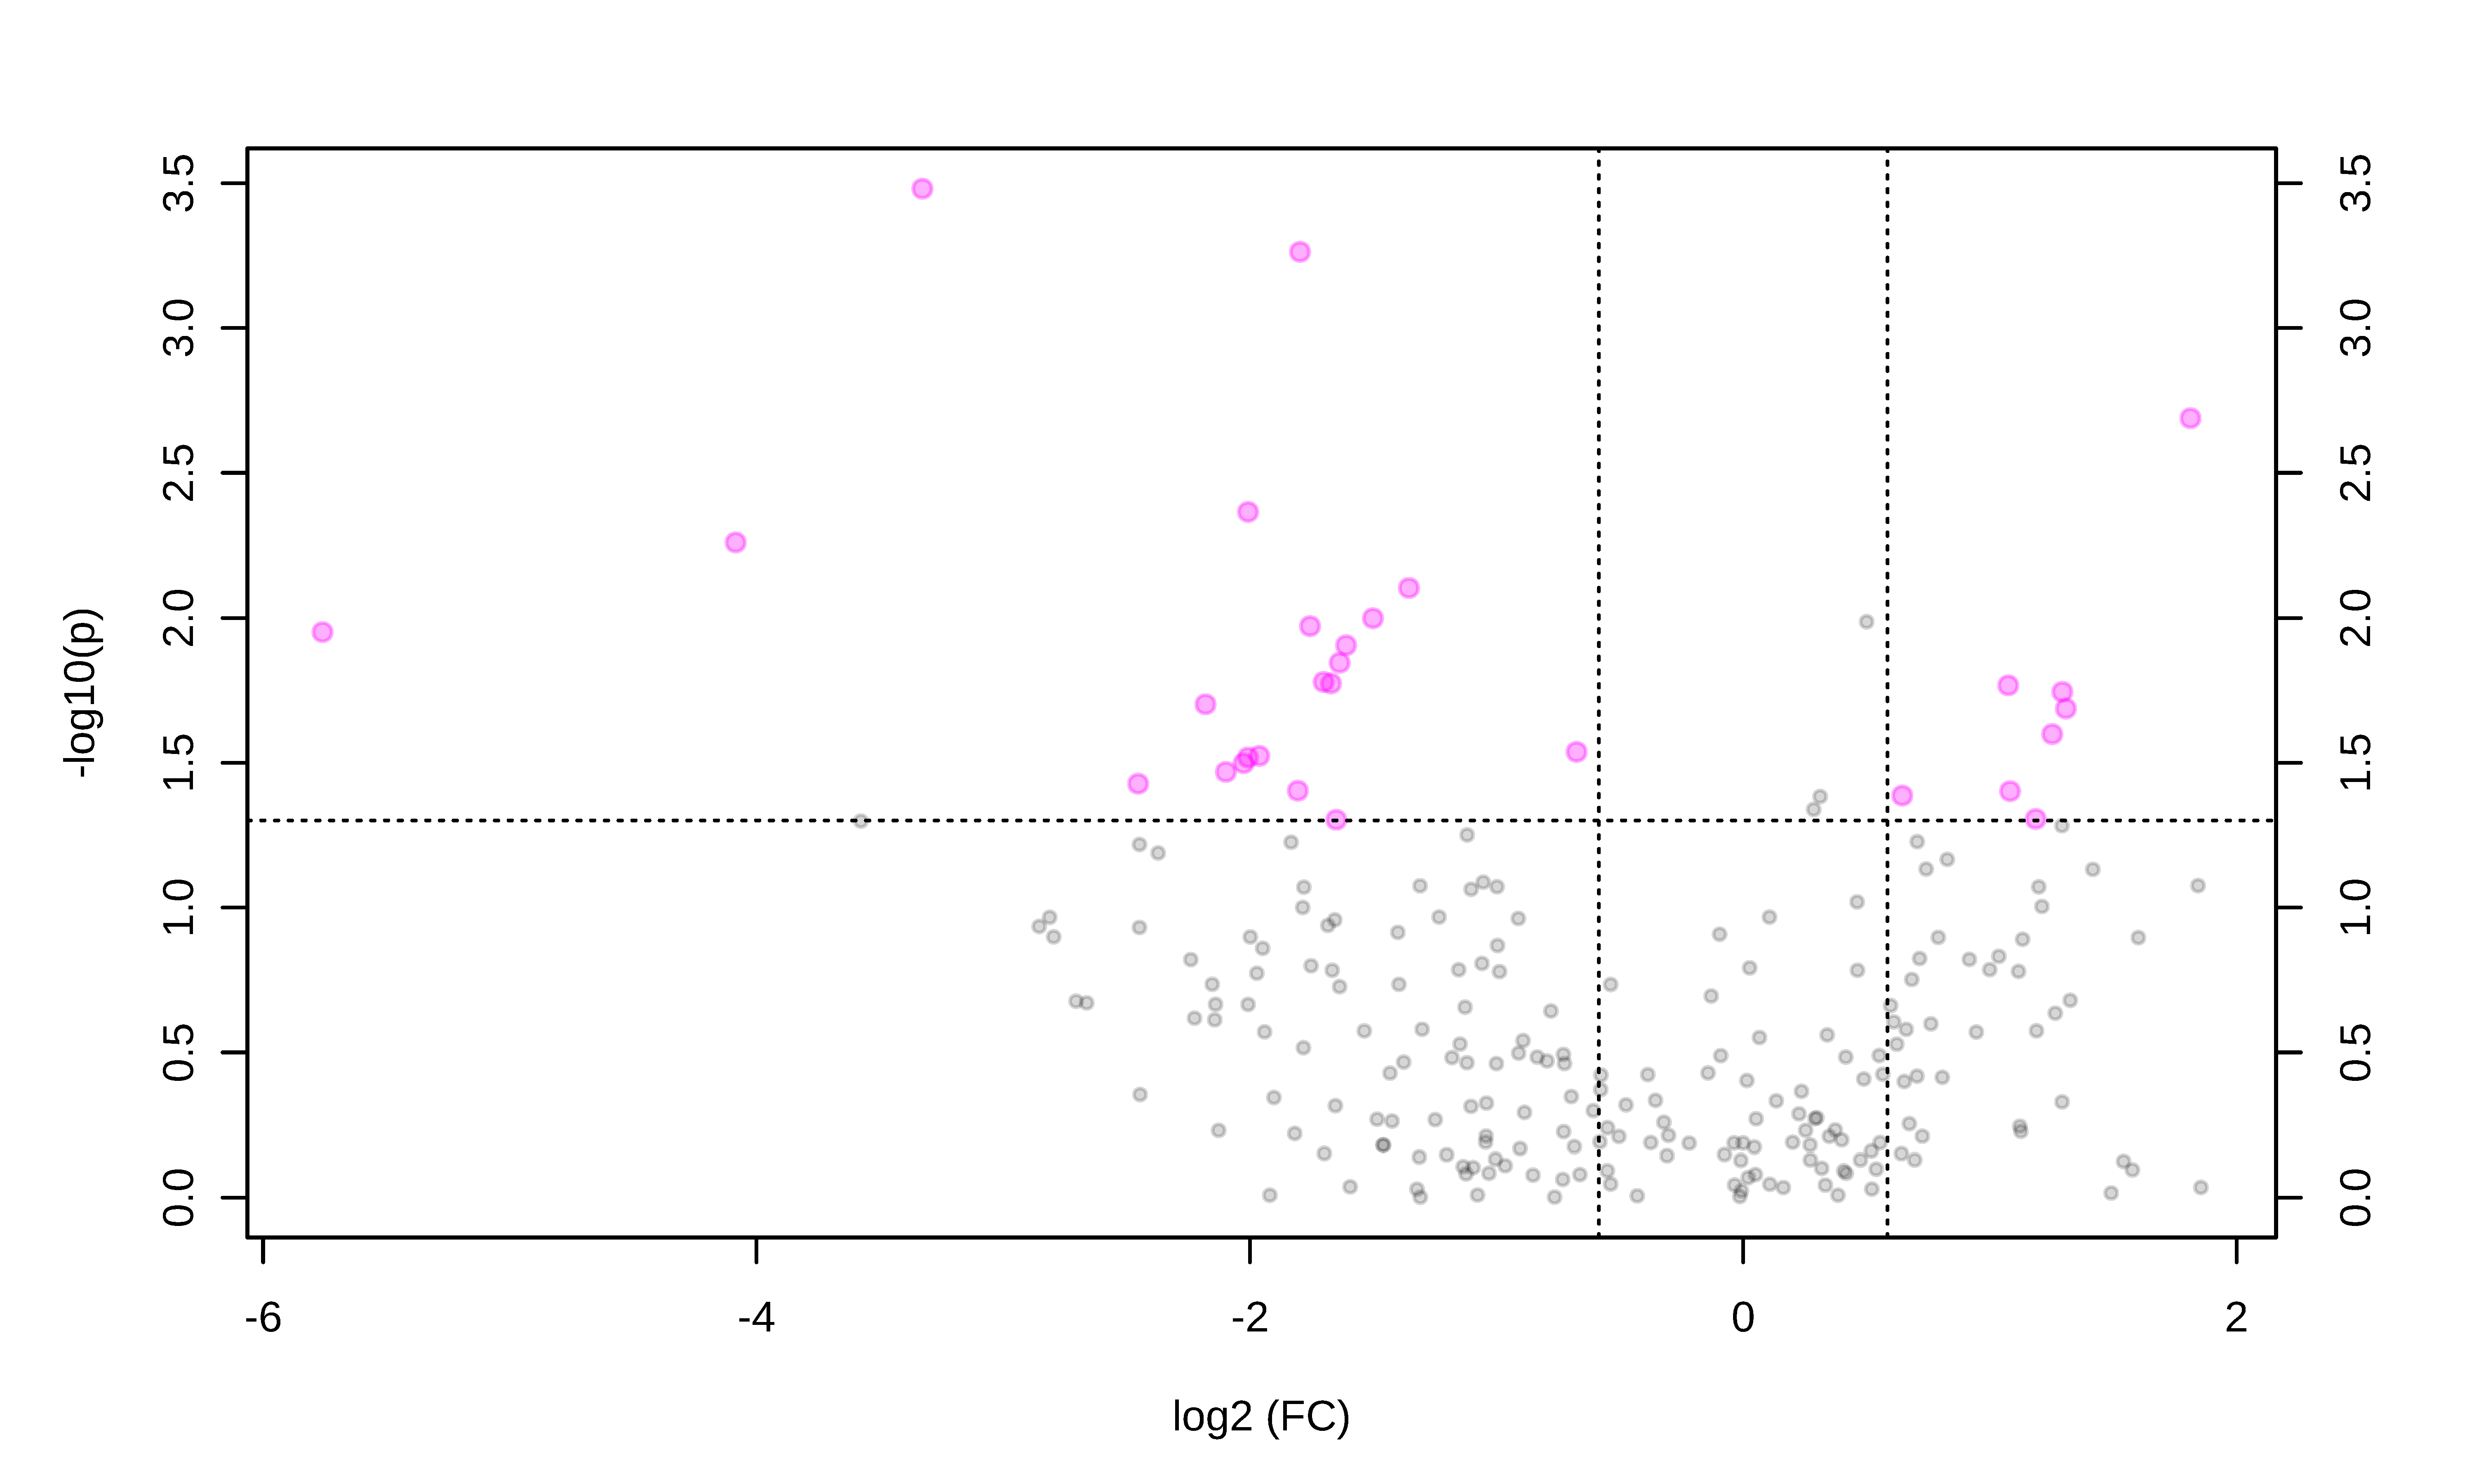
| Metabolite Class | Metabolite | FC | Log2 (FC) | p-Value | -Log10 (p) | VIP Values | Regulation in the Obese Group |
|---|---|---|---|---|---|---|---|
| Sugar | H1 | 0.25 | −1.96 | 0.02 | 1.52 | 1.17 | Up |
| Amino acid | Citrulline | 0.28 | −1.80 | 0.03 | 1.40 | 1.41 | Up |
| Serine | 0.24 | −2.00 | 0.004 | 2.36 | 1.31 | Up | |
| Lysine | 0.32 | −1.63 | 0.01 | 1.84 | 1.13 | Up | |
| Alanine | 0.31 | −1.67 | 0.01 | 1.77 | 1.09 | Up | |
| Glycine | 0.32 | −1.60 | 0.01 | 1.91 | 1.04 | Up | |
| Glycerides | TG(52:7) | 0.05 | −4.08 | 0.005 | 2.25 | 2.46 | Up |
| DG(42:0) | 3.51 | 1.81 | 0.002 | 2.68 | 2.27 | Down | |
| TG(44:1) | 2.10 | 1.07 | 0.01 | 1.76 | 1.77 | Down | |
| DG(36:2) | 0.39 | −1.35 | 0.007 | 2.10 | 1.72 | Up | |
| TG(53:3) | 2.11 | 1.08 | 0.03 | 1.40 | 1.53 | Down | |
| TG(50:3) | 2.47 | 1.30 | 0.02 | 1.68 | 1.32 | Down | |
| TG(53:6) | 2.27 | 1.18 | 0.04 | 1.30 | 1.16 | Down | |
| Sphingolipids | SM(36:0) | 0.28 | −1.79 | 0.0005 | 3.26 | 2.01 | Up |
| Cer(41:1) | 0.22 | −2.17 | 0.01 | 1.70 | 1.50 | Up | |
| Cer(34:0) | 0.24 | −2.00 | 0.03 | 1.51 | 1.23 | Up | |
| SM(38:2) | 0.30 | −1.70 | 0.01 | 1.77 | 1.15 | Up | |
| Glycerophospholipids | PC(46:2) | 0.09 | −3.32 | 0.0003 | 3.48 | 2.46 | Up |
| PC-O(33:0) | 2.38 | 1.25 | 0.02 | 1.59 | 1.64 | Down | |
| LPC(18:1) | 0.29 | −1.75 | 0.01 | 1.97 | 1.63 | Up | |
| PC(35:1) | 2.45 | 1.29 | 0.01 | 1.74 | 1.62 | Down | |
| PC(40:8) | 0.23 | −2.09 | 0.03 | 1.46 | 1.57 | Up | |
| PC(38:2) | 1.56 | 0.64 | 0.04 | 1.38 | 1.41 | Down | |
| PC(42:3) | 0.35 | −1.50 | 0.01 | 1.99 | 1.22 | Up | |
| PC(34:1) | 0.24 | −2.02 | 0.03 | 1.49 | 1.11 | Up | |
| Acylcarnitines | AC(3:0) | 0.01 | −5.75 | 0.01 | 1.95 | 2.43 | Up |
| AC(5:0) | 0.18 | −2.45 | 0.03 | 1.42 | 1.8 | Up |
Publisher’s Note: MDPI stays neutral with regard to jurisdictional claims in published maps and institutional affiliations. |
© 2021 by the authors. Licensee MDPI, Basel, Switzerland. This article is an open access article distributed under the terms and conditions of the Creative Commons Attribution (CC BY) license (https://creativecommons.org/licenses/by/4.0/).
Share and Cite
Muñoz-Prieto, A.; Rubić, I.; Horvatić, A.; Rafaj, R.B.; Cerón, J.J.; Tvarijonaviciute, A.; Mrljak, V. Evaluation of Changes in Metabolites of Saliva in Canine Obesity Using a Targeted Metabolomic Approach. Animals 2021, 11, 2501. https://doi.org/10.3390/ani11092501
Muñoz-Prieto A, Rubić I, Horvatić A, Rafaj RB, Cerón JJ, Tvarijonaviciute A, Mrljak V. Evaluation of Changes in Metabolites of Saliva in Canine Obesity Using a Targeted Metabolomic Approach. Animals. 2021; 11(9):2501. https://doi.org/10.3390/ani11092501
Chicago/Turabian StyleMuñoz-Prieto, Alberto, Ivana Rubić, Anita Horvatić, Renata Barić Rafaj, José Joaquín Cerón, Asta Tvarijonaviciute, and Vladimir Mrljak. 2021. "Evaluation of Changes in Metabolites of Saliva in Canine Obesity Using a Targeted Metabolomic Approach" Animals 11, no. 9: 2501. https://doi.org/10.3390/ani11092501
APA StyleMuñoz-Prieto, A., Rubić, I., Horvatić, A., Rafaj, R. B., Cerón, J. J., Tvarijonaviciute, A., & Mrljak, V. (2021). Evaluation of Changes in Metabolites of Saliva in Canine Obesity Using a Targeted Metabolomic Approach. Animals, 11(9), 2501. https://doi.org/10.3390/ani11092501