
Comparison of Gut Microbiota of 96 Healthy Dogs by Individual Traits: Breed, Age, and Body Condition Score


Abstract
:Simple Summary
Abstract
1. Introduction
2. Materials and Methods
2.1. Animals
2.2. Experimental Design
2.3. Sample Collection and DNA Extraction
2.4. Library Construction and Sequencing
2.5. Gut Microbial Analysis
2.6. Statistical Analysis
3. Results
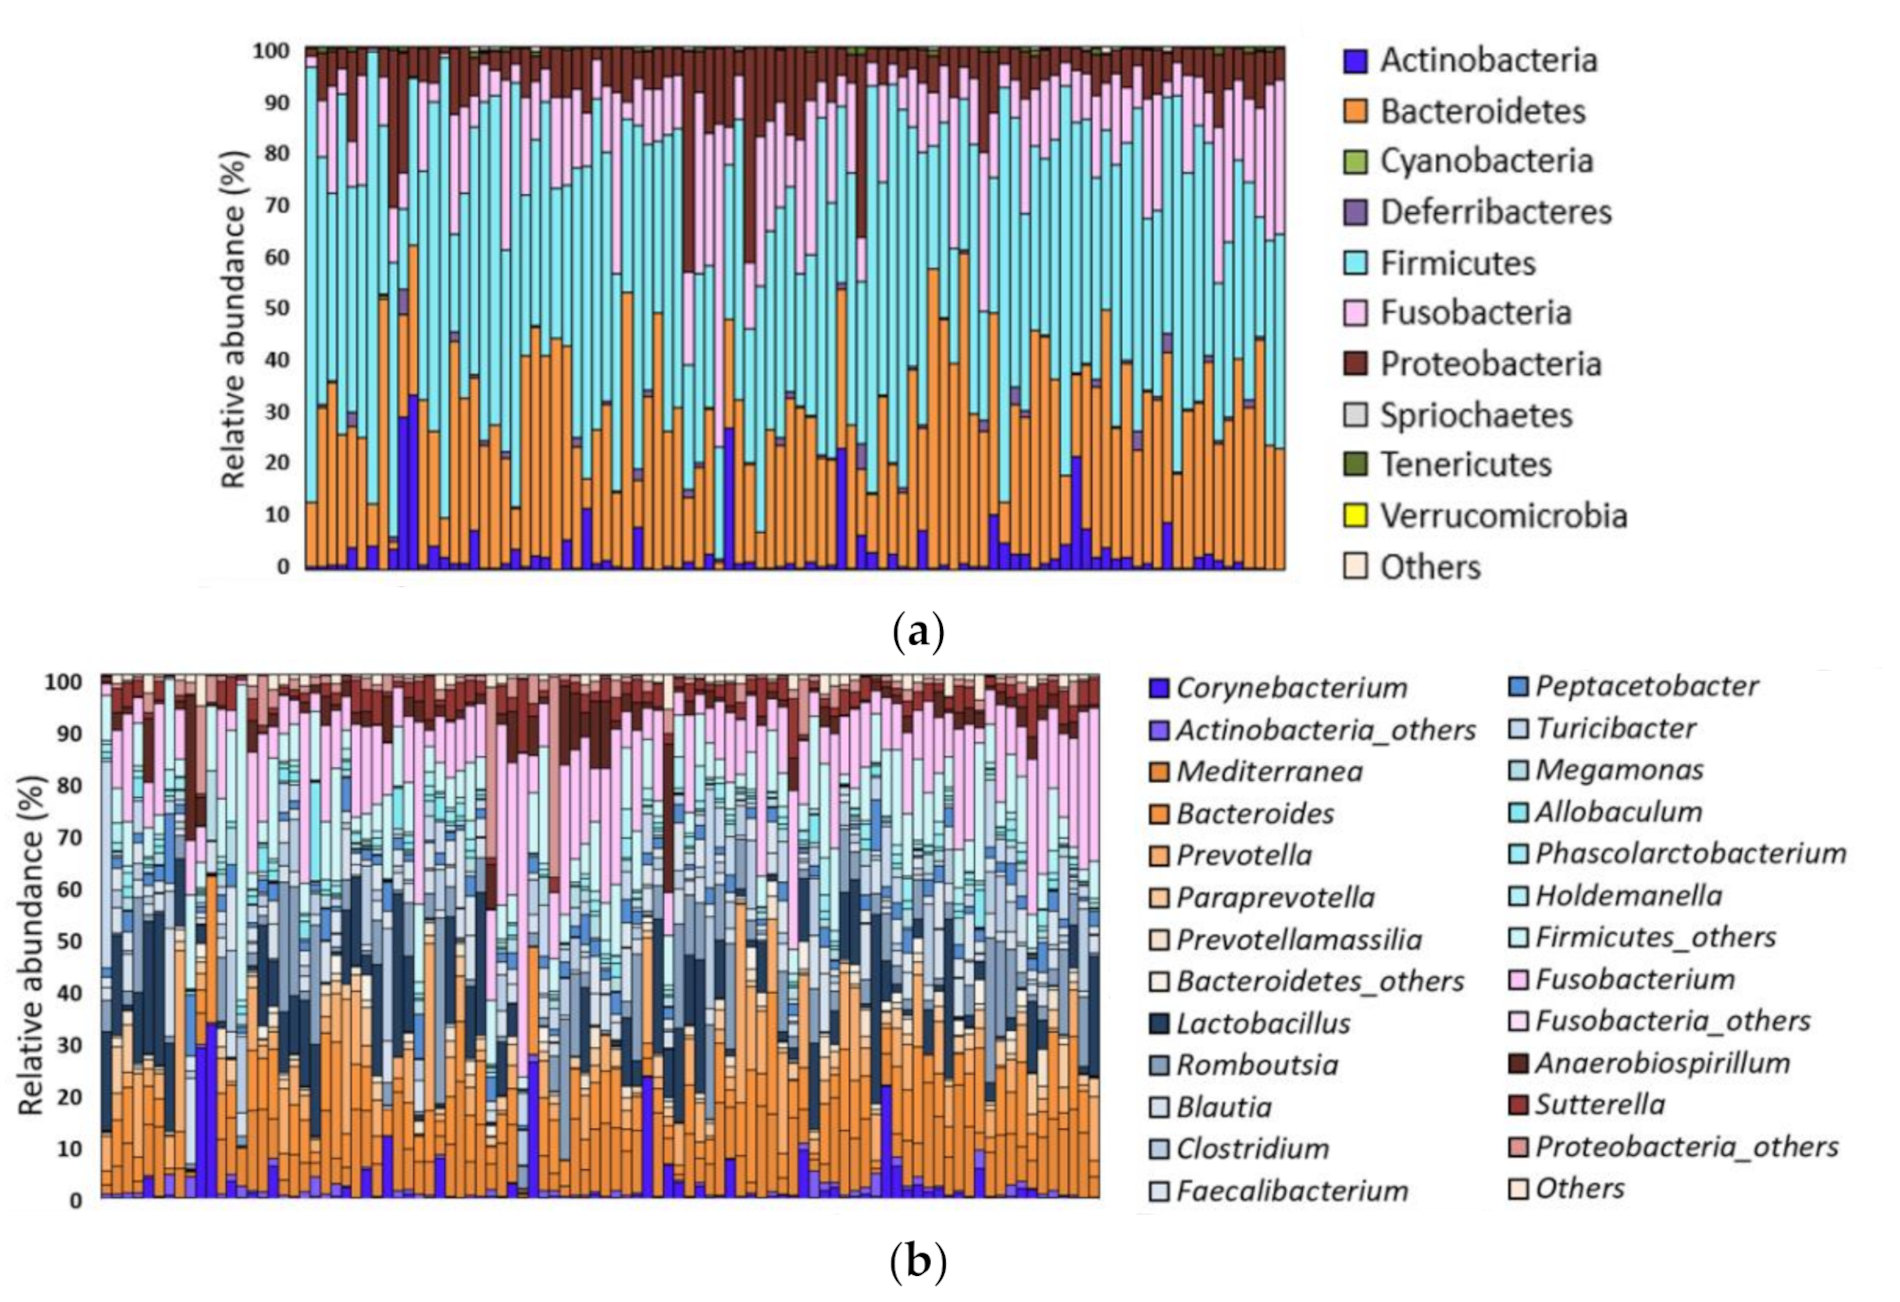
3.1. Overall GM of Healthy Dogs
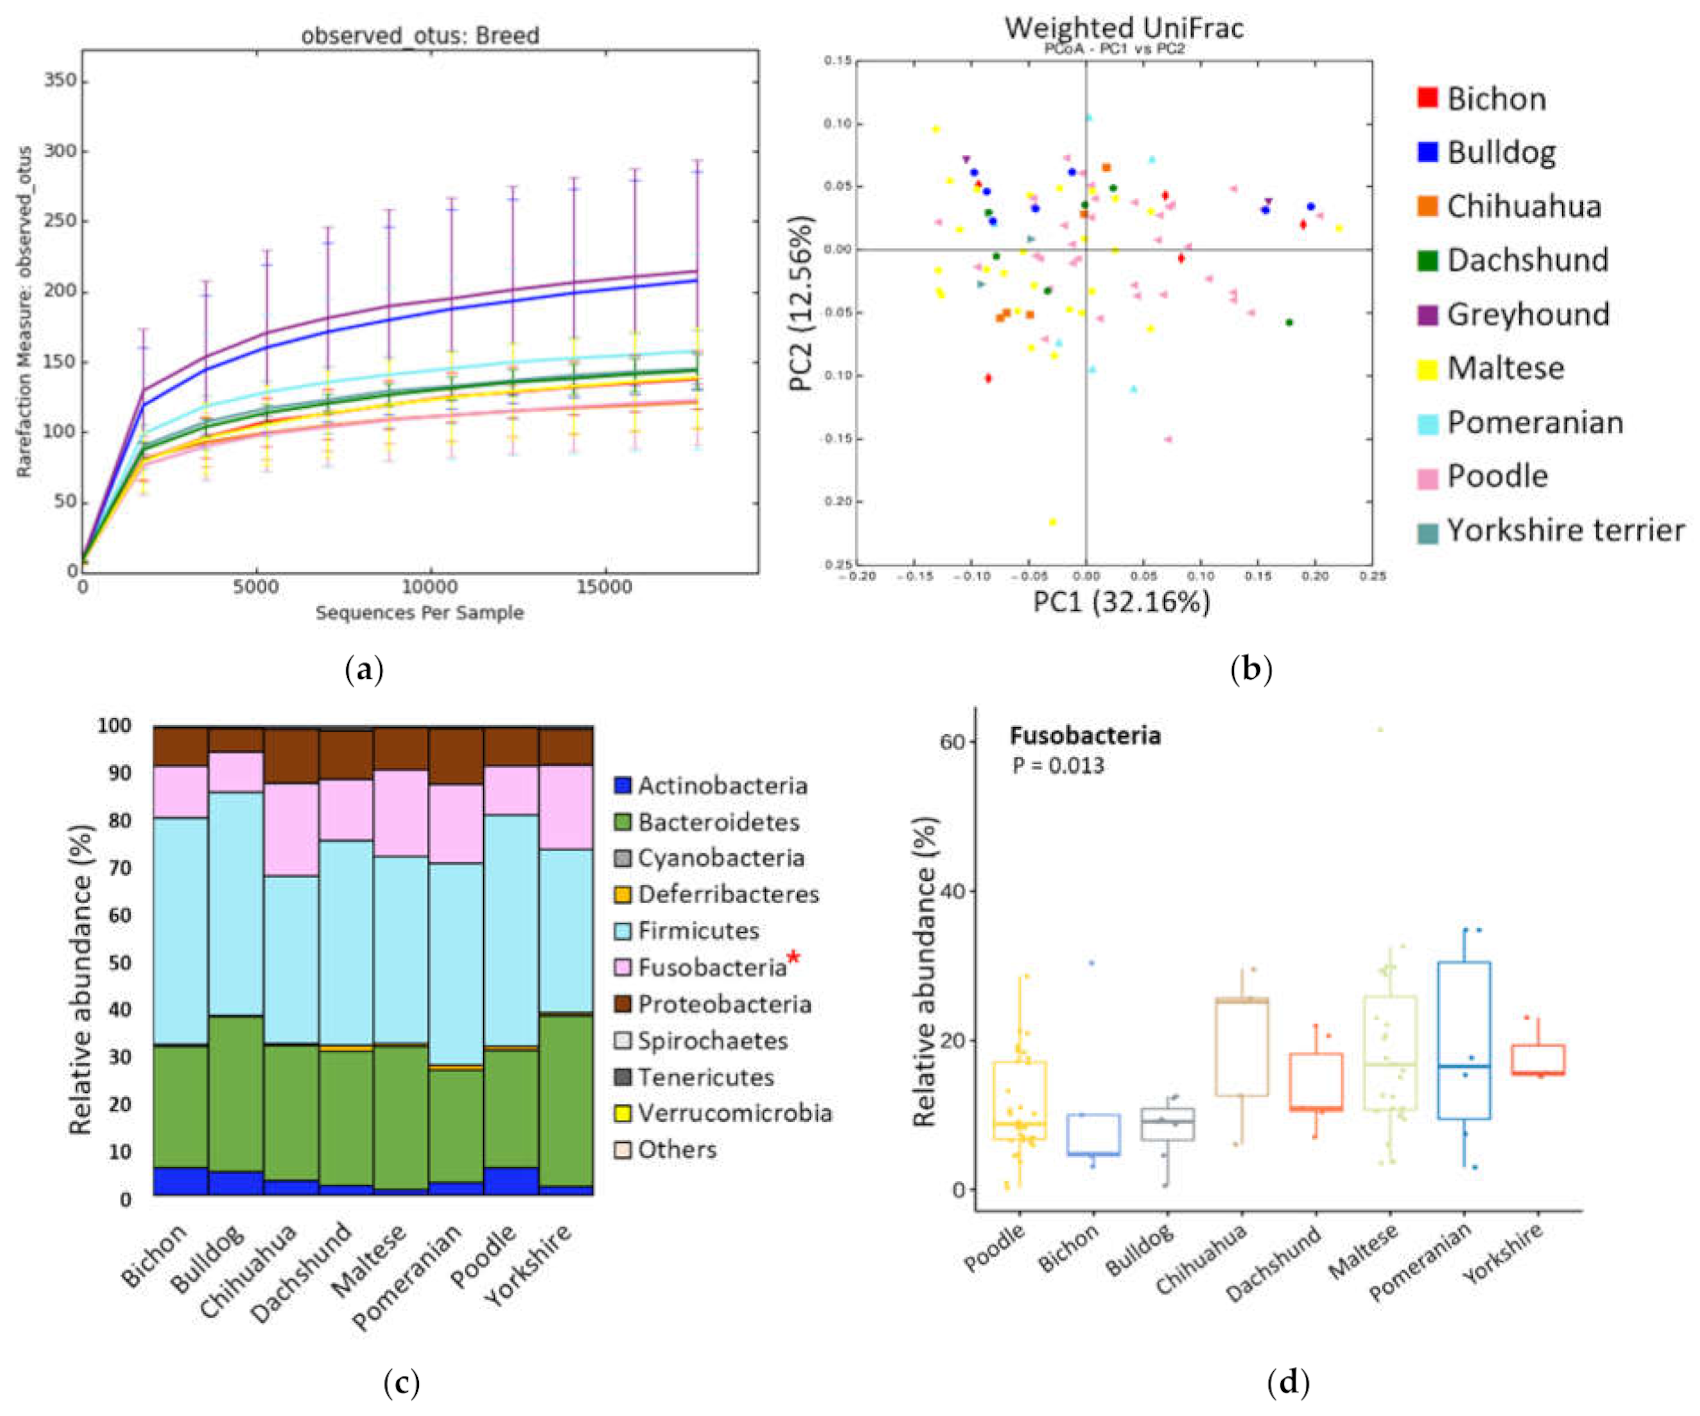
3.2. Breed
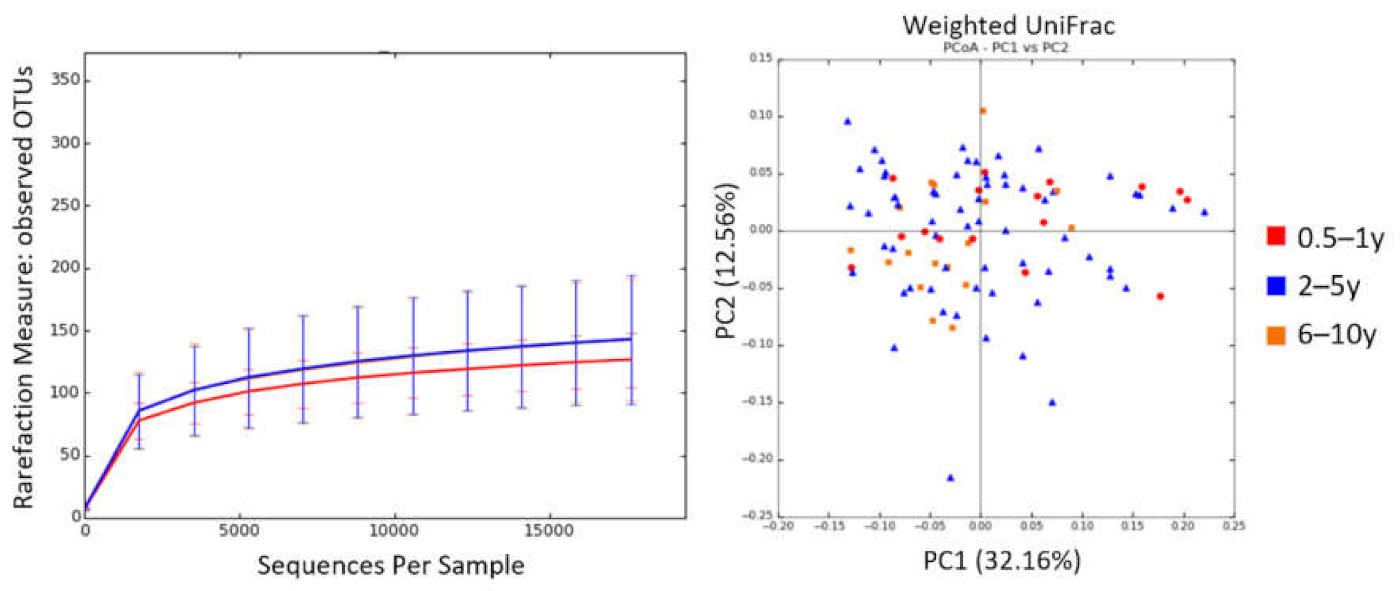
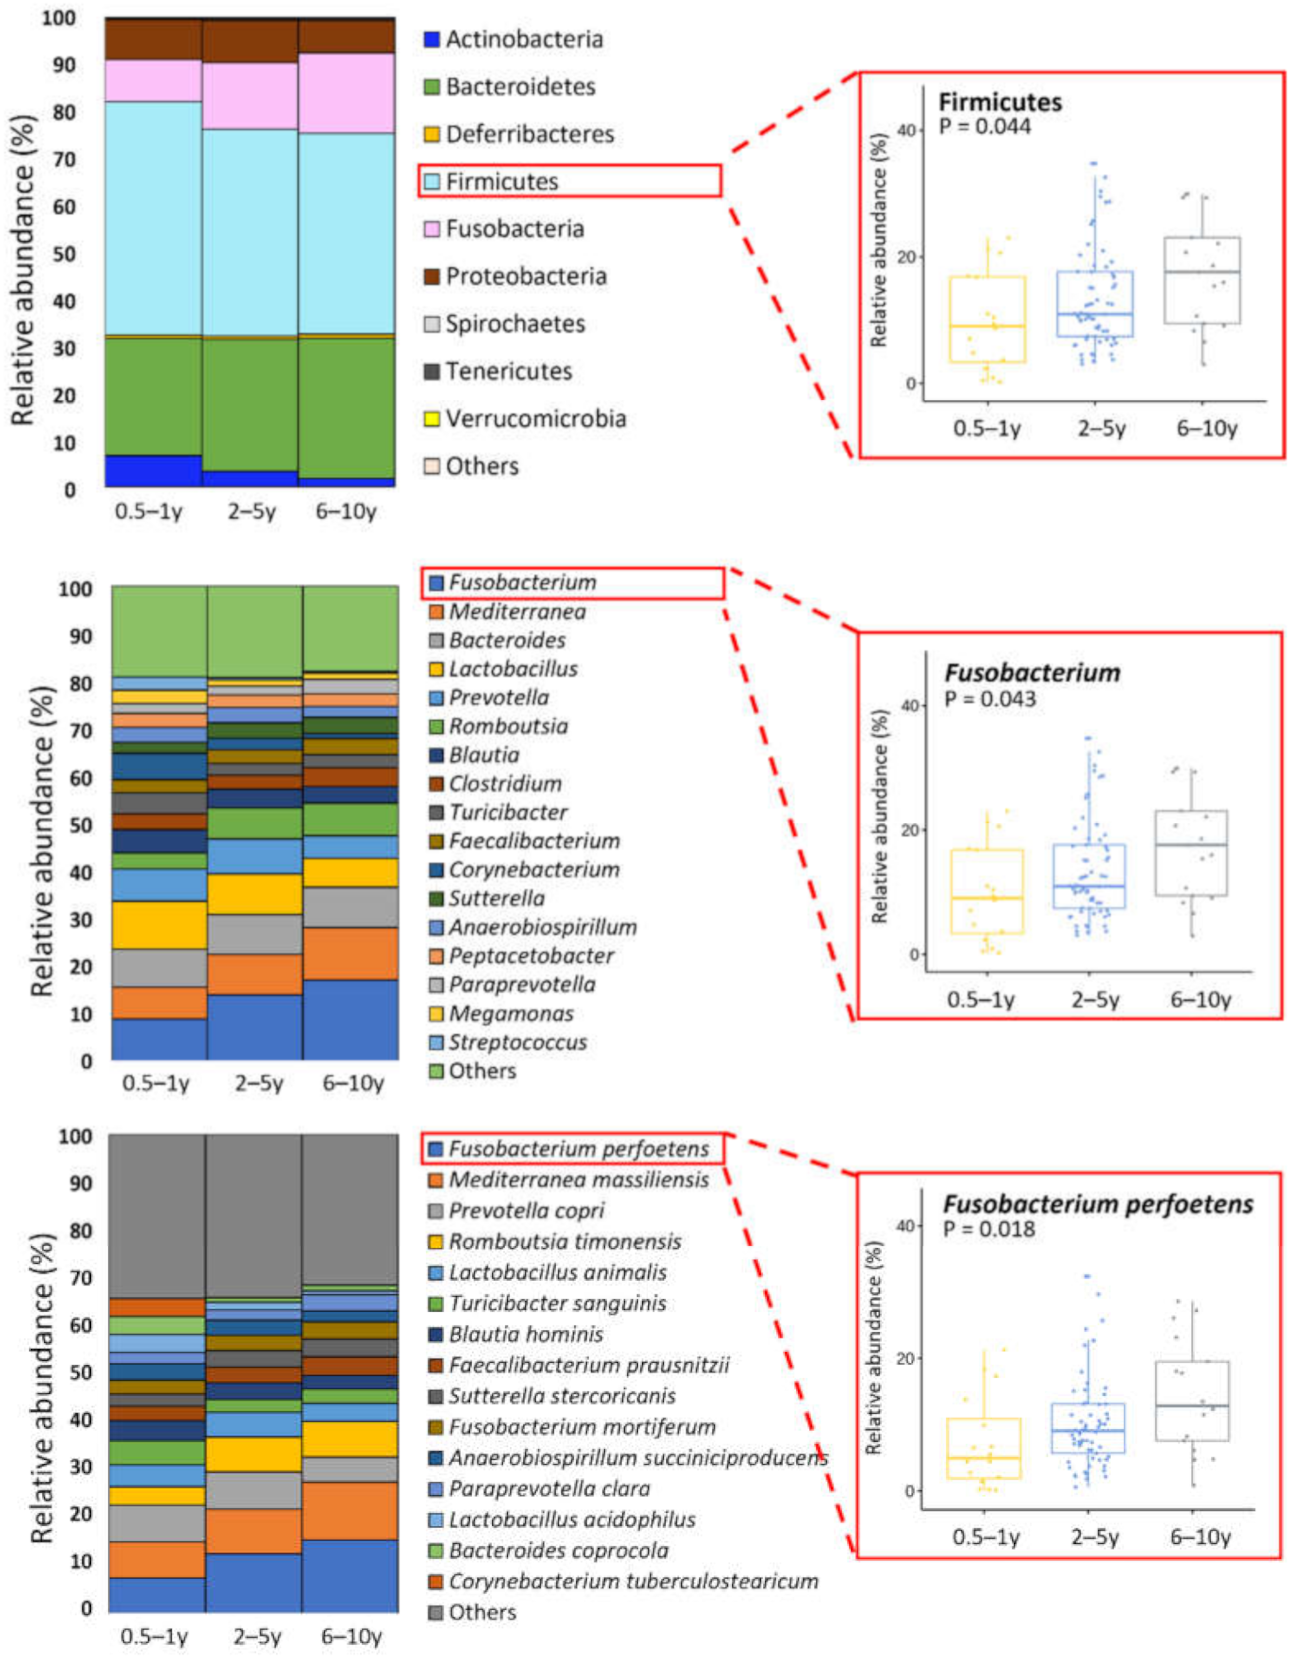
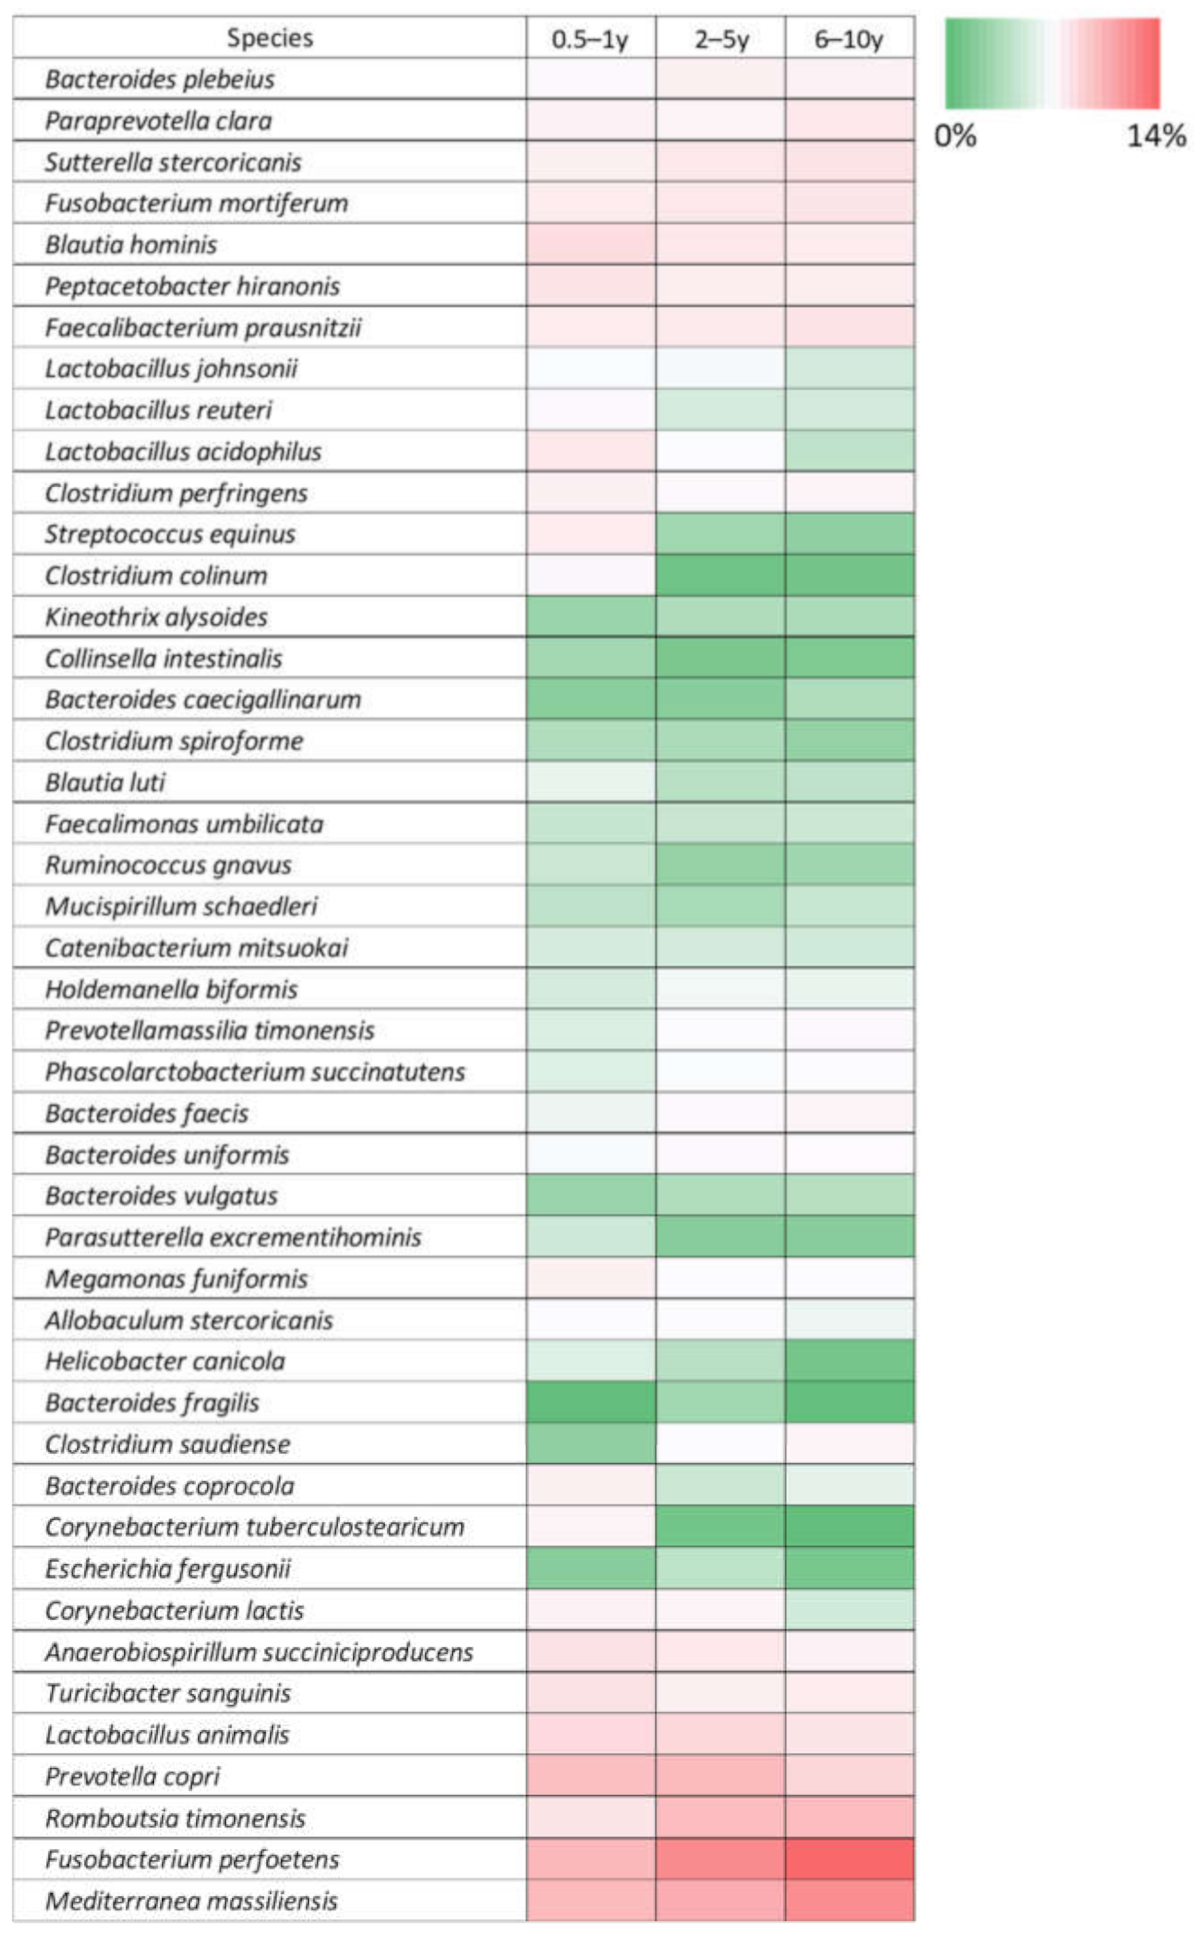
3.3. Age
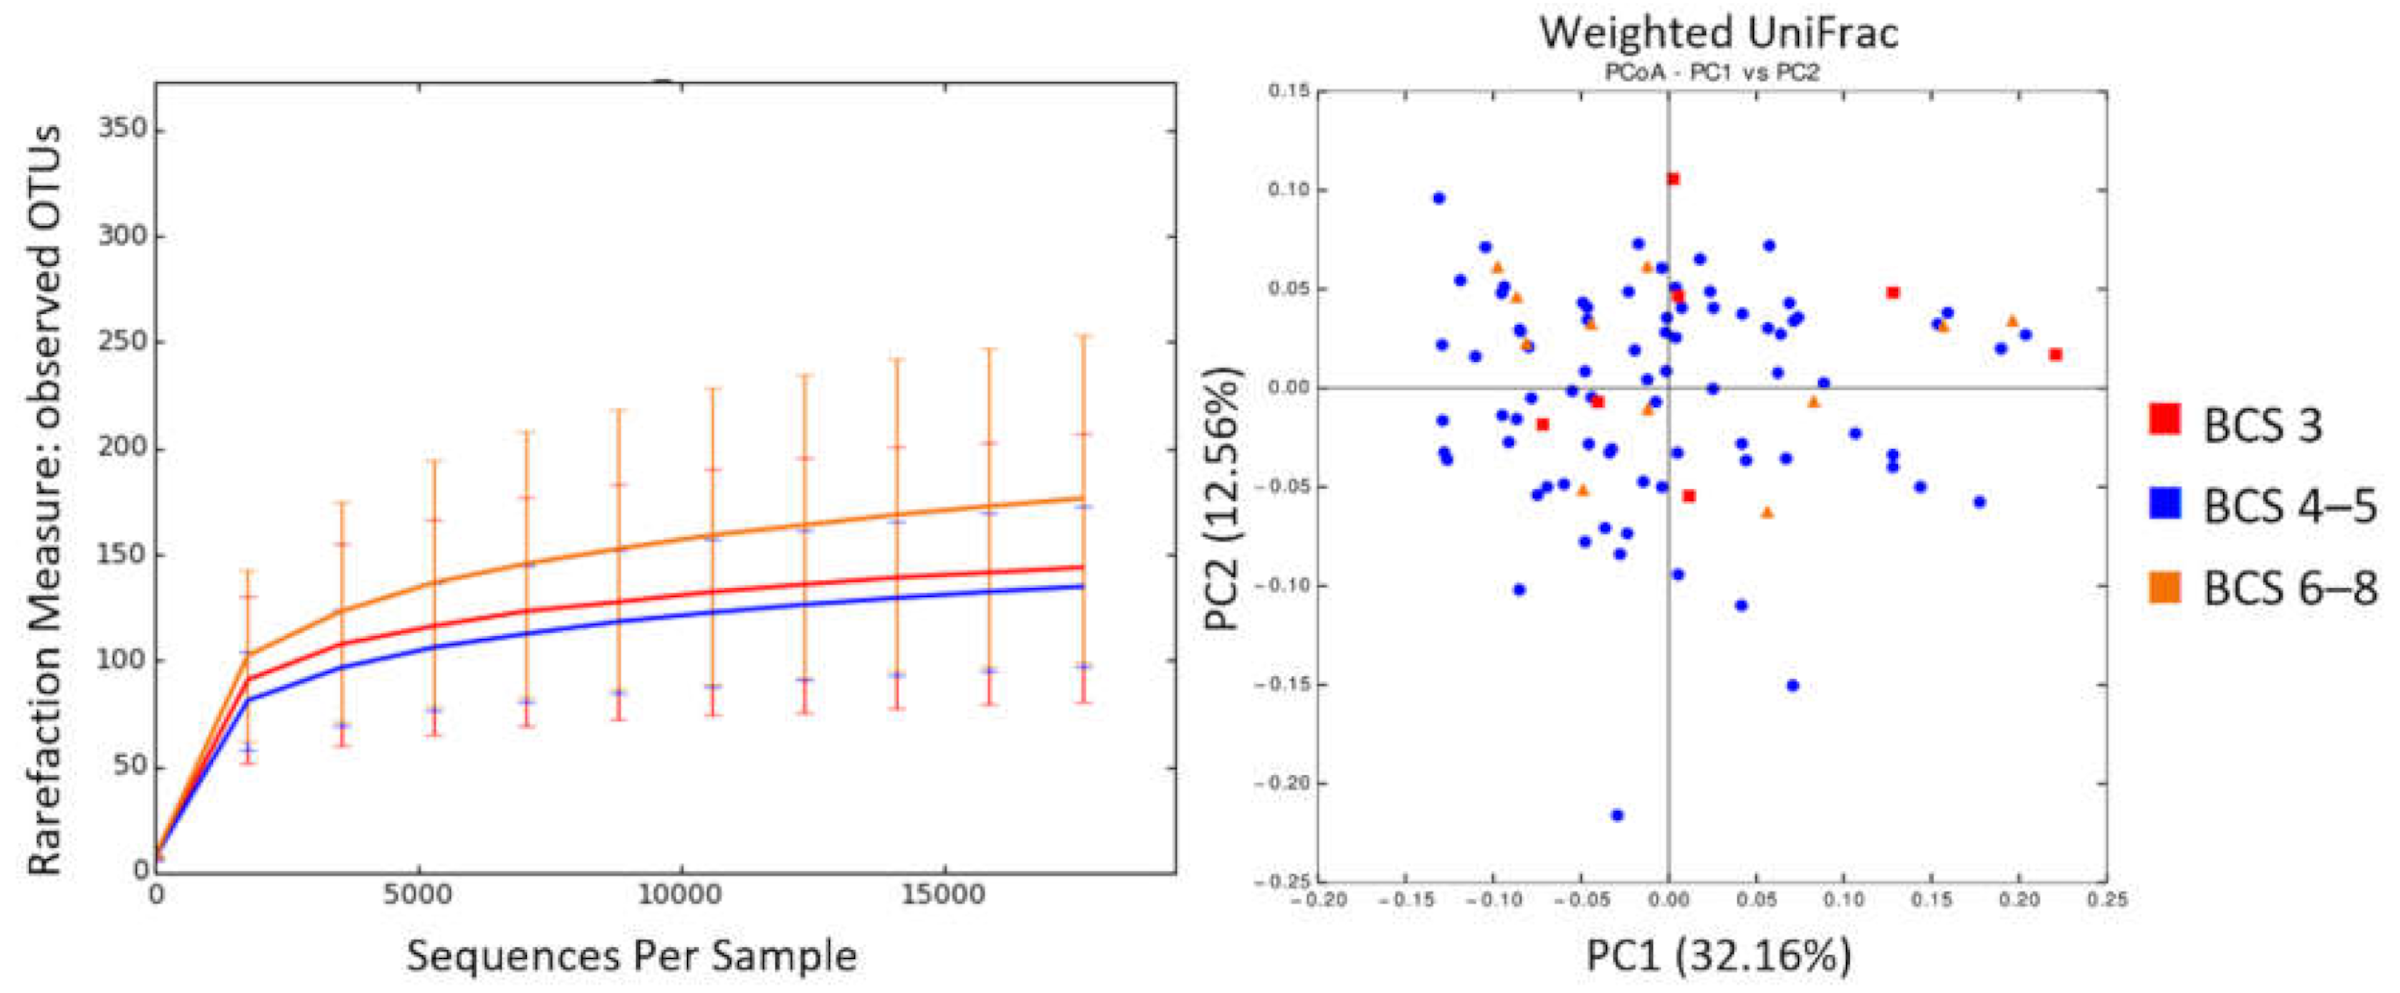
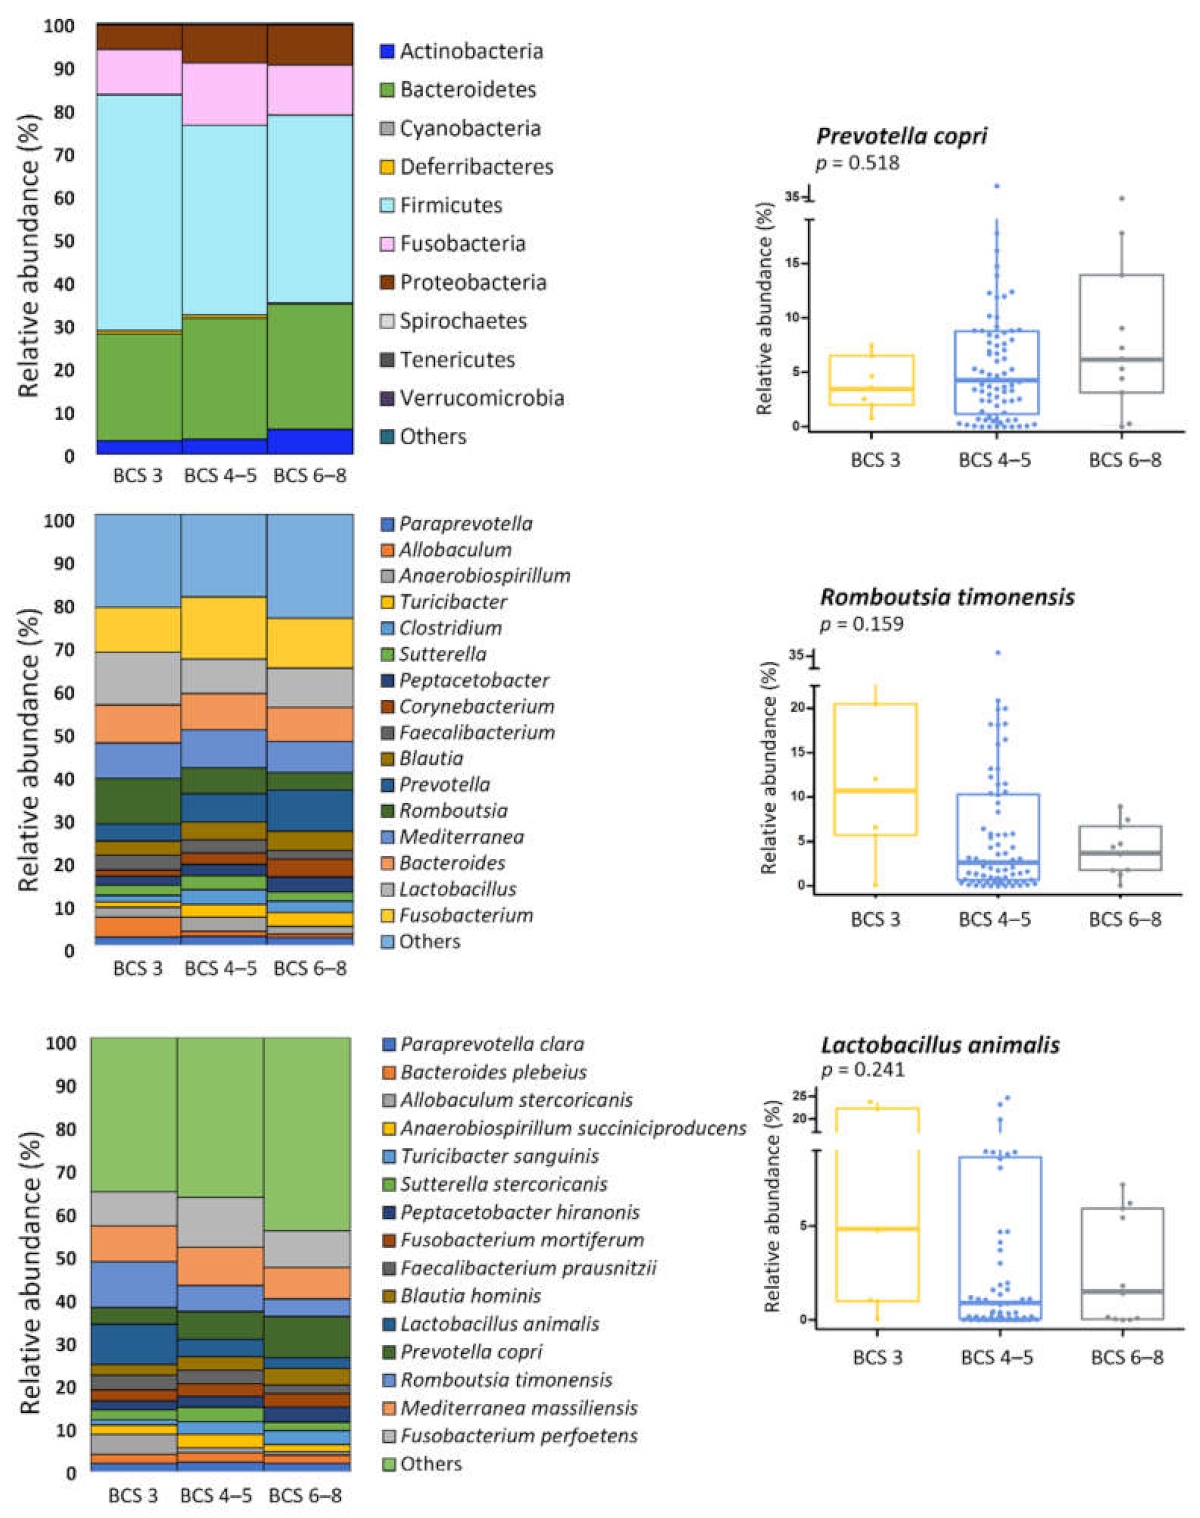
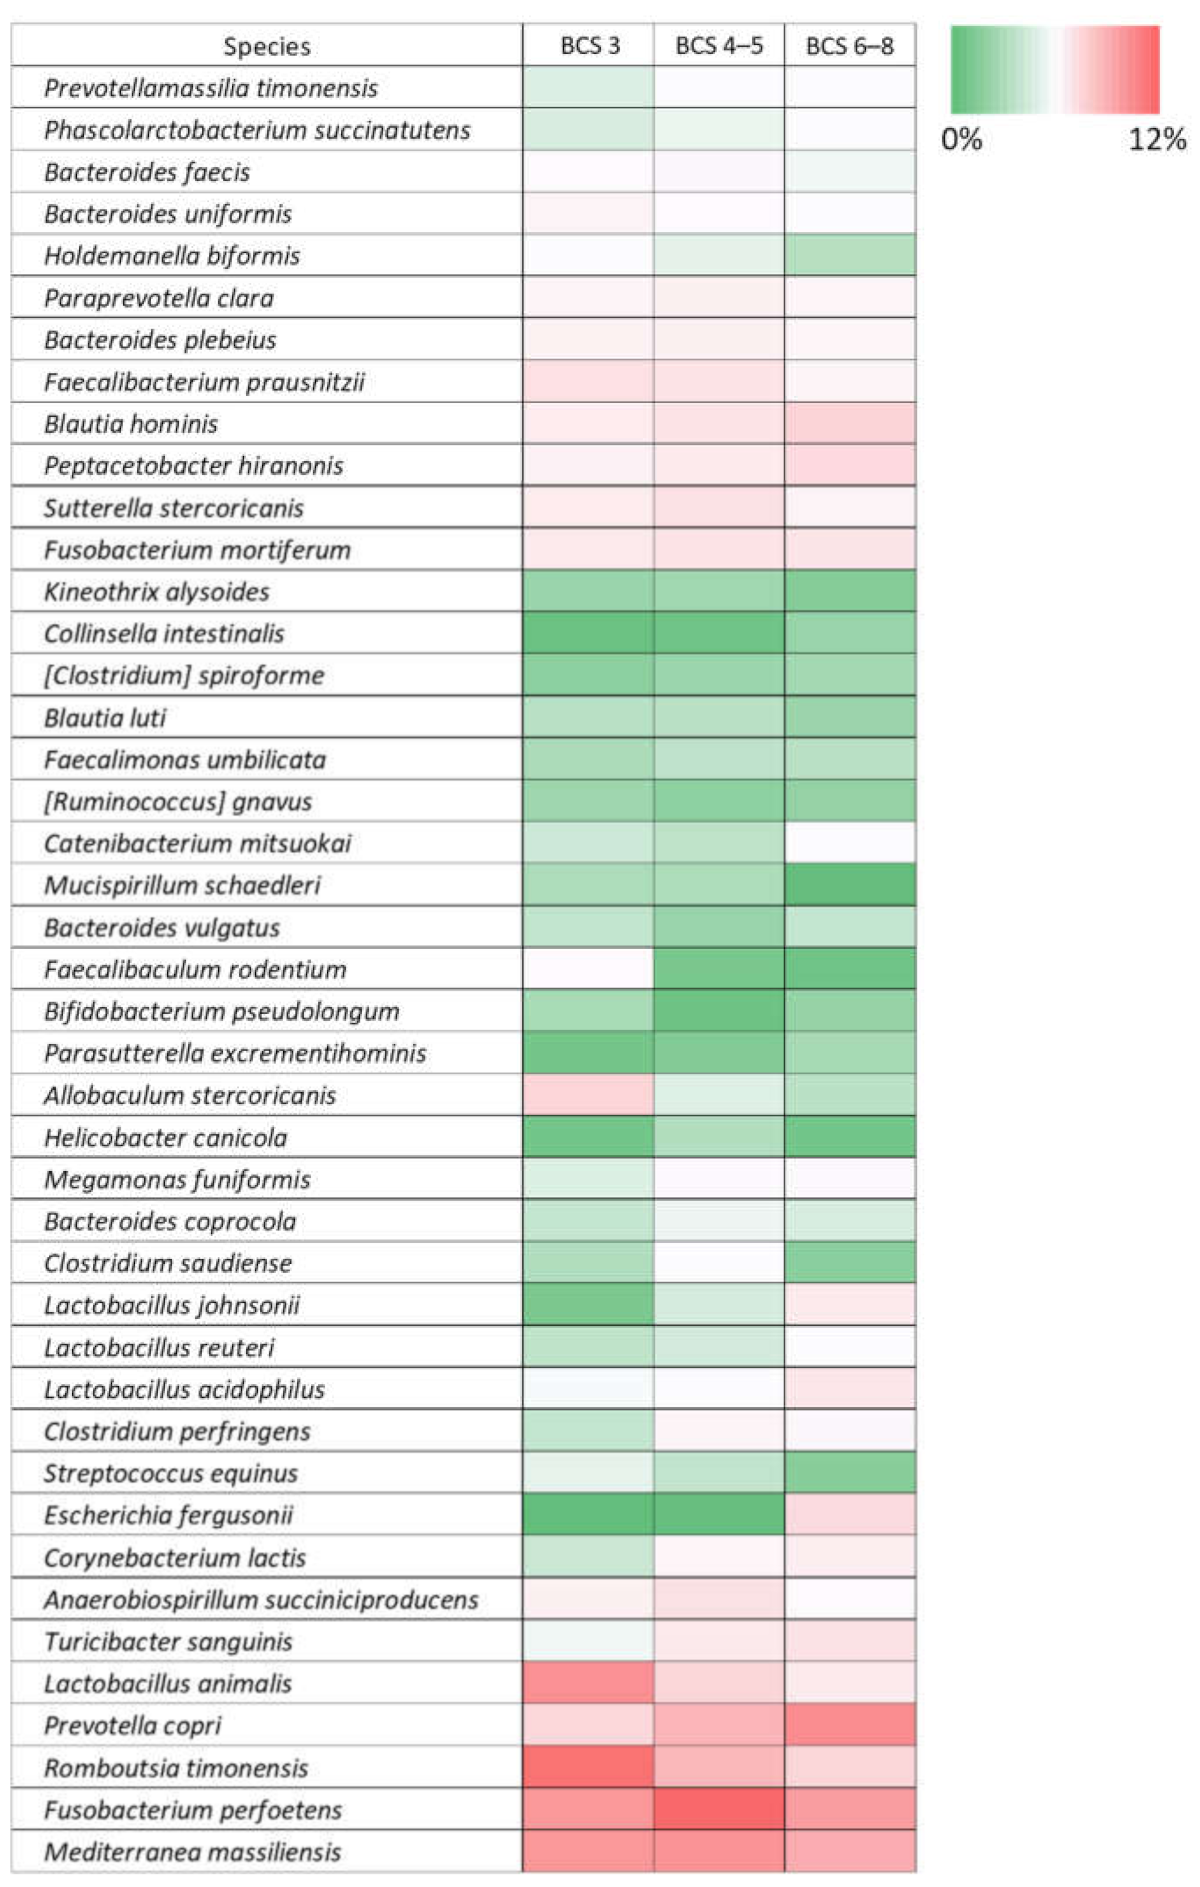
3.4. BCS
4. Discussion
5. Conclusions
Supplementary Materials
Author Contributions
Funding
Institutional Review Board Statement
Data Availability Statement
Conflicts of Interest
References
- Garcia-Gutierrez, E.; Mayer, M.J.; Cotter, P.D.; Narbad, A. Gut microbiota as a source of novel antimicrobials. Gut Microbes. 2019, 10, 1–21. [Google Scholar] [CrossRef] [Green Version]
- Li, J.; Aroutcheva, A.A.; Faro, S.; Chikindas, M.L. Mode of action of lactocin 160, a bacteriocin from vaginal Lactobacillus rhamnosus. Infect. Dis. Obstet. Gynecol. 2005, 13, 135. [Google Scholar] [CrossRef] [PubMed] [Green Version]
- Pokusaeva, K.; Johnson, C.; Luk, B.; Uribe, G.; Fu, Y.; Oezguen, N.; Matsunami, R.; Lugo, M.; Major, A.; Mori-Akiyama, Y. GABA-producing Bifidobacterium dentium modulates visceral sensitivity in the intestine. Neurogastroenterol. Motil. 2017, 29, e12904. [Google Scholar] [CrossRef] [PubMed]
- Smith, E.A.; Macfarlane, G.T. Formation of phenolic and indolic compounds by anaerobic bacteria in the human large intestine. Microb. Ecol. 1997, 33, 180–188. [Google Scholar] [CrossRef] [PubMed]
- Keszthelyi, D.; Troost, F.; Masclee, A. Understanding the role of tryptophan and serotonin metabolism in gastrointestinal function. Neurogastroenterol. Motil. 2009, 21, 1239–1249. [Google Scholar] [CrossRef]
- Guard, B.C.; Mila, H.; Steiner, J.M.; Mariani, C.; Suchodolski, J.S.; Chastant-Maillard, S. Characterization of the fecal microbiome during neonatal and early pediatric development in puppies. PLoS ONE 2017, 12, e0175718. [Google Scholar] [CrossRef] [Green Version]
- Montoya-Alonso, J.A.; Bautista-Castaño, I.; Peña, C.; Suárez, L.; Juste, M.C.; Tvarijonaviciute, A. Prevalence of canine obesity, obesity-related metabolic dysfunction, and relationship with owner obesity in an obesogenic region of Spain. Front. Vet. Sci. 2017, 4, 59. [Google Scholar] [CrossRef]
- Minamoto, Y.; Dhanani, N.; Markel, M.E.; Steiner, J.M.; Suchodolski, J.S. Prevalence of Clostridium perfringens, Clostridium perfringens enterotoxin and dysbiosis in fecal samples of dogs with diarrhea. Vet. Microbiol. 2014, 174, 463–473. [Google Scholar] [CrossRef]
- AlShawaqfeh, M.; Wajid, B.; Minamoto, Y.; Markel, M.; Lidbury, J.; Steiner, J.; Serpedin, E.; Suchodolski, J. A dysbiosis index to assess microbial changes in fecal samples of dogs with chronic inflammatory enteropathy. FEMS Microbiol. Ecol. 2017, 93, fix136. [Google Scholar] [CrossRef] [Green Version]
- Cintio, M.; Scarsella, E.; Sgorlon, S.; Sandri, M.; Stefanon, B. Gut Microbiome of Healthy and Arthritic Dogs. Vet. Sci. 2020, 7, 92. [Google Scholar] [CrossRef]
- Costea, P.I.; Coelho, L.P.; Sunagawa, S.; Munch, R.; Huerta-Cepas, J.; Forslund, K.; Hildebrand, F.; Kushugulova, A.; Zeller, G.; Bork, P. Subspecies in the global human gut microbiome. Mol. Syst. Biol. 2017, 13, 960. [Google Scholar] [CrossRef]
- Hasan, N.; Yang, H. Factors affecting the composition of the gut microbiota, and its modulation. PeerJ 2019, 7, e7502. [Google Scholar] [CrossRef] [PubMed] [Green Version]
- Ostrander, E.A.; Wayne, R.K. The canine genome. Genome Res. 2005, 15, 1706–1716. [Google Scholar] [CrossRef] [PubMed] [Green Version]
- Gnanadesikan, G.E.; Hare, B.; Snyder-Mackler, N.; Call, J.; Kaminski, J.; Miklósi, Á.; MacLean, E.L. Breed Differences in Dog Cognition Associated with Brain-Expressed Genes and Neurological Functions. Integr. Comp. Biol. 2020, 60, 976–990. [Google Scholar] [CrossRef]
- Leroy, G.; Verrier, E.; Meriaux, J.-C.; Rognon, X. Genetic diversity of dog breeds: Between-breed diversity, breed assignation and conservation approaches. Anim. Genet. 2009, 40, 333–343. [Google Scholar] [CrossRef]
- Serpell, J.A.; Duffy, D.L. Dog breeds and their behavior. In Domestic Dog Cognition and Behavior; Springer: Berlin/Heidelberg, Germany, 2014; pp. 31–57. [Google Scholar]
- Kathrani, A.; Werling, D.; Allenspach, K. Canine breeds at high risk of developing inflammatory bowel disease in the south-eastern UK. Vet. Rec. 2011, 169, 635. [Google Scholar] [CrossRef] [Green Version]
- Bosco, N.; Noti, M. The aging gut microbiome and its impact on host immunity. Genes Immun. 2021, 1–15. [Google Scholar] [CrossRef]
- Schneeberger, M.; Everard, A.; Gómez-Valadés, A.G.; Matamoros, S.; Ramírez, S.; Delzenne, N.M.; Gomis, R.; Claret, M.; Cani, P.D. Akkermansia muciniphila inversely correlates with the onset of inflammation, altered adipose tissue metabolism and metabolic disorders during obesity in mice. Sci. Rep. 2015, 5, 1–14. [Google Scholar] [CrossRef] [Green Version]
- Bodogai, M.; O’Connell, J.; Kim, K.; Kim, Y.; Moritoh, K.; Chen, C.; Gusev, F.; Vaughan, K.; Shulzhenko, N.; Mattison, J.A. Commensal bacteria contribute to insulin resistance in aging by activating innate B1a cells. Sci. Transl. Med. 2018, 10. [Google Scholar] [CrossRef]
- Sampson, T.R.; Debelius, J.W.; Thron, T.; Janssen, S.; Shastri, G.G.; Ilhan, Z.E.; Challis, C.; Schretter, C.E.; Rocha, S.; Gradinaru, V. Gut microbiota regulate motor deficits and neureoinflammation in a model of Parkinson’s disease. Cell 2016, 167, 1469–1480.e1412. [Google Scholar] [CrossRef] [Green Version]
- Davis, P.R.; Head, E. Prevention approaches in a preclinical canine model of Alzheimer’s disease: Benefits and challenges. Front. Pharmacol. 2014, 5, 47. [Google Scholar] [CrossRef] [Green Version]
- Cotman, C.W.; Head, E. The canine (dog) model of human aging and disease: Dietary, environmental and immunotherapy approaches. J. Alzheimer’s Dis. 2008, 15, 685–707. [Google Scholar] [CrossRef]
- Ley, R.E.; Bäckhed, F.; Turnbaugh, P.; Lozupone, C.A.; Knight, R.D.; Gordon, J.I. Obesity alters gut microbial ecology. Proc. Natl. Acad. Sci. USA 2005, 102, 11070–11075. [Google Scholar] [CrossRef] [PubMed] [Green Version]
- Choi, J.; Joseph, L.; Pilote, L. Obesity and C-reactive protein in various populations: A systematic review and meta-analysis. Obes. Rev. 2013, 14, 232–244. [Google Scholar] [CrossRef] [PubMed]
- Chun, J.L.; Ji, S.Y.; Lee, S.D.; Lee, Y.K.; Kim, B.; Kim, K.H. Difference of gut microbiota composition based on the body condition scores in dogs. JAST 2020, 62, 239. [Google Scholar] [CrossRef] [Green Version]
- German, A.J.; Holden, S.L.; Moxham, G.L.; Holmes, K.L.; Hackett, R.M.; Rawlings, J.M. A simple, reliable tool for owners to assess the body condition of their dog or cat. Nutrients 2006, 136, 2031S–2033S. [Google Scholar] [CrossRef] [PubMed] [Green Version]
- Laflamme, D. Development and validation of a body condition score system for dogs. Canine Pract. 1997, 22, 10–15. [Google Scholar]
- Chen, S.; Zhou, Y.; Chen, Y.; Gu, J. fastp: An ultra-fast all-in-one FASTQ preprocessor. Bioinformatics 2018, 34, i884–i890. [Google Scholar] [CrossRef]
- Magoč, T.; Salzberg, S.L. FLASH: Fast length adjustment of short reads to improve genome assemblies. Bioinformatics 2011, 27, 2957–2963. [Google Scholar] [CrossRef]
- Li, W.; Fu, L.; Niu, B.; Wu, S.; Wooley, J. Ultrafast clustering algorithms for metagenomic sequence analysis. Brief. Bioinform. 2012, 13, 656–668. [Google Scholar] [CrossRef]
- Zhang, Z.; Schwartz, S.; Wagner, L.; Miller, W. A greedy algorithm for aligning DNA sequences. J. Comput. Biol. 2000, 7, 203–214. [Google Scholar] [CrossRef]
- Caporaso, J.G.; Kuczynski, J.; Stombaugh, J.; Bittinger, K.; Bushman, F.D.; Costello, E.K.; Fierer, N.; Pena, A.G.; Goodrich, J.K.; Gordon, J.I. QIIME allows analysis of high-throughput community sequencing data. Nat. Methods 2010, 7, 335–336. [Google Scholar] [CrossRef] [Green Version]
- Bauer, D.F. Constructing confidence sets using rank statistics. J. Am. Stat Assoc. 1972, 67, 687–690. [Google Scholar] [CrossRef]
- Hollander, M.; Wolfe, D.A.; Chicken, E. Nonparametric Statistical Methods; John Wiley & Sons: Hoboken, NJ, USA, 2013; Volume 751. [Google Scholar]
- Segata, N.; Izard, J.; Waldron, L.; Gevers, D.; Miropolsky, L.; Garrett, W.S.; Huttenhower, C. Metagenomic biomarker discovery and explanation. Genome Biol. 2011, 12, 1–18. [Google Scholar] [CrossRef] [PubMed] [Green Version]
- Redondo-Useros, N.; Nova, E.; González-Zancada, N.; Díaz, L.E.; Gómez-Martínez, S.; Marcos, A. Microbiota and lifestyle: A special focus on diet. Nutrients 2020, 12, 1776. [Google Scholar] [CrossRef] [PubMed]
- Karl, J.P.; Hatch, A.M.; Arcidiacono, S.M.; Pearce, S.C.; Pantoja-Feliciano, I.G.; Doherty, L.A.; Soares, J.W. Effects of psychological, environmental and physical stressors on the gut microbiota. Front. Microbiol. 2018, 9, 2013. [Google Scholar] [CrossRef] [Green Version]
- Deng, P.; Swanson, K.S. Gut microbiota of humans, dogs and cats: Current knowledge and future opportunities and challenges. Br. J. Nutr. 2015, 113, S6–S17. [Google Scholar] [CrossRef] [PubMed]
- Hooda, S.; Minamoto, Y.; Suchodolski, J.S.; Swanson, K.S. Current state of knowledge: The canine gastrointestinal microbiome. Anim. Health Res. Rev. 2012, 13, 78–88. [Google Scholar] [CrossRef]
- Omatsu, T.; Omura, M.; Katayama, Y.; Kimura, T.; Okumura, M.; Okumura, A.; Murata, Y.; Mizutani, T. Molecular diversity of the faecal microbiota of Toy Poodles in Japan. J. Vet. Sci. 2018, 80, 749–754. [Google Scholar] [CrossRef] [Green Version]
- Reddy, K.E.; Kim, H.-R.; Jeong, J.Y.; So, K.-M.; Lee, S.; Ji, S.Y.; Kim, M.; Lee, H.-J.; Lee, S.; Kim, K.-H. Impact of breed on the fecal microbiome of dogs under the same dietary condition. J. Microbiol. Biotechnol. 2019, 29, 1947–1956. [Google Scholar] [CrossRef]
- Wang, T.; Ma, J.; Hogan, A.N.; Fong, S.; Licon, K.; Tsui, B.; Kreisberg, J.F.; Adams, P.D.; Carvunis, A.-R.; Bannasch, D.L. Quantitative translation of dog-to-human aging by conserved remodeling of epigenetic networks. bioRxiv 2019, 829192. [Google Scholar] [CrossRef] [Green Version]
- Rodríguez, J.M.; Murphy, K.; Stanton, C.; Ross, R.P.; Kober, O.I.; Juge, N.; Avershina, E.; Rudi, K.; Narbad, A.; Jenmalm, M.C. The composition of the gut microbiota throughout life, with an emphasis on early life. Microb. Ecol. Health Dis. 2015, 26, 26050. [Google Scholar] [CrossRef] [PubMed]
- Wang, S.; Harvey, L.; Martin, R.; van der Beek, E.M.; Knol, J.; Cryan, J.F.; Renes, I.B. Targeting the gut microbiota to influence brain development and function in early life. Neurosci. Biobehav. Rev. 2018, 95, 191–201. [Google Scholar] [CrossRef]
- Xu, H.; Huang, W.; Hou, Q.; Kwok, L.-Y.; Laga, W.; Wang, Y.; Ma, H.; Sun, Z.; Zhang, H. Oral Administration of Compound Probiotics Improved Canine Feed Intake, Weight Gain, Immunity and Intestinal Microbiota. Front. Immunol. 2019, 10, 666. [Google Scholar] [CrossRef] [PubMed]
- Flanagan, L.; Schmid, J.; Ebert, M.; Soucek, P.; Kunicka, T.; Liska, V.; Bruha, J.; Neary, P.; Dezeeuw, N.; Tommasino, M.; et al. Fusobacterium nucleatum associates with stages of colorectal neoplasia development, colorectal cancer and disease outcome. Eur. J. Clin. Microbiol. Infect. Dis. 2014, 33, 1381–1390. [Google Scholar] [CrossRef]
- York, A. Fusobacterium persistence in colorectal cancer. Nat. Rev. Microbiol. 2018, 16, 2. [Google Scholar] [CrossRef]
- Liu, Y.; Baba, Y.; Ishimoto, T.; Iwatsuki, M.; Hiyoshi, Y.; Miyamoto, Y.; Yoshida, N.; Wu, R.; Baba, H. Progress in characterizing the linkage between Fusobacterium nucleatum and gastrointestinal cancer. J. Gastroenterol. 2019, 54, 33–41. [Google Scholar] [CrossRef]
- Turnbaugh, P.J.; Hamady, M.; Yatsunenko, T.; Cantarel, B.L.; Duncan, A.; Ley, R.E.; Sogin, M.L.; Jones, W.J.; Roe, B.A.; Affourtit, J.P. A core gut microbiome in obese and lean twins. Nature 2009, 457, 480–484. [Google Scholar] [CrossRef] [Green Version]
- Crovesy, L.; Masterson, D.; Rosado, E.L. Profile of the gut microbiota of adults with obesity: A systematic review. Eur. J. Clin. Nutr. 2020, 74, 1251–1262. [Google Scholar] [CrossRef]
- Indiani, C.M.d.S.P.; Rizzardi, K.F.; Castelo, P.M.; Ferraz, L.F.C.; Darrieux, M.; Parisotto, T.M. Childhood obesity and Firmicutes/Bacteroidetes ratio in the gut microbiota: A systematic review. Child. Obes. 2018, 14, 501–509. [Google Scholar] [CrossRef]
- Chakraborti, C.K. New-found link between microbiota and obesity. WJGP 2015, 6, 110. [Google Scholar] [CrossRef] [PubMed]
- Murugesan, S.; Nirmalkar, K.; Hoyo-Vadillo, C.; García-Espitia, M.; Ramírez-Sánchez, D.; García-Mena, J. Gut microbiome production of short-chain fatty acids and obesity in children. Eur. J. Clin. Microbiol. Infect. Dis. 2018, 37, 621–625. [Google Scholar] [CrossRef]
- Schwiertz, A.; Taras, D.; Schäfer, K.; Beijer, S.; Bos, N.A.; Donus, C.; Hardt, P.D. Microbiota and SCFA in lean and overweight healthy subjects. Obesity 2010, 18, 190–195. [Google Scholar] [CrossRef]
- Flint, H.J. Obesity and the gut microbiota. J. Clin. Gastroenterol. 2011, 45, S128–S132. [Google Scholar] [CrossRef]
- Li, Y.; Luan, Y.; Yue, X.; Xiang, F.; Mao, D.; Cao, Y.; Xiong, Z. Effects of Codonopis bulleynana forest ex diels on Deferribacteres in constipation predominant intestine tumor: Differential analysis. Saudi. J. Biol. Sci. 2019, 26, 395–401. [Google Scholar] [CrossRef]
- Greenhill, C. Gut microbiome and serum metabolome changes. Nat. Rev. Endocrinol. 2017, 13, 501. [Google Scholar] [CrossRef]
- Birchenough, G.; Hansson, G.C. Bacteria tell us how to protect our intestine. Cell Host Microbe. 2017, 22, 3–4. [Google Scholar] [CrossRef] [Green Version]
- Wlodarska, M.; Luo, C.; Kolde, R.; d’Hennezel, E.; Annand, J.W.; Heim, C.E.; Krastel, P.; Schmitt, E.K.; Omar, A.S.; Creasey, E.A. Indoleacrylic acid produced by commensal peptostreptococcus species suppresses inflammation. Cell Host Microbe. 2017, 22, 25–37.e26. [Google Scholar] [CrossRef] [Green Version]
- Tett, A.; Huang, K.D.; Asnicar, F.; Fehlner-Peach, H.; Pasolli, E.; Karcher, N.; Armanini, F.; Manghi, P.; Bonham, K.; Zolfo, M. The Prevotella copri complex comprises four distinct clades underrepresented in westernized populations. Cell Host Microbe. 2019, 26, 666–679.e667. [Google Scholar] [CrossRef] [PubMed] [Green Version]
- Ley, R.E. Prevotella in the gut: Choose carefully. Nat. Rev. Gastroenterol. Hepatol. 2016, 13, 69–70. [Google Scholar] [CrossRef]
- De Filippis, F.; Pasolli, E.; Tett, A.; Tarallo, S.; Naccarati, A.; De Angelis, M.; Neviani, E.; Cocolin, L.; Gobbetti, M.; Segata, N. Distinct genetic and functional traits of human intestinal Prevotella copri strains are associated with different habitual diets. Cell Host Microbe. 2019, 25, 444–453.e443. [Google Scholar] [CrossRef] [PubMed] [Green Version]
- Biagi, G.; Cipollini, I.; Pompei, A.; Zaghini, G.; Matteuzzi, D. Effect of a Lactobacillus animalis strain on composition and metabolism of the intestinal microflora in adult dogs. Vet. Microbiol. 2007, 124, 160–165. [Google Scholar] [CrossRef] [PubMed]
Publisher’s Note: MDPI stays neutral with regard to jurisdictional claims in published maps and institutional affiliations. |
© 2021 by the authors. Licensee MDPI, Basel, Switzerland. This article is an open access article distributed under the terms and conditions of the Creative Commons Attribution (CC BY) license (https://creativecommons.org/licenses/by/4.0/).
Share and Cite
You, I.; Kim, M.J. Comparison of Gut Microbiota of 96 Healthy Dogs by Individual Traits: Breed, Age, and Body Condition Score. Animals 2021, 11, 2432. https://doi.org/10.3390/ani11082432
You I, Kim MJ. Comparison of Gut Microbiota of 96 Healthy Dogs by Individual Traits: Breed, Age, and Body Condition Score. Animals. 2021; 11(8):2432. https://doi.org/10.3390/ani11082432
Chicago/Turabian StyleYou, Inhwan, and Min Jung Kim. 2021. "Comparison of Gut Microbiota of 96 Healthy Dogs by Individual Traits: Breed, Age, and Body Condition Score" Animals 11, no. 8: 2432. https://doi.org/10.3390/ani11082432
APA StyleYou, I., & Kim, M. J. (2021). Comparison of Gut Microbiota of 96 Healthy Dogs by Individual Traits: Breed, Age, and Body Condition Score. Animals, 11(8), 2432. https://doi.org/10.3390/ani11082432