Simple Summary
The aim of the study was to set up experimental conditions to simulate the simultaneous outbreak of post-weaning diarrhea and enterotoxaemia in weaned piglets, through verocytotoxic O138 Escherichia coli challenge. Zootechnical, clinical, microbiological, histological and immunological parameters were evaluated along the follow-up of control and infected groups. Results showed that experimental infection significantly affected the clinical status. Infected animals showed significant higher total median scores of epiphora, vitality, hair irregularity, oedema and depression; in addition, they displayed evident inflammatory infiltrate of lymphocytes, and follicular hyperplasia, increase of IgG in the intestinal crypts and CD3-positive T cells in intestinal epithelium. The infection model, carried out on receptor-mediated susceptible piglets, allowed to identify a discriminative panel of clinical symptoms related to Escherichia coli O138 infection and could be used to assess the protective effect of antibiotic alternatives.
Abstract
Pig livestock was influenced by several global concerns that imposed a re-thinking of the farming system, which included the reduction in chemical dependency and the development of antimicrobial alternatives. Post-weaning diarrhea and enterotoxaemia caused by Escherichia coli, are serious threats that are responsible for the economic losses related to mortality, morbidity and stunted growth in weaning piglets. The aim of the study was to set up experimental conditions to simulate the simultaneous outbreak of post-weaning diarrhea and enterotoxaemia in weaned piglets, through verocytotoxic O138 Escherichia coli challenge, with a multidisciplinary approach. Eighteen piglets susceptible to F18 VTEC infection were selected by polymerase chain reaction for polymorphism on the fucosyltransferase 1 gene and randomly divided in two experimental groups, non-infected controls (C; n = 6) and infected ones (I; n = 12) and housed into individual pens at the same environmental conditions for 29 days. At day 20, I pigs were orally inoculated with Escherichia coli O138 and fed a high protein ration for 3 days. Zootechnical, clinical, microbiological, histological and immunological parameters were evaluated along the follow up (3 and 9 days). Experimental infection, confirmed by bacteria faecal shedding of the I group, significantly affected the clinical status. The I group showed significantly higher total scores, corresponding to medians of the sum of daily scores from days 1 to 3 (Σ3) and 1 to 9 (Σ9) post infection, epiphora, vitality, hair irregularity, oedema and depression. Histological examination showed evident inflammatory infiltrate of lymphocytes, and follicular hyperplasia in I pigs; in the same group, the immunohistochemical and immunological assays revealed an increase in IgG in the intestinal crypts and CD3-positive T cells in intestinal epithelium. The experimental Escherichia coli infection in controlled conditions is crucial for both the evaluation of innovative compounds and the elucidation of the mechanisms associated with the persistence of antibacterial resistant strains. In conclusion, the adopted infection model, carried out on receptor-mediated susceptible piglets, allowed us to identify a discriminative panel of clinical symptoms related to Escherichia coli O138 infection, and could be used to assess the protective effect of antibiotic alternatives.
Keywords:
Escherichia coli; O138; verotoxin; VTEC; pig; infection; post weaning diarrhoea; oedema disease; immunity; experimental infection 1. Introduction
Improving the sustainability of pig livestock is a priority of global policies, in line with the agroecology principles, that imposed a re-thinking of the farming system, including the reduction in chemical dependency and the development of antimicrobial alternatives [1,2,3,4].
The most critical phase of pig production is weaning, characterized by gastrointestinal disorders, such as post-weaning diarrhea (PWD), mainly due to Escherichia coli O138, O139, and O141 serogroups, which causes important economic losses (mortality, morbidity and stunted growth) [5,6]. Two important bacterial virulence factors are F18 adhesive fimbriae and verocytoxin (VT2e), often found in association in the β-haemolytic O138 E. coli strain [7,8]. The fimbriae are responsible for the attachment to porcine intestinal villi, while the toxin destroys endothelial cells of small vessels, resulting in blood clots, hemorrhage, ischemic necrosis, and oedema in vital organs, including the brain [9,10,11,12,13].
After the European ban of antibiotics [14], traditionally used to control PWD, an increased use of Zinc oxide (ZnO) was observed to control enteric disorders, with consequent negative impacts on the environment and enhanced spread of antibiotic-resistant strains [15,16,17]. Therefore, the development of effective alternative tools is needed to reduce disease incidence and guarantee the performance, health and welfare of pigs. A number of innovative replacements have been thoroughly discussed, such as edible vaccines, immunotherapeutics, bacteriophages, antimicrobial peptides, gut microbiota modulators, plant extracts, and integrated approaches [18,19,20,21].
PWD is a multifactorial disease in which the interaction of host-infectious agent, environment, management strategies, age and genetics and immunologic factors play critical roles in the outcome [22,23]. Therefore, a more comprehensive understanding of these aspects is needed, and is achievable through the experimental reproduction of the disease in controlled and repeatable conditions. Although knowledge has advanced substantially in recent decades, much more needs to be learned about the pathogenesis and the control of PWD outbreaks, which are increasingly spreading worldwide.
The aim of the study was to set up experimental conditions to simulate the simultaneous outbreak of PWD and enterotoxaemia in weaned piglets, through verocytotoxic O138 Escherichia coli (F18 positive) challenge and apply a multidisciplinary investigative approach. In particular, the animals were evaluated for nutritional traits, zootechnical performance, clinical signs, immunohistochemical and immunological parameters.
2. Materials and Methods
2.1. Animal Housing and Experimental Challenge
The animals susceptible to verocytotoxic O138 E. coli were selected by polymerase chain reaction for the polymorphism on α 1,2 fucosyltransferase (FUT1) gene [24,25]. Genomic DNA of each pig was extracted from duodenum tissue using the Wizard® Genomic DNA Purification Kit (Promega Italia S.r.l, Milan, Italy).
PCR reaction for the FUT1 gene was performed using 0.3 μM of each specific primer (F: CTTCCTGAACGTCTATCAAGACC; R: CTTCAGCCAGGGCTCCTTTAAG) in a volume of 20 μL containing 2 μL of 10× standard buffer, 0.75 mM MgCl2, 160 μM dNTPs, 1 U Taq polymerase (Fisher Molecular Biology, Rome, Italy), and 1 μL containing 50–100 ng template DNA according to the following steps: denaturation at 95 °C for 3 min, 30 cycles of denaturation at 95 °C for 30 s, annealing at 56 °C for 30 s, and extension at 72 °C for 30 s in a thermocycler (Applied Biosystems 2720, Waltham, MA, USA) [26]. The FUT1 amplicon underwent restriction analysis with 7 U HhaI (Thermo Fisher Scientific, Waltham, MA, USA) in a final volume of 25 µL overnight at 37 °C, and electrophoresis in 10% polyacrylamide gel for visualization of the restriction fragments by GelRed (Olerup SSP AB, Stockholm, Sweden).
Piglets (Large White × Landrace) aged 22 ± 2 weaned at 21 ± 2 days from a conventional farm free from diseases, without history of verocytotoxic E. coli infections and negative for the presence of haemolytic E. coli in faeces, were transported to the Experimental Animal Research and Application Centre of the University of Milan in Lodi (Italy), allocated in individual pens (100 × 50 cm) and maintained under controlled conditions (27–29 °C; relative humidity 60%), with plastic slatted floor, nipple drinker, environmentally safe eco and easily chewable enrichment material; water and feed were administered ad libitum. This in vivo trial complied with Italian law on animal experimentation and ethics (Italian Health Ministry authorization number 102/2015-PR) in accordance with European regulation [27].
The animals, checked daily for health status, were divided in two experimental groups: non-infected controls (C; n = 6) and infected ones (I; n = 12). The infection was performed at day 20 post arrival with verocytotoxic E. coli O138 strain previously tested positive for F18 and Vt2eB genes [28]. One hour before infection, piglets were sedated intramuscularly with azaperon (2 mL/each, StresnilTM, Janssen Cilag SpA, Milan, Italy), thereafter 30 mL of 10% bicarbonate solution (Sigma-Aldrich, Saint Louis, MO, USA) was orally administered [29]. After 10–15 min, the bacteria inoculum was given (5 mL containing 1010 O138 F18 E. coli CFU) through intragastric catheter according to Rossi et al. [19].
The piglets were fed a basal diet with zinc content 50 ppm, without antibiotics (Ferraroni S.p.A, Bonemerse, Italy), except for three days after the infection, when they received a high protein content diet (25.42 g/kg dry matter) (Table 1).

Table 1.
Composition of the experimental diet.
2.2. Zootechnical Evaluation and Sample Collection
The rectal temperature was measured daily along with the faecal consistency, which was recorded according to a four-level scale: 0 = normal (faeces firm and well formed), 1 = soft consistency (faeces soft and formed), 2 = mild diarrhoea (loose faeces, usually yellowish), 3 = severe diarrhoea (faeces watery and projectile).
Faecal samples were collected from rectum every day after the infection for microbiological assays and immunoglobulin titration.
The typical clinical signs of VTEC infection (palpebral oedema, epiphora, vitality, depression, hair, perineal area, respiratory and neurological problems) were registered daily by the same veterinary surgeon, according to a three-level points scale score described by Rossi et al. [19]. Palpebral oedema is defined as a pathological condition (related to the vasopermeabilization caused by verocitotoxins) characterized by the accumulation of fluid in the tissues of the inner part of the eyelids with different degree of severity: 0 = normal; 1 = mild bilateral oedema (puffy eyelids giving a sleepy appearance); 2 = severe (prominent and closed eyelids). Epiphora is an overflow of tears due to the inflammation and the reduced motility of eyelid or of the lacrimal pump. It was classified with the following score: 0 = normal; 1 = mild (moderate presence of eye discharge material in the corner of the eye); 2 = severe (abundant presence of brown discharge material in the corner of the eye); for the vitality and depression scores a disturbed behaviour was defined as slow reactions, an unsteady and slow gait whilst walking and an inattentive response when encouraged to move. Vitality score: 0 = good; 1 = loose (failure to react to stimulus); 2 = bad (slow response to stimuli); depression score: 0 = normal status; 1 = mild (slow reactions); 2 = high (lethargy); perineal area: 0 = clean; 1 = smear; 3 = smear with flogosis (red area caused by inflammation); respiratory score: 0 = normal; 1 = slightly quick respiratory rate; 2 = quick respiratory rate with open mouth; neurological score: 0 = normal; 1 = mild symptoms (incoordination); 2 = severe symptoms (lateral position, paddling limbs, central nervous symptoms); hair condition was evaluated on the dorsal of porcine skin. Hair score: 0 = regular (smooth, clean, flat and uniform); 1 = slightly irregular (fuzzy hair coat and/or scaly skin); 2 = irregular (bald patches, or a rough, dull uneven coat and reddened skin).
All piglets were individually weighed on day 0, 7, 13, 20, 22, 27 and 29 post infection while the feed intake (FI) was daily measured weighing the residual feed at the pen level (experimental unit for FI evaluation). Then, individual average daily gain (ADG) and gain to feed ratio (G:F) were calculated.
Blood was collected from the jugular vein of each animal on days 20, 27 and 29 to determine microhematocrit and serum antibodies. Two animals of C (C3) and four animals of I (I3) groups were sacrificed at day 3 post infection and all the others were euthanized at day 29 (C9/I9). Samples (approximately 0.5 cm3) of jejunum, mesenteric lymph nodes and intestinal scrapes were obtained immediately after euthanasia and placed in RNA Later (Qiagen, Germany) for gene expression analysis; another part of the same excised samples was frozen for immunochemistry, and another one was fixed in 10% neutral buffered formalin for immunohistochemistry/histology. Samples of the ileum (one for each euthanized animal) were collected immediately after the euthanasia and carefully sealed with two sterile cotton ligatures, 3 cm apart from the proximal to the distal one and carried to the microbiology laboratory at 4 °C for microbiological analyses.
2.3. Microbiological Analysis
Faecal samples were analysed for the animal selection and the confirmation of experimental infection procedures. Briefly, faeces (1 g/animal) homogenized in 1 mL of sterile saline buffer were plated onto 5% sheep blood agar plates (Blood Agar Base No. 2, Oxoid, Hampshire, UK) and incubated overnight at 37 °C to evaluate the presence of hemolytic colonies. Up to 5 hemolytic colonies were selected from each plate and grown on MacConkey agar (Oxoid, Hampshire, UK), Triple Sugar Iron agar (Oxoid, Hampshire, UK), Simmons Citrate agar (Oxoid, Hampshire, UK), and Buffered Peptone Water Broth (Oxoid, Hampshire, UK). Colonies positive for glucose oxidation–fermentation, fermentation of lactose (MacConkey agar), indole production (peptone water + reagent Kovacs—Kovac’s reagent for indoles—Fluka, Saint Louis, MO, USA) and sodium citrate-negative were then subjected to biochemical tests with the API system® (API 20 NE—BioMerieux, Marcy-l’Étoile, France) for a more precise identification. The identification of the Lactobacillus spp. and Enterobacteriaceae was performed on plates specific for each type of bacteria and incubated under adequate conditions.
A semi-quantitative approach, based on serial dilutions in medium allowed for the determination of the bacteria concentration (detection limit 1 CFU/g).
E. coli strains were isolated from faecal samples of each pig, cultured (37 °C for 24 h) on Blood Agar and MacConkey agar (Oxoid, Hampshire, UK), further isolated (37 °C for 24 h) on Trypticase Soy agar (Oxoid, Hampshire, UK) and biochemically identified with API-20E method (BioMerieux, Marcy-l’Étoile, France). Besides the evaluation of hemolytic activity, they were serotyped by using monospecific antisera for the somatic antigen O138 [30]. Finally, the genetic characterization was performed by PCR on isolated E. coli strains for VT, VT1, VT2 and VT2e; the VT2e positive strains were also tested for F18 [31,32].
2.4. Histopathology and Immunohistochemistry
The organs fixed in 10% neutral buffered formalin were paraffin wax embedded, sliced with a microtome into five μm thick histological sections and stained with hematoxylin and eosin. Samples were examined for presence of inflammation both in villi and in lamina propria (infiltrates of lymphocytes, plasma cells, histiocytes and eosinophils), epithelial regeneration (enterocytes with high nucleus/cytoplasm ratio on the intestinal layer), fusion of villi, oedema in deep lamina propria, and T atrophy (T-dependent ipocellularity areas), stroma (fibroconnective and histiocytes) and follicular hyperplasia. All histological parameters were semi-quantitatively scored: 0 = absent, 1 = slight, 2 = moderate; 3 = strong.
Sections of formalin-fixed paraffin-embedded tissues were dewaxed and unmasked by heat induced epitope retrieval and Buffer H (Bio-Optica, Milan, Italy); endogenous peroxidase activity was blocked by incubation with 3% H2O2. After rinsing and treatment with PBS, containing normal serum to reduce nonspecific background staining, sections were incubated with the primary antibodies specific for Iba1 (Wako, Neuss, Germany), CD3 (Dako, Næstved, Denmark), CD20 (Thermo Scientific, Rome, Italy), IgG (Vector Laboratories, Burlingame, CA, USA) and IgA (Abcam, Cambridge, UK) at the suggested dilutions. Sections were then incubated with biotinylated secondary antibody (rabbit anti-goat, Vector Laboratories, Burlingame, CA, USA) and labelled by the avidin-biotin-peroxidase (ABC) procedure (commercial immunoperoxidase kit VECTASTAIN® Elite ABC-Peroxidase Kit Standard, Vector Laboratories, Burlingame, CA, USA). The immunoreaction was visualized with 3,3′-diaminobenzidine substrate (Peroxidase DAB Substrate Kit, Vector Laboratories, Burlingame, CA, USA) after counterstaining with Mayer’s haematoxylin (Merck, Kenilworth, NJ, USA) [33] and blind evaluated with a light microscopy by a veterinary pathologist. Known positive control sections were included in each assay. CD3, CD20 and Iba1 immunoreactions were semi-quantitatively scored in lamina propria (0 = absent, 1 = rare cells, 2 = some cells; 3 = numerous cells; 4 = very numerous cells), while IgG and IgA immunoreaction was semi-quantitatively scored on the epithelial luminal surface and lamina propria (0 = absent, 1 = slight, 2 = moderate; 3 = strong).
2.5. Immunoenzmatic Assay
Intestinal scrapes were homogenized using a rotor-stator system (Ultra Turrax T25, Staufen im Breisgau, Germany) in lysis buffer (50 mM Tris–HCl, pH 7.4, 1% Nonidet P-40, 0.25% sodium deoxycholate, 150 mM NaCl, 1 mM EDTA, Sigma-Aldrich, Saint Louis, MO, USA) with protease inhibitor cocktail (1 mM PMSF, 5 μg/mL Complete Protease Inhibitor Cocktail, Roche diagnostics, Mannheim, Germany) and centrifuged at 470× g for 15 min at 4 °C. The supernatants were collected and the protein content was quantified by direct absorbance measurement at 280 nm in quartz cuvette.
The titers of serum and intestinal mucosa total IgA (as mg/mL and ug/mL, respectively) were determined using a sandwich ELISA (Swine IgA ELISA Quantitation Set, Bethyl Laboratories Inc., Montgomery, TX, USA) according to the manufacturer’s instructions. Intestinal mucosa TNF-α, IL-8 and CXCL9 (MIG) levels (ng/mg of total proteins) were detected using three specific Swine Do-it-Yourself sandwich ELISA kits (Kingfisher Biotech Inc., St. Paul, MN, USA), while intestinal mucosa IL-1β was determined using Porcine Interleukin 1β ELISA kit (Cusabio Life Science, Houston, TX, USA). Negative and blank (buffer) samples were included on each plate along with duplicates of samples.
2.6. RNA Extraction, Reverse Transcription and Real-Time PCR Assays
Total RNA was isolated from the samples homogenized by a rotor-stator system (Ultra Turrax T25, Staufen im Breisgau, Germany) in 2 mL of TRI®Reagent (Sigma-Aldrich, Saint Louis, MO, USA). Purity and concentration of total RNA were spectrophotometrically determined (BioPhotometer Eppendorf, Hamburg, Germany) and 1 µg of total RNA from each sample was reverse transcribed to cDNA in a 25 µL final volume using the High-Capacity cDNA Archive kit (10 min at 25 °C, 60 min at 37 °C and 5 min at 95 °C) (Applied Biosystems, Waltham, MA, USA) [34]. The resulting cDNA was assayed in Real-Time PCR (7000 Sequence Detection System, Applied Biosystem, Waltham, MA, USA) [35] to quantify the expression of the best-characterized innate immunity receptors TLRs (2 and 4) in swine and pro-inflammatory cytokines IFN-γ and IL-1β in jejunum, and the expression of the antigen-presenting molecules MHC (type I and II) in mesenteric lymph node cells. Specific primer pairs were designed on the NCBI nucleotide sequences database. The porcine housekeeping gene beta-actin was used as endogenous control. All the primers were custom synthesized (Invitrogen, Waltham, MA, USA) (Table 2).
Table 2.
Oligonucleotides used for PCR reactions.
Gene expression of each sample was quantified in relationship to an animal chosen as calibrator (relative quantification) and normalized using the calculated beta-actin cDNA expression (mean) of the same sample and run [34] and results were reported as relative expression compared to beta-actin.
2.7. Statistical Analysis
The results were analysed using the Wilcoxon Rank Sum test for unpaired samples using JMP® Pro 15 (SAS Inst. Inc., Cary, NC, USA). The statistical differences were considered when p ≤ 0.05.
Differences were first tested between C and I animals. Furthermore, the differences between 3-day and 9-day sacrificed animals were verified within C and I groups, respectively. Finally, the differences between C and I animals within 3-day and 9-day sacrificed animal groups were also tested. All measurements were assessed using the individual pig as an experimental unit. The results are presented as medians and range (minimum–maximum).
3. Results
3.1. Zootechnical and Clinical Evaluation
The polymorphism analyses on the FUT1 gene proved that all piglets used in this study were susceptible to F18 VTEC infection. The digestion of amplified FUT1 resulted in fragments of 241, 93 and 87 bp for the FUT1G/G genotype, whereas the FUT1G/A genotype generated fragments of 328, 241, 93 and 87 bp and the FUT1A/A genotype created fragments of 328 and 93 bp.
The uninfected animals maintained the average daily rectal temperature below 39 °C for all the time course of the study, while the infected piglets showed an increase of about half a degree. The evaluation of the clinical status (faecal consistency, palpebral oedema, epiphora, vitality, depression, hair, perineal area, respiratory and neurological problems) is reported in Table 3 as median score, corresponding to the sum of individual daily scores from days 1 to 3 (Σ3) and 1 to 9 (Σ9) post infection. In general, all uninfected animals showed lower values for all the measured clinical signs. The infection induced statistically significant higher scores for epiphora, oedema, vitality and depression in the first 3 days and for oedema, depression, vitality and hair at day 9 post infection.
Table 3.
Total median scores related to clinical symptoms.
Although the median BW of the C group was higher than the I group, significant differences were not detected (Figure 1). The median ADG in the pre-infection period (days 13–20) was 315.71 g/day (min 191.43–max 380) and 305.72 g/day (min 28.57–max 422.86) in C and I animals, respectively. Two days after the infection (ADG 20–22) median values observed in C and I groups showed an ADG of 597.50 g/day (min 320.00–max 750.00) and 402.50 g/day (min 190.00–max 715.00), respectively. The I group showed a median value of average individual FI of 331 g/day (min 210–max 426) and 562 g/day (min 431–max 731), respectively, in the pre-infection period (day 0–20) and in post infection period (21–29 days). The average daily FI of C pigs was 382 g/day (min 263–max 434) and 570 g/day (min 460–max 717), calculated on days 0–20 and on day 21–29, respectively; although slightly higher, did not show significant differences. No differences were observed for the feed efficiency in the pre-infection period (G:F, 0.60, min 0.47–max 0.78 and 0.63, min 0.08–max 0.74 in C and I groups, respectively), while in the post infection period a higher feed efficiency was observed for C group (G:F, 0.71, min 0.67–max 0.71 in C vs. 0.59, min 0.54–max 0.69 in I group; p < 0.01).
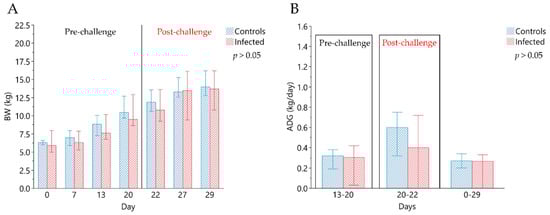
Figure 1.
Evaluation of zootechnical performance. (A) Median values of individual body weight (kg) of experimental groups, measured at 0, 7, 13, 20, 27 and 29 days. Day 0 corresponds to the beginning of the in vivo trial, and day 20, indicated by the line, correspond to the day of infection. (B) Median values of average individual daily gain (ADG) in the experimental groups. ADG (13–20) indicates the average daily gain calculated in the pre-infection period: from day 13 to day 20; ADG (20–22) represents the average daily gain in the first period after infection (from day 20 to day 22; at day 20 was performed the experimental infection); ADG (0–29) is the average daily gain calculated in the entire experimental period (from day 0 to day 29). The comparisons were performed using the Wilcoxon Rank Sum test for independent groups. All data are reported as medians, minimum (min) and maximum (max) of results obtained for the pigs in the Control (n = 6) and in the Infected (n = 12) groups.
3.2. Microbiological Analysis
None of the piglets presented faecal shedding of O138 and F18 E. coli strains before infection, neither did C animals over the time course of the study. Faecal shedding of hemolytic O138 and F18 E. coli was detected in 83% (n = 10) of I group the day after the infection (Figure 2).
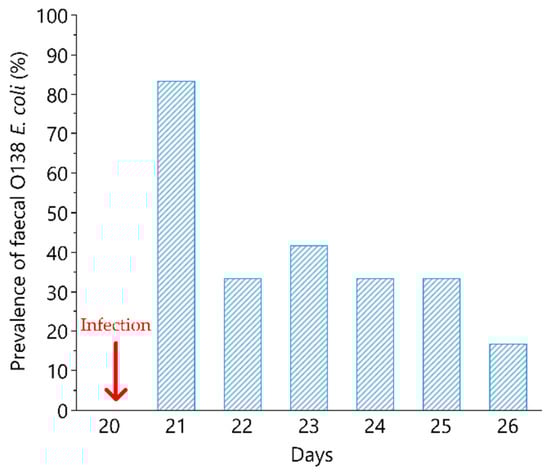
Figure 2.
O138 F18 E. coli shedding after experimental pig infection. Percentage of piglets of the infected group (n = 12) presenting O138 F18 E. coli in faeces in the post infection period (day 21 to day 28). The experimental infection was represented by a single intragastric inoculum (5 mL) equivalent to 1 × 10¹⁰ O138 F18 E. coli colony-forming units (CFU)/5 mL and was performed at day 20. The arrow indicates the day of infection.
Only 1 piglet of the I group did not shed E. coli O138 in the observed period (1 to 7 days after infection). The average duration of faecal shedding, in the 8 days considered after infection, was 2.5 days (ranging from 1 to 7).
The total faecal bacterial count decreased gradually from the day after challenge, returning after 7 days at the same level of the pre-infection period. The total bacterial count ranged from 6.6 to 10.4 CFU/L in the experimental group.
3.3. Histology and Immunohistochemistry
The only statistically significant value detected by histology was the inflammatory infiltrate of lymphocytes, which was higher in I vs. C piglets (higher values detected at day 9 post infection). Infiltrates of lymphocytes significantly decreased from 3 to 9 days post-infection in the C group (p < 0.05). The immunohistochemistry results showed statistically significant higher CD3-positive T cells in intestinal epithelium in C vs. I animals sacrificed at day 3, and statistically significant lower cells in the animals euthanatized at day 9 (p < 0.05) (Table 4). Non-infected pigs displayed a significant decrease in CD3-positive T lymphocytes in epithelium and lamina propria from day 3 to 9 (Table 4). When considering only infected piglets both the CD3-positive T cells in epithelium and IgG in the intestinal crypts resulted statistically significantly higher in the subacute phase vs. the acute one (Table 5).
Table 4.
Median parameters obtained in infected and controls at 3 and 9 days.
Table 5.
Median histology and immunohistochemistry parameters obtained at 3 and 9 days for infected and controls.
3.4. Immune Parameters
Within the C group, the serum titer of IgA, TNF-α and CXCL9 tended to decrease from 3 to 9 days. IgA measured in the small intestinal scrapes and IL-8 increased from day 3 to 9 post infection although without a statistical significance (Table 6). Within the I group, no statistical differences were observed between days 3 and 9 post infection (Table 7).
Table 6.
Median PCR and ELISA parameters obtained at 3 and 9 days for infected and controls.
Table 7.
Median parameters obtained in infected and controls at 3 and 9 days.
Comparing C and I groups at day 3 post infection, no significant differences were observed (Table 7), while at day 9 post infection IgA in the small intestinal scrapes tended to be lower in I vs. C. None of the parameters measured by real-time RT-PCR showed significant differences.
4. Discussion
An appropriate disease model is necessary to study the pathogenesis of the multifactorial PWD and to develop control strategies alternative to the use of antibiotics. The disease depends not only on virulence or pathogen–host interaction, but also on pig resistance and immune response. In this experimental model, in order to reduce the number of animals, piglets were chosen after polymorphism analysis of the FUT1 gene, correlated with F18 receptor expression [36], susceptible to infection with E. coli O138.
In order to bypass the first line of body’s defence against the invading microorganism, prior to experimental infection, piglets received a solution of bicarbonate, which reduces the neutralization of ingested bacteria by gastric acids.
The high-CP diet administered during the first three days after the infection was intended to be a “high-risk” diet, since several pathogens preferentially ferment proteins and high-CP diet in newly weaned piglets is indicated as one of the predisposing factors of VTEC infection. Moreover, the high-CP was due to soybean, which seems to favour the occurrence of E. coli infection [19].
The occurrence of VTEC infection was confirmed by bacteria faecal shedding in all the I group piglets and none of the C group ones. It peaked at day one post infection for the majority of animals and subsequently decreased in the following 7 days. A broad spectrum of clinical outcomes, including diarrhoea and enterotoxiaemia, which typically do not occur in all infected piglets, was also observed.
Zootechnical performances were impacted after challenge. The ADG reduction (days 20–22) was linearly related to the FI reduction in I group. Despite this significant reduction, the final BW was not statistically different in the two groups, probably due to compensatory FI starting 4 days after challenge, normally observed in E. coli infection. The feed efficiency was lower in the infected animals; the total recovery may take far longer than this experimental period.
The clinical symptoms of E. coli O138 infections are mainly related to verotoxins and F18 adhesins, which damage the vascular endothelium of the small intestine, subcutis, and brain and ultimately lead to subcutaneous oedema and neurological disorders. The animals showed, after infection, a broad spectrum of clinical outcomes, including specific (palpebral oedema and epiphora) and aspecific (depression, reduction in vitality) symptoms. In particular, the medians of sum of the daily scores of palpebral oedema, epiphora and vitality resulted significantly higher in the infected group; this variation could be used to monitor the infection in the acute phase (Σ3). A higher depression level and a reduction in the vitality were also measured in infected animals, both in acute and subacute phases, highlighting the importance of considering the role of behavioural alteration on disease outbreaks that often contribute to a reluctance to move.
The faecal scores were higher in infected animals, but not statistically significant. This may be explained with the limited number of animals enrolled in this study and possibly also for the increased intestinal fermentation due to high-CP diet administered to both experimental groups. The effect of the infection on the hair score was observed 9 days post bacterial inoculation (hairs appeared normal in the first few days). The development of fuzzy hair coat, lumps, scaly skin and bald patches is typically used in field as a parameter to identify compromised pigs and/or to evaluate their welfare. It is not considered a specific symptom of stress reaction that can be considered in the general evaluation of health status. The absence of mortality may depend on the adoption of a unique infection model, in line with the 3Rs guiding principles for more ethical use of animals in testing, and on environmental condition. The group housing of the animals contributes to increase the spread of the bacteria in the environment and the transmission.
Considering the immune parameters, proinflammatory cytokines and chemokines, such as TNF-α, IL-1β, IL-8, CXCL9 and IFN-γ, directly or indirectly mediate inflammatory response and are essential in initiating effective protection [37]. Pig weaning has been reported to upregulate the expression of inflammatory cytokines in the gut during acute stress [38]. The decrease in cytokines and chemokines (TNF-α and CXCL9) from day 3 to 9, observed in C group, may be explained with a diminished acute stress. In humans, it is known that the proinflammatory cytokine production increases with acute stress and decreases with chronic stress.
Immunohistochemistry confirmed the increase in inflammatory parameters in all infected animals.
Once the invading pathogen enters the host through mucous membranes, local rather than systemic immunity is essential. Interestingly we observed a dramatic statistically significant decrease in CD3+ T cells at day 3 in the intestinal epithelium. This may be explained with the ability of the pathogen to downregulate the expansion of newly recruited T cells into the epithelium, impairing the immune response. At day 3, B lymphocytes were absent in both C and I groups in the epithelium and they slightly increased in the I group in lamina propria, as indicated by CD20 staining. On the contrary, at day 9, a statistically significant increase in CD3+ T cells was observed in the I group in the intestinal epithelium and a slight increase (not statistically significant) in the lamina propria, probably as result of the effective host immune response, triggered by the cytokines. No differences in B lymphocytes were observed at day 9 between C and I groups, either in the intestinal epithelium nor in lamina propria. Overall, these results indicate a predominant cellular immune response at intestinal level, both in acute and chronic phases, that can be considered for the in vivo evaluation of alternative to antibiotic compounds.
T cells play a major role in pathogenesis of E. coli diseases; they respond to antigens in a selective and balanced fashion that allows for mounting an effective cell-mediated immune response.
IgA, secreted by plasma cells in intestinal lamina propria, are a major component of the local immune barrier of the gut and play a crucial role in intestinal homeostasis and protection; therefore, they are used as indicator of intestinal mucosal immunity [39]. At day 3 post infection no statistical difference was observed between C and I groups, while at day 9, the intestinal scrapes of I pigs displayed a significant lower amount of IgA than C pigs as consequence of the bacterial infection [40]. It is unlikely that maternal IgA could be adsorbed by small intestinal enterocytes of few-week-old pigs due to intestinal closure and gut maturation [41]; in contrast, it is possible that maternal IgA interact with intestinal microflora in the lumen and subsequently regulate the host immune response. Since one of the roles of IgA in the intestine is to bind the pathogenic bacteria and promote the internalization of the complex by M cells, it is likely that the amount of IgA present in the intestinal lumen substantially decreases after bacterial invasion. In addition, IgA undergo strong conformational changes upon antigen engagement and binding, which may explain the lower amount of IgA measurable by immunoassays. This occurs in the intestine only, as confirmed by our data, which show that levels of IgA in serum are about the same in C vs. I groups at both considered time points. Thus, on one side, the intestinal barrier heavily affects the microorganism; on the other side, the infectious agent impairs the gut homeostasis by destabilizing intestinal mucosa.
The kinetic of serum IgA, similar in C and I groups, showed a decrease in titer from 3 to 9 days, (statistical tendency only for the C group) as expected in accordance with the normal decline in maternally derived antibodies in the post-weaning piglets [42].
The assessed panel of clinical symptoms can represent a useful tool in order to evaluate the effectiveness of a further intervention that mitigates or abate the severity of the E. coli O138 challenge. The clinical scores related to the acute symptoms (oedema, vitality, and depression) were discriminant after both 3 days and 9 days post-challenge and represent a consistent and valuable pattern of observation on a daily basis that can offer important information. On the contrary, the effect of the experimental infection on hair status was more indicative after 9 days post-challenge. Even if the observed inflammatory and immunity parameters provided interesting data, due to the high individual variability, a large sample numerosity could be necessary to better underline the differences.
5. Conclusions
The adopted infection model, carried out on susceptible piglets, allowed us to identify a panel of clinical symptoms related to VTEC infection that could be used to further assess the effectiveness of antibiotic alternatives. The specific molecular mechanisms by which intestinal bacteria induce host immune system alterations are still largely unknown, as it is unclear how the host immune response impacts the outcome of VTEC diseases. Nevertheless, our work contributes to uncover some immune traits of E. coli O138 infection in post-weaned piglets, e.g., how diet, host signalling immune molecules and microorganism interplay and allows us to identify some fundamental parameters of the host immune response to be taken in consideration in further studies.
Author Contributions
Conceptualization, L.R., A.B. and L.T.; methodology, L.R., L.T., E.S., P.T., F.R. and P.D.; formal analysis, L.R., L.T., J.F.S.F., G.L.A., F.R., P.R., P.T., E.S. and P.D.; investigation, L.R., L.T., G.L.A., E.D., J.F.S.F., F.R., P.R., E.S., P.T. and P.D.; resources, L.R. and L.T.; data curation, L.R., L.T., M.D. and E.D.; writing—original draft preparation, L.R. and L.T.; writing—review and editing, G.L.A., J.F.S.F., P.D., F.R., E.S., P.T. and M.D.; visualization, L.R. and M.D.; supervision, A.B.; project administration, L.R. and A.B.; funding acquisition, L.R. and A.B. All authors have read and agreed to the published version of the manuscript.
Funding
This project has been funded by the Regione Lombardia, ID N°30210444 (Progetti di Ricerca Industriale e Sviluppo Sperimentale nei Settori strategici di Regione Lombardia e del Ministero dell’Istruzione, dell’Università e della Ricerca di cui al Decreto n. 7128 del 29 luglio 2011) and it was developed in collaboration with Ferraroni S.P.A. and Plantechno s.r.l.
Institutional Review Board Statement
This in vivo trial was approved by ethical committee of the Italian Health Ministry, authorization number 102/2015-PR in accordance with European law (Dir 2010/63/UE).
Data Availability Statement
All data are available within the article.
Acknowledgments
The authors thankfully acknowledge Giancarlo Selmini for the production of the experimental diets, Giorgio Poli for his precious advices, and Antonio Crotti and Andrea Pastori for the technical support. The authors acknowledge the University of Milan for the support through the APC initiative.
Conflicts of Interest
We declare that we have no financial and personal relationships with other people or organizations that can inappropriately influence our work, there is no professional or other personal interest of any nature or kind in any product, service and/or company that could be construed as influencing the content of this paper.
References
- Dumont, B.; Fortun-Lamothe, L.; Jouven, M.; Thomas, M.; Tichit, M. Prospects from agroecology and industrial ecology for animal production in the 21st century. Animal 2013, 7, 1028–1043. [Google Scholar] [CrossRef]
- Smith, M.; Jordan, D.; Chapman, T.; Chin, J.-C.; Barton, M.; Do, T.; Fahy, V.; Fairbrother, J.; Trott, D. Antimicrobial resistance and virulence gene profiles in multi-drug resistant enterotoxigenic Escherichia coli isolated from pigs with post-weaning diarrhoea. Vet. Microbiol. 2010, 145, 299–307. [Google Scholar] [CrossRef] [PubMed]
- Hejna, M.; Gottardo, D.; Baldi, A.; Dell’Orto, V.; Cheli, F.; Zaninelli, M.; Rossi, L. Nutritional ecology of heavy metals. Animal 2018, 12, 2156–2170. [Google Scholar] [CrossRef]
- Dell’Anno, M.; Reggi, S.; Caprarulo, V.; Hejna, M.; Sgoifo Rossi, C.A.; Callegari, M.L.; Baldi, A.; Rossi, L. Evaluation of Tannin Extracts, Leonardite and Tributyrin Supplementation on Diarrhoea Incidence and Gut Microbiota of Weaned Piglets. Animals 2021, 11, 1693. [Google Scholar] [CrossRef] [PubMed]
- Dell’Anno, M.; Hejna, M.; Sotira, S.; Caprarulo, V.; Reggi, S.; Pilu, R.; Miragoli, F.; Callegari, M.L.; Panseri, S.; Rossi, L. Evaluation of leonardite as a feed additive on lipid metabolism and growth of weaned piglets. Anim. Feed Sci. Technol. 2020, 266, 114519. [Google Scholar] [CrossRef]
- Sotira, S.; Dell’Anno, M.; Caprarulo, V.; Hejna, M.; Pirrone, F.; Callegari, M.L.; Tucci, T.V.; Rossi, L. Effects of Tributyrin Supplementation on Growth Performance, Insulin, Blood Metabolites and Gut Microbiota in Weaned Piglets. Animals 2020, 10, 726. [Google Scholar] [CrossRef]
- Fairbrother, J.M.; Nadeau, É.; Gyles, C.L. Escherichia coli in postweaning diarrhea in pigs: An update on bacterial types, pathogenesis, and prevention strategies. Anim. Health Res. Rev. 2005, 6, 17. [Google Scholar] [CrossRef] [PubMed]
- Luise, D.; Spinelli, E.; Correa, F.; Salvarani, C.; Bosi, P.; Trevisi, P. Effects of E. coli bivalent vaccine and of host genetic susceptibility to E. coli on the growth performance and faecal microbial profile of weaned pigs. Livest. Sci. 2020, 241, 104247. [Google Scholar] [CrossRef]
- Frydendahl, K. Prevalence of serogroups and virulence genes in Escherichia coli associated with postweaning diarrhoea and edema disease in pigs and a comparison of diagnostic approaches. Vet. Microbiol. 2002, 85, 169–182. [Google Scholar] [CrossRef]
- Beutin, L.; Krüger, U.; Krause, G.; Miko, A.; Martin, A.; Strauch, E. Evaluation of major types of Shiga toxin 2E-producing Escherichia coli bacteria present in food, pigs, and the environment as potential pathogens for humans. Appl. Environ. Microbiol. 2008, 74, 4806–4816. [Google Scholar] [CrossRef][Green Version]
- Mattsson, S.; Wallgren, P. Phenotyping of E. coli serotypes associated to oedema disease. Acta Vet. Scand. 2008, 50, 1–8. [Google Scholar] [CrossRef]
- Tan, C.; Tang, X.; Zhang, X.; Ding, Y.; Zhao, Z.; Wu, B.; Cai, X.; Liu, Z.; He, Q.; Chen, H. Serotypes and virulence genes of extraintestinal pathogenic Escherichia coli isolates from diseased pigs in China. Vet. J. 2012, 192, 483–488. [Google Scholar] [CrossRef] [PubMed]
- Shen, J.; Rump, L.; Ju, W.; Shao, J.; Zhao, S.; Brown, E.; Meng, J. Virulence characterization of non-O157 Shiga toxin-producing Escherichia coli isolates from food, humans and animals. Food Microbiol. 2015, 50, 20–27. [Google Scholar] [CrossRef] [PubMed]
- EU Commission. Regulation EC 1831/2003. of the European Parliament and of the Council, of 22 September 2003 on Additives for Use in Animal Nutrition (Text with EEA Relevance); EU Commission: Brussels, Belgium, 2003. [Google Scholar]
- Hejna, M.; Onelli, E.; Moscatelli, A.; Bellotto, M.; Cristiani, C.; Stroppa, N.; Rossi, L. Heavy-Metal Phytoremediation from Livestock Wastewater and Exploitation of Exhausted Biomass. Int. J. Environ. Res. Public Health 2021, 18, 2239. [Google Scholar] [CrossRef]
- Hejna, M.; Moscatelli, A.; Onelli, E.; Baldi, A.; Pilu, S.; Rossi, L. Evaluation of concentration of heavy metals in animal rearing system. Ital. J. Anim. Sci. 2019, 18, 1372–1384. [Google Scholar] [CrossRef]
- Slifierz, M.; Friendship, R.; Weese, J. Zinc oxide therapy increases prevalence and persistence of methicillin-resistant staphylococcus aureus in pigs: A randomized controlled trial. Zoonoses Public Health 2015, 62, 301–308. [Google Scholar] [CrossRef] [PubMed]
- Allen, H.K.; Levine, U.Y.; Looft, T.; Bandrick, M.; Casey, T.A. Treatment, promotion, commotion: Antibiotic alternatives in food-producing animals. Trends Microbiol. 2013, 21, 114–119. [Google Scholar] [CrossRef] [PubMed]
- Rossi, L.; Dell’Orto, V.; Vagni, S.; Sala, V.; Reggi, S.; Baldi, A. Protective effect of oral administration of transgenic tobacco seeds against verocytotoxic Escherichia coli strain in piglets. Vet. Res. Commun. 2014, 38, 39–49. [Google Scholar] [CrossRef]
- Dell’Anno, M.; Sotira, S.; Rebucci, R.; Reggi, S.; Castiglioni, B.; Rossi, L. In vitro evaluation of antimicrobial and antioxidant activities of algal extracts. Ital. J. Anim. Sci. 2020, 19, 103–113. [Google Scholar] [CrossRef]
- Coddens, A.; Loos, M.; Vanrompay, D.; Remon, J.P.; Cox, E. Cranberry extract inhibits in vitro adhesion of F4 and F18+ Escherichia coli to pig intestinal epithelium and reduces in vivo excretion of pigs orally challenged with F18+ verotoxigenic E. coli. Vet. Microbiol. 2017, 202, 64–71. [Google Scholar] [CrossRef] [PubMed]
- Bonetti, A.; Tugnoli, B.; Piva, A.; Grilli, E. Towards Zero Zinc Oxide: Feeding Strategies to Manage Post-Weaning Diarrhea in Piglets. Animals 2021, 11, 642. [Google Scholar] [CrossRef]
- Sun, Y.; Kim, S. Intestinal challenge with enterotoxigenic Escherichia coli in pigs, and nutritional intervention to prevent postweaning diarrhea. Anim. Nutr. 2017, 3, 322–330. [Google Scholar] [CrossRef]
- Luise, D.; Motta, V.; Bertocchi, M.; Salvarani, C.; Clavenzani, P.; Fanelli, F.; Pagotto, U.; Bosi, P.; Trevisi, P. Effect of Mucine 4 and Fucosyltransferase 1 genetic variants on gut homoeostasis of growing healthy pigs. J. Anim. Physiol. Anim. Nutr. 2019, 103, 801–812. [Google Scholar] [CrossRef] [PubMed]
- Luise, D.; Lauridsen, C.; Bosi, P.; Trevisi, P. Methodology and application of Escherichia coli F4 and F18 encoding infection models in post-weaning pigs. J. Anim. Sci. Biotechnol. 2019, 10, 1–20. [Google Scholar] [CrossRef] [PubMed]
- Meijerink, E.; Fries, R.; Vögeli, P.; Masabanda, J.; Wigger, G.; Stricker, C.; Neuenschwander, S.; Bertschinger, H.; Stranzinger, G. Two α (1, 2) fucosyltransferase genes on porcine chromosome 6q11 are closely linked to the blood group inhibitor (S) and Escherichia coli F18 receptor (ECF18R) loci. Mamm. Genome 1997, 8, 736–741. [Google Scholar] [CrossRef]
- European Parliament. Directive 2010/63/EU of the European Parliament and of the Council of 22 September 2010 on the protection of animals used for scientific purposes (Text with EEA relevance); EU Parliament: Strasbourg, France, 2010. [Google Scholar]
- Rossi, L.; Di Giancamillo, A.; Reggi, S.; Domeneghini, C.; Baldi, A.; Sala, V.; Dell’Orto, V.; Coddens, A.; Cox, E.; Fogher, C. Expression of verocytotoxic Escherichia coli antigens in tobacco seeds and evaluation of gut immunity after oral administration in mouse model. J. Vet. Sci. 2013, 14, 263–270. [Google Scholar] [CrossRef] [PubMed]
- Madec, F.; Bridoux, N.; Bounaix, S.; Cariolet, R.; Duval-Iflah, Y.; Hampson, D.J.; Jestin, A. Experimental models of porcine post-weaning colibacillosis and their relationship to post-weaning diarrhoea and digestive disorders as encountered in the field. Vet. Microbiol. 2000, 72, 295–310. [Google Scholar] [CrossRef]
- Farina, C.; Goglio, A.; Conedera, G.; Minelli, F.; Caprioli, A. Antimicrobial susceptibility of Escherichia coli O157 and other enterohaemorrhagic Escherichia coli isolated in Italy. Eur. J. Clin. Microbiol. Infect. Dis. 1996, 15, 351–353. [Google Scholar] [CrossRef]
- Rüssmann, H.; Kothe, E.; Schmidt, H.; Franke, S.; Harmsen, D.; Caprioli, A.; Karch, H. Genotyping of Shiga-like toxin genes in non-O157 Escherichia coli strains associated with haemolytic uraemic syndrome. J. Med. Microbiol. 1995, 42, 404–410. [Google Scholar] [CrossRef]
- Karch, H.; Böhm, H.; Schmidt, H.; Gunzer, F.; Aleksic, S.; Heesemann, J. Clonal structure and pathogenicity of Shiga-like toxin-producing, sorbitol-fermenting Escherichia coli O157: H. J. Clin. Microbiol. 1993, 31, 1200–1205. [Google Scholar] [CrossRef]
- Hsu, S.-M.; Raine, L.; Fanger, H. Use of avidin-biotin-peroxidase complex (ABC) in immunoperoxidase techniques: A comparison between ABC and unlabeled antibody (PAP) procedures. J. Histochem. Cytochem. 1981, 29, 577–580. [Google Scholar] [CrossRef] [PubMed]
- Riva, F.; Rahman, M.; Turin, L.; Ceciliani, F.; Russo, S.; Tribbioli, G.; Lecchi, C. TIR8 receptor expression in bovine tissues. Vet. Immunol. Immunopathol. 2010, 136, 65–70. [Google Scholar] [CrossRef] [PubMed]
- Turin, L.; Tribbioli, G.; Invernizzi, P.; Grati, F.; Crema, S.; Laible, G.; Riva, F. Fetal microchimerism in normal and embryo transfer bovine pregnancies. Vet. Res. Commun. 2007, 31, 205–207. [Google Scholar] [CrossRef]
- Meijerink, E.; Neuenschwander, S.; Fries, R.; Dinter, A.; Bertschinger, H.U.; Stranzinger, G.; Vögeli, P. A DNA polymorphism influencing α (1, 2) fucosyltransferase activity of the pig FUT1 enzyme determines susceptibility of small intestinal epithelium to Escherichia coli F18 adhesion. Immunogenetics 2000, 52, 129–136. [Google Scholar] [CrossRef] [PubMed]
- Turin, L.; Riva, F. Toll-like receptor family in domestic animal species. Crit. Rev. Immunol. 2008, 28, 513–538. [Google Scholar] [CrossRef]
- Pié, S.; Lallès, J.P.; Blazy, F.; Laffitte, J.; Sève, B.; Oswald, I. Weaning is associated with an upregulation of expression of inflammatory cytokines in the intestine of piglets. J. Nutr. 2004, 134, 641–647. [Google Scholar] [CrossRef]
- Kunz-Ebrecht, S.R.; Mohamed-Ali, V.; Feldman, P.J.; Kirschbaum, C.; Steptoe, A. Cortisol responses to mild psychological stress are inversely associated with proinflammatory cytokines. Brain Behav. Immun. 2003, 17, 373–383. [Google Scholar] [CrossRef]
- Stuyven, E.; Cox, E.; Vancaeneghem, S.; Arnouts, S.; Deprez, P.; Goddeeris, B. Effect of β-glucans on an ETEC infection in piglets. Vet. Immunol. Immunopathol. 2009, 128, 60–66. [Google Scholar] [CrossRef]
- Weström, B.; Svendsen, J.; Ohlsson, B.; Tagesson, C.; Karlsson, B. Intestinal transmission of macromolecules (BSA and FITC-labelled dextrans) in the neonatal pig. Neonatology 1984, 46, 20–26. [Google Scholar] [CrossRef]
- García, G.R.; Dogi, C.A.; Ashworth, G.E.; Berardo, D.; Godoy, G.; Cavaglieri, L.R.; de Moreno de LeBlanc, A.; Greco, C.R. Effect of breast feeding time on physiological, immunological and microbial parameters of weaned piglets in an intensive breeding farm. Vet. Immunol. Immunopathol. 2016, 176, 44–49. [Google Scholar] [CrossRef]
Publisher’s Note: MDPI stays neutral with regard to jurisdictional claims in published maps and institutional affiliations. |
© 2021 by the authors. Licensee MDPI, Basel, Switzerland. This article is an open access article distributed under the terms and conditions of the Creative Commons Attribution (CC BY) license (https://creativecommons.org/licenses/by/4.0/).