1. Introduction
Environmental enrichment can be defined as “a modification of the environment of captive animals, thereby increasing the animal’s behavioral possibilities and leading to improvements of their biological function” [
1]. Although results vary depending on the outcome variables assessed, the addition of different structures to the environment adds complexity and can have enriching effects for livestock, including broiler chickens [
2,
3,
4]. These provisions are therefore typically referred to as enrichments.
Fear and anxiety raise welfare concerns because they generate negative affect and, if chronically aroused, highlight an animal’s inability to cope with its environment [
5,
6]. Fear is a short-term emotional response motivating flight from, or freezing in response to, a currently present, immediate threat to survival, while anxiety is a longer-term emotional response motivating vigilance (i.e., alertness) in response to perceived potential threat and is amplified by adverse pre-and postnatal life experiences [
5,
7,
8,
9,
10]. These systems have evolved as adaptive mechanisms promoting survival in dangerous situations through temporary activation of sympathetic and hypothalamic-pituitary-adrenal axis activity and suspension of growth-promoting parasympathetic activity [
5]. However, excessive fear in broilers can be maladaptive, provoking panicked escape behaviors that cause injury, pain, and suffocation [
11]. In addition, high levels of fear and anxiety impair the birds’ ability to cope with environmental change, such as handling, transport, and loud noises, and have been linked with a worsened feed conversion ratio [
12,
13]. In many studies, fear in birds is measured using a tonic immobility (TI) test. TI is an anti-predator freezing response (feigning death) which prey species exhibit as a last resort when captured [
14]. Longer TI durations have revealed higher levels of fear in broilers handled roughly compared to gently [
15], manually caught compared to mechanically caught [
16], or heat-stressed [
12] or shocked [
17] prior to testing compared to control. A TI test could provide valuable insight into broiler fear levels when handled after rearing in environments varying in complexity and stocking density.
Level of anxiety can be evaluated through an attention bias (AB) test. AB describes the differential, affect-mediated allocation of attention towards one stimulus compared to others [
18]. In particular, anxious (vigilance) affective states can increase AB towards a stimulus [
18]. Humans with clinical anxiety show a greater AB towards threatening stimuli than those without anxiety [
19,
20,
21], and studies involving macaques [
22], sheep [
6,
23], cattle [
24], and laying hens [
25] have validated AB testing as a measure of anxiety level, where animals receiving an anxiogenic drug spent more time looking towards a threatening stimulus and showed increased vigilance behavior compared to control animals. For example, after receiving an anxiogenic drug, laying hens exposed to a conspecific alarm call were slower to feed, faster to vocalize, and exhibited increased locomotion, compared to hens that received a saline injection [
25]. These findings suggest that relatively anxious hens allocate more attention to a perceived threat, suggesting that this test could possibly serve as a tool to measure anxiety levels in broilers also. Although studies have reported successful differentiation of AB in animals, others have found unexpected or null results [
26,
27,
28]. To our knowledge, however, AB in broilers has not been previously tested.
Typical broiler chicken housing lacks complexity, such as provision of perches or preferred dustbathing substrate, limiting the expression of diverse natural behaviors, potentially contributing negatively to broiler welfare and performance [
1,
29,
30,
31,
32]. High stocking density is another welfare concern in broilers. For instance, high stocking densities can lead to poor foot health [
3,
11,
33] and may increase fear (response to a detected threat) [
5]. Lack of environmental complexity has also been associated with fear in broilers [
11]. However, behavioral indices of fear were not affected when birds were housed with or without access to string or barrier perches at various stocking densities [
34,
35,
36], raising questions about how stocking density affects fearfulness of broilers housed in a complex environment.
A reported benefit of adding perches as an enrichment for broilers is that the birds were less aggressive and experienced fewer disturbances while resting compared to broilers without perches [
29,
35]. For broilers, low perching platforms are used more than single linear perches, probably because heavy birds find them easier to balance on [
37], and they were found to reduce avoidance of people, suggesting they reduced fear [
38]. Moreover, while broilers are conventionally provided with a single type of litter over the whole floor, adding additional substrate materials can be enriching given that they vary in their value for different functions. For example, sand has been found to increase dustbathing behavior and activity levels compared to rice hull, paper, or wood shaving substrates [
39], and adding maize roughage increased foraging behavior compared to wood shavings alone [
32]. In addition, broilers housed with novel objects exhibited shorter durations of tonic immobility following acute stressors (sound, heat, and crating stress) compared to the control (no added objects), indicating decreased fearfulness [
40]. Given this evidence, increasing environmental complexity with perches, sand, and novel objects would enhance broiler welfare through reduced anxiety and fearfulness.
Potential combined effects of environmental complexity and stocking density on fear and anxiety in broilers have not previously been examined experimentally. Our objective was to investigate the impact of complex housing conditions and stocking density on fearfulness, as measured through a TI test, and anxiety, using an AB test. We hypothesized that broilers housed in a high-complexity, low-density environment would experience the lowest levels of fear and anxiety, whereas broilers from a low-complexity, high-density environment would experience the highest levels of fear and anxiety, with a low-complexity, low-density environment and a high-complexity, high-density environment showing intermediate results. In particular, we predicted that higher levels of fear and anxiety would be reflected by longer TI durations and stronger AB to perceived threatening stimuli.
2. Materials and Methods
2.1. Birds, Treatments, and Housing
Two experiments were conducted. In each, 1620 male Ross 708 chicks (total n = 3240), vaccinated against Marek’s disease, were obtained at day 0 from a commercial hatchery (Elizabethtown, PA, USA). Upon arrival to the research facility, chicks were randomly allocated to one of four treatment groups in a 2 × 2 factorial design with environmental complexity (low-complexity (LC) vs. high-complexity (HC)) and stocking density (low-density (LD) vs. high-density (HD)) as factors at pen level. Each treatment group was replicated three times (12 pens in total), distributed in a randomized complete block design.
All pens (14.5 m
2) contained standard pine shavings as bedding (approximately 10 cm depth), four hanging galvanized tube feeders (~12 kg capacity; no longer in production, but similar to “Flex” chicken feeder unit, SKU# CO30131, Hog Slat, Newton Grove, NC, USA), and three water lines (Valco Industries, Inc., New Holland, PA, USA), each with three nipple drinkers. All birds had ad libitum access to water and commercially-formulated broiler chicken feed (starter day 0–14, grower day 15–28, and finisher day 29–50). The birds were fed a corn/soy-based diet which met their nutritional requirements [
41]. Birds had access to three heat lamps/pen and 24 h light in the first 7 days, followed by a light:dark schedule of 18L:6D, with a light intensity of approximately 15 lux during light hours. Due to a technical issue in Experiment 1, birds received 24 h light for 7 additional days during week 2 of age. House temperature was gradually decreased from 35 °C on day 1 to 21 °C on day 50 by assessing bird comfort. Comfort was evaluated based on behaviors indicative of heat or cold stress (panting or huddling respectively), bird activity (birds are active and alert when a person enters the facility), and bird distribution (birds are showing a somewhat homogenous distribution throughout the pen). In Experiment 1, all birds received a therapeutic dose of antibiotics via the water lines from day 33–40 in response to a pathogen exposure.
2.2. Environmental Complexity
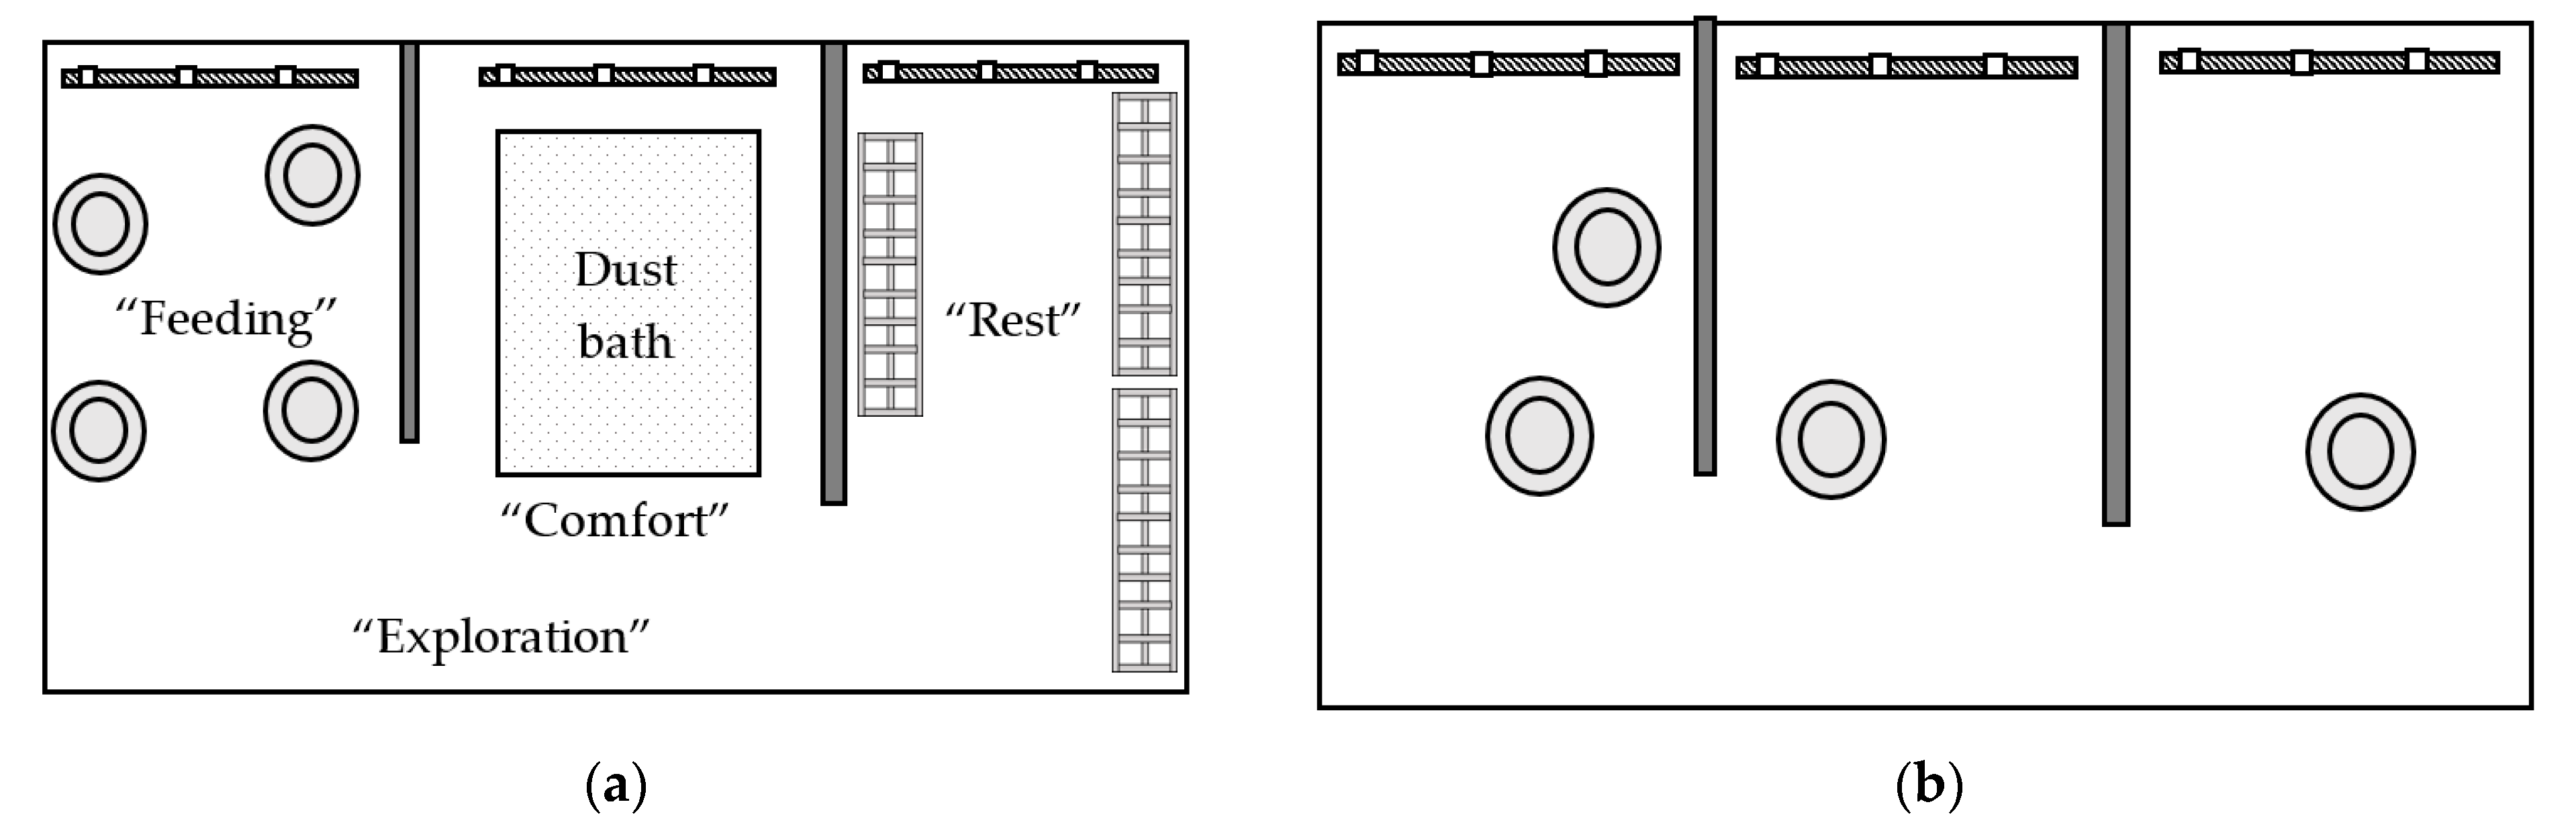
HC pens contained four functional spaces (
Figure 1a), including space for “feeding” (approximately 3 m
2), “comfort” (approximately 3 m
2), “resting” (approximately 3 m
2), and “exploration” (approximately 4.3 m
2). The feeding, comfort, and resting spaces included a water line. The feeding space contained four feeders and one third of a medium PECKstone
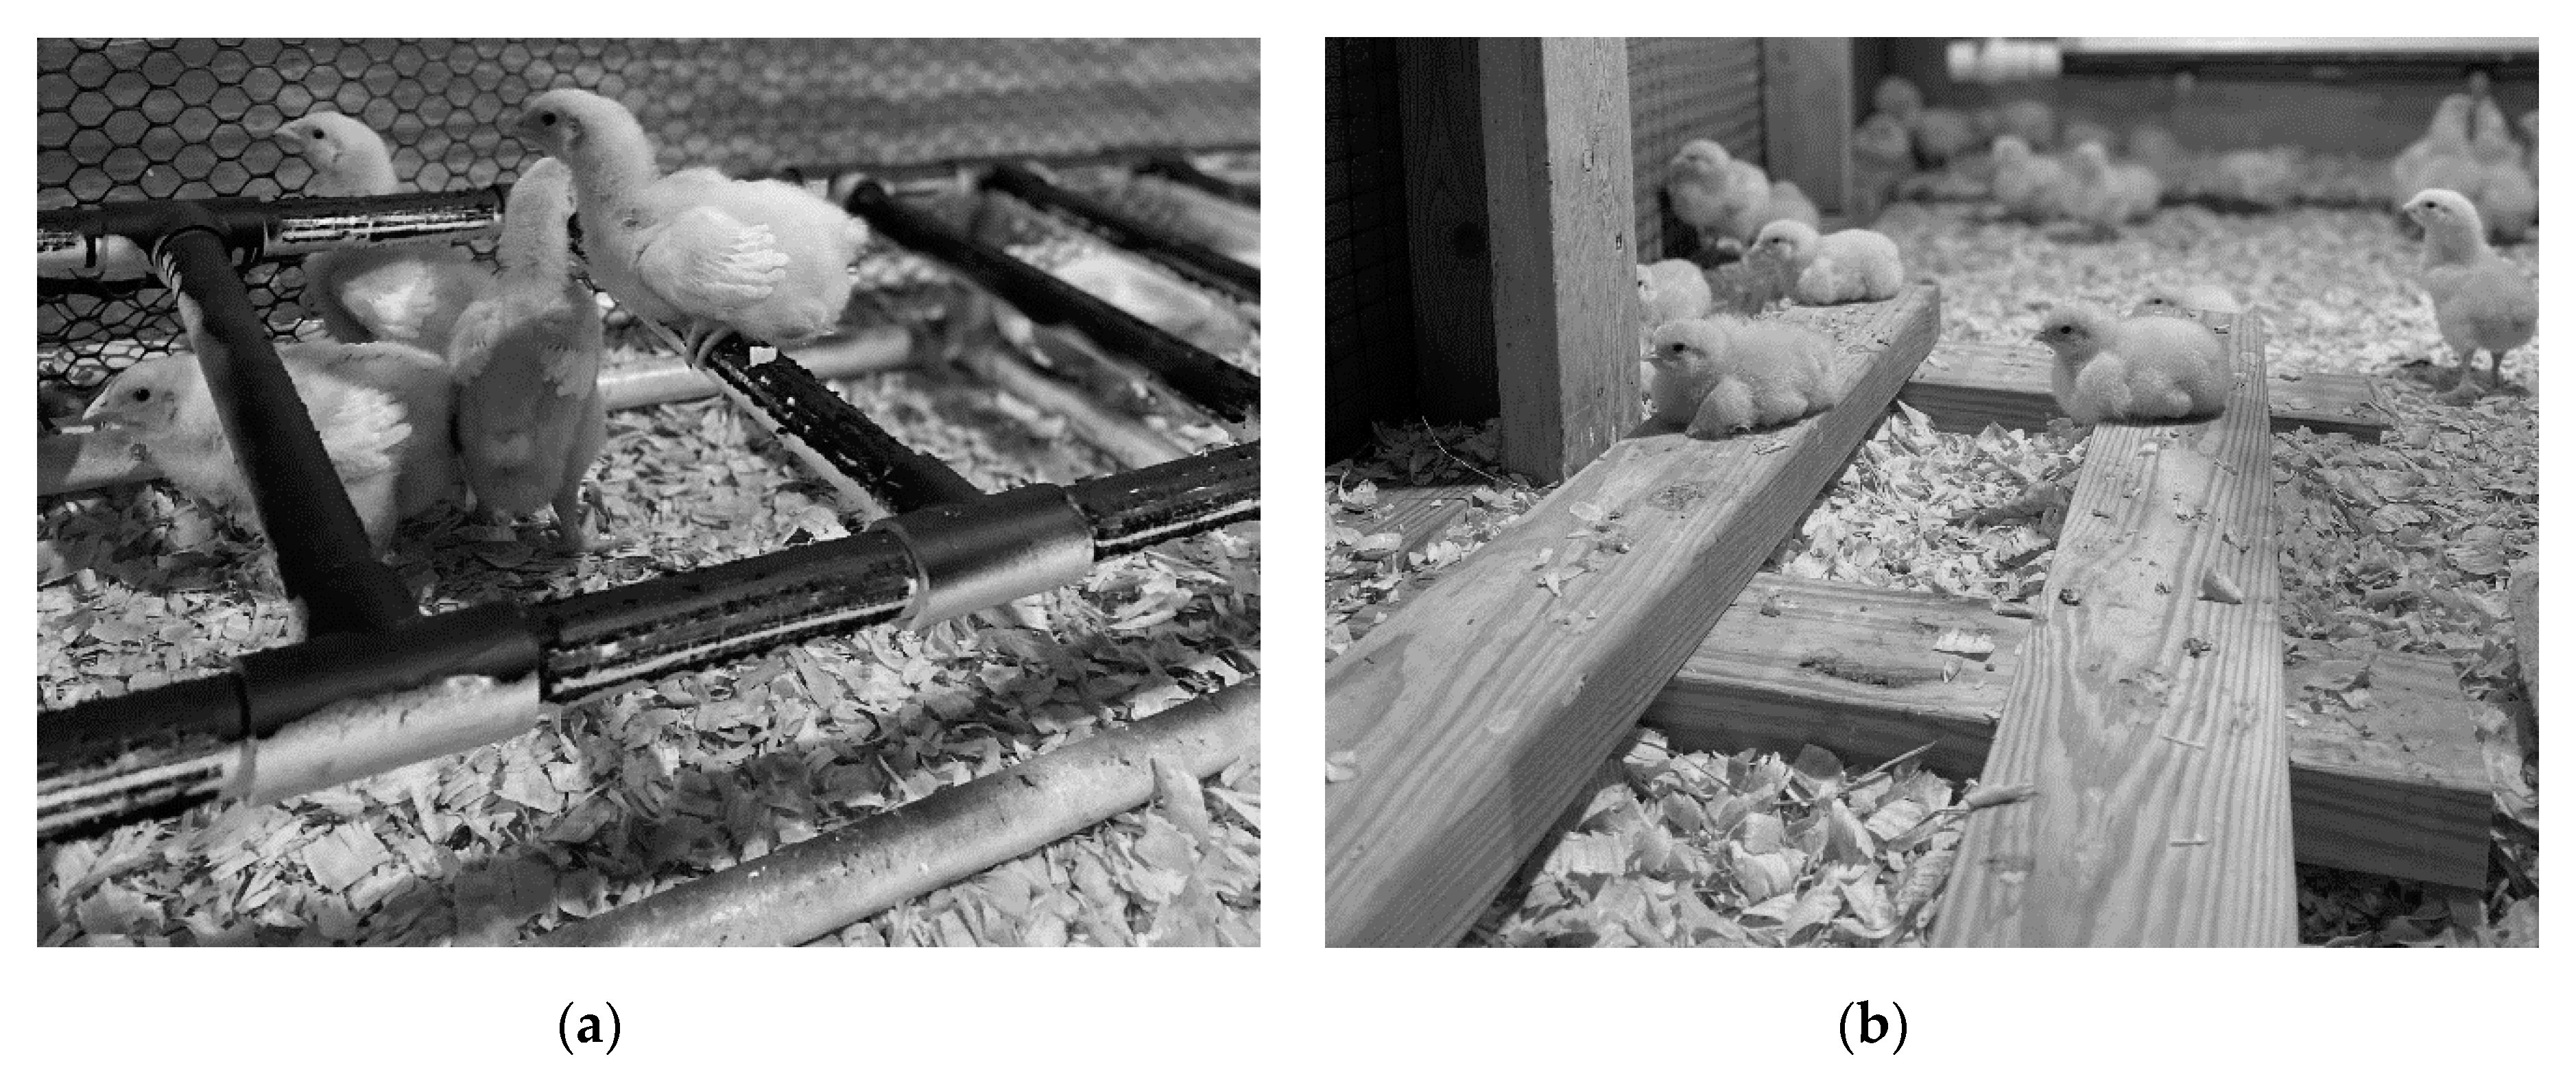
TM (Proteka, Inc., Lucknow, ON, Canada) broken into smaller pieces. The comfort space contained a wooden-frame dust bath (180 cm L × 91 cm W × 10 cm H) filled with 68 kg of playground sand (QUIKRETE, Atlanta, GA, USA) that was raked and partially replaced when depleted. The resting space in Experiment 1 included three perches (182.9 cm L × 30.5 cm W × 8.5 cm H) constructed of 1.9 cm diameter PVC pipe, which was sprayed with textured black spray paint (Rust-Oleum, Vernon Hills, IL, USA) to enhance grip while perching (
Figure 2a). Birds had access to 7.6 cm of linear perch space/bird in high-density pens, and 15.2 cm/bird in low-density pens. In Experiment 2, the PVC pipes were replaced with three wide wooden perches forming a platform (121.9 cm L × 45.7 cm W × 7.6 cm H;
Figure 2b), providing 76 cm
2 of space/bird in the low-density pens, and 39 cm
2 of space/bird in the high-density pens. The exploration space contained a pair of enrichment objects, starting on day 2 of age. Six objects were randomly paired into three groups of two, combining a nutritional and an occupational enrichment object, and these pairs were rotated every three days according to a randomized schedule to maintain variation and novelty (
Table 1). The LC pens had a similar set-up to the HC pens with four spaces, but without the peck stones, dust bath, perching platforms, or enrichment objects to differentiate the spaces into different functional areas (
Figure 1b).
2.3. Stocking Density
The HD pens were stocked with 180 chicks/pen, resulting in 42.1 kg/m
2 at day 50 in Experiment 1, and 42.6 kg/m
2 in Experiment 2 (
Table 2). The LD pens were stocked with 90 chicks/pen and reached a density of 23.8 kg/m
2 at day 50 in Experiment 1, and 23.3 kg/m
2 in Experiment 2 (
Table 2).
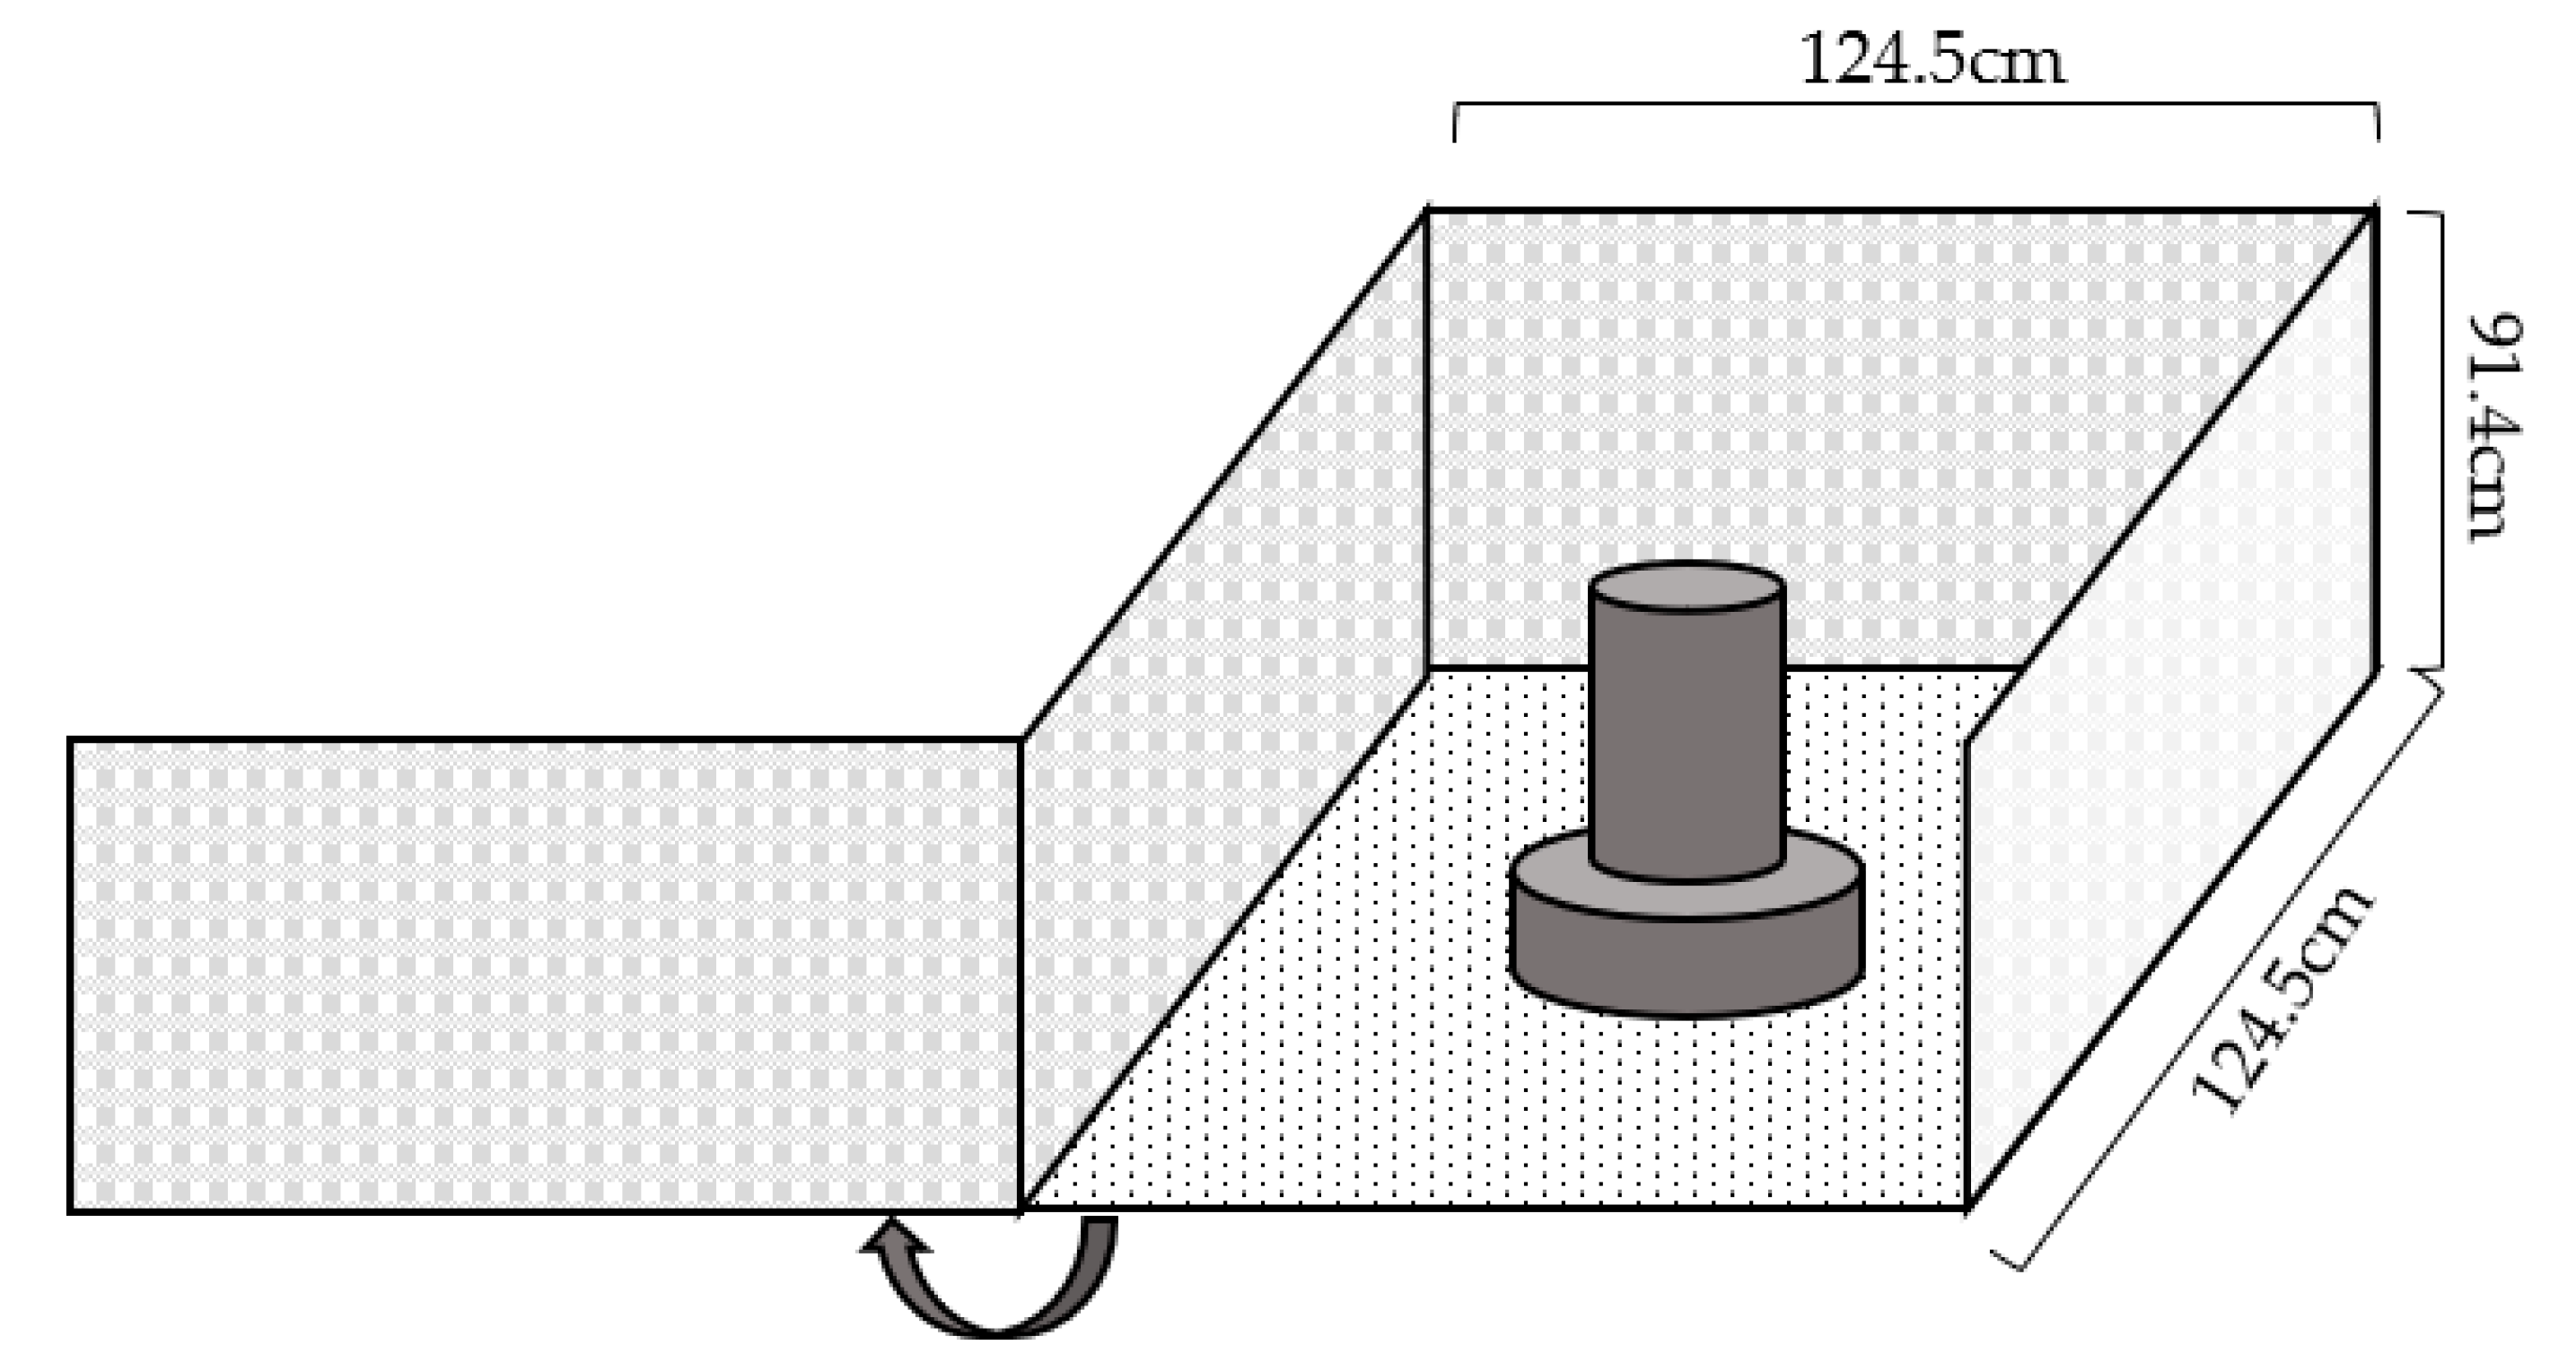
2.4. Experiment 1—Attention Bias Test
A square testing arena was constructed with two plastic, perforated folding partitions (approximately 124.5 cm L × 124.5 cm W × 91.4 cm H) with pine shavings on the floor and a feeder containing commercial feed, oats, and mealworms (
Figure 3). The arena was located in a separate room adjacent to, but separate from, the broilers’ home pens.
AB testing (modified from [
18,
25,
42]) was performed with five randomly selected birds/pen (
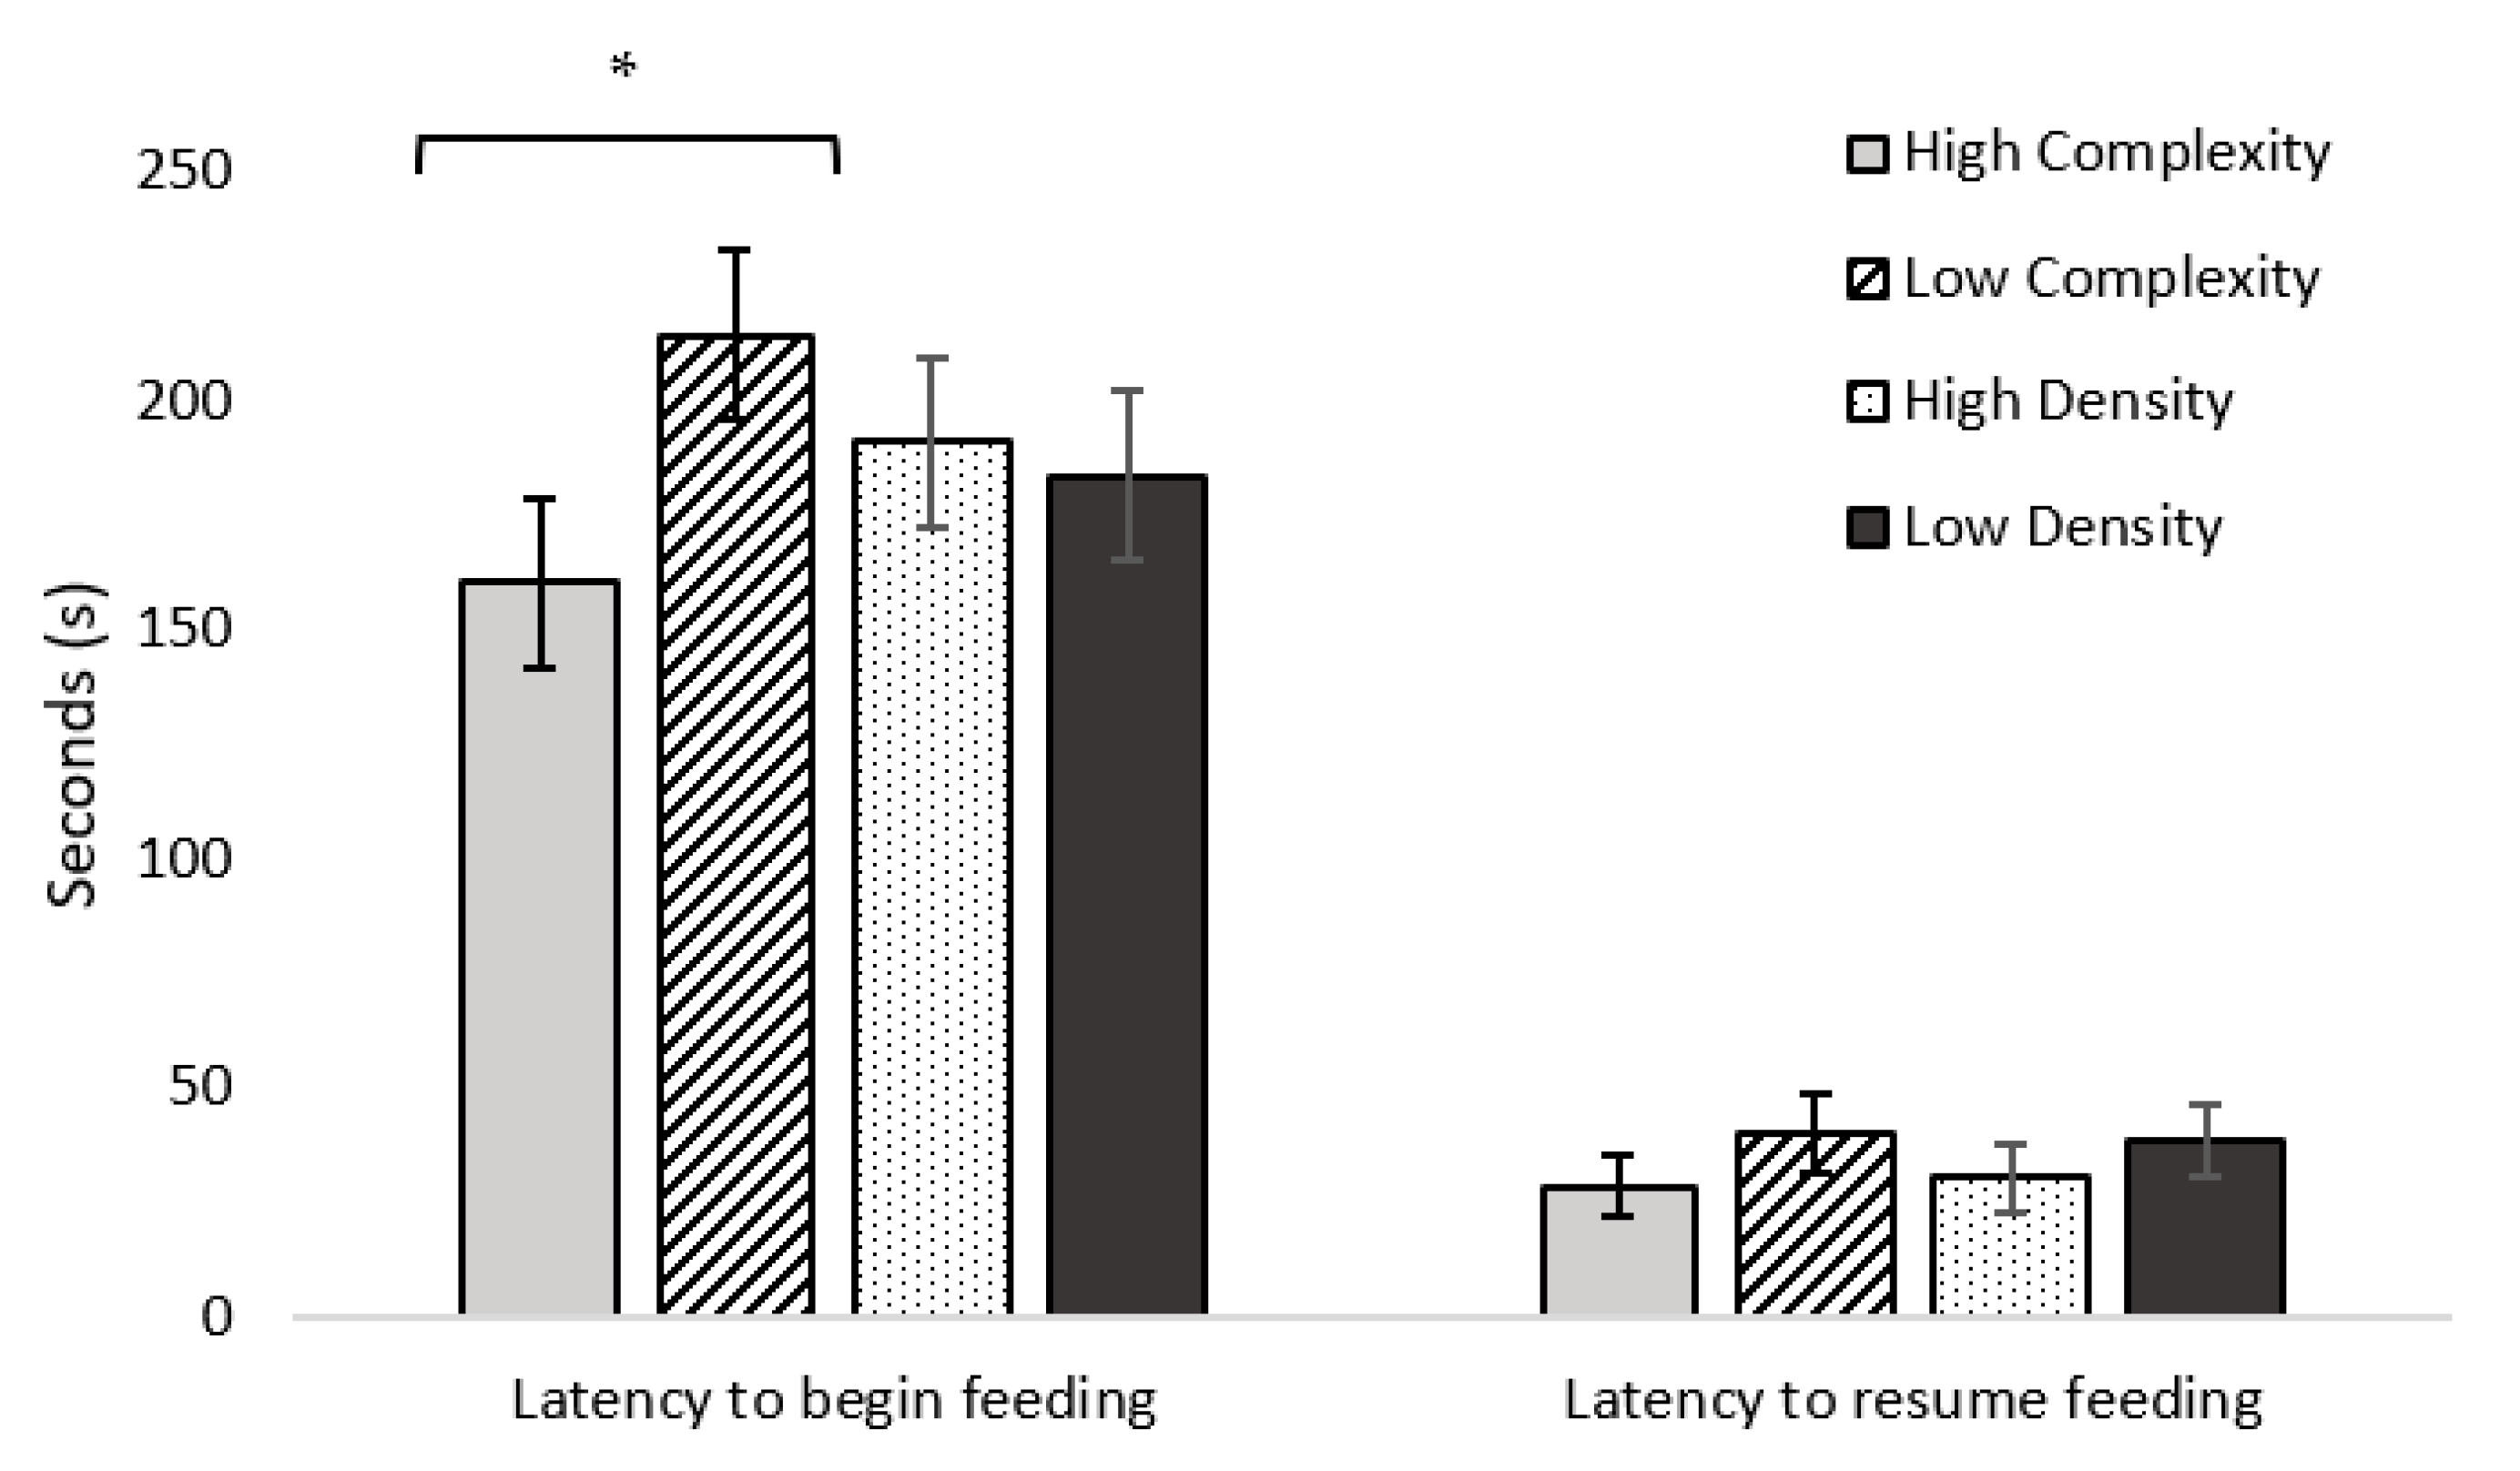
n = 60 birds across pens) on days 30, 32, and 33 of age. The testing order of pens was randomized. Each bird was tested separately by one observer, another person was present to move birds to and from the testing arena. The test started when the bird was placed in the AB arena. Immediately thereafter, an 8 second (s) conspecific alarm call was played from portable speakers (FUGOO, Van Nuys, Irvine, CA, USA) at full volume (95 dB). The alarm call was recorded from a chicken signaling a ground predator, which previous playback experiments have found to elicit a vigilance response [
42]. Following the alarm call, latency to begin feeding was recorded. If the bird began feeding at any point during the test, it was allowed approximately 10 s to feed, then the alarm call was played a second time, and latency to resume feeding was recorded. The test ended when the bird resumed feeding a second time (maximum test duration of 300 s). Birds that never began feeding received a maximum latency to begin feeding score of 300 s and those failing to resume feeding received no score (missing data). Additional live-recorded variables included latency to first vocalization and occurrence (yes/no) of vigilance behaviors in the 30 s following the first alarm call (visibly stretching neck, looking around, freezing, and erect posture) [
25]. Each of the four vigilance behavior characteristics (erect posture, neck stretching, looking around, and freezing) were scored as either 0 (not observed) or 1 (observed), giving a vigilance score between 0 (no vigilance behavior observed) and 4 (all vigilance behaviors observed at least once) for each bird tested. Videos were used to record latency to first step from when the alarm call playback ended, as a potential additional indicator of anxiety to determine how long the birds remained in a motionless state after the alarm call playback [
25,
43].
2.5. Experiment 2—Attention Bias Test
After Experiment 1, the AB test was modified with an increased sample size, a group testing approach rather than testing individual birds, and allowing more time in the test arena if most (but not all) birds began feeding after the first alarm call was played. The AB test was performed on days 32, 33, and 38 of age with 12 randomly selected birds/pen (
n = 144 birds across all pens) by two observers. These observers were trained by the researcher collecting data for Experiment 1. Inter-rater agreement was tested for latency to feed of 12 birds and was excellent among the three observers (Cronbach’s alpha of 0.933). The order of pens was randomized for testing. Birds were tested in groups of 3 (4 tests/pen) to avoid isolation stress [
44]. The same location, arena, feeder, feed, and alarm call were used as described for Experiment 1 (
Figure 3). Prior to placement in the arena, two out of three birds were marked with livestock marker (All-Weather Paintstik, LA-CO Industries, Inc., Elk Grove Village, IL, USA) for individual identification. Immediately after three birds were placed into the arena, the 8 s conspecific alarm call was played. Latency to begin feeding (s) from the feeder was then recorded for each individual bird (observer 1 recorded two birds, observer 2 recorded the third bird). Thereafter, the test procedure had four possible outcomes depending on how many birds began feeding and the time-point that they started feeding within the first 300 s of the test.
If all three birds fed from the feeder at least once during the 300 s testing period, they were allowed 5 s to feed before the second alarm call playback. Thereafter, the second alarm call was played. If all three birds fed from the feeder between 270–300 s, birds were allowed to feed for 5 s starting from when the last bird fed, the second alarm call was played, and the test time was extended to 420 s. Latency to resume feeding was recorded for each individual bird (observer 1 recorded two birds, observer 2 recorded the third bird).
If at the end of the 300 s testing period, two out of three birds fed from the feeder, they were allowed 5 s to feed starting from when the last bird fed, then the second alarm call was played and the testing time was extended to 420 s. Latency to resume feeding was recorded for each individual bird (observer 1 recorded two birds, observer 2 recorded the third bird). The bird that did not feed received a maximum latency score of 300 s for latency to begin feeding and no score for latency to resume feeding.
If one of the tree birds fed from the feeder during the testing period, latency to begin feeding was recorded for the bird that began feeding, and the second alarm call was not played. The other two birds received a maximum latency score of 300 s.
If none of the three birds fed from the feeder during the testing period, all three birds received a maximum latency score of 300 s.
Video recordings were also used to record latency to step (s) and occurrence (yes/no) of vigilant behaviors within 30 s following the first alarm call. Each of the four vigilance behavior characteristics (erect posture, neck stretching, looking around, and freezing) were scored as either 0 (not observed) or 1 (observed), giving a vigilance score between 0 (no vigilance behavior observed) and 4 (all vigilance behaviors observed at least once) for each bird tested. It was not feasible to record latency to first vocalization because birds were tested in groups.
2.6. Tonic Immobility Test
In both experiments, a single observer performed TI testing in the hallway area of the house, directly adjacent to the birds’ home pens. In Experiment 1, TI testing was performed on three randomly-marked birds/pen (
n = 36) on day 12 of age. Birds were marked on their back with livestock marker (All-Weather Paintstik, LA-CO Industries, Inc., Elk Grove Village, IL, USA). The same marked birds were tested again on day 26 of age. In Experiment 2, TI testing was performed on six randomly selected birds/pen (
n = 72) on day 19 of age. TI was induced by the handler carefully placing the bird on his back in a V-shaped cradle, placing one hand over the sternum and applying gentle pressure while cupping the other hand over the head (modified from [
45]). After 15 s, the handler lifted her hands from the bird, moved out of the bird’s line of sight, and recorded latency until righting response (TI duration [s]). If the bird attempted to right himself within 10 s after the hands were lifted, TI was considered not induced and the handler repeated the restraint procedure (maximum of three induction attempts). If TI could not be induced, the bird received the minimum score of 0 s. If birds remained in TI for the full 300 s testing period, a maximum latency score of 300 s was given.
2.7. Statistical Analysis
Data were analyzed in JMP Pro 15 (SAS Institute Inc., Cary, NC, USA). Data residuals were assessed for their distribution by visual inspection of normal quantile plots. An overview of the distribution of data residuals and subsequent statistical approaches is shown in
Table 3. The sample for resumption of feeding in the Experiment 1 AB test was too low for statistical analysis, so raw means are presented. For normally distributed data (see
Table 3), with the exception of AB data in Experiment 2, general linear mixed-effects models were used, with complexity (HC/LC), stocking density (HD/LD), and their interaction as fixed effects, and pen as a random factor. For AB test data, age was not considered a factor, as treatment groups were randomized across testing days. Normally distributed AB data in Experiment 2 were analyzed using general linear mixed-effects models, with complexity (HC/LC), stocking density (HD/LD), and their interaction as fixed effects, and testing group nested within pen as a random factor. No significant interaction effect between complexity and density was found for any response variables, so the interaction term was removed from the models. Durations of TI in Experiment 1 were analyzed using general linear mixed-effects models with complexity (HC/LC), stocking density (HD/LD), day (bird age), day × complexity, and day × stocking density as fixed effects, with bird ID and pen as random factors. Tukey’s HSD test was used for post-hoc analysis when main factors or their interaction were significant at
p < 0.05. Occurrence of vigilance behaviors were summed to give a total score, which ranged between 0 (no vigilance behavior observed) and 4 (all vigilance behaviors observed at least once), then were analyzed with complexity and stocking density as fixed effects, and pen as a random factor. Data are presented as LSmeans ± SEM unless otherwise noted.


 ,
,  ) and pecking stones, the “comfort” space included a sand dust bath (
  ), the resting space contained three perches (
  ), and the exploration space contained varying pairs of enrichment objects. The feeding, comfort, and resting spaces each contained a water line with three nipple drinkers (
  ). (b) Low-complexity (control) pen, containing four feeders and three water lines.
