
Deep Learning Classification of Canine Behavior Using a Single Collar-Mounted Accelerometer: Real-World Validation

 ,
,  , ,
, ,
Abstract
Simple Summary
Abstract
1. Introduction
- Sourcing training data from project participants and external collaborators to build machine learning training databases and behavior detection models such as those described in this work.
- Combining activity data, electronic medical records, and feedback from more than 69,000 devices distributed to participants over 2–3 years to develop and validate proactive health tools.
- Using the resulting datasets, currently covering over 11 million days in dogs’ lives, to enable insights that support pet wellness and improve veterinary care.
2. Materials and Methods
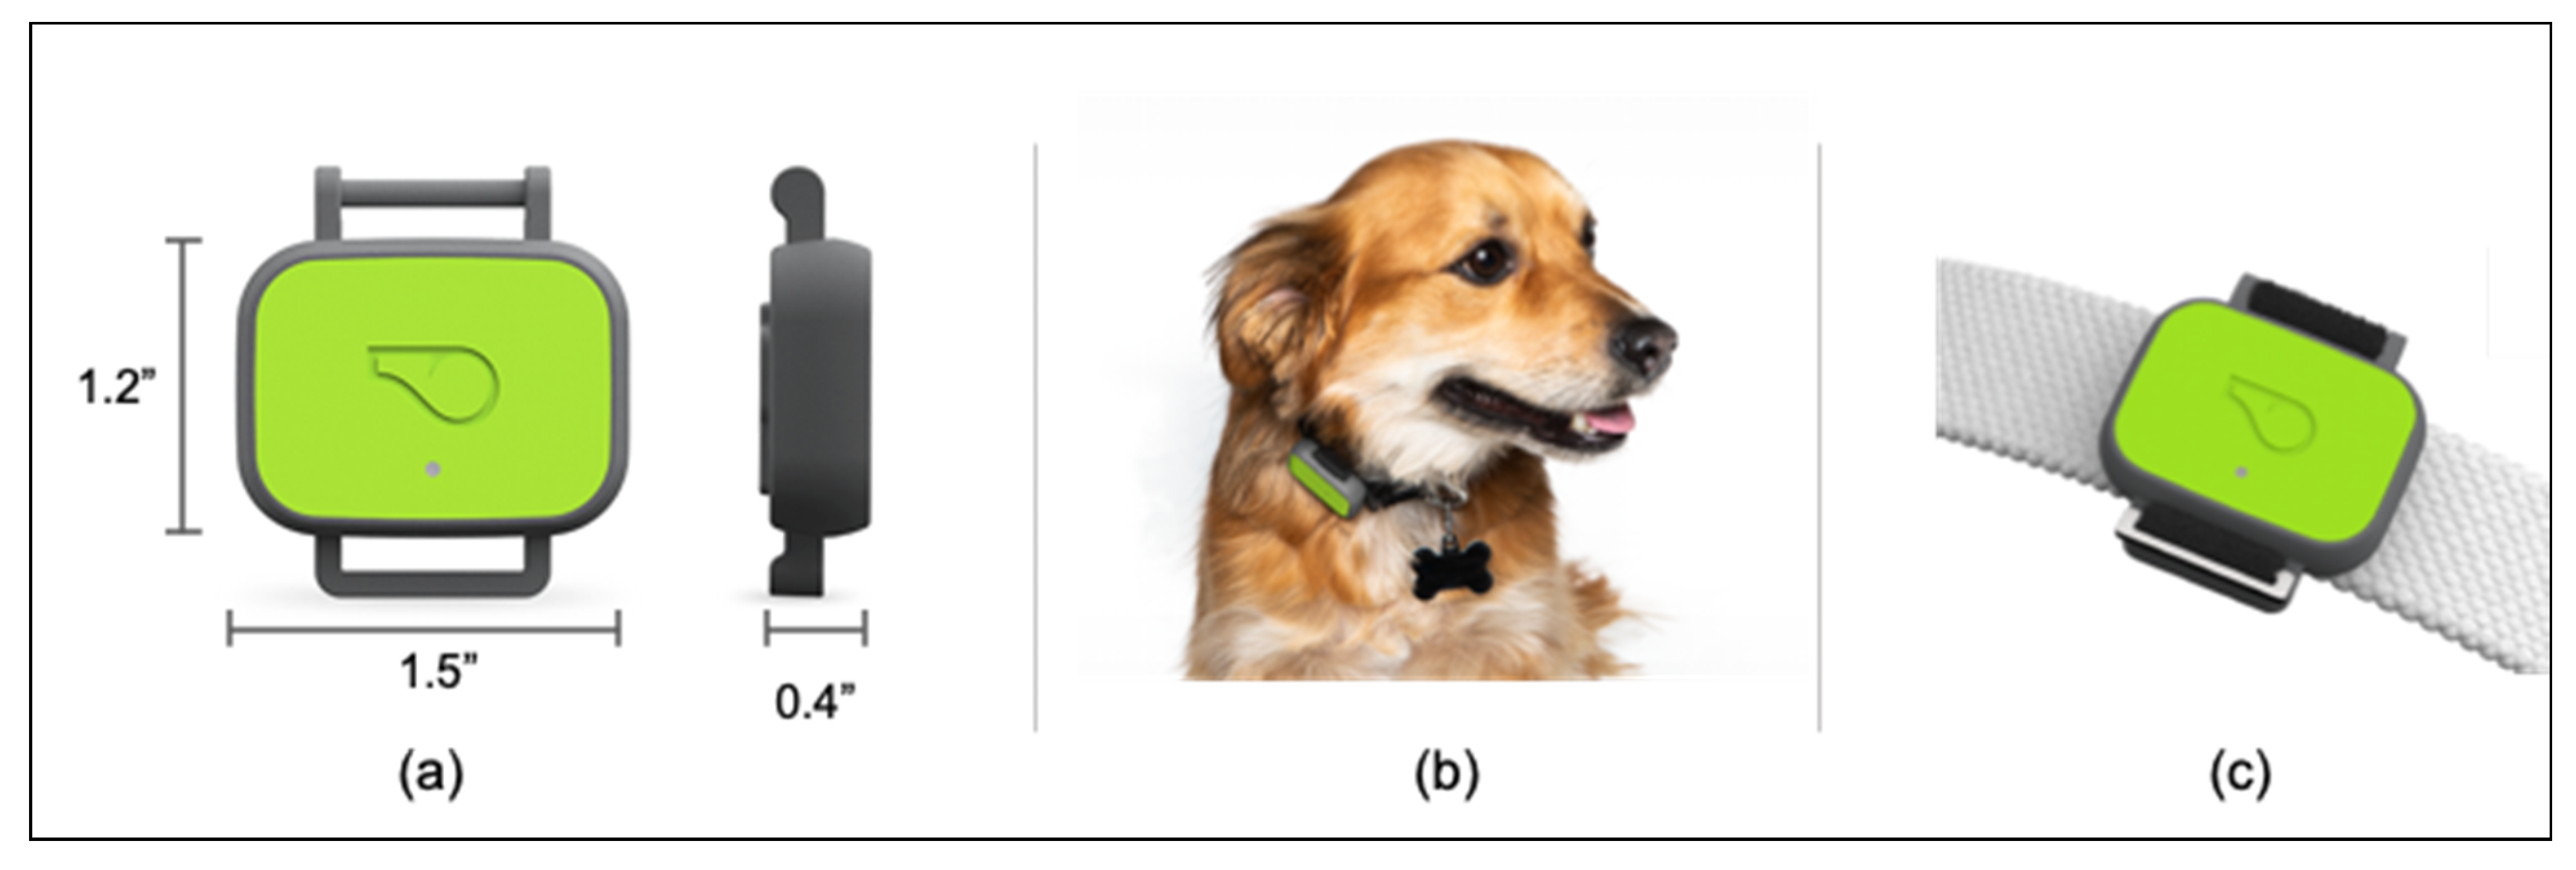
2.1. Activity Monitor
2.2. Accelerometry Data Collection
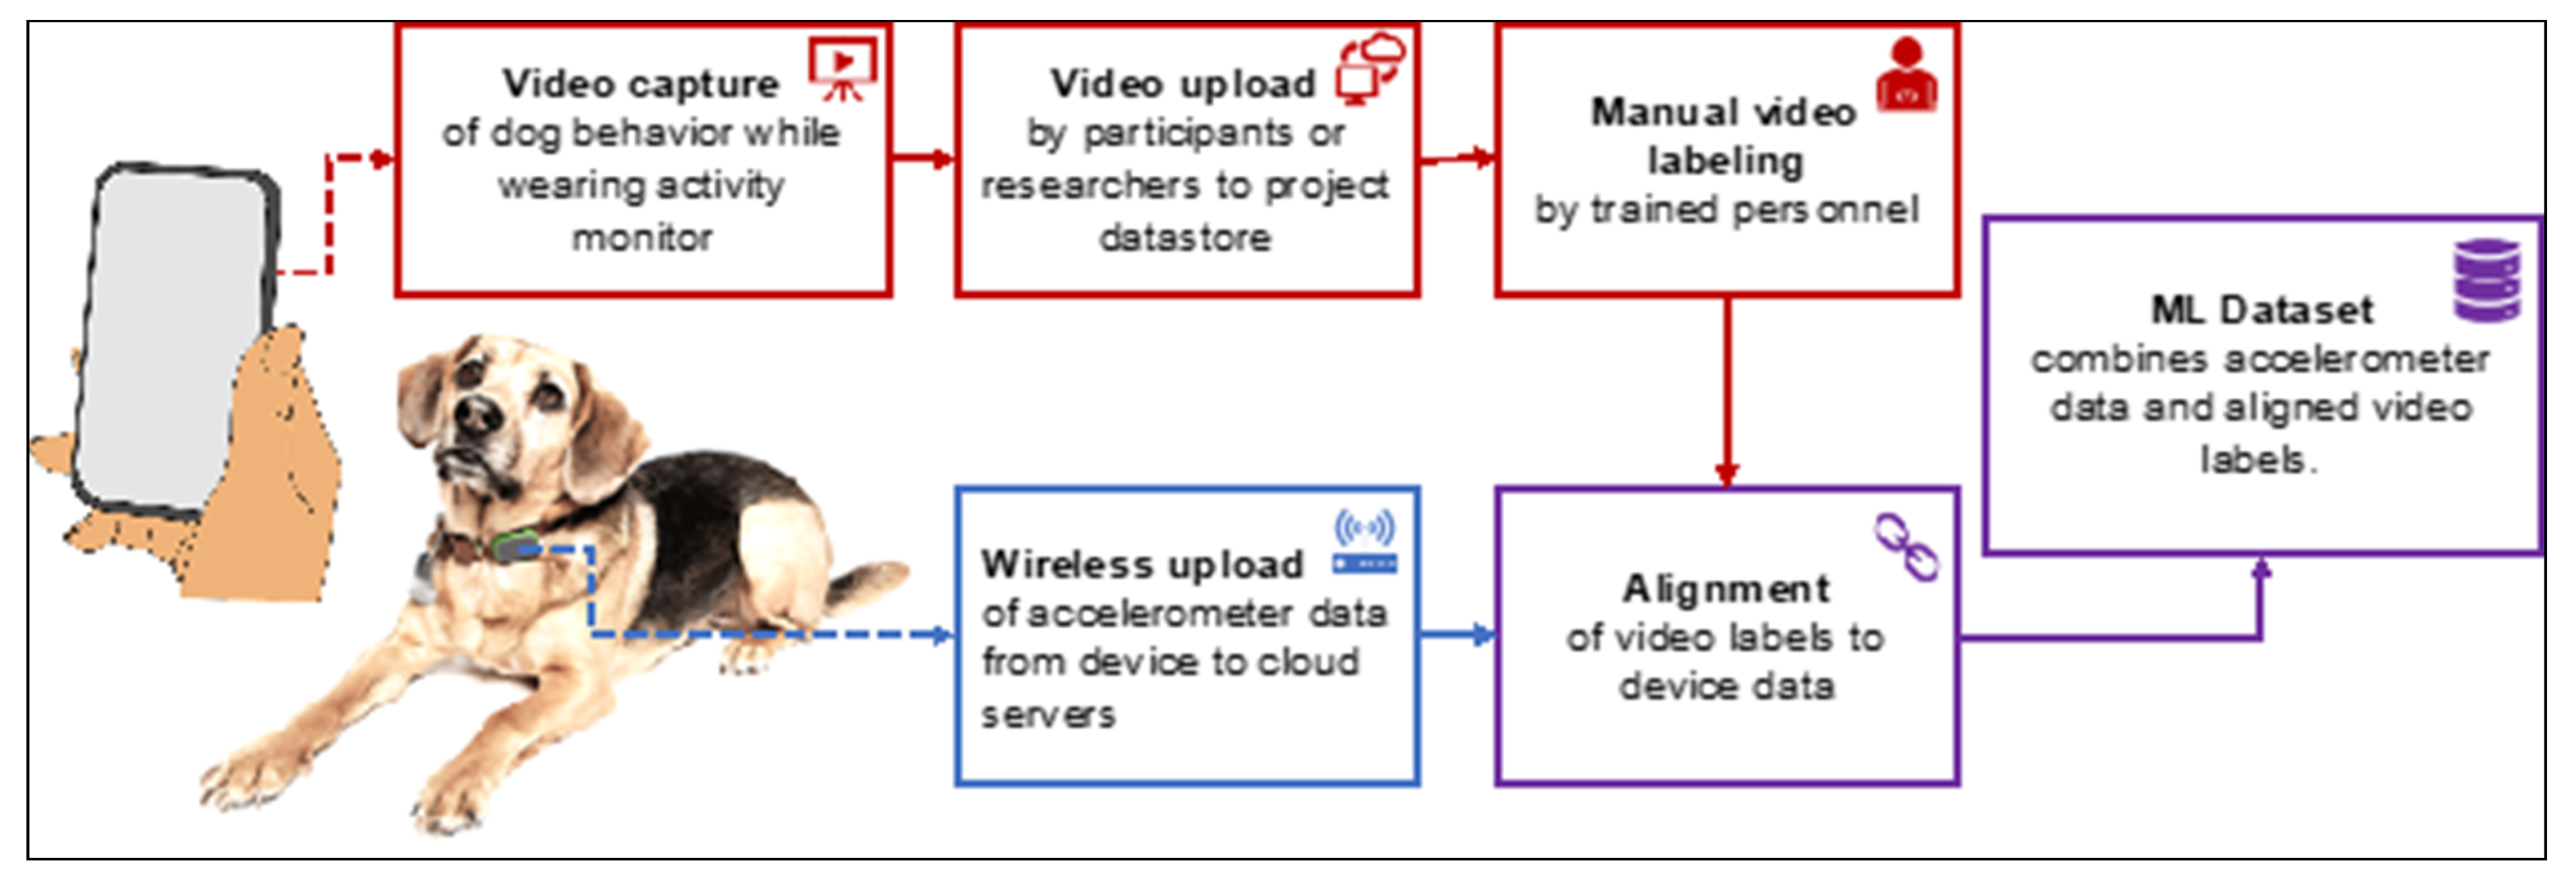
2.3. Animal Behavior Data Collection
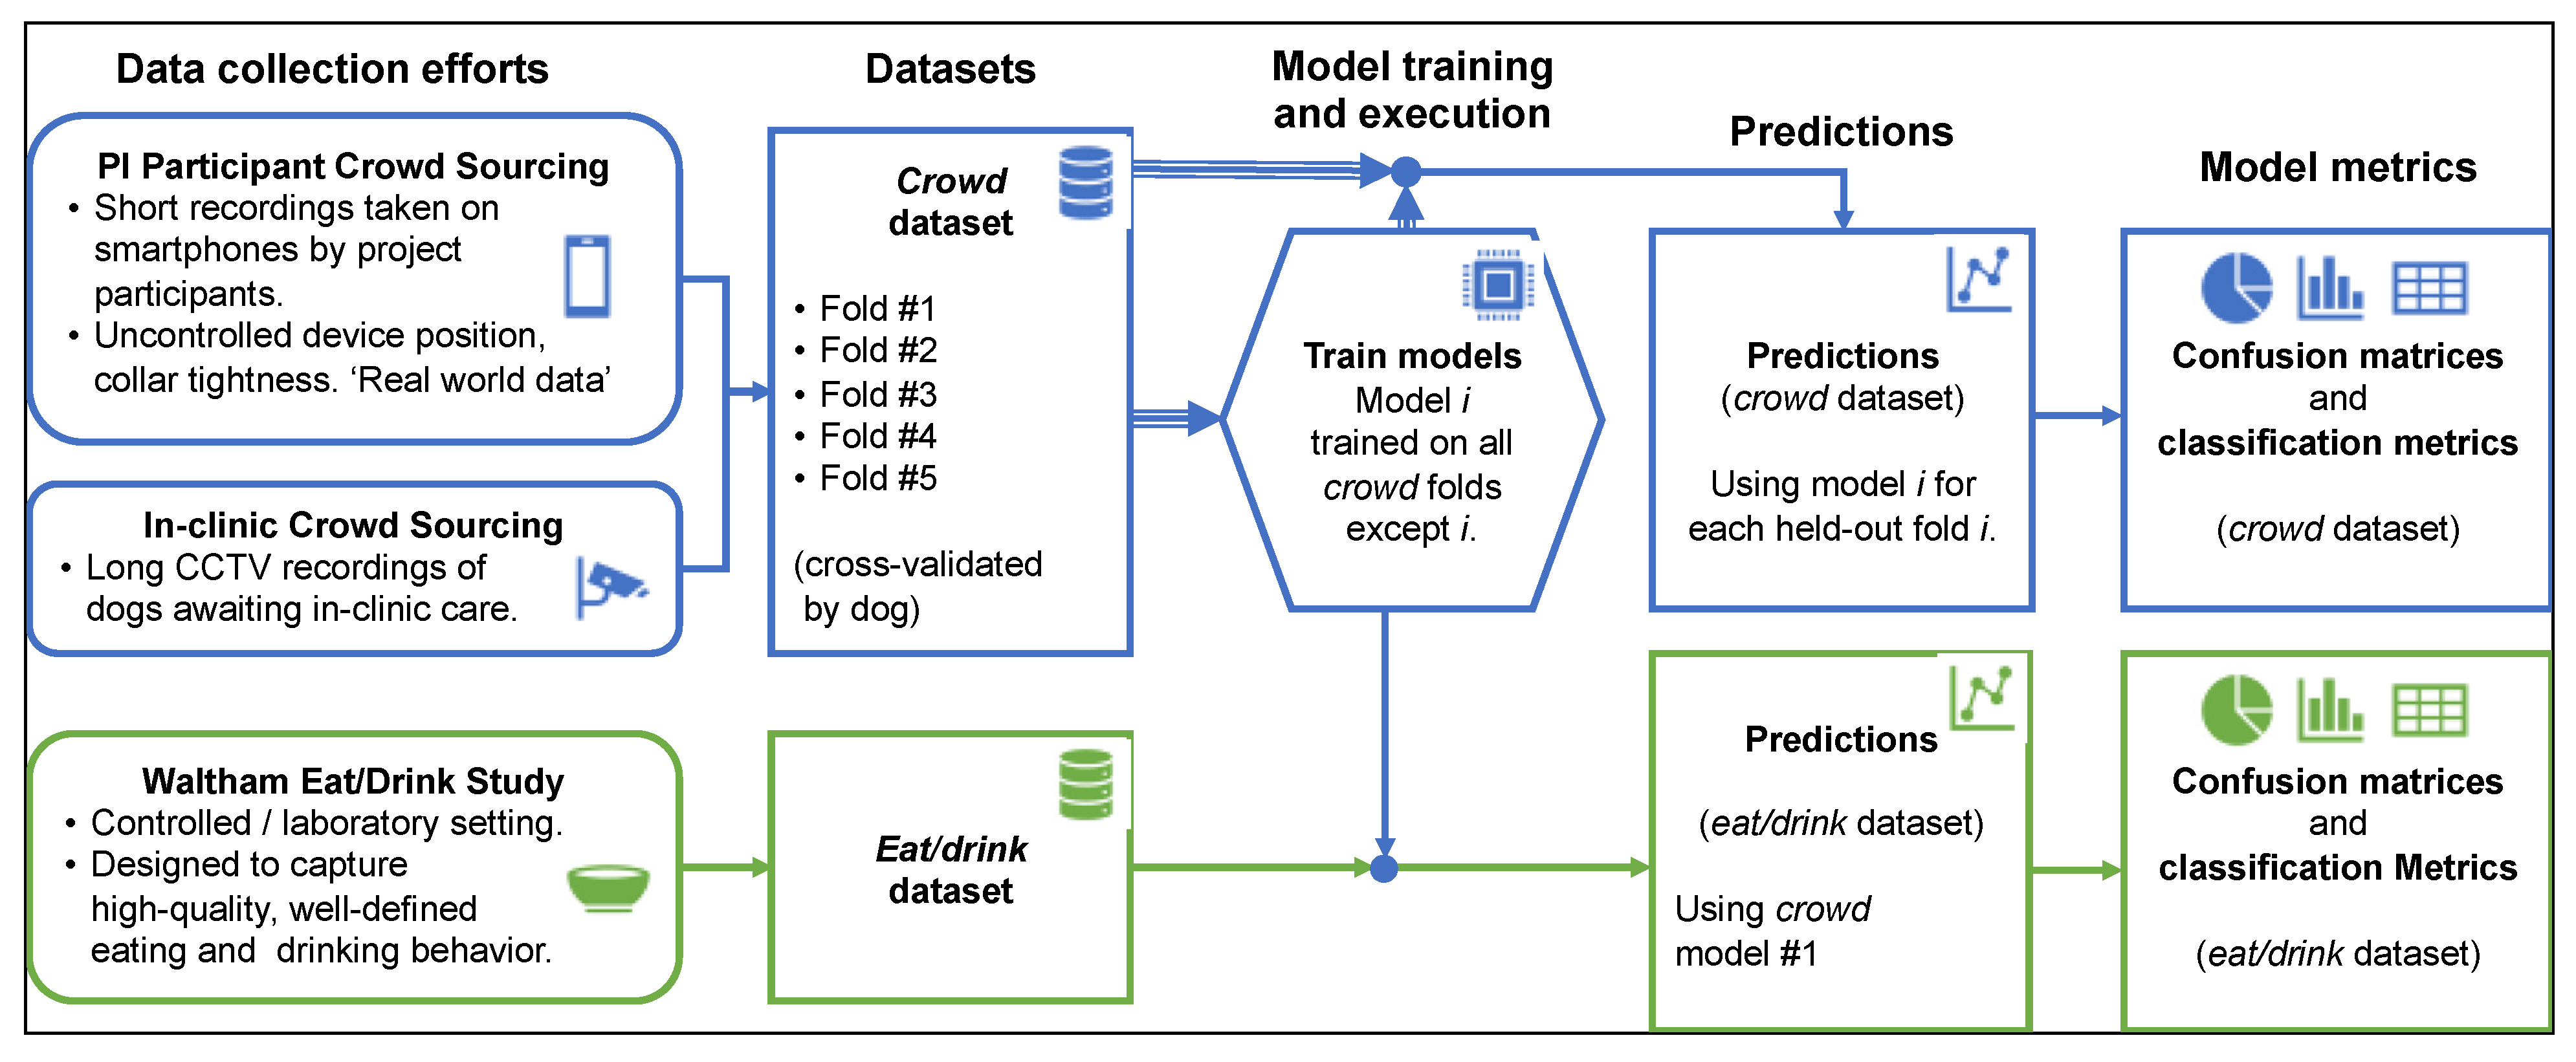
- Crowd-sourced (crowd) dataset. This dataset contained both (a) long (multi-hour) in-clinic recordings, as well as (b) shorter recordings submitted by project participants. This large and diverse dataset was meant to reflect real-world usage as accurately as possible.
- Eating and drinking (eat/drink) dataset. This dataset consisted of research grade sensor and data using a protocol designed to represent EAT and DRINK behaviors. Other observed behaviors were incidental.
2.4. Eat/Drink Study Protocol
2.5. Crowd-Sourcing Protocol
2.6. In-Clinic Observational Protocol
2.7. Video Labeling
2.8. Training Data Preparation
- Selecting appropriate videos from our database.
- Limiting the number of entries per dog to 30 (some dogs are overrepresented in our database).
- Allocating all of each dog’s data into one of 5 disjoint cross-validation folds.
- Downloading each dataset and labeling each time-point with a posture and/or behavior(s).
2.9. Deep Learning Classifier
2.10. Evaluation
2.11. User Validation
3. Results
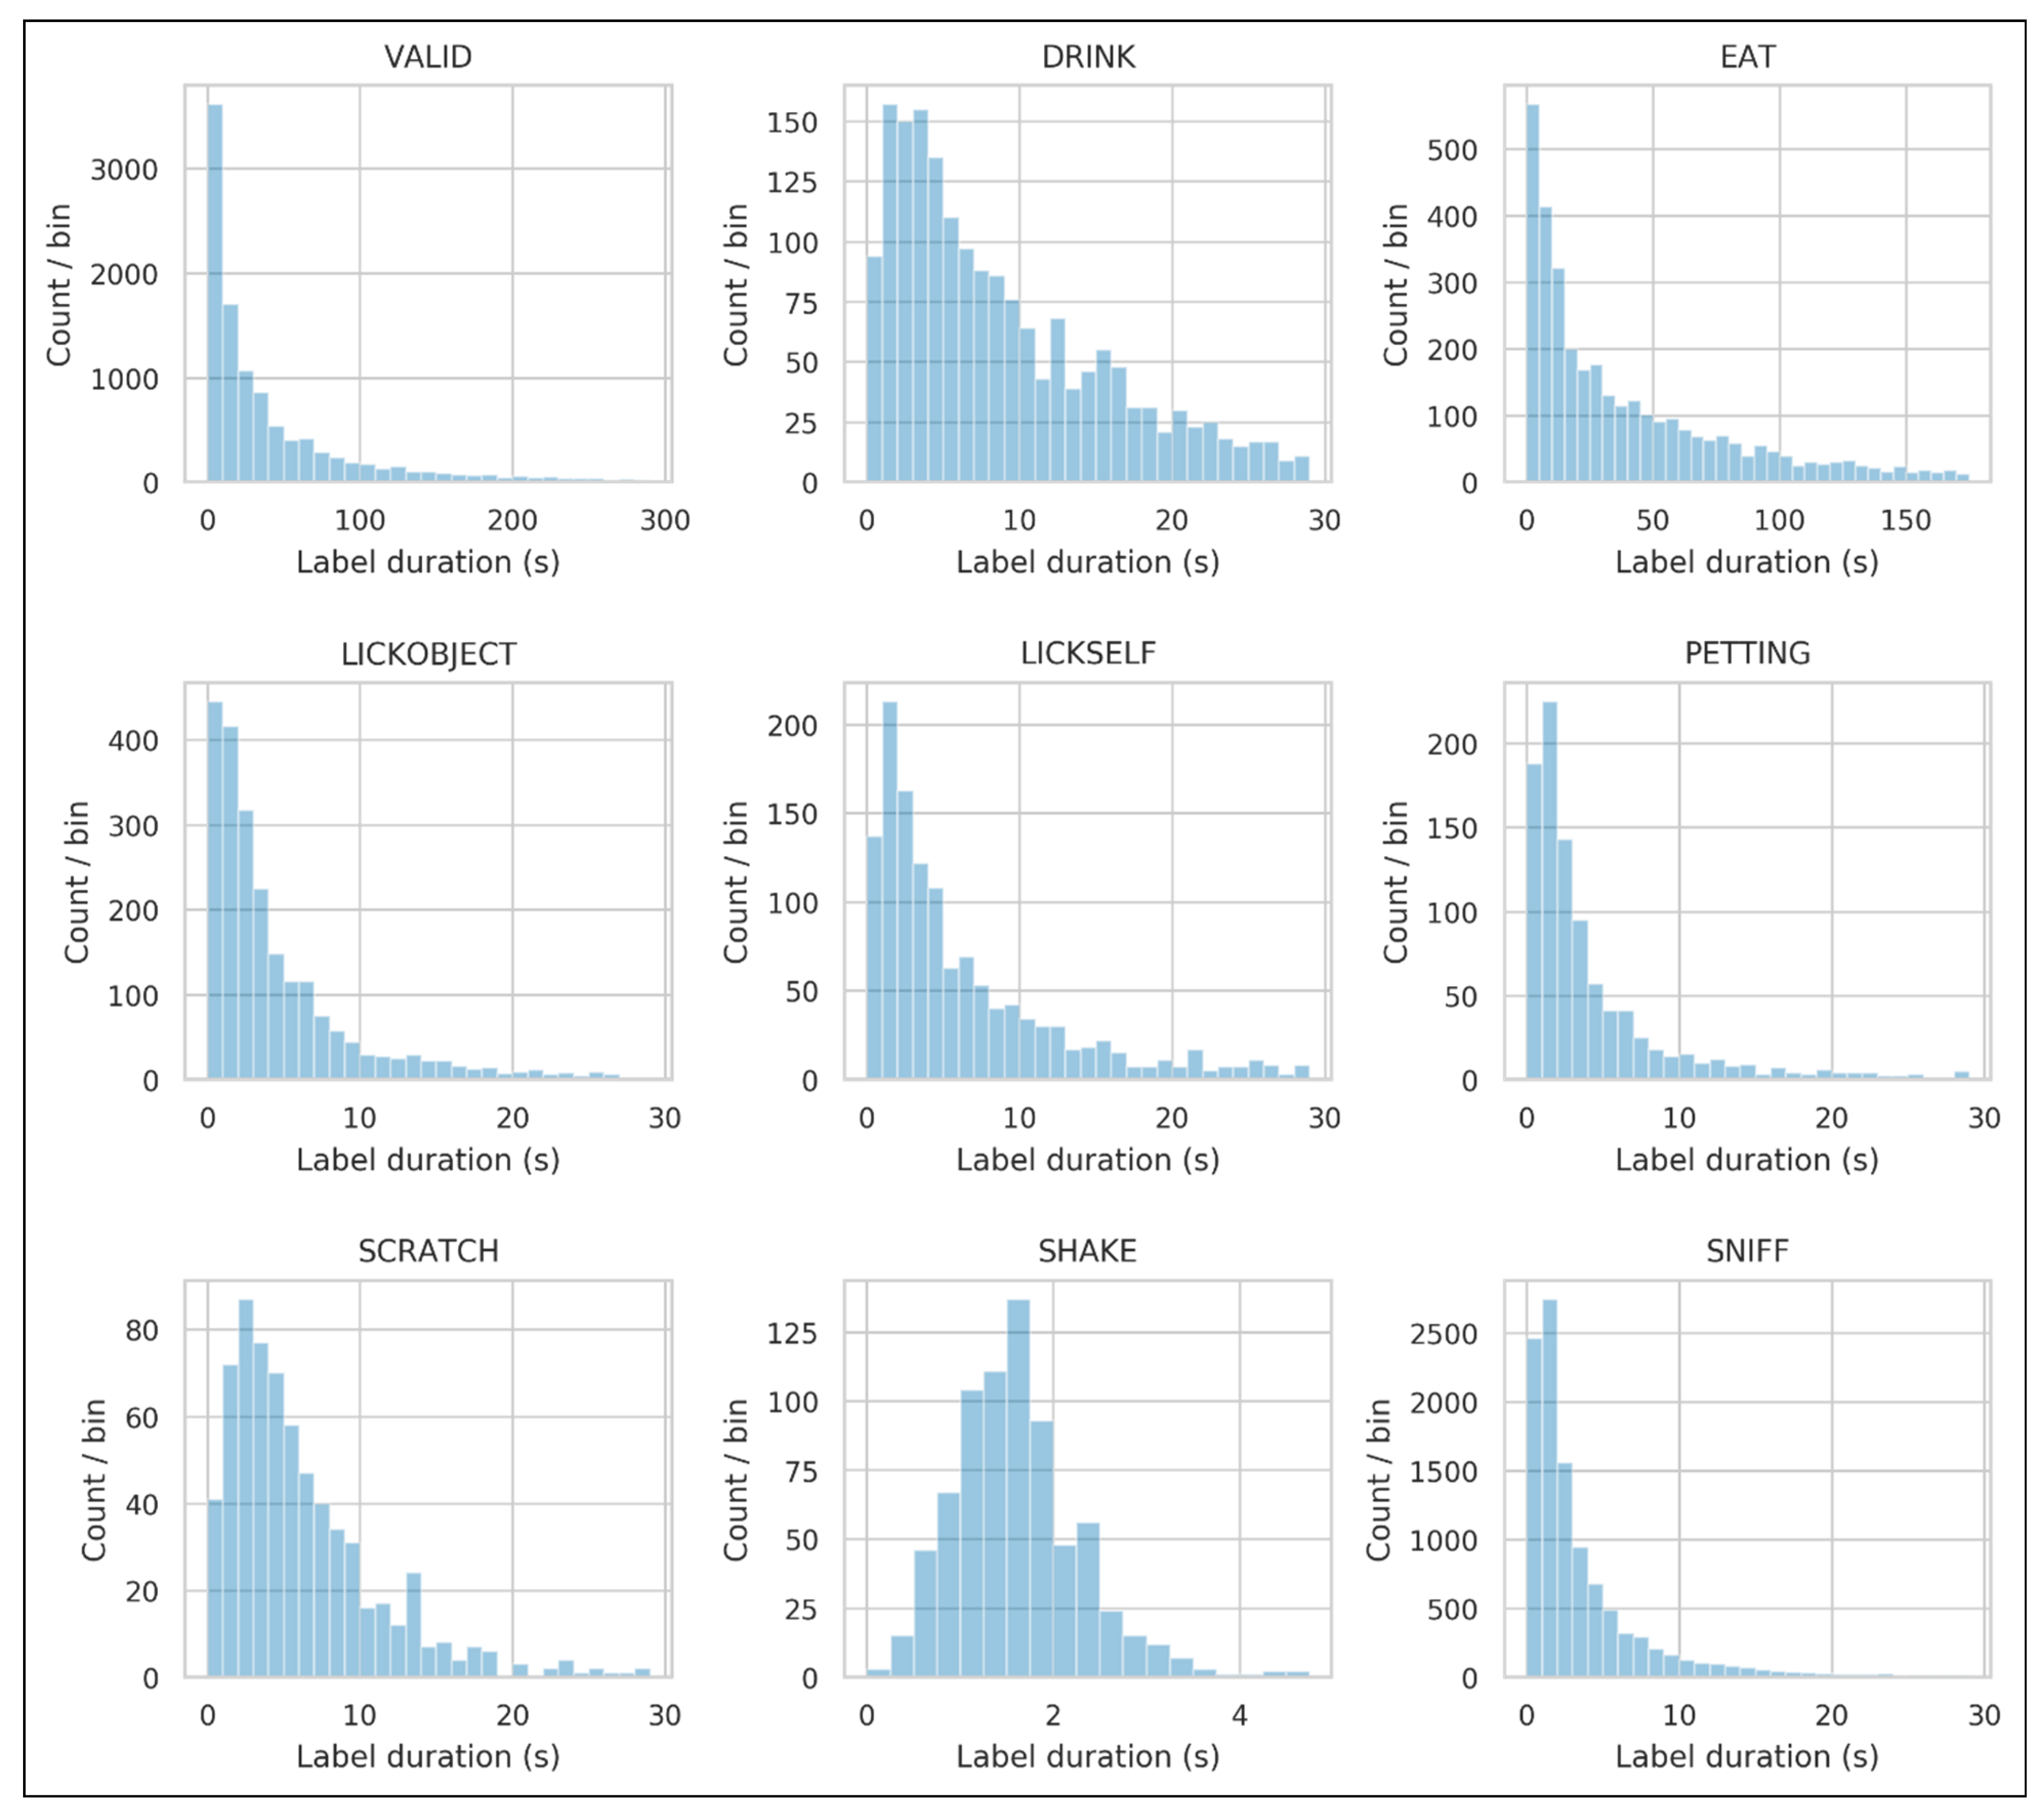
3.1. Data Collected
3.2. Classification Accuracy
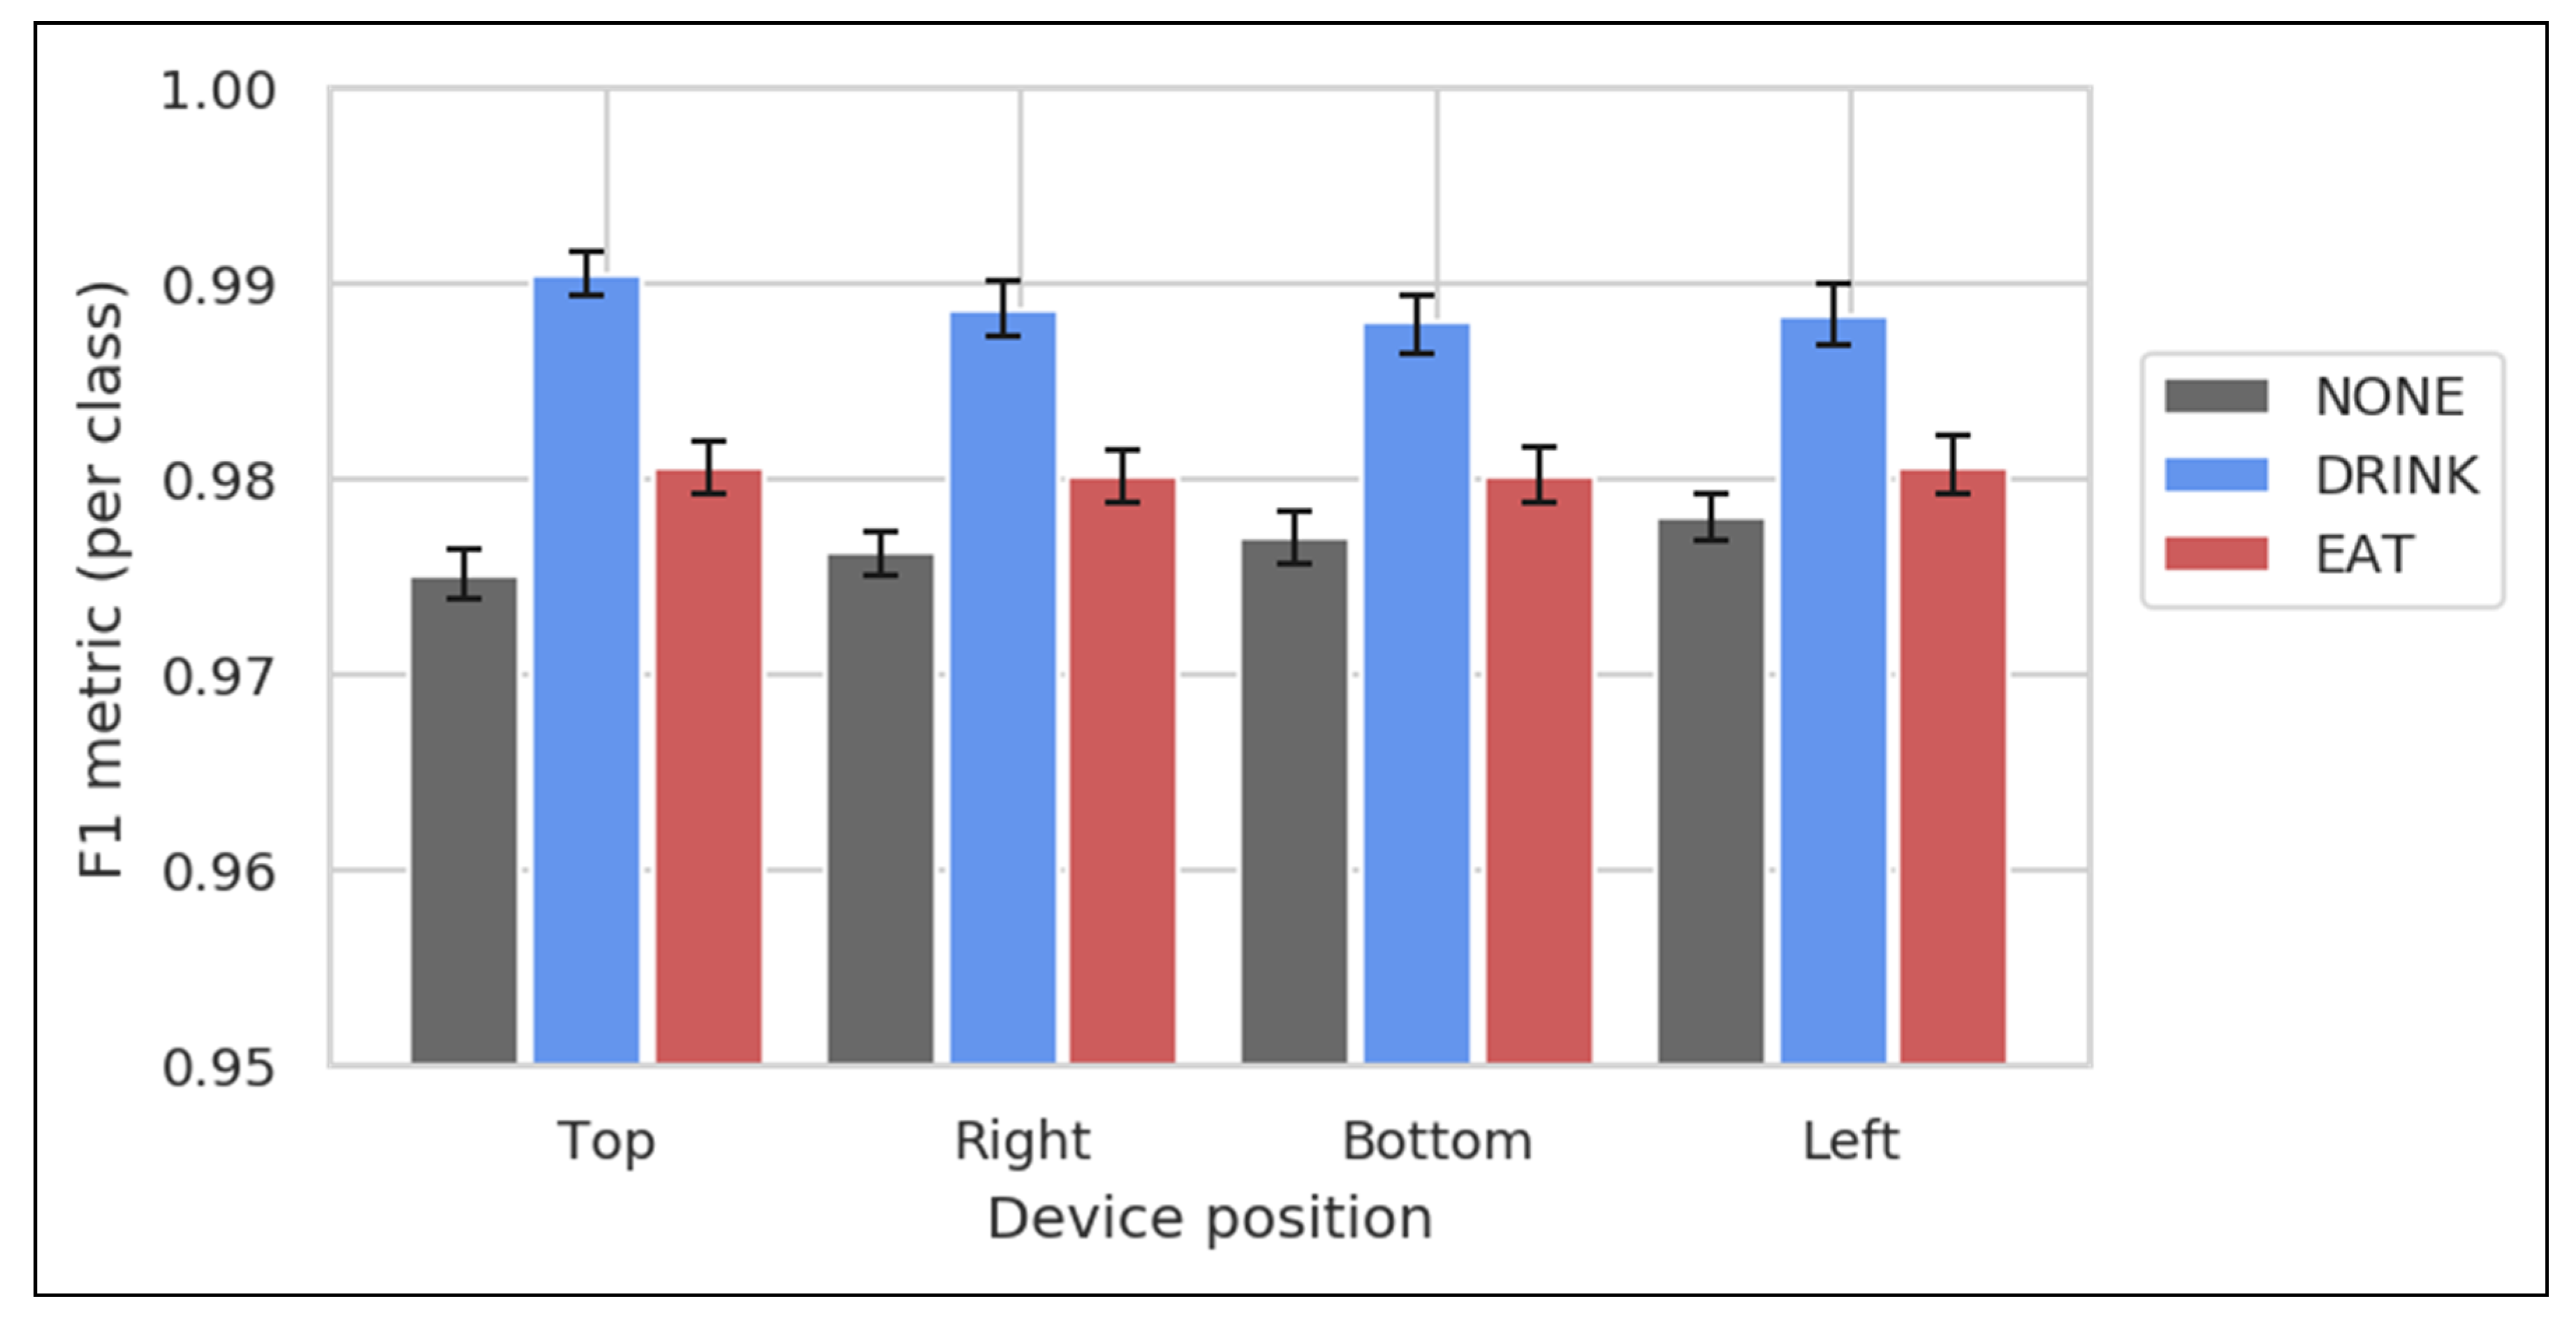
3.3. Effect of Device Position on Performance
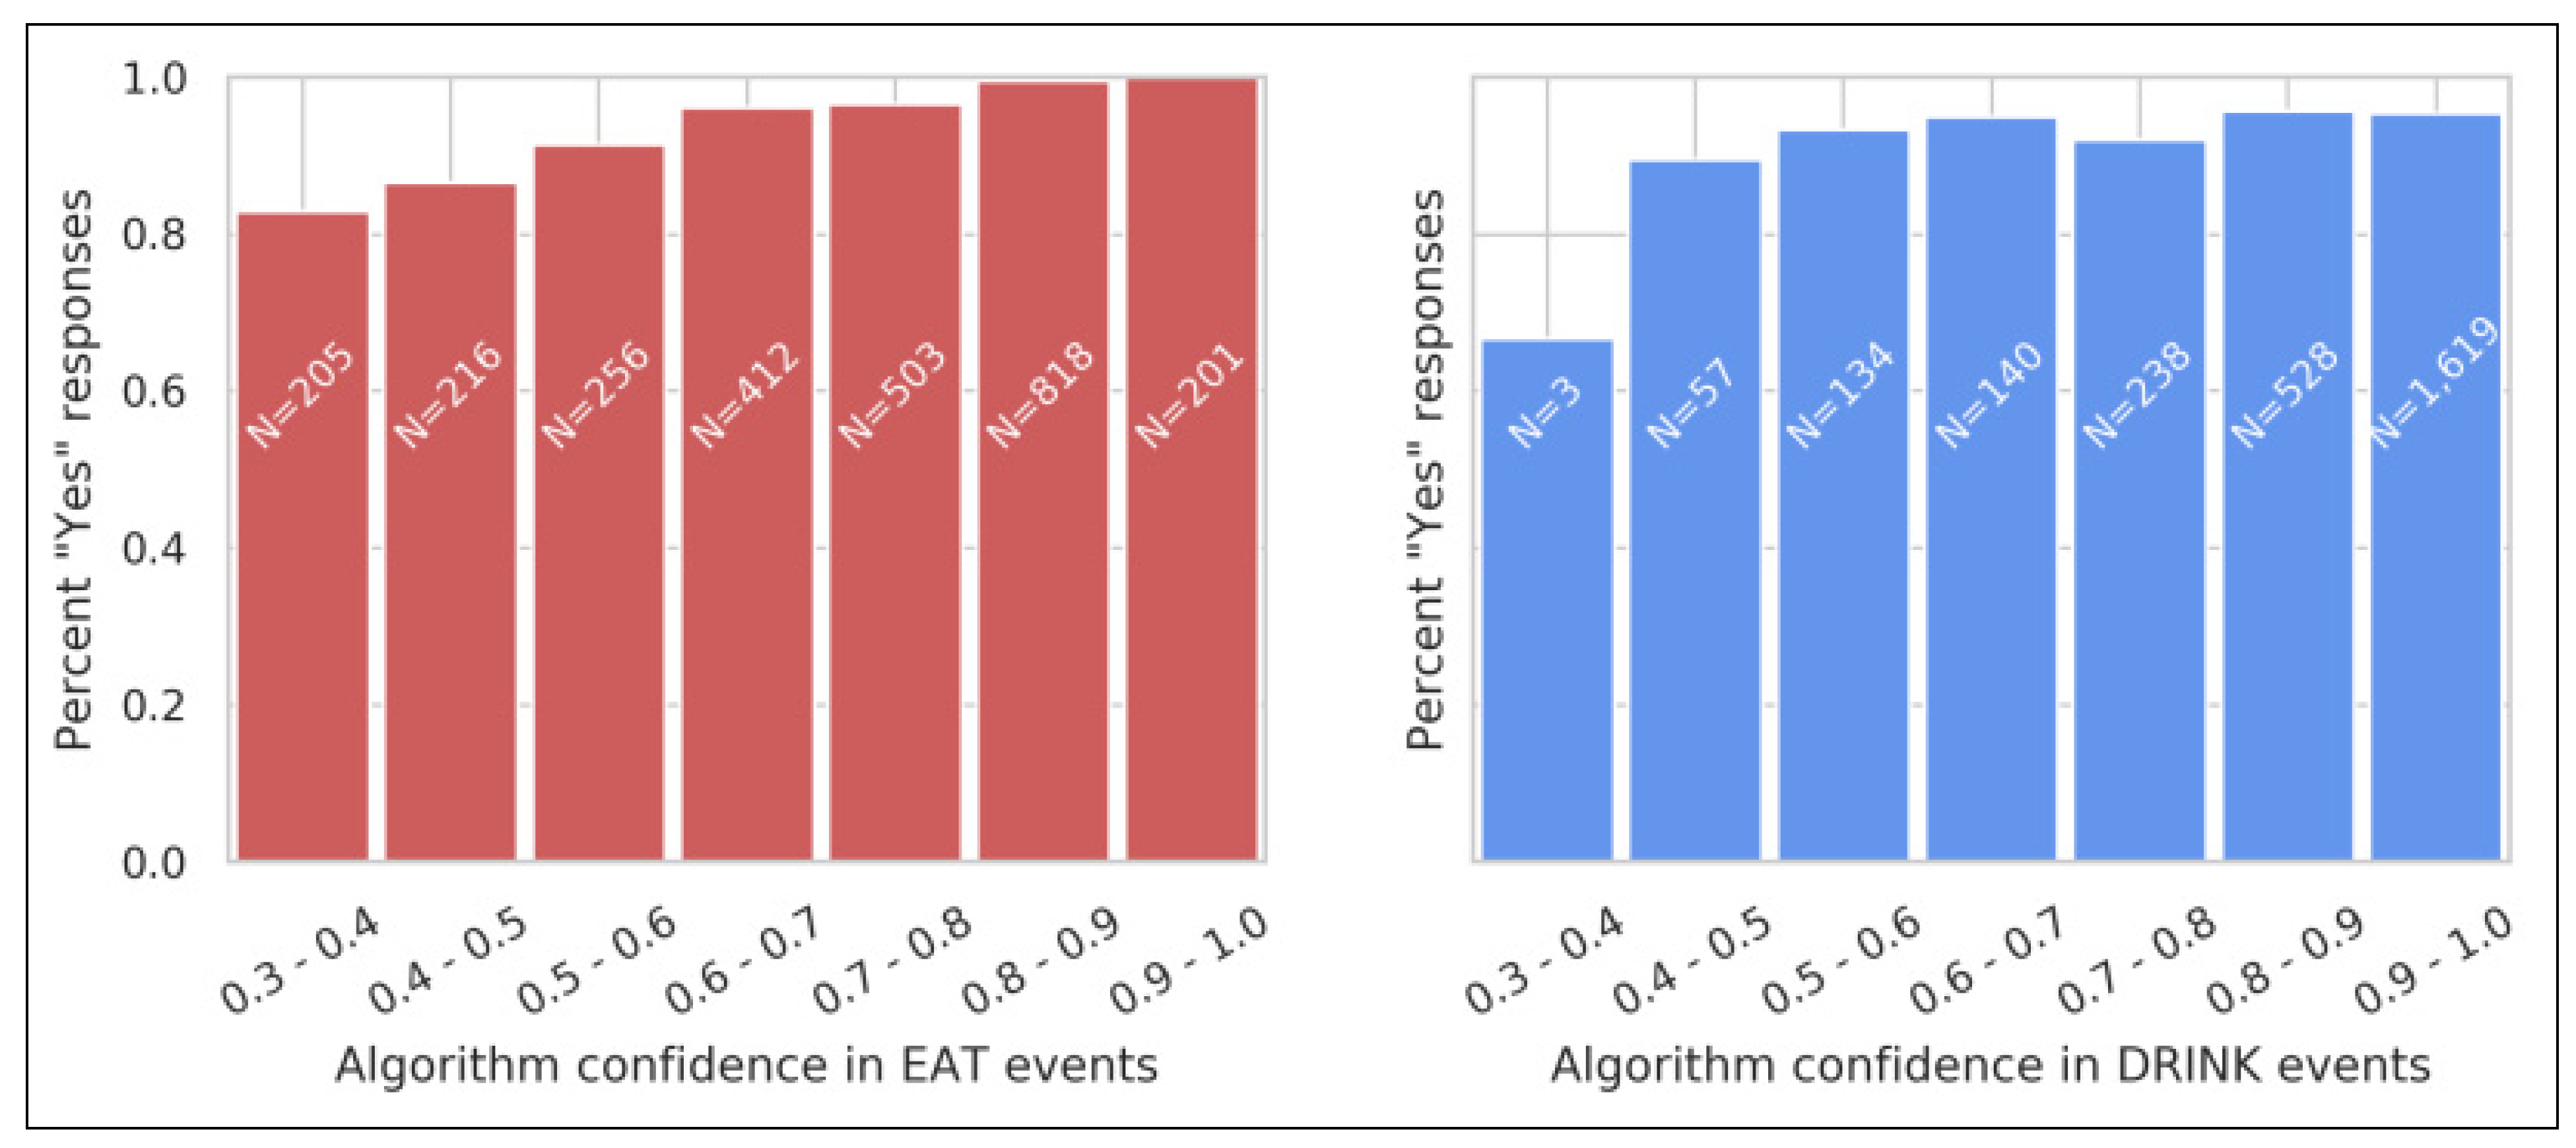
3.4. User Validation
4. Discussion
4.1. Comparison with Previous Work
- Class distribution. Each dataset exhibits a different distribution of behaviors. In general, classifiers exhibit better F1 scores for common behaviors than for rare behaviors. The classifier sensitivity and specificity are relatively insensitive to this distribution, so we recommend using these metrics for comparing performance across different datasets.
- Dataset collection methods. Classifiers are more accurate when applied to high-quality datasets collected under controlled conditions. Accuracy can drop substantially in naturalistic versus laboratory settings [26,27]. Classifiers benefit from consistent device position, device attachment, and collar tightness, and they also benefit when the labeled behaviors as well as the collection environment are consistent and well-defined.
4.2. Challenges
5. Conclusions
Supplementary Materials
Author Contributions
Funding
Institutional Review Board Statement
Data Availability Statement
Acknowledgments
Conflicts of Interest
References
- Pewek, L.; Ellis, D.A.; Andrews, S.; Joinson, A. The rise of consumer health wearables: Promises and barriers. PLoS Med. 2016, 13, e1001953. [Google Scholar] [CrossRef]
- Vogenberg, F.R.; Santilli, J. Healthcare trends for 2018. Am. Health Drug Benefits 2018, 11, 48–54. [Google Scholar]
- Tison, G.H.; Sanchez, J.M.; Ballinger, B.; Singh, A.; Olgin, J.E.; Pletcher, M.J.; Vittinghoff, E.; Lee, E.S.; Fan, S.M.; Gladstone, R.A.; et al. Passive detection of atrial fibrillation using a commercially available smartwatch. 2018. JAMA Cardiol. 2018, 3, 409–416. [Google Scholar] [CrossRef]
- Pramanik, P.K.D.; Upadhyaya, B.K.; Pal, S.; Pal, T. Internet of things, smart sensors, and pervasive systems: Enabling connected and pervasive healthcare. In Healthcare Data Analytics and Management; Dey, N., Ashour, A.S., Bhatt, C., James Fong, S., Eds.; Academic Press: Cambridge, MA, USA, 2019; pp. 1–58. [Google Scholar] [CrossRef]
- Watson, K.; Wells, J.; Sharma, M.; Robertson, S.; Dascanio, J.; Johnson, J.W.; Davis, R.E.; Nahar, V.K. A survey of knowledge and use of telehealth among veterinarians. BMC Vet. Res. 2019, 15, 474. [Google Scholar] [CrossRef]
- Pacis, D.M.M.; Subido, E.D.C.; Bugtai, N.T. Trends in telemedicine utilizing artificial intelligence. AIP Conf. Proc. 2018, 1933, 040009. [Google Scholar] [CrossRef]
- Kour, H.; Patison, K.P.; Corbet, N.J.; Swain, D.L. Validation of accelerometer use to measure suckling behaviour in Northern Australian beef calves. Appl. Anim. Behav. Sci. 2018, 202, 1–6. [Google Scholar] [CrossRef]
- den Uijl, I.; Gómez Álvarez, C.B.; Bartram, D.; Dror, Y.; Holland, R.; Cook, A. External validation of a collar-mounted triaxial accelerometer for second-by-second monitoring of eight behavioural states in dogs. PLoS ONE 2017, 12, e0188481. [Google Scholar] [CrossRef] [PubMed]
- Belda, B.; Enomoto, M.; Case, B.C.; Lascelles, B.D.X. Initial evaluation of PetPace activity monitor. Vet. J. 2018, 237, 63–68. [Google Scholar] [CrossRef] [PubMed]
- Weiss, G.M.; Nathan, A.; Kropp, J.B.; Lockhart, J.W. WagTag: A dog collar accessory for monitoring canine activity levels. In Proceedings of the 2013 ACM Conference on Pervasive and Ubiquitous Computing Adjunct Publication. UbiComp ’13 Adjunct, Zurich, Switzerland, 8–12 September 2013; ACM Press: New York, NY, USA, 2013; pp. 405–414. [Google Scholar] [CrossRef]
- Mejia, S.; Duerr, F.M.; Salman, M. Comparison of activity levels derived from two accelerometers in dogs with osteoarthritis: Implications for clinical trials. Vet. J. 2019, 252, 105355. [Google Scholar] [CrossRef] [PubMed]
- Westgarth, C.; Ladha, C. Evaluation of an open source method for calculating physical activity in dogs from harness and collar based sensors. BMC Vet. Res. 2017, 13, 322. [Google Scholar] [CrossRef] [PubMed]
- Hansen, B.D.; Lascelles, B.D.X.; Keene, B.W.; Adams, A.K.; Thomson, A.E. Evaluation of an accelerometer for at-home monitoring of spontaneous activity in dogs. Am. J. Vet. Res. 2007, 68, 468–475. [Google Scholar] [CrossRef] [PubMed]
- Hoffman, C.L.; Ladha, C.; Wilcox, S. An actigraphy-based comparison of shelter dog and owned dog activity patterns. J. Vet. Behav. 2019, 34, 30–36. [Google Scholar] [CrossRef]
- Kumpulainen, P.; Valldeoriola, A.; Somppi, S.; Törnqvist, H.; Väätäjä, H.; Majaranta, P.; Surakka, V.; Vainio, O.; Kujala, M.V.; Gizatdinova, Y.; et al. Dog activity classification with movement sensor placed on the collar. In Proceedings of the Fifth International Conference on Animal-Computer Interaction, Atlanta, GA, USA, 4–6 December 2018; Association for Computing Machinery: New York, NY, USA, 2018; pp. 1–6. [Google Scholar] [CrossRef]
- Brugarolas, R.; Loftin, R.T.; Yang, P.; Roberts, D.L.; Sherman, B.; Bozkurt, A. Behavior recognition based on machine learning algorithms for a wireless canine machine interface. In Proceedings of the 2013 IEEE International Conference on Body Sensor Networks, Cambridge, MA, USA, 6–9 May 2013; pp. 1–5. [Google Scholar] [CrossRef]
- Petrus, S.; Roux, L. Real-Time Behaviour Classification Techniques in Low-Power Animal Borne Sensor Applications. Ph.D. Thesis, Stellenbosch University, Stellenbosch, South Africa, 2019. Available online: https://scholar.sun.ac.za:443/handle/10019.1/105744 (accessed on 10 January 2020).
- den Uijl, I.; Gomez-Alvarez, C.; Dror, Y.; Manning, N.; Bartram, D.; Cook, A. Validation of a Collar-Mounted Accelerometer That Identifies Eight Canine Behavioural States, including Those with Dermatologic Significance; British Veterinary Dermatology Study Group: Weybridge, UK, 2016; pp. 81–84. [Google Scholar]
- Griffies, J.D.; Zutty, J.; Sarzen, M.; Soorholtz, S. Wearable sensor shown to specifically quantify pruritic behaviors in dogs. BMC Vet. Res. 2018, 14, 124. [Google Scholar] [CrossRef] [PubMed]
- Ladha, C.; Hammerla, N.; Hughes, E.; Olivier, P.; Ploetz, T. Dog’s life. In Proceedings of the 2013 ACM International Joint Conference on Pervasive and Ubiquitous Computing, Zurich, Switzerland, 8–12 September 2013; Available online: https://dl.acm.org/doi/abs/10.1145/2493432.2493519 (accessed on 10 January 2020).
- Kiyohara, T.; Orihara, R.; Sei, Y.; Tahara, Y.; Ohsuga, A. Activity recognition for dogs based on time-series data analysis. In Agents and Artificial Intelligence; Duval, B., van den Herik, J., Loiseau, S., Filipe, J., Eds.; Springer International Publishing: Cham, Switzerland, 2015; pp. 163–184. [Google Scholar] [CrossRef]
- Nuttall, T.; McEwan, N. Objective measurement of pruritus in dogs: A preliminary study using activity monitors. Vet. Derm. 2006, 17, 348–351. [Google Scholar] [CrossRef] [PubMed]
- Plant, J.D. Correlation of observed nocturnal pruritus and actigraphy in dogs. Vet. Rec. 2008, 162, 624–625. [Google Scholar] [CrossRef]
- Morrison, R.; Penpraze, V.; Beber, A.; Reilly, J.J.; Yam, P.S. Associations between obesity and physical activity in dogs: A preliminary investigation. J. Small Anim. Pract. 2013, 54, 570–574. [Google Scholar] [CrossRef]
- Helm, J.; McBrearty, A.; Fontaine, S.; Morrison, R.; Yam, P. Use of accelerometry to investigate physical activity in dogs receiving chemotherapy. J. Small Anim. Pract. 2016, 57, 600–609. [Google Scholar] [CrossRef] [PubMed]
- Twomey, N.; Diethe, T.; Fafoutis, X.; Elsts, A.; McConville, R.; Flach, P.; Craddock, I. A comprehensive study of activity recognition using accelerometers. Informatics 2018, 5, 27. [Google Scholar] [CrossRef]
- Foerster, F.; Smeja, M.; Fahrenberg, J. Detection of posture and motion by accelerometry: A validation study in ambulatory monitoring. Comput. Hum. Behav. 1999, 15, 571–583. [Google Scholar] [CrossRef]
- Olsen, A.M.; Evans, R.B.; Duerr, F.M. Evaluation of accelerometer inter-device variability and collar placement in dogs. Vet. Evid. 2016, 1, 2–9. [Google Scholar] [CrossRef]
- Martin, K.W.; Olsen, A.M.; Duncan, C.G.; Duerr, F.M. The method of attachment influences accelerometer-based activity data in dogs. BMC Vet. Res. 2017, 13, 48. [Google Scholar] [CrossRef]
- Aich, S.; Chakrabort, S.; Sim, J.-S.; Jang, D.-J.; Kim, H.-C. The design of an automated system for the analysis of the activity and emotional patterns of dogs with wearable sensors using machine learning. Appl. Sci. 2019, 9, 4938. [Google Scholar] [CrossRef]
- Pet Insight Project. Available online: https://www.petinsight.co (accessed on 16 December 2019).
- Chambers, R.D.; Yoder, N.C. FilterNet: A many-to-many deep learning architecture for time series classification. Sensors 2020, 20, 2498. [Google Scholar] [CrossRef] [PubMed]
- Friard, O.; Gamba, M. BORIS: A free, versatile open-source event-logging software for video/audio coding and live observations. Methods Ecol. Evol. 2016, 7, 1325–1330. [Google Scholar] [CrossRef]
- Hammerla, N.Y.; Plötz, T. Let’s (not) stick together: Pairwise similarity biases cross-validation in activity recognition. In Proceedings of the 2015 ACM International Joint Conference on Pervasive and Ubiquitous Computing, Osaka, Japan, 7–11 September 2015; Association for Computing Machinery: New York, NY, USA, 2015; pp. 1041–1051. [Google Scholar] [CrossRef]
- Gerencsér, L.; Vásárhelyi, G.; Nagy, M.; Vicsek, T.; Miklósi, A. Identification of behaviour in freely moving dogs (Canis familiaris) using inertial sensors. PLoS ONE 2013, 8, e77814. [Google Scholar] [CrossRef] [PubMed]
- Paszke, A.; Gross, S.; Massa, F.; Lerer, A.; Bradbury, J.; Chanan, G.; Killeen, T.; Lin, Z.; Gimelshein, N.; Antiga, L.; et al. PyTorch: An imperative style, high-performance deep learning library. In Advances in Neural Information Processing Systems 32; Wallach, H., Larochelle, H., Beygelzimer, A., Alché-Buc, F., Fox, E., Garnett, R., Eds.; Curran Associates, Inc: New York, NY, USA, 2019; pp. 8024–8035. Available online: http://papers.nips.cc/paper/9015-pytorch-an-imperative-style-high-performance-deep-learning-library.pdf (accessed on 6 December 2019).
- Amazon EC2-P2 Instances. Amazon Web Services, Inc. Available online: https://aws.amazon.com/ec2/instance-types/p2/ (accessed on 6 December 2019).
- Haghighi, S.; Jasemi, M.; Hessabi, S.; Zolanvari, A. PyCM: Multiclass confusion matrix library in Python. JOSS 2018, 3, 729. [Google Scholar] [CrossRef]
- Steyerberg, E. Clinical Prediction Models: A Practical Approach to Development, Validation, and Updating; Springer: New York, NY, USA, 2009. [Google Scholar] [CrossRef]


| Dataset | Protocol Name | Location | Description |
|---|---|---|---|
| Crowd | In-Clinic Crowd-Sourcing | Banfield Pet Hospital clinics | Dogs that were awaiting in-clinic care were outfitted with activity monitors and were video recorded for several hours each performing typical in-kennel behaviors. |
| PI Participant Crowd-Sourcing | Multi-source: For instance, at-home, in-car, during walks and hikes. | Participants in the Pet Insight Project used smartphones to video record their dogs while wearing activity monitors in every-day situations. Collar fit, device orientation, environment, and animal behavior were meant to be representative of real-world usage. | |
| Eat/drink | Waltham Eat/Drink Study | WALTHAM Petcare Science Institute | Dogs were video recorded eating and drinking by researchers at the WALTHAM Petcare Science Institute. Collar fit and orientation were controlled, and dog behaviors exhibited were relatively consistent. |
| Posture | Activity |
|---|---|
| LIE DOWN | Lying down. |
| SIT | Sitting still with little to no movement |
| STAND | Standing still with little to no movement. |
| WALK | Purposeful walking from one point to another. |
| VIGOROUS | Catch-all for high-energy activities such as running, swimming, and playing. |
| MIXED | Default category for any other posture, for ambiguous postures, and for postures that are difficult to label due to rapid changes. |
| Behavior | Activity |
|---|---|
| DRINK | Drinking water. |
| EAT | Eating food, as in out of a bowl. Does not include chewing bones or toys. |
| LICKOBJECT | Licking an object other than self, such as a person or empty bowl. |
| LICKSELF | Self-licking, often due to pain, soreness, pruritis, or trying to clear a foreign object. |
| PETTING | Being pet by a human. |
| RUBBING | Rubbing face or body on an object or person due to pruritis. |
| SCRATCH | Scratching of the body, neck, or head with a hind leg. |
| SHAKE | Shaking head and body, as in when wet. Does not include head-shaking that is clearly due to ear discomfort, which is labeled separately and has not been included in this report. |
| SNIFF | Sniffing the ground, the air, a person or other pet |
| NONE | ‘Default’ class indicating that no labeled behavior is happening. |
| Breed | Crowd | Eat/Drink |
|---|---|---|
| Mixed | 923 | 0 |
| Unknown/Other | 413 | 0 |
| Beagle | 38 | 18 |
| Boxer | 26 | 0 |
| Bulldog | 44 | 0 |
| Collie | 23 | 0 |
| Great Dane | 25 | 0 |
| Hunting dog | 43 | 0 |
| Norfolk Terrier | 0 | 14 |
| Petit Basset Griffon Vendéen | 0 | 17 |
| Pug | 39 | 0 |
| Retriever | 128 | 72 |
| Shepherd | 68 | 0 |
| Sled dog | 44 | 0 |
| Small dog | 189 | 0 |
| Spaniel | 20 | 0 |
| Yorkshire Terrier | 195 | 17 |
| # Unique breeds | 338 | 0 |
| No. Valid Videos | Eat/Drink Dataset | Crowd Dataset | ||||||
|---|---|---|---|---|---|---|---|---|
| # Videos | # Labels | Mean Length (s) | Total Length (H:M:S) | # Videos | # Labels | Mean Length (s) | Total Length (H:M:S) | |
| 5367 | 10,529 | 56 | 163:51:46 | 262 | 409 | 188 | 21:26:15 | |
| Behaviors | ||||||||
| DRINK | 1072 | 1586 | 12.6 | 5:33:14 | 151 | 311 | 5 | 0:25:52 |
| EAT | 1484 | 3063 | 43.4 | 36:57:31 | 260 | 375 | 65 | 6:46:33 |
| LICKOBJECT | 897 | 2056 | 5.6 | 3:11:45 | 121 | 212 | 5.7 | 0:20:18 |
| LICKSELF | 464 | 1405 | 12.4 | 4:50:11 | 8 | 8 | 7.3 | 0:00:58 |
| SCRATCH | 416 | 679 | 6.8 | 1:16:41 | 4 | 5 | 4.0 | 0:00:20 |
| PETTING | 510 | 901 | 6.7 | 1:41:03 | 72 | 92 | 2.0 | 0:04:04 |
| RUBBING | 271 | 605 | 7.0 | 1:10:32 | 0 | 0 | 0 | 0:00:00 |
| SHAKE | 552 | 689 | 1.7 | 0:19:09 | 48 | 64 | 1.0 | 0:1:04 |
| SNIFF | 2668 | 9696 | 3.9 | 10:31:56 | 241 | 1082 | 5.0 | 1:36:46 |
| Postures | ||||||||
| LIE DOWN | 1340 | 2407 | 65.7 | 43:56:24 | 10 | 11 | 58.8 | 0:10:46 |
| MIXED | 4072 | 11,538 | 9.9 | 31:49:27 | 261 | 1492 | 30.0 | 12:44:22 |
| VIGOROUS | 633 | 1968 | 8.7 | 4:45:24 | 15 | 24 | 6.9 | 0:02:44 |
| SIT | 1500 | 2784 | 19.8 | 15:18:20 | 136 | 263 | 21.0 | 1:32:42 |
| STAND | 3725 | 9090 | 22.5 | 56:44:37 | 234 | 1294 | 19.0 | 6:55:51 |
| WALK | 1255 | 4101 | 9.9 | 11:16:34 | 5 | 21 | 6.0 | 0:02:06 |
| Behavior | # Dogs | # Videos | Prevalence (Support) | Sensitivity (Recall) | Specificity | Accuracy | Precision (PPV) | F1 Score |
|---|---|---|---|---|---|---|---|---|
| Behavior | ||||||||
| DRINK | 752 | 1019 | 3.9% | 0.874 | 0.995 | 0.99 | 0.870 | 0.872 |
| EAT | 1101 | 1442 | 28% | 0.902 | 0.967 | 0.948 | 0.915 | 0.908 |
| LICKOBJECT | 460 | 629 | 1.8% | 0.410 | 0.990 | 0.98 | 0.439 | 0.424 |
| LICKSELF | 257 | 398 | 3.4% | 0.772 | 0.990 | 0.982 | 0.728 | 0.749 |
| PETTING | 204 | 307 | 0.96% | 0.305 | 0.991 | 0.984 | 0.237 | 0.267 |
| RUBBING | 158 | 235 | 0.73% | 0.729 | 0.996 | 0.994 | 0.584 | 0.648 |
| SCRATCH | 158 | 303 | 0.60% | 0.870 | 0.997 | 0.997 | 0.676 | 0.761 |
| SHAKE | 251 | 435 | 0.13% | 0.916 | 1.00 | 1.00 | 0.795 | 0.851 |
| SNIFF | 946 | 1747 | 5.3% | 0.610 | 0.968 | 0.949 | 0.517 | 0.559 |
| NONE | 2051 | 4636 | 55% | 0.892 | 0.898 | 0.895 | 0.914 | 0.903 |
| Posture | ||||||||
| LIE DOWN | 674 | 1223 | 22% | 0.826 | 0.913 | 0.894 | 0.724 | 0.772 |
| SIT | 726 | 1275 | 9.9% | 0.409 | 0.915 | 0.865 | 0.347 | 0.375 |
| STAND | 2028 | 4241 | 58% | 0.793 | 0.900 | 0.838 | 0.916 | 0.850 |
| VIGOROUS | 289 | 468 | 2.9% | 0.764 | 0.985 | 0.978 | 0.605 | 0.675 |
| WALK | 599 | 905 | 7.7% | 0.903 | 0.969 | 0.964 | 0.706 | 0.793 |
| # Dogs | # Videos | Prevalence (Support) | Sensitivity (Recall) | Specificity | Accuracy | Precision (PPV) | F1 Score | |
|---|---|---|---|---|---|---|---|---|
| Behavior | ||||||||
| DRINK | 71 | 99 | 1.7% | 0.949 | 0.999 | 0.998 | 0.957 | 0.953 |
| EAT | 147 | 259 | 33% | 0.988 | 0.983 | 0.984 | 0.966 | 0.977 |
| LICKOBJECT | 70 | 95 | 1.6% | 0.658 | 0.998 | 0.992 | 0.821 | 0.731 |
| SNIFF | 142 | 231 | 5% | 0.780 | 0.981 | 0.971 | 0.681 | 0.728 |
| NONE | 149 | 262 | 58% | 0.959 | 0.968 | 0.963 | 0.977 | 0.968 |
| Posture | ||||||||
| SIT | 79 | 79 | 11% | 0.447 | 0.940 | 0.886 | 0.481 | 0.464 |
| STAND | 149 | 262 | 88% | 0.938 | 0.469 | 0.883 | 0.930 | 0.934 |
| Event | Users | Valid Responses | Confounders | ||
|---|---|---|---|---|---|
| Response | N | % | |||
| EAT | 1514 | Yes | 2488 | 95.3% | Drinking, vomiting/regurgitation, eating grass, licking (pan/bowl/self), chewing (bone/toy), playing. |
| No | 123 | 4.7% | |||
| DRINK | 1491 | Yes | 2579 | 94.9% | Eating, licking, sniffing, chewing (bone/toy), petting. |
| No | 140 | 5.1% | |||
| Reference | # Dogs | Prevalence (Support) | Sensitivity (Recall) 1 | Specificity 1 | Accuracy | Precision (PPV) | F1 Score | |
|---|---|---|---|---|---|---|---|---|
| crowd dataset (this study) | DRINK | 752 | 3.9% | 0.874 | 0.995 | 0.990 | 0.870 | 0.872 |
| EAT | 1101 | 28% | 0.902 | 0.967 | 0.948 | 0.915 | 0.908 | |
| LICKOBJECT | 460 | 1.8% | 0.410 | 0.990 | 0.980 | 0.439 | 0.424 | |
| LICKSELF | 257 | 3.4% | 0.772 | 0.990 | 0.982 | 0.728 | 0.749 | |
| PETTING | 204 | 0.96% | 0.305 | 0.991 | 0.984 | 0.237 | 0.267 | |
| RUBBING | 158 | 0.73% | 0.729 | 0.996 | 0.994 | 0.584 | 0.648 | |
| SCRATCH | 158 | 0.60% | 0.870 | 0.997 | 0.997 | 0.676 | 0.761 | |
| SHAKE | 251 | 0.13% | 0.916 | 1.000 | 1.000 | 0.795 | 0.851 | |
| SNIFF | 946 | 5.3% | 0.610 | 0.968 | 0.949 | 0.517 | 0.559 | |
| eat/drink dataset (this study) | DRINK | 71 | 1.7% | 0.949 | 0.999 | 0.998 | 0.957 | 0.953 |
| EAT | 147 | 33% | 0.988 | 0.983 | 0.984 | 0.966 | 0.977 | |
| LICKOBJECT | 70 | 1.6% | 0.658 | 0.998 | 0.992 | 0.821 | 0.731 | |
| SNIFF | 142 | 5% | 0.780 | 0.981 | 0.971 | 0.681 | 0.728 | |
| Griffies et al. 2018 [19] | SCRATCH | 2.12% | 0.769 | 0.997 | 0.992 | 0.861 | 0.812 | |
| SHAKE | 0.8% | 0.722 | 0.998 | 0.996 | 0.726 | 0.724 | ||
| den Uijl et al. 2016 [18] | DRINK | 206 | 0.76 | 0.97 | 0.86 | 0.81 | ||
| EAT | 242 | 0.77 | 0.97 | 0.84 | 0.80 | |||
| SHAKE | 145 | 0.91 | 1.00 | 0.79 | 0.85 | |||
| den Uijl et al. 2017 [8] | DRINK | 23 | 0.89 | 0.87 | 1.00 | 1.00 | 0.94 | |
| EAT | 23 | 0.92 | 0.73 | 0.99 | 0.73 | 0.81 | ||
| SHAKE * | 51 | 0.98 | 0.95 | 0.95 | 0.99 | 0.98 | ||
| Kiyohara et al. 2015 [21] | DRINK | 2 | 0.02 | 0.14 | 0.04 | |||
| EAT | 2 | 0.28 | 0.34 | 0.31 |
| Reference * | Device Position | Collar Fit | Environment | Behaviors |
|---|---|---|---|---|
| Crowd dataset (this study) | Uncontrolled | Uncontrolled | Uncontrolled (highly varied) | Naturalistic |
| Eat/drink dataset (this study) | Controlled | Controlled | Controlled (lab/kennel) | Semi-controlled |
| Griffies et al., 2018 [19] | Controlled | Controlled | Controlled (animal shelter) | Naturalistic |
| den Uijl et al., 2017 [8] | Controlled | Controlled | Controlled (track/field and indoors) | Semi-controlled |
Publisher’s Note: MDPI stays neutral with regard to jurisdictional claims in published maps and institutional affiliations. |
© 2021 by the authors. Licensee MDPI, Basel, Switzerland. This article is an open access article distributed under the terms and conditions of the Creative Commons Attribution (CC BY) license (https://creativecommons.org/licenses/by/4.0/).
Share and Cite
Chambers, R.D.; Yoder, N.C.; Carson, A.B.; Junge, C.; Allen, D.E.; Prescott, L.M.; Bradley, S.; Wymore, G.; Lloyd, K.; Lyle, S. Deep Learning Classification of Canine Behavior Using a Single Collar-Mounted Accelerometer: Real-World Validation. Animals 2021, 11, 1549. https://doi.org/10.3390/ani11061549
Chambers RD, Yoder NC, Carson AB, Junge C, Allen DE, Prescott LM, Bradley S, Wymore G, Lloyd K, Lyle S. Deep Learning Classification of Canine Behavior Using a Single Collar-Mounted Accelerometer: Real-World Validation. Animals. 2021; 11(6):1549. https://doi.org/10.3390/ani11061549
Chicago/Turabian StyleChambers, Robert D., Nathanael C. Yoder, Aletha B. Carson, Christian Junge, David E. Allen, Laura M. Prescott, Sophie Bradley, Garrett Wymore, Kevin Lloyd, and Scott Lyle. 2021. "Deep Learning Classification of Canine Behavior Using a Single Collar-Mounted Accelerometer: Real-World Validation" Animals 11, no. 6: 1549. https://doi.org/10.3390/ani11061549
APA StyleChambers, R. D., Yoder, N. C., Carson, A. B., Junge, C., Allen, D. E., Prescott, L. M., Bradley, S., Wymore, G., Lloyd, K., & Lyle, S. (2021). Deep Learning Classification of Canine Behavior Using a Single Collar-Mounted Accelerometer: Real-World Validation. Animals, 11(6), 1549. https://doi.org/10.3390/ani11061549