
Understanding the Interaction Effects between Dietary Lipid Content and Rearing Temperature on Growth Performance, Feed Utilization, and Fat Deposition of Sea Bass (Dicentrarchus labrax)

 ,
,  , and
, and
Abstract
Simple Summary
Abstract
1. Introduction
2. Materials and Methods
2.1. Biochemical Analyses
2.2. Statistical Analysis
2.3. Ethics Compliance
3. Results
4. Discussion
5. Conclusions
Author Contributions
Funding
Institutional Review Board Statement
Data Availability Statement
Acknowledgments
Conflicts of Interest
References
- Kousoulaki, K.; Sether, B.S.; Albrektsen, S.; Noble, C. Review on European sea bass (Dicentrarchus labrax, Linnaeus, 1758) nutrition and feed management: A practical guide for optimizing feed formulation and farming protocols. Aquac. Nutr. 2015, 21, 129–151. [Google Scholar] [CrossRef]
- Tobin, D.; Kause, A.; Mäntysaari, E.A.; Martin, S.A.M.; Houlihan, D.F.; Dobly, A.; Kiessling, A.; Rungruangsak-Torrissen, K.; Ritola, O.; Ruohonen, K. Fat or lean? The quantitative genetic basis for selection strategies of muscle and body composition traits in breeding schemes of rainbow trout (Oncorhynchus mykiss). Aquaculture 2006, 261, 510–521. [Google Scholar] [CrossRef]
- Grigorakis, K. Compositional and organoleptic quality of farmed and wild gilthead sea bream (Sparus aurata) and sea bass (Dicentrarchus labrax) and factors affecting it: A review. Aquaculture 2007, 272, 55–75. [Google Scholar] [CrossRef]
- Lutfi, E.; Gong, N.; Johansson, M.; Sánchez-Moya, A.; Björnsson, B.T.; Gutiérrez, J.; Navarro, I.; Capilla, E. Breeding selection of rainbow trout for high or low muscle adiposity differentially affects lipogenic capacity and lipid mobilization strategies to cope with food deprivation. Aquaculture 2018, 495, 161–171. [Google Scholar] [CrossRef]
- Bowyer, J.N.; Qin, J.G.; Stone, D.A.J. Protein, lipid and energy requirements of cultured marine fish in cold, temperate and warm water. Rev. Aquac. 2013, 5, 10–32. [Google Scholar] [CrossRef]
- Pörtner, H.O.; Peck, M.A. Climate change effects on fishes and fisheries: Towards a cause-and-effect understanding. J. Fish Biol. 2010, 77, 1745–1779. [Google Scholar] [CrossRef] [PubMed]
- Gomez Isaza, D.F.; Cramp, R.L.; Smullen, R.; Glencross, B.D.; Franklin, C.E. Coping with climatic extremes: Dietary fat content decreased the thermal resilience of barramundi (Lates calcarifer). Comp. Biochem. Physiol. Part A Mol. Integr. Physiol. 2019, 230, 64–70. [Google Scholar] [CrossRef] [PubMed]
- Sandre, L.C.G.; Buzollo, H.; Nascimento, T.M.T.; Neira, L.M.; Jomori, R.K.; Carneiro, D.J. Productive performance and digestibility in the initial growth phase of tambaqui (Colossoma macropomum) fed diets with different carbohydrate and lipid levels. Aquac. Rep. 2017, 6, 28–34. [Google Scholar] [CrossRef]
- Zheng, K.; Zhu, X.; Han, D.; Yang, Y.; Lei, W.; Xie, S. Effects of dietary lipid levels on growth, survival and lipid metabolism during early ontogeny of Pelteobagrus vachelli larvae. Aquaculture 2009, 299, 121–127. [Google Scholar] [CrossRef]
- González-Félix, M.L.; Minjarez-Osorio, C.; Perez-Velazquez, M.; Urquidez-Bejarano, P. Influence of dietary lipid on growth performance and body composition of the Gulf corvina, Cynoscion othonopterus. Aquaculture 2015, 448, 401–409. [Google Scholar] [CrossRef]
- Li, X.F.; Wang, Y.; Liu, W.B.; Jiang, G.Z.; Zhu, J. Effects of dietary carbohydrate/lipid ratios on growth performance, body composition and glucose metabolism of fingerling blunt snout bream Megalobrama amblycephala. Aquac. Nutr. 2013, 19, 701–708. [Google Scholar] [CrossRef]
- Gélineau, A.; Corraze, G.; Boujard, T.; Larroquet, L.; Kaushik, S. Relation between dietary lipid level and voluntary feed intake, growth, nutrient gain, lipid deposition and hepatic lipogenesis in rainbow trout. Reprod. Nutr. Dev. 2001, 41, 487–503. [Google Scholar] [CrossRef] [PubMed]
- Cowey, C.B. Protein and amino acid requirements: A critique of methods. J. Appl. Ichthyol. 1995, 11, 199–204. [Google Scholar] [CrossRef]
- Kause, A.; Quinton, C.D.; Ruohonen, K.; Koskela, J. Genetic Potential for the Regulation of Variability in Body Lipid and Protein Content of European Whitefish (Coregonus lavaretus); Cambridge University Press: Cambridge, UK, 2018. [Google Scholar] [CrossRef]
- Lee, D.J.; Putnam, G.B. The response of rainbow trout to varying protein/energy ratios in a test diet. J. Nutr. 1973, 103, 916–922. [Google Scholar] [CrossRef]
- Brett, J.R.; Groves, T.D.D. Fish Physiology, 1st ed.; Hoar, W.S., Randall, D.J., Brett, J.R., Eds.; Academic Press: Cambridge, MA, USA, 1979; Volume VIII. [Google Scholar]
- Dias, J.; Arzel, J.; Aguirre, P.; Corraze, G.; Kaushik, S. Growth and hepatic acetyl coenzyme—A carboxylase activity are affected by dietary protein level in European seabass (Dicentrarchus labrax). Comp. Biochem. Physiol. B Biochem. Mol. Biol. 2003, 135, 183–196. [Google Scholar] [CrossRef]
- Izquierdo, M.S.; Obach, A.; Arantzamendi, L.; Montero, D.; Robaina, L.; Rosenlund, G. Dietary lipid sources for seabream and seabass: Growth performance, tissue composition and flesh quality. Aquac. Nutr. 2003, 9, 397–407. [Google Scholar] [CrossRef]
- Guerreiro, I.; Peres, H.; Castro-Cunha, M.; Oliva-Teles, A. Effect of temperature and dietary protein/lipid ratio on growth performance and nutrient utilization of juvenile Senegalese sole (Solea senegalensis). Aquac. Nutr. 2012, 18, 98–106. [Google Scholar] [CrossRef]
- Jobling, M. Fish bioenergetics. Oceanogr. Lit. Rev. 1995, 9, 785. [Google Scholar]
- Person-Le Ruyet, J.; Mahé, K.; Le Bayon, N.; Le Delliou, H. Effects of temperature on growth and metabolism in a Mediterranean population of European sea bass, Dicentrarchus labrax. Aquaculture 2004, 237, 269–280. [Google Scholar] [CrossRef]
- Hidalgo, F.; Alliot, E. Influence of water temperature on protein requirement and protein utilization in juvenile sea bass, Dicentrarchus labrax. Aquaculture 1988, 72, 115–129. [Google Scholar] [CrossRef]
- Sotoyama, Y.; Yokoyama, S.; Ishikawa, M.; Koshio, S.; Hashimoto, H.; Oku, H.; Ando, T. Effects of a superoptimal temperature on aquacultured yellowtail Seriola quinqueradiata. Fish. Sci. 2018, 84, 1063–1071. [Google Scholar] [CrossRef]
- Sun, Z.; Xia, S.; Feng, S.; Zhang, Z.; Rahman, M.M.; Rajkumar, M.; Jiang, S. Effects of water temperature on survival, growth, digestive enzyme activities, and body composition of the leopard coral grouper Plectropomus leopardus. Fish. Sci. 2014, 81, 107–112. [Google Scholar] [CrossRef]
- Cho, C.Y. Apparent digestibility measurement in feedstuffs for rainbow trout. In Proceedings of the World Symposium on Finfish Nutrition and Fishfeed Technology, Hamburg, Germany, 20–23 June 1979; Volume II. pp. 239–247. [Google Scholar]
- Horwitz, W.; Chichilo, P.; Reynolds, H. Official Methods of Analysis of the Association of Official Analytical Chemists; Association of Official Analytical Chemists: Washington, DC, USA, 1990. [Google Scholar]
- Folch, J.; Lees, M.; Sloane Stanley, G.H. A simple method for the isolation and purification of total lipides from animal tissues. J. Biol. Chem. 1957. [Google Scholar] [CrossRef]
- Wang, J.T.; Liu, Y.J.; Tian, L.X.; Mai, K.S.; Du, Z.Y.; Wang, Y.; Yang, H.J. Effect of dietary lipid level on growth performance, lipid deposition, hepatic lipogenesis in juvenile cobia (Rachycentron canadum). Aquaculture 2005, 249, 439–447. [Google Scholar] [CrossRef]
- Van Ham, E.H.; Berntssen, M.H.G.; Imsland, A.K.; Parpoura, A.C.; Wendelaar Bonga, S.E.; Stefansson, S.O. The influence of temperature and ration on growth, feed conversion, body composition and nutrient retention of juvenile turbot (Scophthalmus maximus). Aquaculture 2003, 217, 547–558. [Google Scholar] [CrossRef]
- Ramalho Ribeiro, A.; Altintzoglou, T.; Mendes, J.; Nunes, M.L.; Dinis, M.T.; Dias, J. Farmed fish as a functional food: Perception of fish fortification and the influence of origin—Insights from Portugal. Aquaculture 2019, 501, 22–31. [Google Scholar] [CrossRef]
- Watanabe, T. Lipid nutrition in fish. Comp. Biochem. Physiol. Part B Biochem. 1982, 73, 3–15. [Google Scholar] [CrossRef]
- Sheridan, M.A. Regulation of lipid metabolism in poikilothermic vertebrates. Comp. Biochem. Physiol. Part B Biochem. 1994, 107, 495–508. [Google Scholar] [CrossRef]
- Peres, H.; Oliva-Teles, A. Effect of dietary lipid level on growth performance and feed utilization by European sea bass juveniles (Dicentrarchus labrax). Aquaculture 1999, 179, 325–334. [Google Scholar] [CrossRef]
- Du, Z.Y.; Liu, Y.J.; Tian, L.X.; Wang, J.T.; Wang, Y.; Liang, G.Y. Effect of dietary lipid level on growth, feed utilization and body composition by juvenile grass carp (Ctenopharyngodon idella). Aquac. Nutr. 2005, 11, 139–146. [Google Scholar] [CrossRef]
- Wang, L.; Lu, Q.; Luo, S.; Zhan, W.; Chen, R.; Lou, B.; Xu, D. Effect of dietary lipid on growth performance, body composition, plasma biochemical parameters and liver fatty acids content of juvenile yellow drum Nibea albiflora. Aquac. Rep. 2016, 4, 10–16. [Google Scholar] [CrossRef][Green Version]
- Bendiksen, E.Å.; Berg, O.K.; Jobling, M.; Arnesen, A.M.; Måsøval, K. Digestibility, growth and nutrient utilisation of Atlantic salmon parr (Salmo salar L.) in relation to temperature, feed fat content and oil source. Aquaculture 2003, 224, 283–299. [Google Scholar] [CrossRef]
- Nanton, D.A.; Lall, S.P.; McNiven, M.A. Effects of dietary lipid level on liver and muscle lipid deposition in juvenile haddock, Melanogrammus aeglefinus L. Aquac. Res. 2001, 32, 225–234. [Google Scholar] [CrossRef]
- El-Sayed, A.-F.M.; El-Ghobashy, A.; Al-Amoudi, M. Effects of pond depth and water temperature on the growth, mortality and body composition of Nile tilapia, Oreochromis niloticus (L.). Aquac. Res. 1996, 27, 681–687. [Google Scholar] [CrossRef]
- Islam, M.J.; Kunzmann, A.; Bögner, M.; Meyer, A.; Thiele, R.; James Slater, M. Metabolic and molecular stress responses of European seabass, Dicentrarchus labrax at low and high temperature extremes. Ecol. Indic. 2020, 112, 106118. [Google Scholar] [CrossRef]
- Grigorakis, K.; Alexis, M.N. Effects of fasting on the meat quality and fat deposition of commercial-size farmed gilthead sea bream (Sparus aurata, L.) fed different dietary regimes. Aquac. Nutr. 2005, 11, 341–344. [Google Scholar] [CrossRef]
- Azaza, M.S.; Dhraïef, M.N.; Kraïem, M.M. Effects of water temperature on growth and sex ratio of juvenile Nile tilapia Oreochromis niloticus (Linnaeus) reared in geothermal waters in southern Tunisia. J. Therm. Biol. 2008, 33, 98–105. [Google Scholar] [CrossRef]
- Chen, S.J.; Liu, P.; Jia, Y.M.; Liao, H.P.; Zhu, S.X.; Zhou, L.L.; Dan, X.M.; Liu, L.; Li, J.H.; Zheng, S.B.; et al. Dietary lipid concentrations influence growth, body composition, morphology of the liver and mid-intestine, and antioxidant status of marbled eel (Anguilla marmorata). Aquac. Int. 2020, 28, 2287–2302. [Google Scholar] [CrossRef]
- Li, M.; Lovell, R.T. Growth, feed efficiency and body composition of second- and third-year channel catfish fed various concentrations of dietary protein to satiety in production ponds. Aquaculture 1992, 103, 153–163. [Google Scholar] [CrossRef]
- Kestemont, P.; Baras, E. Food Intake in Fish; Houlihan, D., Boujard, T., Jobling, M., Eds.; John Wiley & Sons: Hoboken, NJ, USA, 2001; pp. 131–156. [Google Scholar]
- Khan, J.R.; Pether, S.; Bruce, M.; Walker, S.P.; Herbert, N.A. Optimum temperatures for growth and feed conversion in cultured hapuku (Polyprion oxygeneios)—Is there a link to aerobic metabolic scope and final temperature preference? Aquaculture 2014, 430, 107–113. [Google Scholar] [CrossRef]
- Mengistu, S.B.; Mulder, H.A.; Benzie, J.A.H.; Komen, H. A systematic literature review of the major factors causing yield gap by affecting growth, feed conversion ratio and survival in Nile tilapia (Oreochromis niloticus). Rev. Aquac. 2020, 12, 524–541. [Google Scholar] [CrossRef]


| Ingredients (%). | D16 | D20 |
|---|---|---|
| Fish meal 67% | 21.0 | 20.0 |
| Fish oil | 12.0 | 16.0 |
| Wheat meal 44% | 19.0 | 20.0 |
| Soybean meal | 7.5 | 8.0 |
| Sunflower seed meal | - | 2.0 |
| Poultry meal | 4.0 | 8.0 |
| Hydrolyzed feather meal | 17.0 | 13.5 |
| Blood meal (pork/poultry) | 5.0 | - |
| Soy protein concentrate | 12.0 | 10.0 |
| Monocalcium phosphate | 1.5 | 1.5 |
| Proprietary amino acid–vitamin–mineral mix | 1.0 | 1.0 |
| Total | 100.0 | 100.0 |
| Proximate composition of the experimental diets (DM) | ||
| Protein | 44.0% | 43.0% |
| Fat | 16.5% | 20.0% |
| Temperature | Dietary Fat Content | Interaction | |
|---|---|---|---|
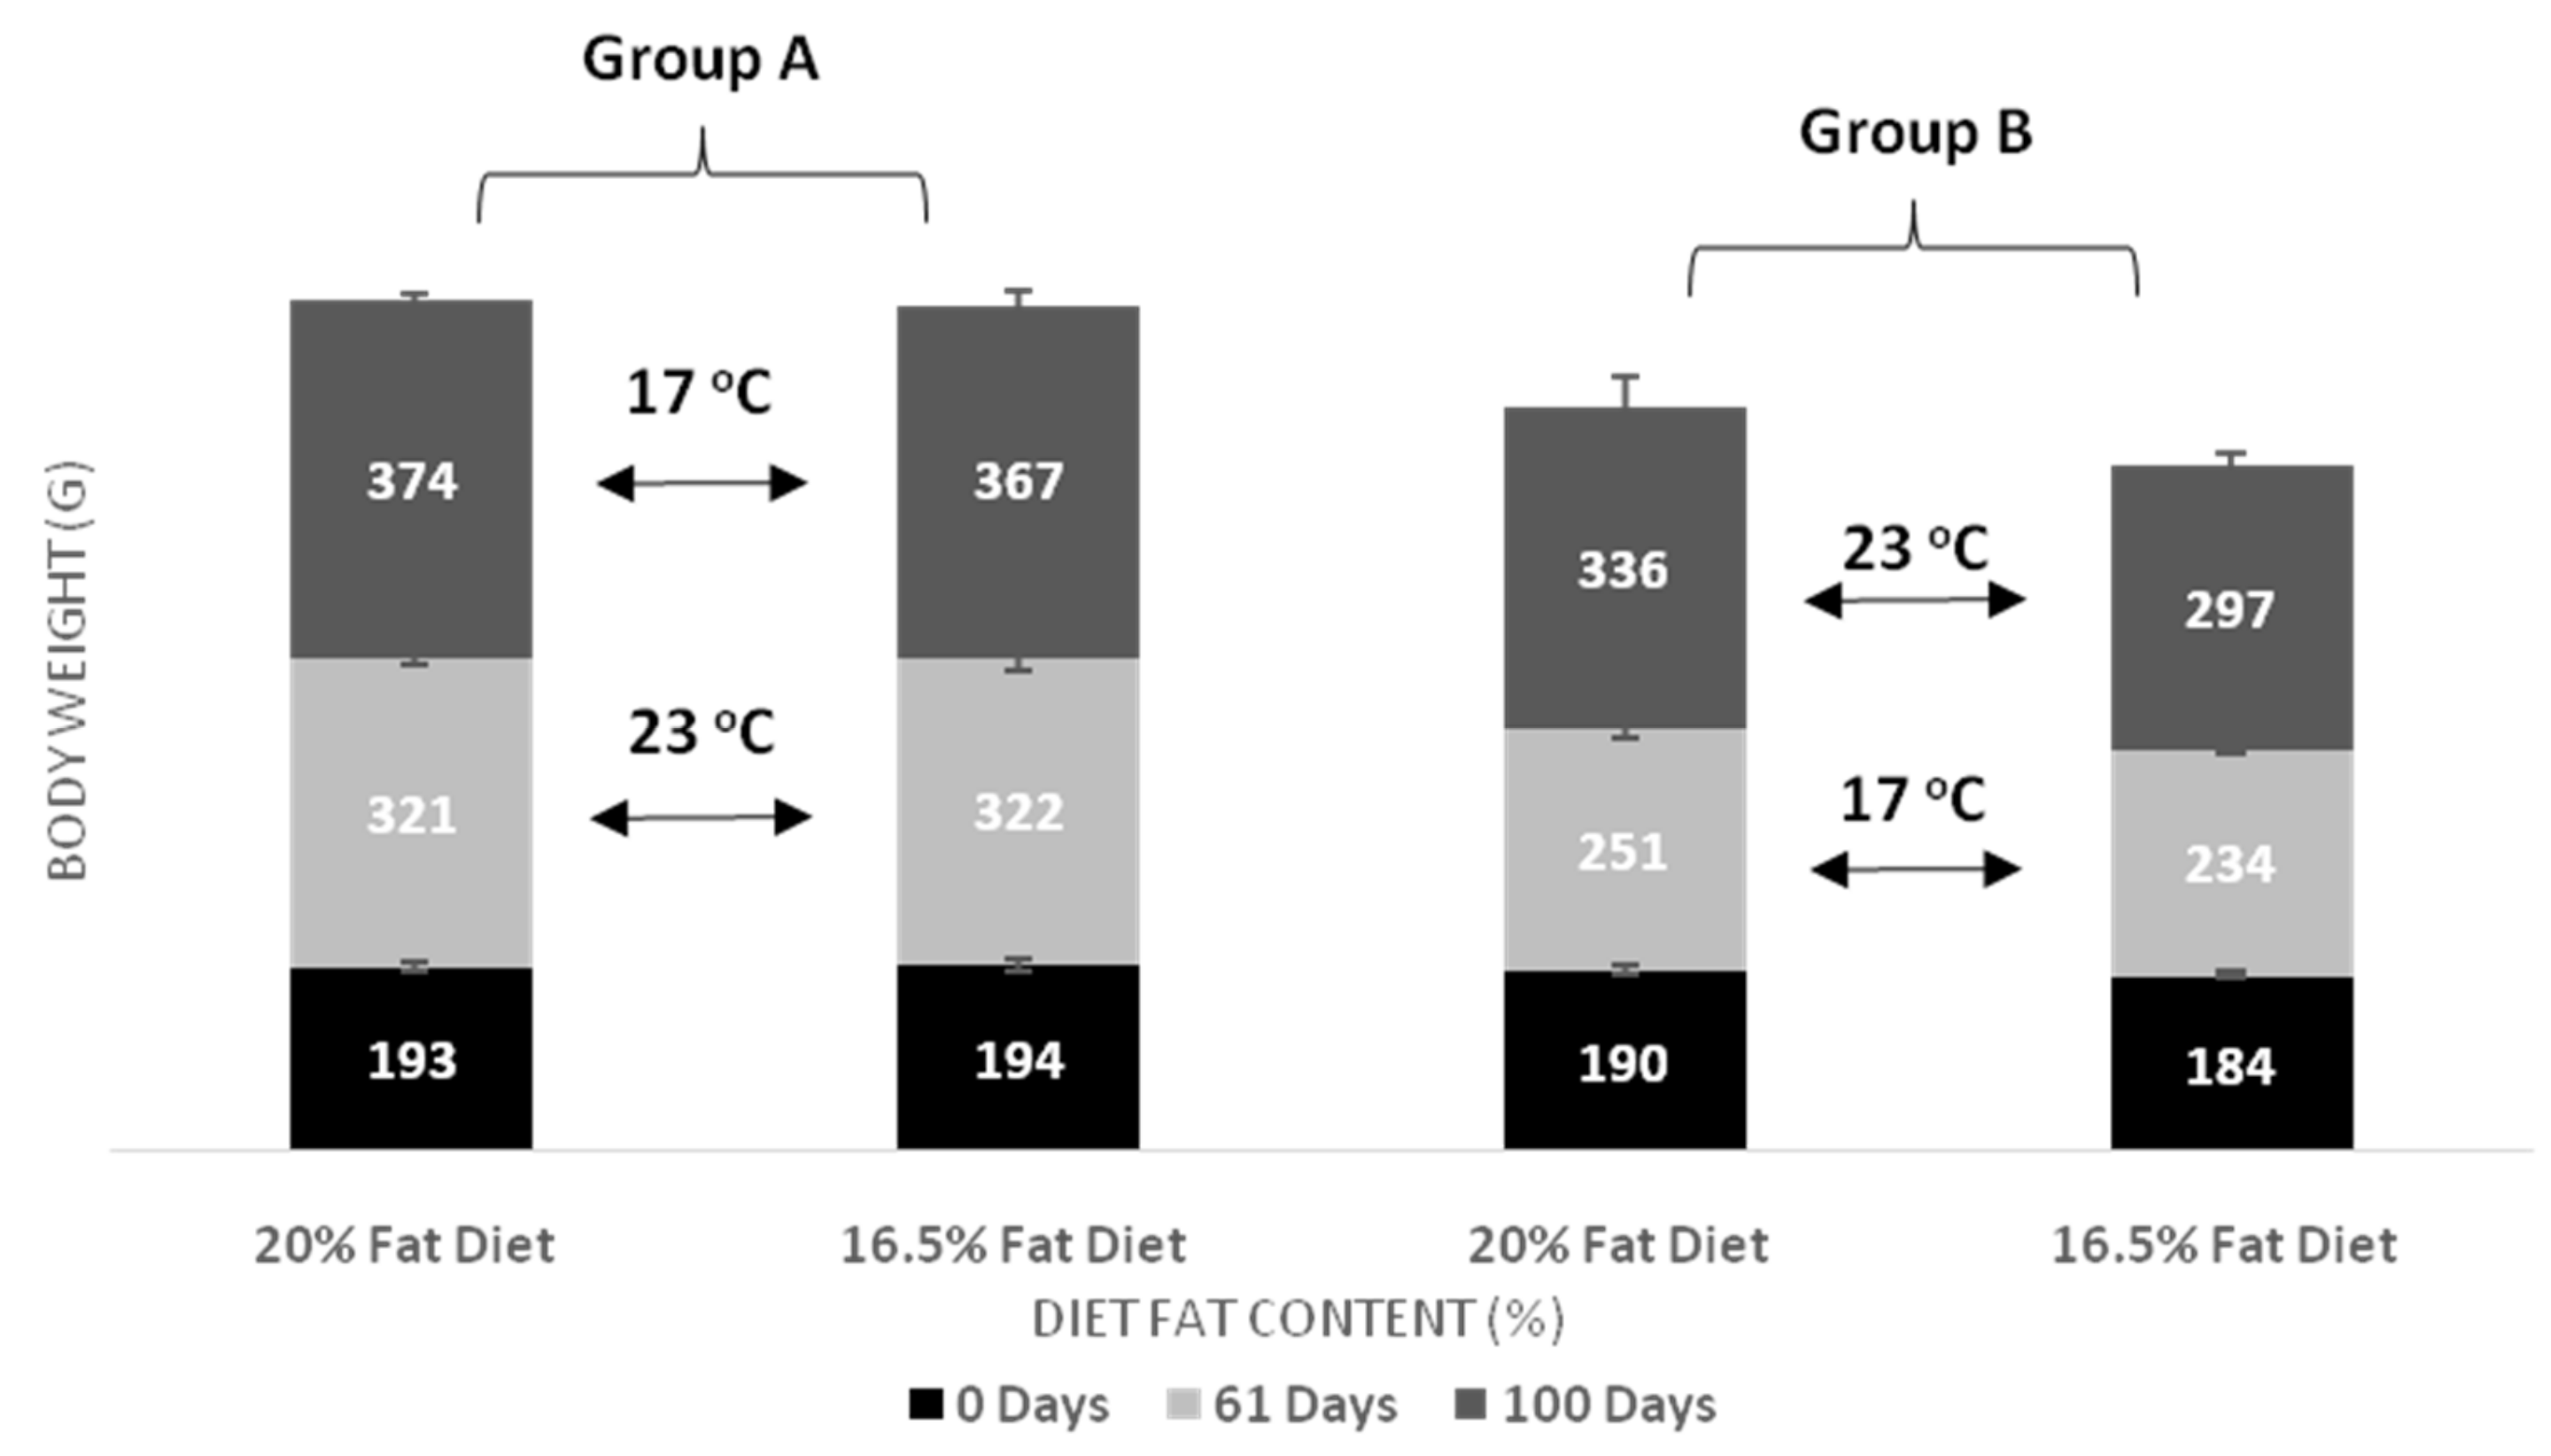
| Body Weight day 61 | Group A vs. Group B, p < 0.001 Temperature in D20, p < 0.001 Temperature in D16, p < 0.001 | p = 0.202 | p = 0.152 |
| Body Weight day 100 | Group A vs. Group B, p < 0.001 Temperature in D20, p = 0.017 Temperature in D16, p = 0.002 | D20 vs. D16, p = 0.02 Fat diet in Group B, p = 0.024 | p = 0.323 |
| Weight Gain day 61 | Group A vs. Group B, p < 0.001 Temperature in D20, p < 0.001 Temperature in D16, p < 0.001 | p = 0.356 | p = 0.320 |
| Weight Gain day 100 | Group A vs. Group B, p = 0.023 | p = 0.103 | p = 0.929 |
| Temperature | Dietary Fat Content | Interaction | |
|---|---|---|---|
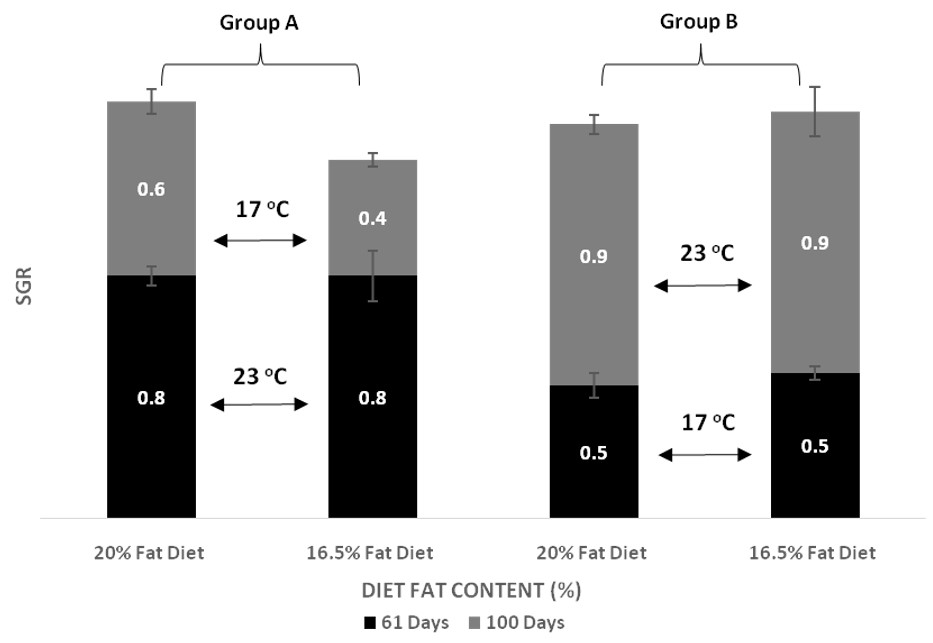
| SGR day 61 | Group A vs. Group B, p < 0.001 Temperature within D20, p < 0.001 Temperature within D16, p < 0.001 | p = 0.341 | p = 0.341 |
| SGR day 100 | Group A vs. Group B, p < 0.001 Temperature within D20, p < 0.001 Temperature within D16, p < 0.001 | p = 0.719 | p = 0.552 |
| Temperature | Dietary Fat Content | Interaction | |
|---|---|---|---|
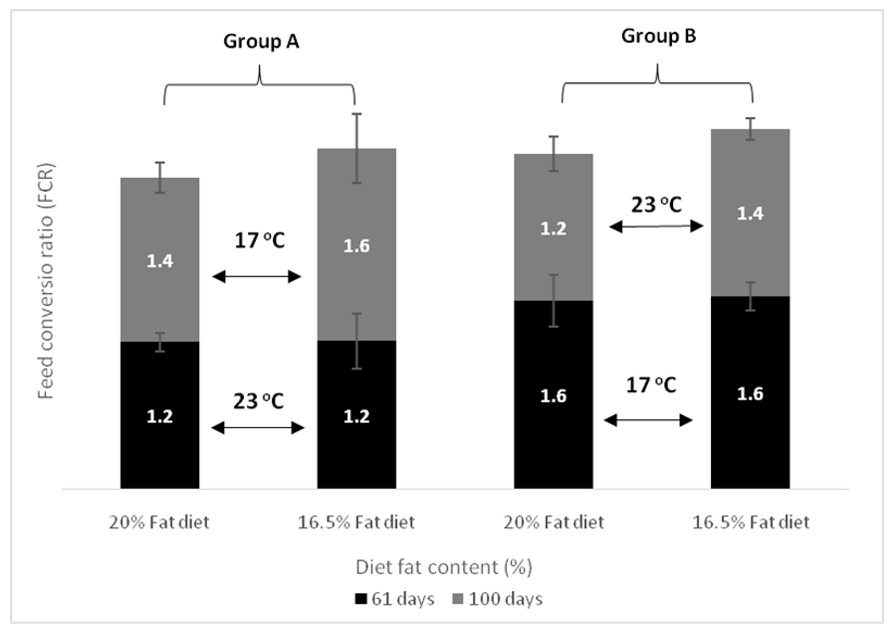
| FCR day 61 | Group A vs. Group B, p < 0.001 Temperature within D20, p = 0.002 Temperature within D16, p = 0.001 | p = 0.771 | p = 0.727 |
| FCR day 100 | p = 0.130 | p = 0.083 | p = 0.768 |
| DFC day 61 | Group A vs. Group B, p < 0.001 Temperature within D20, p < 0.001 Temperature within D16, p < 0.001 | Fat diet within Group B, p = 0.031 | p = 0.148 |
| DFC day 100 | Group A vs. Group B, p < 0.001 Temperature within D20, p = 0.002 Temperature within D16, p = 0.004 | p = 0.588 | p = 0.744 |
| Temperature | Dietary Fat Content | Interaction | |
|---|---|---|---|
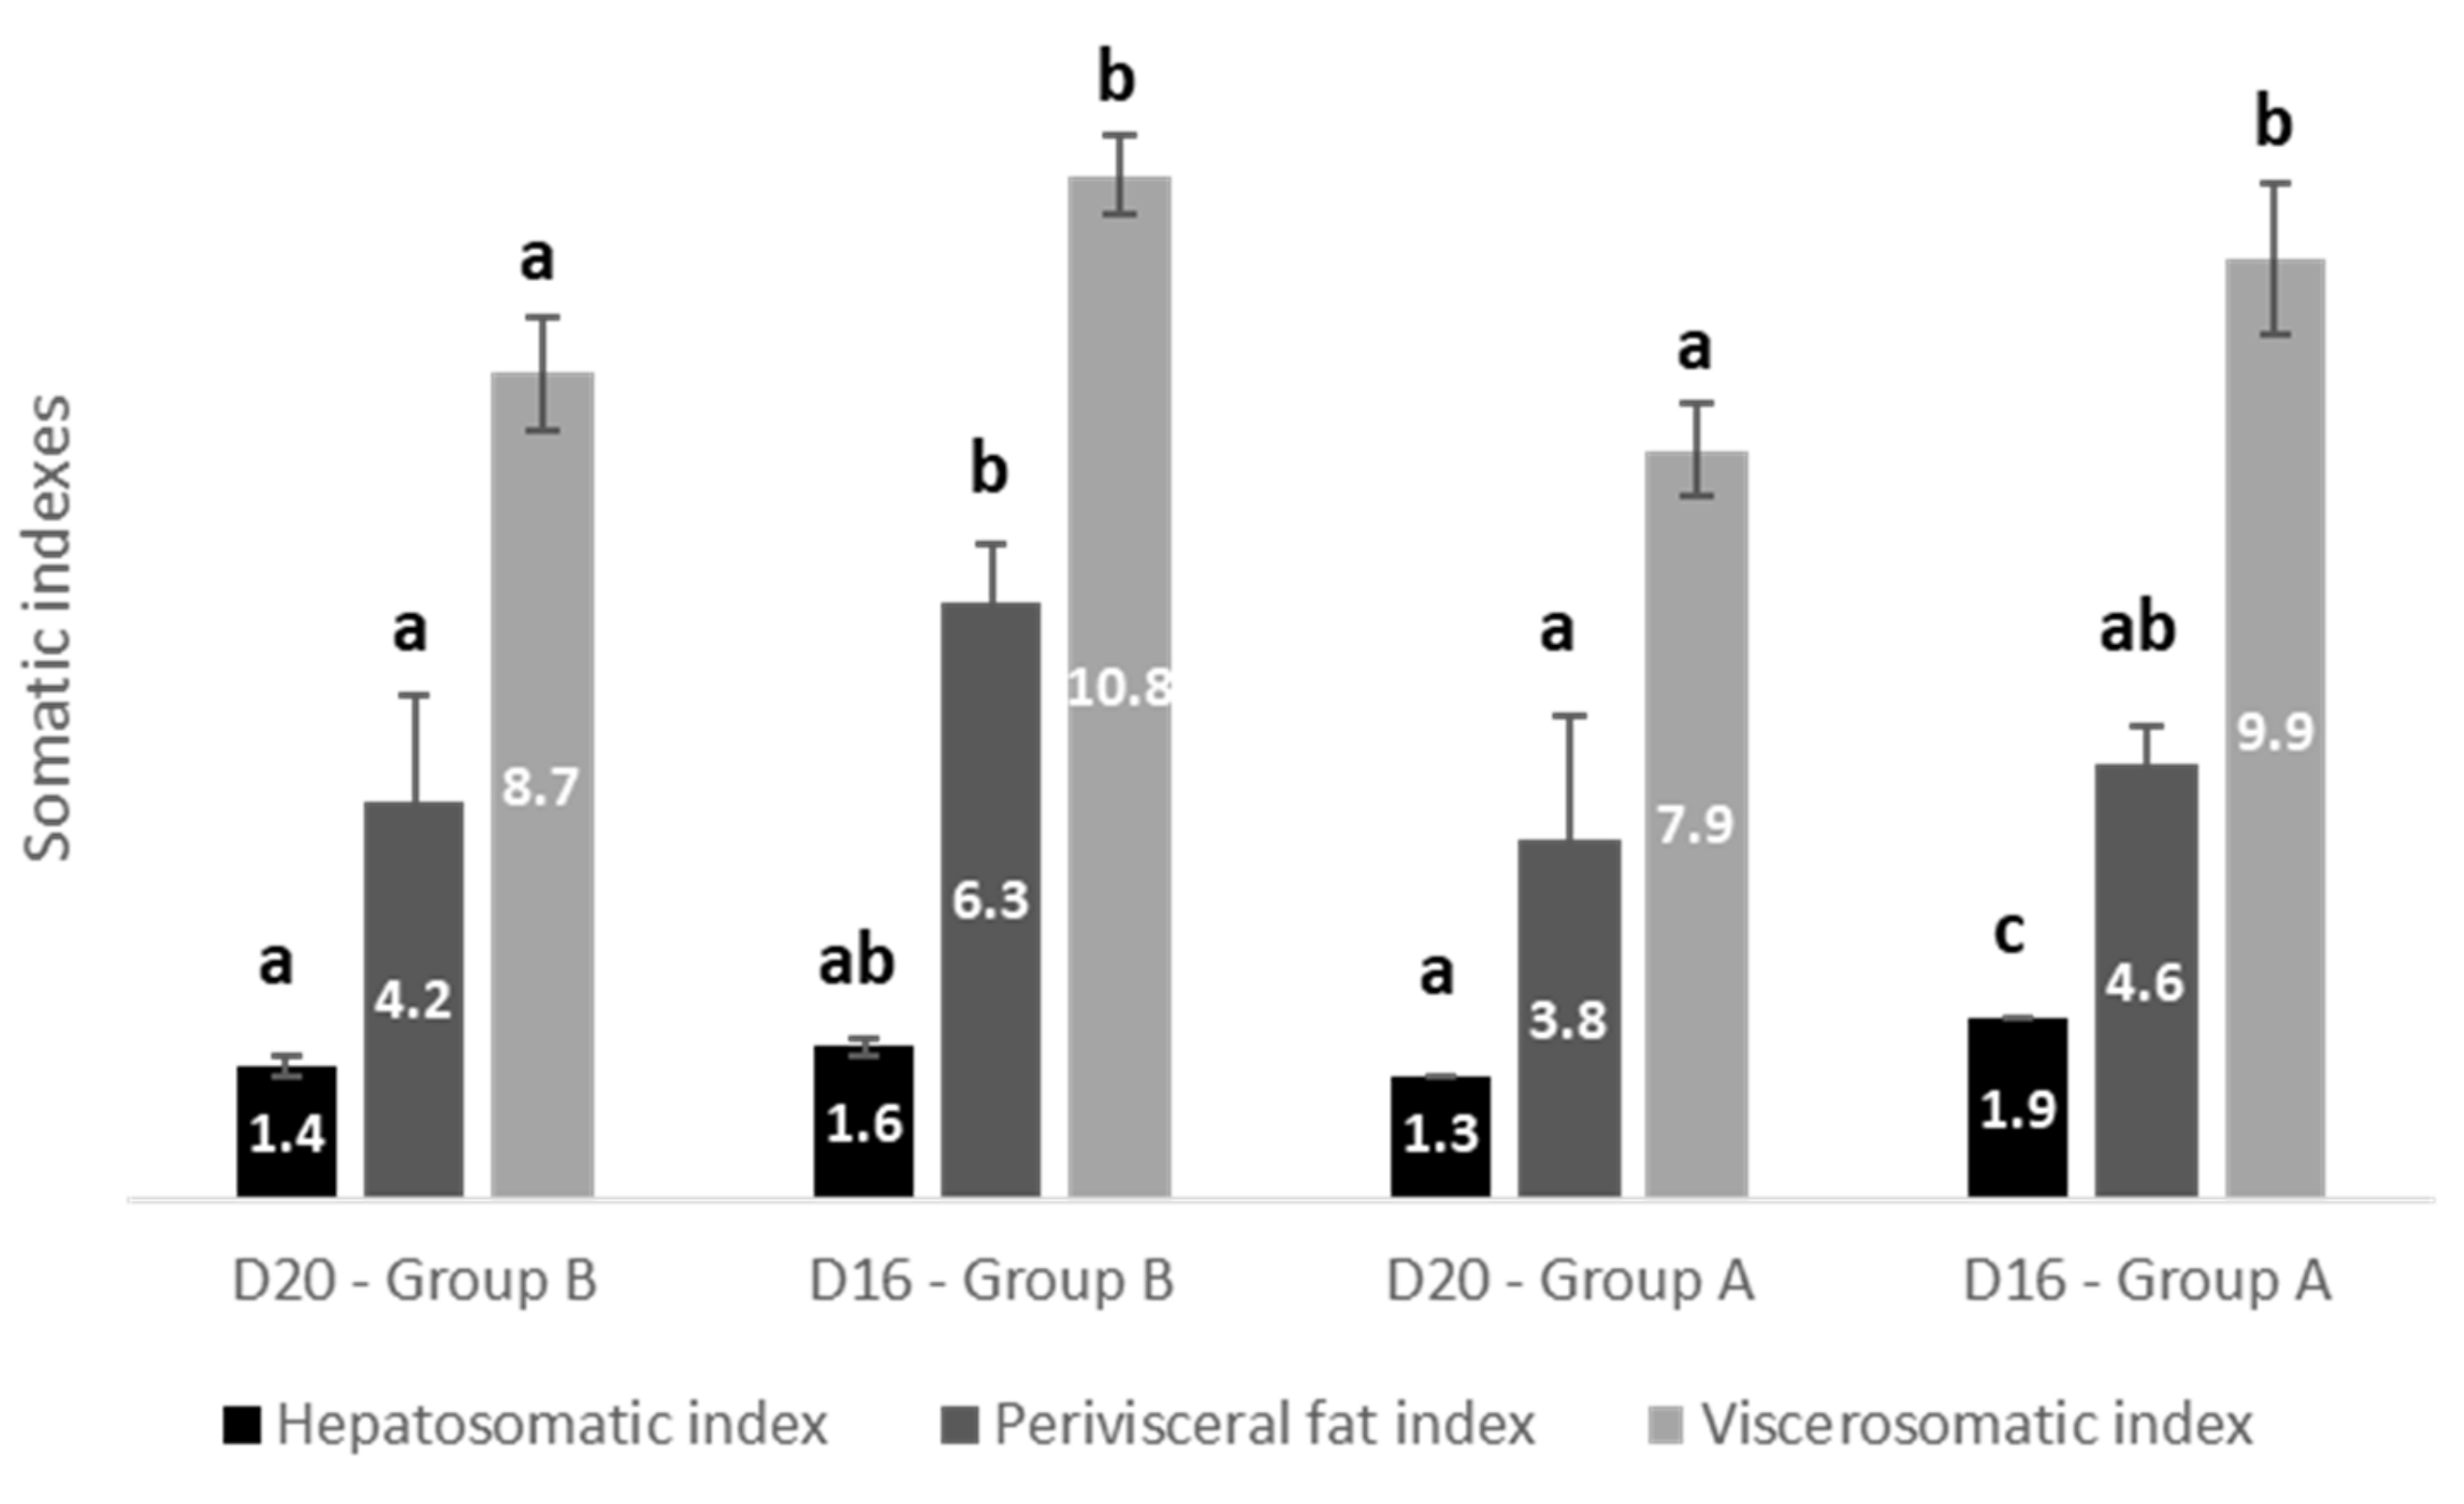
| HSI | Temperature within D16, p = 0.014 | D16 vs. D20, p < 0.001 Fat diet within Group A, p < 0.001 | p = 0.017 |
| Perivisceral fat | p = 0.061 | D16 vs. D20, p = 0.022 Fat diet within Group B, p = 0.032 | p = 0.423 |
| VSI | p = 0.052 | D16 vs. D20, p = 0.022 Fat diet within Group B, p = 0.005 Fat diet within Group A, p = 0.005 | p = 0.955 |
Publisher’s Note: MDPI stays neutral with regard to jurisdictional claims in published maps and institutional affiliations. |
© 2021 by the authors. Licensee MDPI, Basel, Switzerland. This article is an open access article distributed under the terms and conditions of the Creative Commons Attribution (CC BY) license (http://creativecommons.org/licenses/by/4.0/).
Share and Cite
Katsika, L.; Huesca Flores, M.; Kotzamanis, Y.; Estevez, A.; Chatzifotis, S. Understanding the Interaction Effects between Dietary Lipid Content and Rearing Temperature on Growth Performance, Feed Utilization, and Fat Deposition of Sea Bass (Dicentrarchus labrax). Animals 2021, 11, 392. https://doi.org/10.3390/ani11020392
Katsika L, Huesca Flores M, Kotzamanis Y, Estevez A, Chatzifotis S. Understanding the Interaction Effects between Dietary Lipid Content and Rearing Temperature on Growth Performance, Feed Utilization, and Fat Deposition of Sea Bass (Dicentrarchus labrax). Animals. 2021; 11(2):392. https://doi.org/10.3390/ani11020392
Chicago/Turabian StyleKatsika, Lydia, Mario Huesca Flores, Yannis Kotzamanis, Alicia Estevez, and Stavros Chatzifotis. 2021. "Understanding the Interaction Effects between Dietary Lipid Content and Rearing Temperature on Growth Performance, Feed Utilization, and Fat Deposition of Sea Bass (Dicentrarchus labrax)" Animals 11, no. 2: 392. https://doi.org/10.3390/ani11020392
APA StyleKatsika, L., Huesca Flores, M., Kotzamanis, Y., Estevez, A., & Chatzifotis, S. (2021). Understanding the Interaction Effects between Dietary Lipid Content and Rearing Temperature on Growth Performance, Feed Utilization, and Fat Deposition of Sea Bass (Dicentrarchus labrax). Animals, 11(2), 392. https://doi.org/10.3390/ani11020392