Article

Dietary Supplementation with Microalgae (Schizochytrium sp.) Improves the Antioxidant Status, Fatty Acids Profiles and Volatile Compounds of Beef

1
Institute of Animal Sciences, Chinese Academy of Agricultural Sciences, Beijing 100193, China
2
China Meat Research Center, Beijing Academy of Food Sciences, Beijing 100068, China
3
College of Agriculture and Animal Husbandry, Qinghai University, Xining 810016, China
*
Author to whom correspondence should be addressed.
Animals 2021, 11(12), 3517; https://doi.org/10.3390/ani11123517
Submission received: 12 October 2021 / Revised: 16 November 2021 / Accepted: 7 December 2021 / Published: 10 December 2021
(This article belongs to the Special Issue Sustainable Feeding Strategies to Improve Milk and Meat Quality)

Abstract

:

Simple Summary

This study evaluated the effects of Schizochytrium sp., as a promising feed additive, on the antioxidant enzyme activity, physicochemical quality, fatty acid composition and volatile compounds of beef. The results revealed that Schizochytrium could improve the antioxidant capacity of beef and increase the nutritional value, which was related to the abundant docosahexaenoic acid (DHA) found in Schizochytrium. Our current research results provide guidance for the development of environmentally friendly diet additives.

Abstract

The purpose of this study was to evaluate the effects of dietary supplementation with microalgae (Schizochytrium sp.) containing docosahexaenoic acid (DHA) on the antioxidant enzyme activity, physicochemical quality, fatty acid composition and volatile compounds of beef meat. Eighteen male Qaidamford cattle were randomly allocated into three treatments (n = 6): no micro-algae supplementation (Control group, C), 100 g microalgae supplementation per bull per day (FD1), and 200 g microalgae supplementation per bull per day (FD2), and fed for 49 days before slaughter. The results showed that, compared with the C group, the addition of DHA-rich microalgae to the diet could significantly increase the total antioxidant capacity (T-AOC) in meat. In the FD2 group, it was found that the concentration of glutathione peroxidase (GSH-Px) was significantly higher than that of the control group (p < 0.05). DHA-rich microalgae supplementation increased polyunsaturated fatty acid (PUFA), eicosapentaenoic acid (EPA; C20:5 n-6), DHA, EPA + DHA, and n-3 PUFA and reduced n-6:n-3 fatty acid ratio. Twenty-four volatile compounds identified in beef were mainly aldehydes, alcohols and ketones from the fingerprints. The contents of short-chain fatty aldehydes, 1-octen-3-ol and 2-pentylfuran, were higher in the FD2 group than in the other two groups. The microalgae diet improved the sensory attribute score of beef. The results demonstrated that dietary supplementation of DHA-rich microalgae improved the antioxidant status, increased the deposition of DHA and enhanced the characteristic flavor of beef.

1. Introduction

The beef industry has become one of the fastest-growing industries in China’s animal husbandry [1]. Beef contributes high-quality protein to consumers. However, due to the biohydrogenation of n-3 polyunsaturated fatty acids (n-3 PUFA) in the ruminant rumen [2], the n-3 PUFA in beef is insufficient to meet the needs of human health [3]. It is well known that more n-3 PUFA, eicosapentaenoic acid (EPA) and docosahexaenoic acid (DHA) ingested in the diet, has health benefits for the control of human cardiovascular and cerebrovascular diseases [4]. The n-3 PUFA is an “essential” nutrient for the human body because humans cannot synthesize them [5]. Although α-linolenic acid (ALA) could be converted into EPA and DHA in the human body, it seems that the degree of conversion is limited, and the efficiency is extremely low [6,7]. Thus, it is an effective strategy to increase the concentration of DHA and EPA in beef by feeding the cattle n-3 PUFA-enriched fish oil or microalgae.
Researchers found that after animals were fed fish oil, the oxidative stability of the meat was reduced and was accompanied by off-odors, which was caused by the oxidation of lipids in the meat during shelf life [8,9,10]. Another alternative approach is to add marine microalgae into animal diets. The advantage of this approach would be that microalgae may be photosynthetically autotrophic and grow fast [11,12]. They are used as a source of animal feed [13], thereby solving the problem of sustainability of supply [14]. In addition to the high content of DHA, microalgae also contain antioxidants such as β-carotenoids, vitamin E and vitamin A [15], which can enhance the immune response [16], antioxidant activity [17] and antibacterial effect [18] of animals, and ensure that animals remain healthy. Schizochytrium is a kind of thraustochytrid microalgae, and is the source of DHA in the marine food chain [19]. The addition of Schizochytrium in animal diets has been proven to improve the quality of meat and increase the content of n-3 PUFA [20,21,22,23]. Nevertheless, information on the relationship between microalgae and volatile compounds has not been reported.
We hypothesized that the difference in antioxidant status and volatile compounds in beef after slaughter could be explained by the level of Schizochytrium addition. Therefore, the purpose of this study is to determine the influence of a dietary DHA-rich microalgae concentration through the determination of antioxidant capacity, physical indicators, fatty acid composition and volatile compounds.

2. Materials and Methods

2.1. Animals, Experimental Design and Diets

A total of 18 male Qaidamford cattle (24 months old, weighing 345.42 ± 12.49 kg) were randomly allocated to three experimental groups with 6 bulls of each, and assigned to individual pens (3 × 2.5 m). The experiment lasted for 49 days. This research was conducted in Qinghai Jinsui Animal Husbandry Co., Ltd. (Haixi Mongolian and Tibetan Autonomous Prefecture, Delingha City, China). All animals were fed twice daily at 08:00 h and 17:00 h. Water was provided freely. The experimental groups were as follows: (1) C (control group, a basal diet without microalgae powder supplementation), (2) FD1 (100 g microalgae powder per bull per day of basal diet) and (3) FD2 (200 g microalgae powder per bull per day of basal diet). The bulls first received the concentrate mixed with the Schizochytrium sp. powder and then ingested the dietary roughage mixed with oat hay and alfalfa hay. The ratio of forage to concentrate was 60:40. The ingredient and chemical composition of the basal diets are presented in Table 1.
The crude protein, calcium and phosphorus contents of the experimental diet were analyzed following the Association of Official Analytical Chemists’ (AOAC) methods [24]. The concentrations of neutral detergent fiber and acid detergent fiber were calculated as described by Van Soest et al. [25]. The fatty acid (FA) profiles of the experimental diet were determined at the Ministry of Agriculture Feed Industry Center (College of Animal Science and Technology, China Agricultural University, Beijing, China), and analyzed by gas chromatography (Agilent 6890 Series, Agilent Technologies, Avondale, Palo Alto, CA, USA) equipped with a capillary column (CP-Sil 88 column, 0.25 mm × 50 m) according to the procedure described by Li et al. [26]. The FA composition of the Schizochytrium sp. used in the diets is shown in Table 2. The commercial Schizochytrium sp. powder (21.0% protein, 41.2% fat, 2.8% ash, and 2.3% moisture) was purchased from Xi’an Xiaocao Biotechnology Co., Ltd. (Xi’an, China).

2.2. Sample Collection

All animals were weighed (393.37 ± 23.53 kg for the C group, 408.50 ± 24.72 kg for the FD1 group, and 403.25 ± 15.94 kg for the FD2 group) and transported to commercial slaughterhouses for slaughter to facilitate sample collection and measurement after the end of the feeding trial. In order to better simulate the quality of beef consumed by residents in the Qinghai-Tibet Plateau, we chose 48 h after slaughter as the sampling time. After chilling for 48 h at 4 °C, the M. longissimus lumborum (LL) muscle sample was taken from the left side of each carcass and transported to the laboratory with a portable cooler. All beef samples were trimmed with visible fat and connective tissue before vacuum packaging and stored at −80 °C for further analysis within two weeks.

2.3. Analysis of Antioxidant Enzymes Activity and Lipid Oxidation

All samples were thawed at 4 °C for 24 h before analysis. One gram of meat was mixed with cold phosphate-buffered saline (0.06 mol/L, pH 7.4) at a ratio of 1:10 (weight/volume, w/v) and then homogenized with Ultra Turrax T25 (IKA, Braun, Kronberg, Germany) homogenizer. After centrifugation at 4000 rpm and 4 °C for 10 min, the supernatant was collected to determine the protein content and antioxidant enzyme activity. Protein concentration, total antioxidant capacity (T-AOC), superoxide dismutase (SOD), glutathione peroxidase (GSH-Px) levels and thiobarbituric acid reactive substances (TBARS) level were measured using commercial assay kits (Nanjing Jiancheng Bioengineering Institute, Nanjing, China) by a spectrophotometer (Spectral Instrument Co. Ltd., Shanghai, China). The results of T-AOC, SOD and GSH-Px were expressed in U/mg protein, and the absorbance was measured at 520 nm, 550 nm and 412 nm, respectively. Lipid oxidation was evaluated using the TBARS value. The absorbance was measured at 532 nm. Results were expressed as mg malonaldehyde (MDA)/kg meat.

2.4. Meat Physicochemical Quality Characteristics Analysis

2.4.1. pH and Color Measurement

The pH values were measured with a Testo 205 pH meter (Lenzkirch, Germany) calibrated with pH 4 and 7 standard buffer solutions. The average value obtained by inserting electrodes into three different points of each sample was used for statistical analysis.
The thawed LL muscle sample was bloomed for 45 min before measurement. The surface color of meat was measured with a portable CR-400 Colorimeter (Minolta Inc., Osaka, Japan), using an illuminant D65 and a 2-degree standard observer. Color parameters L* (lightness), a* (redness) and b* (yellowness) were measured at different positions on the surface of each sample with triplicate measurements, and the average values were calculated. Chroma (C*) and hue angle (H*) were evaluated by the following equations:
C* = (a*2 + b*2)1/2,
H* = arctan (b*/a*) × (180/π)

2.4.2. Drip Loss and Cooking Loss Determination

Drip loss. Drip loss was estimated according to the protocol followed by Honikel [27]. Approximately 60 g of each meat sample was weighed (W1) and then suspended in an inflated polyethylene bag at 4 °C without any contact with the bag. After 24 h, the sample was taken out of the bag, gently wiped off the residual surface drip, and then weighed (W2). Drip loss was calculated as the percentage ratio of the initial weight using the following formula:
Drip loss = (W1 − W2)/W1 × 100%,
Cooking Loss. Cooking loss was determined as suggested by Fabre et al. [28]. Briefly, the thawed sample was weighed (M1) and placed in a polyethylene bag, and then cooked under boiling water (98 ± 1 °C) until the internal temperature reached 71 °C. The sample was taken out and weighed after cooling (M2). The cooking loss was expressed as a percentage of the initial sample weight, according to the following formula:
Cooking loss = (M1 − M2)/W1 × 100%,

2.4.3. Proximate Composition Analysis

Approximately 50 g of the minced meat sample was measured according to the method of the AOAC [24], in which protein was analyzed by a Kjeldahl K9840 analyzer (Hanon Instrument Co. Ltd., Nanjing, China), and fat was determined by an Ankom XT15 analyzer (Ankom Technology, Macedon, NY, USA). All measurements were taken in triplicates.

2.5. Fatty Acids Analysis

The fatty acids composition analyses were carried out according to Ponnampalam et al. [29]. In brief, the beef samples collected from each group were sliced and freeze-dried in a freeze dryer (Ningbo Xinzhi Instruments, Inc., Ningbo, China) for 72 h. Freeze-dried samples (0.5 g) were ground, and then 1 mL internal standard (C11:0, Sigma Aldrich Pty Ltd., St. Louis, MI, USA) was added to muscle samples. The contents were hydrolyzed with 0.7 mL of 10 mol/L potassium hydroxide aqueous solution and 5.3 mL of methanol to form free fatty acids. Then, the contents were incubated in a water bath at 55 °C for 1.5 h by vortex mixing and mixed with 0.58 mL of 24 N sulfuric acid (H2SO4) in water and cooled to room temperature. After 1.5 h incubation, the mixture was cooled and then thoroughly mixed with 3 mL of hexane solvent and centrifuged. Approximately 1 mL supernatant (fatty acid methyl ester, FAME) was transferred into an injection vial for analysis. The FAME was determined with the gas chromatograph (GC-6890 N, Agilent Technologies, Wilmington, NC, USA), equipped with a detector (flame ionization), and separate SP-2560 type column (capillary) (60 m × 2.5 cm × 0.25 μm, Supelco Inc., Bellefonte, PA, USA). The sample split ratio was 30:1. Gas chromatographic conditions were set according to Aldai et al. [30]. The ratio of retention time to the FAME standard mixture (FAME 37 component, Sigma-Aldrich Co., St. Louis, MI, USA) was used to identify the fatty acids.

2.6. Volatile Compounds Analysis

Beef samples were collected in triplicate for each group of volatile compounds. The volatile compounds were determined using a Flavorspec Gas Chromatograph-Ion Mobility Spectrometer (GC-IMS) system (GAS GmbH, Dortmund, Germany) fitted with a SE-54 capillary column (15 m × 0.53 mm), and conducted with modifications according to the methods of Xu et al. [31]. Briefly, without any sample pre-treatment, two grams of fresh meat samples were weighed and placed in a 20 mL headspace vial and incubated at 60 °C for 20 min. Then, 500 L of headspace was automatically injected into the heated syringe with a syringe at 85 °C. High-purity nitrogen was used as the carrier gas with a flow rate of 150 mL/min. The carrier gas flow rate program was set to 2 mL/min for 2 min; 10 mL/min for 10 min, 100 mL/min for 20 min, and 150 mL/min for 25 min. LAV software (version 2.2.1—G.A.S., Dortmund, Company) was used to create an area set integrating retention time (Rt) and drift time (Dt) of all markers spots and to obtain the individual signal from the topographic plot.

2.7. Sensory Analysis

Eight trained sensory panel members were selected according to the Chinese standard GB/T 22210-2008 (criterion for the sensory evaluation of meat and meat products). The samples were baked on a household grill at 185 °C and removed when the core temperature reached 70 °C. After cooking, each sample was cut into 1.5 cm cubes, placed on a paper plate with a three-digit number and then presented to the panelists. During testing, panelists were seated in a separate compartment in the sensory room. Before proceeding to the next round of evaluation, panelists were instructed to rinse their mouths with water to clear the taste between the samples. All sensory analyses were repeated three times. The sensory attribute score of each sample was divided into 8 levels: initial juiciness (1 = extremely dry, 8 = extremely juicy); sustained juiciness (1 = extremely dry, 8 = extremely juicy); flavor intensity (1 = extremely bland, 8 = extremely intense); off-flavor intensity (1 = no off-flavor, 8 = extremely intense off-flavor); initial tenderness (0 = extremely tough, 8 = extremely tender); sustained tenderness (0 = extremely tough, 8 = extremely tender); residue (0 = none, 8 = abundant).

2.8. Statistical Analysis

All the experiments were performed in triplicate. The collected data were analyzed using one-way analysis of variance (ANOVA) by the SAS 9.2 program (SAS Institute, Cary, NC, USA). The Shapiro–Wilk test and Levene test were used to evaluate the normality of the data distribution and the homogeneity of variance. The Duncan test was used to compare mean values. Significant differences were declared at p < 0.05.

3. Results

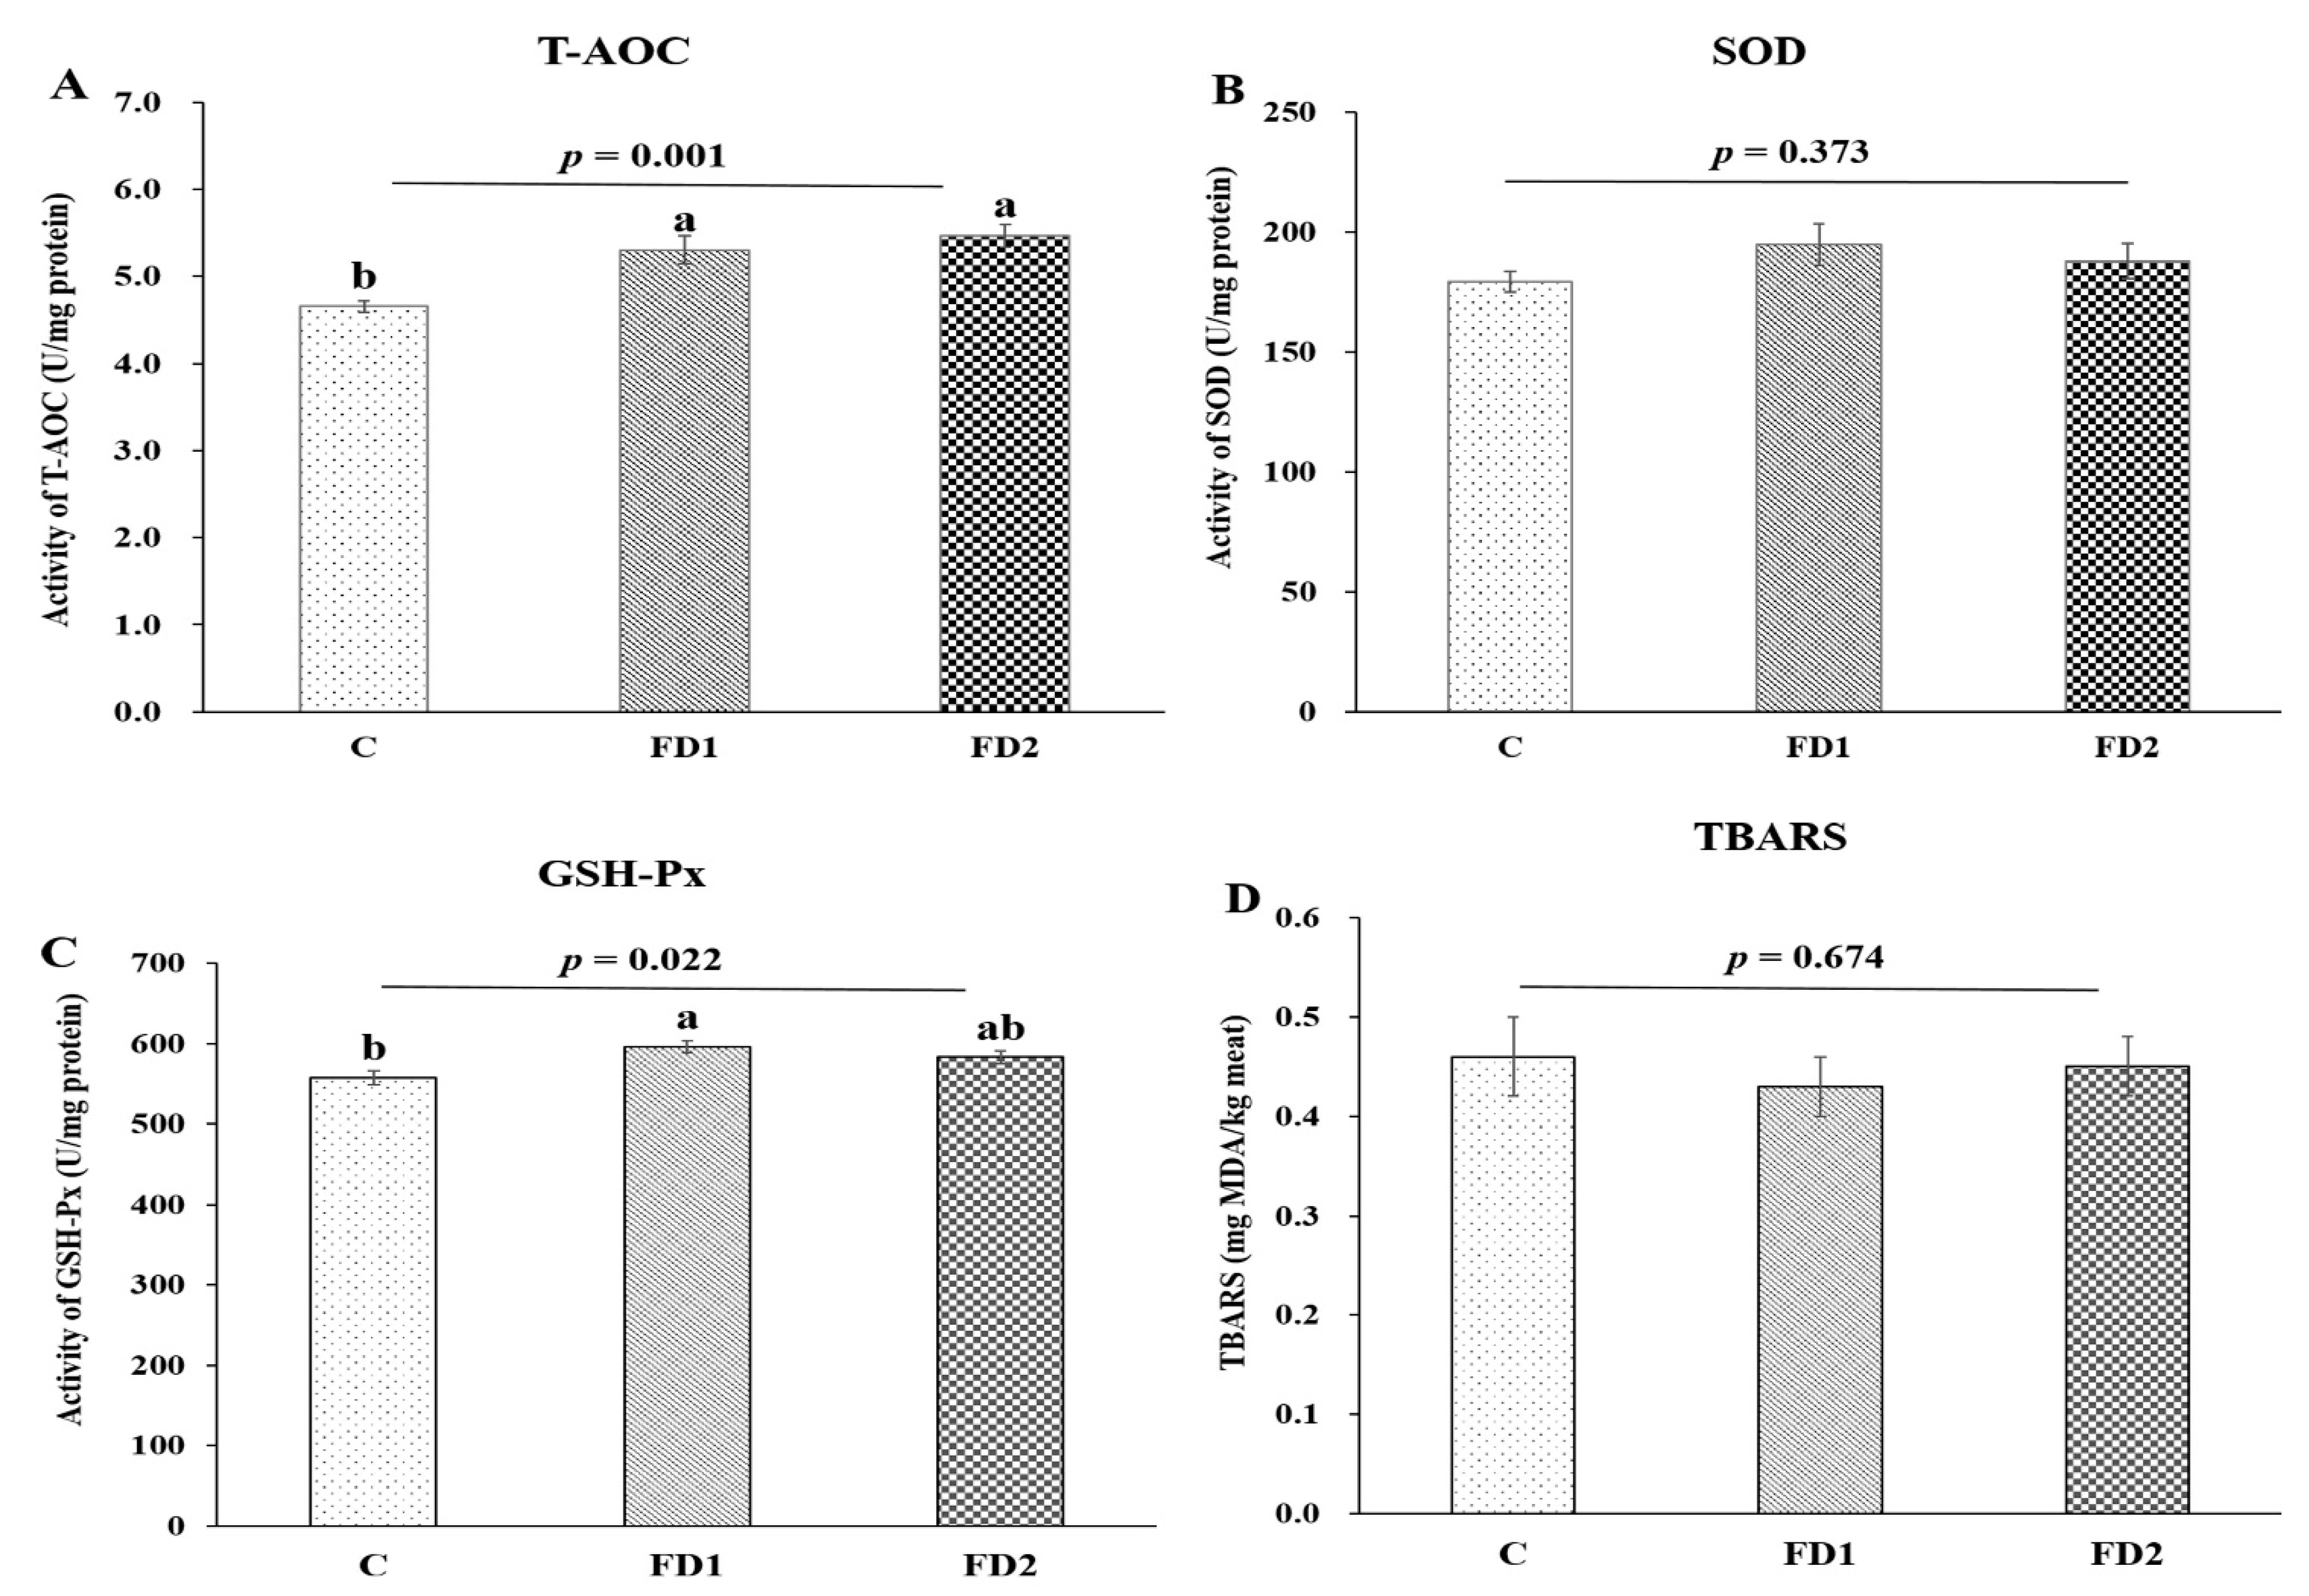
3.1. Antioxidant Enzymes Activity and Lipid Oxidation

Effects of dietary DHA-rich microalgae on the antioxidant enzyme activity of beef are shown in Figure 1. Compared with the control group, the activities of T-AOC in the FD1 group and FD2 group and GSH-Px in the FD1 group significantly increased (p < 0.05). No significant difference was observed in T-AOC and GSH-Px activities between the FD1 group and the FD2 group (p > 0.05). There was no significant difference in SOD activity and TBARS in all treatment groups (p > 0.05).

3.2. Meat Physicochemical Quality

The effects of dietary DHA-rich microalgae on physicochemical meat quality are presented in Table 3. There were no differences (p > 0.05) in color parameters (L*, a*, b*, C* and H*), pH, drip loss, cooking loss and protein among the three treatments. The fat content in the FD1 and FD2 groups was significantly higher than that in the control group (p < 0.05).

3.3. Fatty Acid Composition

The influences of dietary DHA-rich microalgae on fatty acids composition in the LL muscle of beef are given in Table 4. It could be seen that dietary DHA-rich microalgae treatments had no effects on monounsaturated fatty acids (MUFA) and n-6 PUFA (p > 0.05). Saturated fatty acids (SFA) in the FD1 and FD2 groups was greater (p < 0.05) than that in the control group. The cattle supplemented with DHA-rich microalgae had higher SFA (p = 0.007), PUFA (p = 0.001), n-3 PUFA (p < 0.001) and EPA + DHA (p < 0.001), and a lower (p < 0.001) n-6/n-3 ratio. Moreover, the concentrations of EPA, DHA, EPA + DHA and total n-3 PUFA increased significantly with increasing DHA-rich microalgae (p < 0.001). The relative proportion of EPA and DHA were 4–6 times and 8.5–11.4 times higher (p < 0.001) for FD1 and FD2 groups compared to the control group.
Diet also influenced individual fatty acid contents, whereas C16:0 and C18:3 n-3 (ALA) in the FD1 and FD2 groups was higher (p < 0.05) than that in the control group. DHA-rich microalgae increased the concentrations of C16:0 and SFA in the meat, which may be related to the higher contents of C16:0 and SFA contained in microalgae powder, which were difficult to be oxidized and easy to deposit [15]. The concentrations of C20:0 and C16:1 in the FD2 group were greater (p < 0.05) than that in the control group, but there was no difference (p > 0.05) from that in the FD1 group.

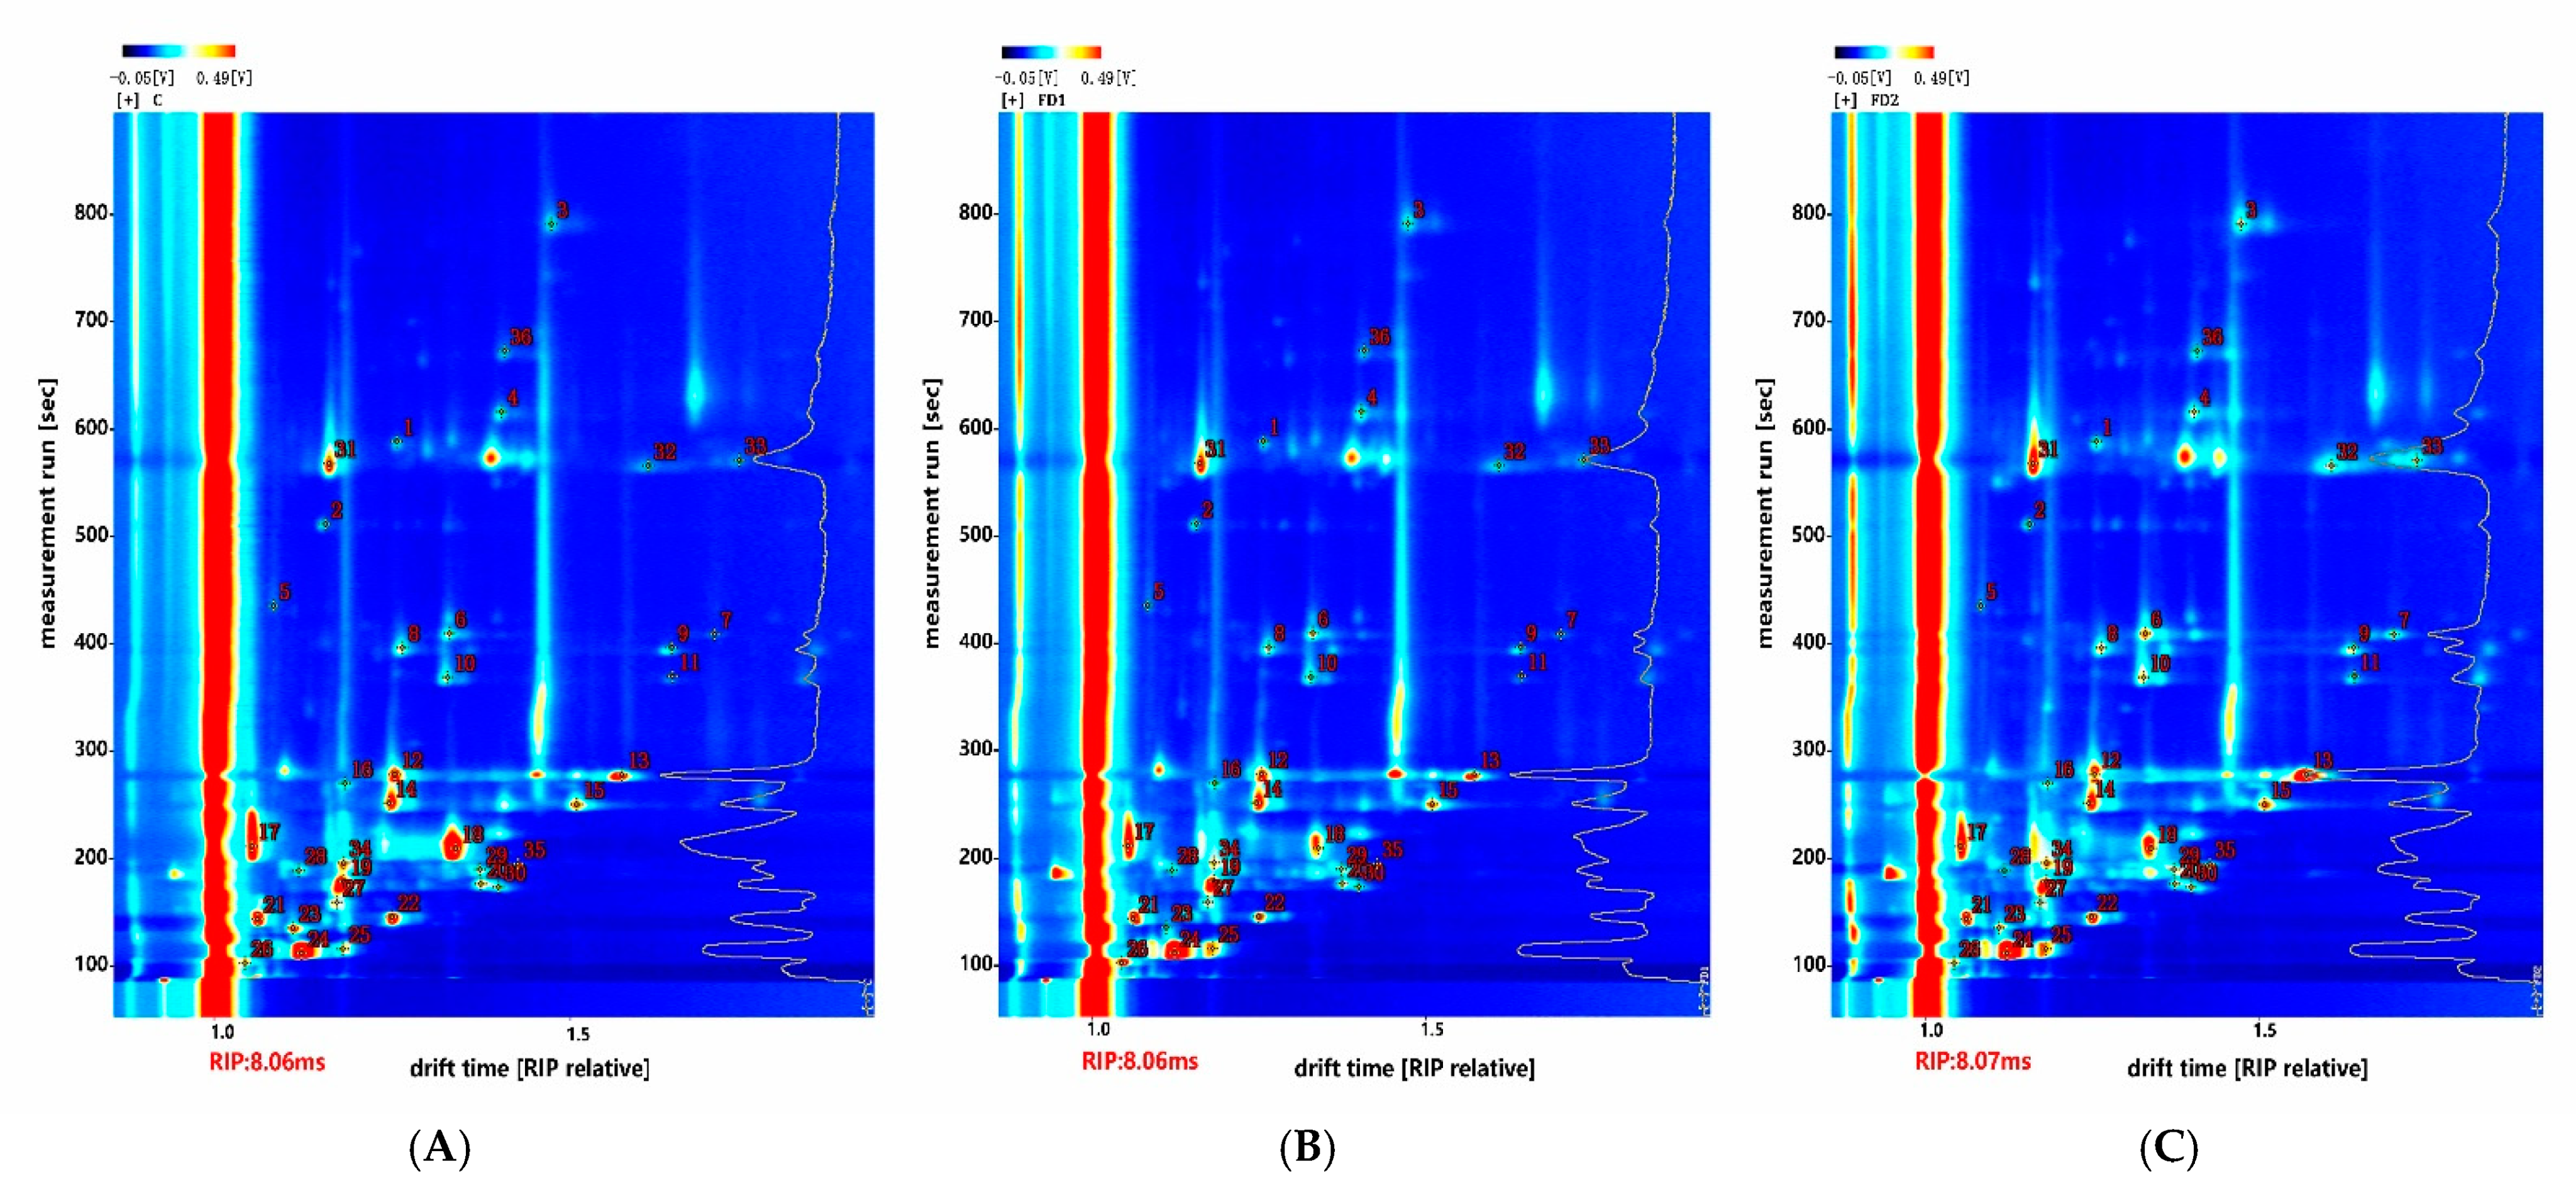
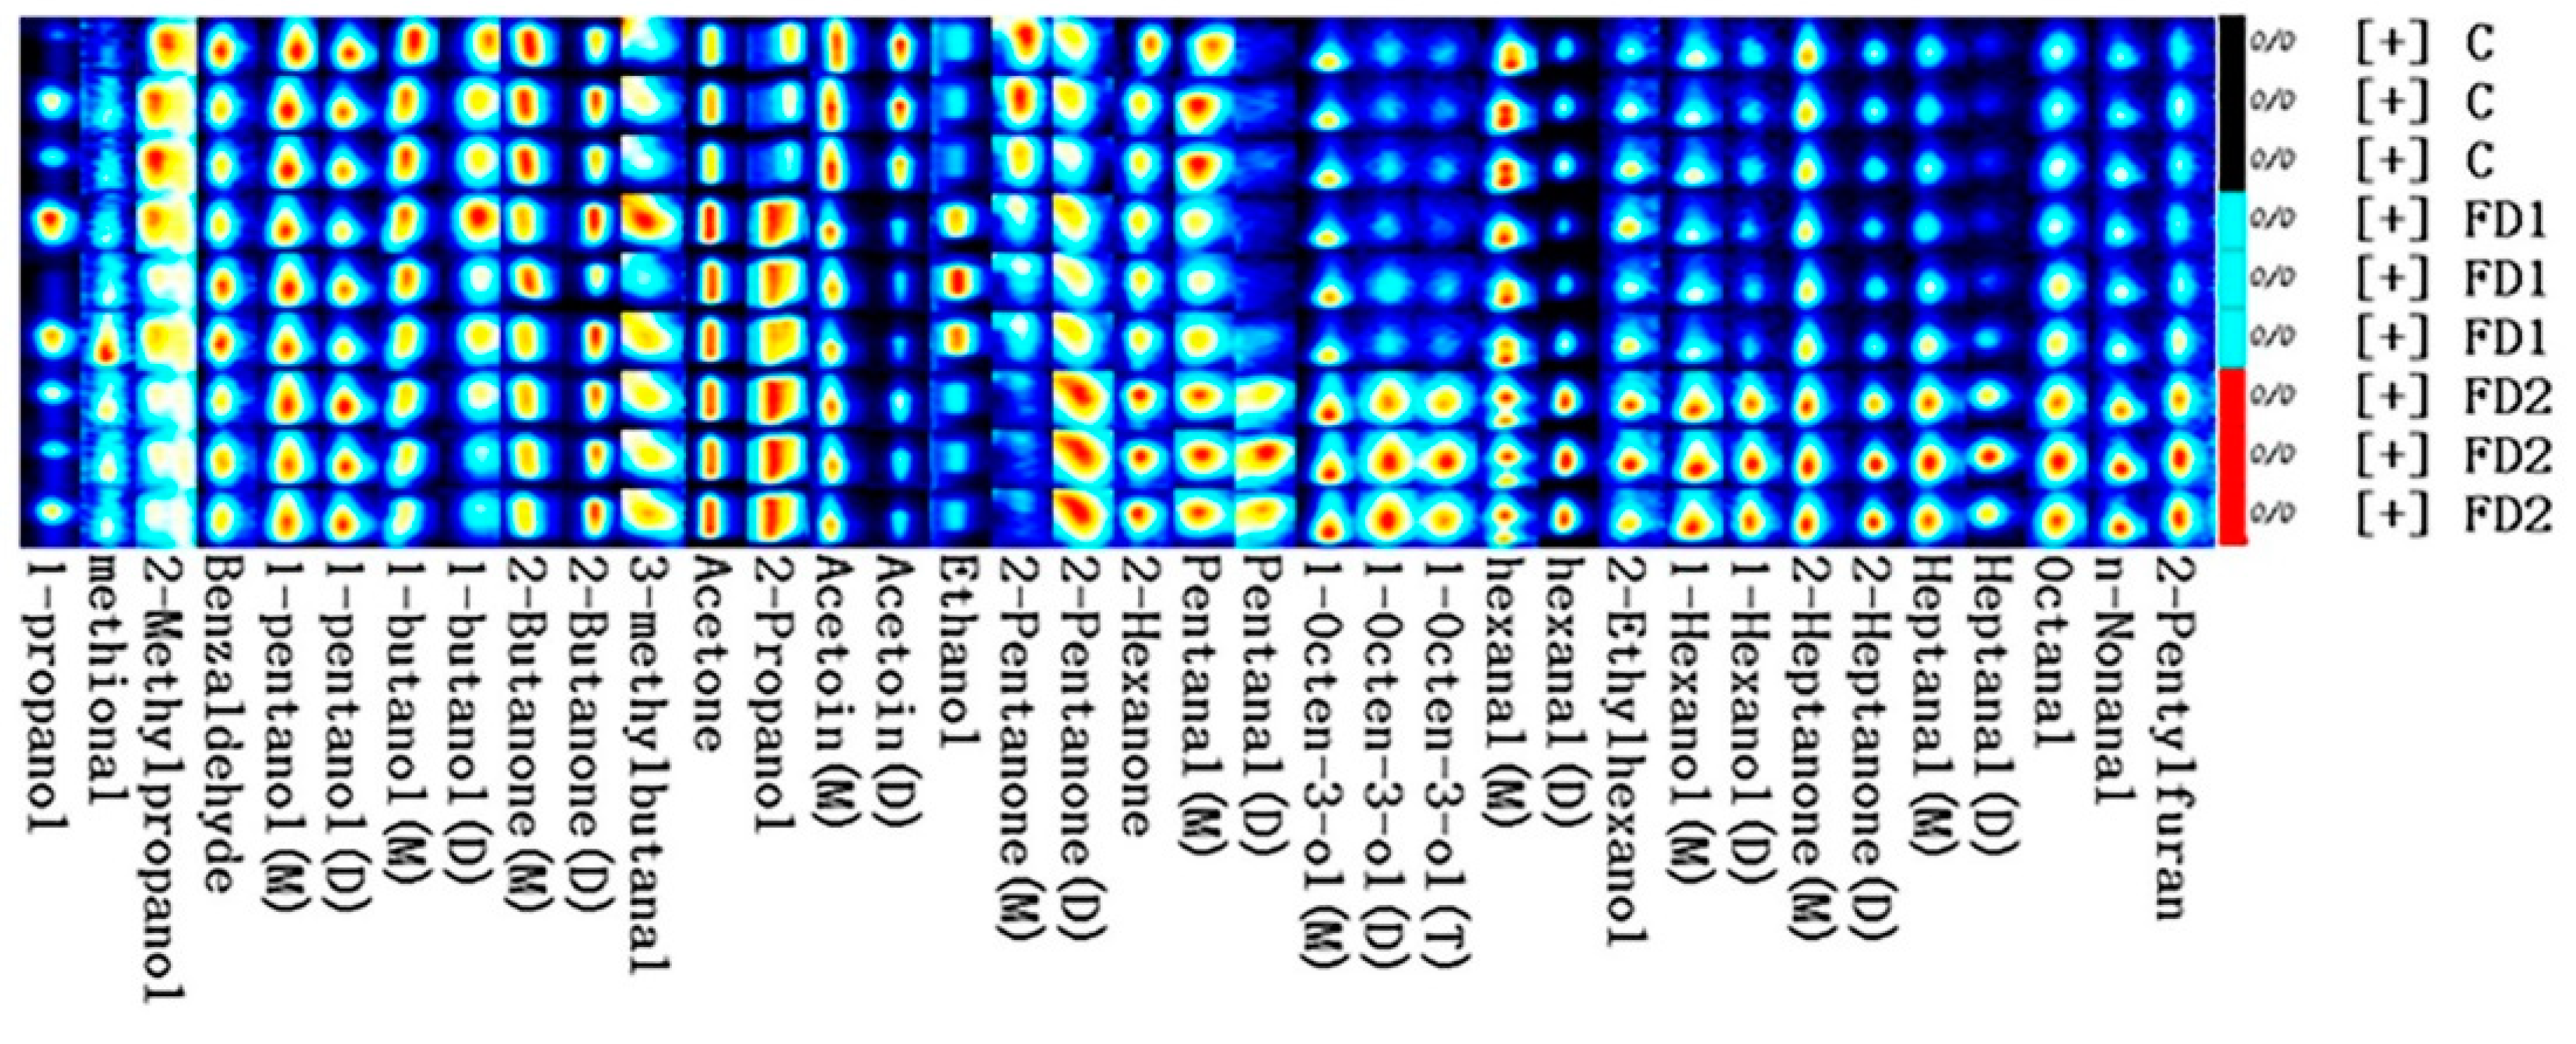
3.4. Volatile Compounds

As shown in Figure 2, the abscissa was used to represent the drift time, and the ordinate was used to represent the retention time. The drift time and retention time were compared to indicate the volatile compounds in the beef sample. Each spot represented a kind of volatile compound. The identified compounds are presented in Table 5. A total of 36 peaks and 24 volatile components were identified from the beef samples of the three groups, including 9 alcohols, 8 aldehydes, 6 ketones and 1 furan. Among them, 11 were dimers of the compounds, and 1 was a trimer of the detected compounds.
To further study the flavor difference between beef samples after adding microalgae, the fingerprints obtained are shown in Figure 3. The fingerprint was formed based on the peak signal. Each row represented the sample, and each column represented the identified volatile compounds. In the fingerprint, the more pronounced color indicated, the higher the content of the flavor substance identified. The contents of 2-propanol and acetone in the FD1 and FD2 groups were much higher than that in the control group. In the FD2 group, it was found that the concentrations of many compounds in beef greatly increased, such as 1-hexanol, 1-octen-3-ol, 2-ethylhexanol, n-nonanal, octanal, heptanal, hexanal (dimer), pentanal (dimer), 2-heptanone and 2-pentylfuran. However, the concentrations of acetoin, 2-pentanone (monomer) and 2-butanone (monomer) were the highest in the control group.

3.5. Sensory Evaluation

The mean scores for sensory evaluation of beef are presented in Table 6. Compared with the beef samples of the control group, the beef samples of the FD1 and FD2 groups showed higher (p < 0.05) scores of initial juiciness, sustained juiciness, flavor intensity, initial tenderness and sustained tenderness, and lower (p < 0.05) scores of residue. There was no observed effect of diet (FD1 or FD2) on off-flavor intensity (p > 0.05). However, the sensory scores between the FD1 and FD2 groups did not show a significant difference (p > 0.05).

4. Discussion

It is known that antioxidant capacity is an important factor in maintaining animal health [32]. As a part of the endogenous antioxidant defense system, antioxidant enzymes played a key role, which could protect cells from oxidative damage by free radicals [33]. A previous study showed that Schizochytrium contained some antioxidants such as β-carotene and vitamin E [15]. SOD directly reacts with free radicals to remove hydrogen peroxide [34], while GSH-Px catalyzes the decomposition of hydrogen peroxide [35]. In this study, compared with the control group, the addition of DHA-rich microalgae increased the T-AOC of beef meat, which indicated that DHA-rich microalgae could improve the antioxidant status of beef. It was found that only the GSH-Px activity in the FD1 group increased in the current study, which suggested that the antioxidants in the microalgae at an appropriate dose might contribute to the stability of the meat after slaughter. Adding DHA-rich microalgae to the diet did not affect the SOD activity of beef. This finding is consistent with La et al. [36], who reported that supplementing the diet with Schizochytrium did not affect the SOD activity in the blood of calves. The content of TBARS is considered to be one of the most accurate indicators for evaluating lipid peroxidation [37]. Since long-chain PUFA was the main target of reactive oxygen species, it was determined that the risk of lipid oxidation of beef was increased [38]. Our results showed that the addition of DHA-rich microalgae in the diet did not affect TBARS. This result could be explained that the increase in antioxidant capacity and endogenous antioxidant enzyme activity (GSH-Px) scavenged free radicals to protect PUFA, resulting in no lipid peroxidation, although the concentration of PUFA of beef meat increased after adding microalgae to the diet.
Meat color is an important indicator for evaluating meat quality, which determines the consumers’ desire to buy [39]. In the present research, no changes in beef meat color between groups were observed, which is consistent with previous studies. They reported that adding DHA-rich Schizochytrium did not affect the animal meat color [40,41,42]. The lack of differences in the ultimate pH between the treatments indicates that the muscle glycogen levels of the beef in the three treatment groups are similar. Drip loss and cooking loss were used to evaluate the water holding capacity of the meat. It should be noted that no difference in water retention was observed between the three treatments. The amount of intramuscular fat is related to eating qualities such as juiciness, tenderness and flavor [43]. Urrutia et al. [44] reported that dietary microalgae changed adipose tissue development and cell structure, which may be an important factor in causing fat deposition in this study. Generally, the strategy of using microalgae as a diet does not affect meat quality parameters [45], but it could improve the fatty acid composition of the meat. This deserves more attention and further research.
With the increase of DHA-rich microalgae supplemented in the diet, the contents of EPA, DHA, EPA + DHA and n-3 PUFA showed a linear increase. As expected, marine resources exhibited the ability to accumulate DHA and EPA contents in meat [46]. There was evidence that adding algae to the diet was easier to obtain DHA deposition than through the desaturation and prolongation pathway of α-Linolenic acid (C18:3 n-3, ALA) [47]. Based on the Australian nutrient reference standard, if the EPA + DHA in red meat exceeds 60 mg/135 g meat, it could be considered as a good source of n-3 [44]. The European standard for a good source of n-3 recognized EPA + DHA as 40 mg and 80 mg/100 g of meat [48]. In this experiment, the content of EPA + DHA in beef (60.30 mg/100 g fresh meat and 80.19 mg/100 g fresh meat) was sufficient to meet this standard, which meant that the beef in this study could provide enough EPA and DHA for the healthy human diet. The balance of the ratio of n-6 and n-3 PUFA is a key factor for maintaining human health [49]. Burghardt et al. reported that the n-6/n-3 PUFA ratio in the human diet should not exceed 4 [50]. In this study, the ideal ratio of n-6/n-3 in beef meat in the FD1 and FD2 groups illustrated that this beef meat could help reduce the risk of cardiovascular and cerebrovascular diseases and certain cancers after being consumed by humans [51]. The changes in fatty acid composition observed in this study may be attributed to the differences in fatty acid metabolism and deposition of beef with different dietary treatments [52]. In addition, in the absence of C18:3 n-6 in the diet, the C18:3 n-6 detected in beef meat may be attributed to the conversion of C18:2 n-6 through elongation and desaturation from certain diets in this experiment [53].
Volatile alcohols, aldehydes and ketones belong to lipid-derived compounds [54]. They are the simplest product of lipid degradation and are formed by the modification of fatty acids after removal from the glycerol backbone [55]. In this experiment, short-chain fatty aldehydes content was found to be the highest in the FD2 group, such as n-nonanal, octanal, heptanal, hexanal and pentanal, and hexanal was the highest amount of them. Most aldehydes are mainly derived from oleic acid (C18:1 n-9) and linoleic acid (C18:2 n-6), but nonanal was only produced from oleic acid [56]. The results clearly illustrate that the high correlation between the flavor compound and fatty acid composition, and the decisive role of lipids in the formation of basic meat flavor. Previous studies showed that aldehydes were the main volatile compounds in beef meat [57,58]. Volatile compounds were mainly affected by diet because the fatty acid composition of meat was changed by diet [59]. Therefore, this also explained the higher aldehyde content in the FD2 group. Hexanal was the main volatile compound in beef meat and directly related to lipid auto-oxidation [60]. The alcohols observed in the experiment were secondary products of aldehydes. The FD1 group showed a higher amount of ethanol. It is interesting that due to the higher alcohol threshold, the contribution to the undesirable flavor of the meat was less [61]. However, the highest content of 1-octen-3-ol in the FD2 group could indicate a mushroom flavor, which could be perceived as a mushroom-related flavor. The highest value of 2-pentylfuran (beany and grassy flavor) was observed in the FD2 group, which could be formed by lipid oxidation and degradation. It was an oxygen-containing heterocyclic compound with a low threshold, resulting in a greater contribution to the overall flavor of the meat [62]. Prior work has shown that ketones were derived from the β-oxidation of free fatty acids increased with fat content in meat [63]. Acetoin (buttery flavor), 2-butanone and 2-pentanone levels in the C group were significantly higher than the other two groups, suggesting that the fat content was reduced by DHA-rich microalgae. To our knowledge, there is no information on the effect of an algae diet on volatile beef compounds. In the current study, high levels of volatile compounds were associated with high levels of DHA in the meat of algae-fed animals.
Most consumers believe that higher fat is related to greater eating satisfaction [64]. This study found that consumers’ liking of tenderness, juiciness and flavor were affected by diet. The aldehydes produced by the Strecker degradation of the Maillard reaction were generally considered to be positive flavors associated with cooking [65]. This is consistent with the results of volatile substances in this study. There was no difference in the off-flavor scores of the three groups, which might be related to the TBARS value in the meat (less than 0.5 mg MDA/kg meat) [66]. This study proved that adding DHA-rich microalgae to the diet could reduce the development of off-flavor by increasing oxidative stability.

5. Conclusions

In conclusion, adding different levels of DHA-rich microalgae to the diet could increase the activity of certain antioxidant enzymes in beef. Our results demonstrate that DHA and EPA levels in meat were enriched by supplementing DHA-rich microalgae. In addition, the reduced ratio of n-6/n-3 was another potential health benefit associated with algae in Schizochytrium sp. At the same time, the supplementation of DHA-rich microalgae enhanced the volatile compounds in beef, especially in the high-dose FD2 group. It is necessary to conduct further research on the metabolites and oxidation mechanism of fatty acids in meat.

Author Contributions

Conceptualization, C.X. and B.S.; methodology, C.X. and F.L.; software, C.X.; validation, S.Z. (Shou Zhang), S.Z. (Songshan Zhang) and L.C.; formal analysis, X.L.; investigation, B.S.; resources, P.X.; data curation, C.X.; writing—original draft preparation, C.X.; writing—review and editing, S.Z. (Songshan Zhang); visualization, S.Z. (Songshan Zhang); supervision, S.Z. (Shou Zhang); project administration, S.Z. (Songshan Zhang) and S.Z. (Shou Zhang); funding acquisition, S.Z. (Shou Zhang). All authors have read and agreed to the published version of the manuscript.

Funding

This research was supported by the Special Basic Research Fund for Central Public Research Institutes (No. 2021-YWF-ZYSQ-07), the Science and Technology research project of Hebei Education Department (BJ2018061), the Program of National Beef Cattle and Yak Industrial Technology System (CARS-37) and the Improvement of Qaidam Beef Meat Quality and the Development and Promotion of Beef Products (2020-QY-217).

Institutional Review Board Statement

All procedures were approved by the Experimental Animal Welfare and Ethical Committee, Institute of Animal Science, Chinese Academy of Agricultural Sciences (IAS2017-2).

Data Availability Statement

Data are available from the corresponding author upon request.

Acknowledgments

The authors would like to thank Hui Li and Ri Hu for their technical support.

Conflicts of Interest

The authors declare no conflict of interest.

References

  1. Li, X.Z.; Yan, C.G.; Zan, L.S. Current situation and future prospects for beef production in China—A review. Asian-Australas J. Anim. Sci. 2018, 31, 984–991. [Google Scholar] [CrossRef]
  2. Toral, P.G.; Hervás, G.; Carreño, D.; Leskinen, H.; Belenguer, A.; Shingfield, K.J.; Frutos, P. In vitro response to EPA, DPA, and DHA: Comparison of effects on ruminal fermentation and biohydrogenation of 18-carbon fatty acids in cows and ewes. J. Dairy Sci. 2017, 100, 6187–6198. [Google Scholar] [CrossRef]
  3. Tocher, D.R.; Betancor, M.B.; Sprague, M.; Olsen, R.E.; Napier, J.A. Omega-3 long-chain polyunsaturated fatty acids, EPA and DHA: Bridging the gap between supply and demand. Nutrients 2019, 11, 89. [Google Scholar] [CrossRef] [Green Version]
  4. Colussi, G.; Catena, C.; Novello, M.; Bertin, N.; Sechi, L.A. Impact of omega-3 polyunsaturated fatty acids on vascular function and blood pressure: Relevance for cardiovascular outcomes. Nutr. Metab. Cardiovasc. Dis. 2017, 27, 191–200. [Google Scholar] [CrossRef]
  5. Kalogeropoulos, N.; Chiou, A.; Gavala, E.; Christea, M.; Andrikopoulos, N.K. Nutritional evaluation and bioactive microconstituents (carotenoids, tocopherols, sterols and squalene) of raw and roasted chicken fed on DHA-rich microalgae. Food Res. Int. 2010, 43, 2006–2013. [Google Scholar] [CrossRef]
  6. Lagarde, M. Docosahexaenoic acid: Nutrient and precursor of bioactive lipids. Eur. J. Lipid. Sci. Technol. 2008, 110, 673–678. [Google Scholar] [CrossRef]
  7. Plourde, M.; Cunnane, S.C. Extremely limited synthesis of long chain polyunsaturates in adults: Implications for their dietary essentiality and use as supplements. Appl. Physiol. Nutr. Metab. 2007, 32, 619–634. [Google Scholar] [CrossRef] [Green Version]
  8. Bryhni, E.A.; Kjos, N.P.; Ofstad, R.; Hunt, M. Polyunsaturated fat and fish oil in diets for growing-finishing pigs: Effects on fatty acid composition and meat, fat, and sausage quality. Meat Sci. 2002, 62, 1–8. [Google Scholar] [CrossRef]
  9. Kahraman, R.; Özpınar, H.; Abas, İ.; Kutay, H.C.; Eseceli, H.; Grashorn, M. Effects of different dietary oil sources on fatty acid composition and malondialdehyde levels of thigh meat in broiler chickens. Arch. Geflugelkd. 2004, 68, 77–86. [Google Scholar]
  10. Wood, J.D.; Enser, M.; Fisher, A.V.; Nute, G.R.; Sheard, P.R.; Richardson, R.I.; Hughes, S.I.; Whittington, F.M. Fat deposition, fatty acid composition and meat quality: A review. Meat Sci. 2008, 78, 343–358. [Google Scholar] [CrossRef] [PubMed]
  11. Madeira, M.S.; Cardoso, C.; Lopes, P.A.; Coelho, D.; Afonso, C.; Bandarra, N.M.; Prates, J.A. Microalgae as feed ingredients for livestock production and meat quality: A review. Livest. Sci. 2017, 205, 111–121. [Google Scholar] [CrossRef]
  12. Altomonte, I.; Salari, F.; Licitra, R.; Martini, M. Use of microalgae in ruminant nutrition and implications on milk quality—A review. Livest. Sci. 2018, 214, 25–35. [Google Scholar] [CrossRef]
  13. Mastellone, V.; Morittu, V.M.; Musco, N.; Spina, A.A.; Malgeri, A.; Molinari, M.L.; D’Aniello, B.; Infascelli, F.; Tudisco, R.; Lombardi, P. Dietary supplementation with a phytocomplex affects blood parameters and milk yield and quality in grazing goats. Small Ruminant Res. 2021, 201, 106421. [Google Scholar] [CrossRef]
  14. Caporgno, M.P.; Mathys, A. Trends in microalgae incorporation into innovative food products with potential health benefits. Front. Nutr. 2018, 5, 58. [Google Scholar] [CrossRef]
  15. Long, S.F.; Kang, S.; Wang, Q.Q.; Xu, Y.T.; Pan, L.; Hu, J.X.; Li, M.; Piao, X.S. Dietary supplementation with DHA-rich microalgae improves performance, serum composition, carcass trait, antioxidant status, and fatty acid profile of broilers. Poult. Sci. 2018, 97, 1881–1890. [Google Scholar] [CrossRef] [PubMed]
  16. Abdelnour, S.A.; Sheiha, A.M.; Taha, A.E.; Swelum, A.A.; Alarifi, S.; Alkahtani, S.; Ali, D.; AlBasher, G.; Almeer, R.; Falodah, F.; et al. Impacts of enriching growing rabbit diets with chlorella vulgaris microalgae on growth, blood variables, carcass traits, immunological and antioxidant indices. Animals 2019, 9, 788. [Google Scholar] [CrossRef] [Green Version]
  17. El-Bahr, S.; Shousha, S.; Shehab, A.; Khattab, W.; Ahmed-Farid, O.; Sabike, I.; El-Garhy, O.; Albokhadaim, I.; Albosadah, K. Effect of dietary microalgae on growth performance, profiles of amino and fatty acids, antioxidant status, and meat quality of broiler chickens. Animals 2020, 10, 761. [Google Scholar] [CrossRef]
  18. Holman, B.W.B.; Malau-Aduli, A.E.O. Spirulina as a livestock supplement and animal feed. J. Anim. Physiol. Anim. Nutr. 2013, 97, 615–623. [Google Scholar] [CrossRef] [Green Version]
  19. Abril, R.; Garrett, J.; Zeller, S.G.; Sander, W.J.; Mast, R.W. Safety assessment of DHA-rich microalgae from Schizochytrium sp. Part V: Target animal safety/toxicity study in growing swine. Regul. Toxicol. Pharmacol. 2003, 37, 73–82. [Google Scholar] [CrossRef]
  20. Li, M.H.; Robinson, E.H.; Tucker, C.S.; Manning, B.B.; Khoo, L. Effects of dried algae Schizochytrium sp., a rich source of docosahexaenoic acid, on growth, fatty acid composition, and sensory quality of channel catfish Ictalurus punctatus. Aquaculture 2009, 292, 232–236. [Google Scholar] [CrossRef]
  21. Demeda, M.A.; Tomaluski, C.R.; Baggio, C.; Mateus, K.A.; Petrolli, T.G.; Mueller, L.F.; Pereira, A.S.C.; Griebler, L.; Zotti, C.A. Feeding microalgae (Schizochytrium limacinum) to beef steers increases meat omega-3 content. Res. Soc. Dev. 2020, 9, e675974568. [Google Scholar] [CrossRef]
  22. de Lima Valença, R.; da Silva Sobrinho, A.G.; Borghi, T.H.; Meza, D.A.R.; de Andrade, N.; Silva, L.G.; Bezerra, L.R. Performance, carcass traits, physicochemical properties and fatty acids composition of lamb’s meat fed diets with marine microalgae meal (Schizochytrium sp.). Livest. Sci. 2021, 243, 104387. [Google Scholar] [CrossRef]
  23. Do Nascimento, T.C.; Cazarin, C.B.; Marostica, M.R., Jr.; Risso, É.M.; Amaya-Farfan, J.; Grimaldi, R.; Mercadante, A.Z.; Jacob-Lopes, E.; Zepka, L.Q. Microalgae biomass intake positively modulates serum lipid profile and antioxidant status. J. Funct. Foods 2019, 58, 11–20. [Google Scholar] [CrossRef]
  24. AOAC. Official Methods of Analysis, 18th ed.; Association of Official Analytical Chemists: Gaithersburg, MD, USA, 2005; pp. 12–13. [Google Scholar]
  25. Van Soest, P.V.; Robertson, J.B.; Lewis, B. Methods for dietary fiber, neutral detergent fiber, and nonstarch polysaccharides in relation to animal nutrition. J. Dairy Sci. 1991, 74, 3583–3597. [Google Scholar] [CrossRef]
  26. Li, S.; Ji, H.; Zhang, B.; Tian, J.; Zhou, J.; Yu, H. Influence of black soldier fly (Hermetia illucens) larvae oil on growth performance, body composition, tissue fatty acid composition and lipid deposition in juvenile Jian carp (Cyprinus carpio var. Jian). Aquaculture 2016, 465, 43–52. [Google Scholar] [CrossRef]
  27. Honikel, K.O. Reference methods for the assessment of physical characteristics of meat. Meat Sci. 1998, 49, 447–457. [Google Scholar] [CrossRef]
  28. Fabre, R.; Dalzotto, G.; Perlo, F.; Bonato, P.; Teira, G.; Tisocco, O. Cooking method effect on Warner-Bratzler shear force of different beef muscles. Meat Sci. 2018, 138, 10–14. [Google Scholar] [CrossRef]
  29. Ponnampalam, E.N.; Butler, K.L.; Pearce, K.M.; Mortimer, S.I.; Pethick, D.W.; Ball, A.J.; Hopkins, D.L. Sources of variation of health claimable long chain omega-3 fatty acids in meat from Australian lamb slaughtered at similar weights. Meat Sci. 2014, 96, 1095–1103. [Google Scholar] [CrossRef]
  30. Aldai, N.; Lavín, P.; Kramer, J.K.; Jaroso, R.; Mantecón, A.R. Breed effect on quality veal production in mountain areas: Emphasis on meat fatty acid composition. Meat Sci. 2012, 92, 687–696. [Google Scholar] [CrossRef] [Green Version]
  31. Xu, C.C.; Yu, H.; Xie, P.; Sun, B.Z.; Wang, X.Y.; Zhang, S.S. Influence of electrostatic field on the quality attributes and volatile flavor compounds of dry-cured beef during chill storage. Foods 2020, 9, 478. [Google Scholar] [CrossRef] [PubMed]
  32. Lee, M.T.; Lin, W.C.; Yu, B.; Lee, T.T. Antioxidant capacity of phytochemicals and their potential effects on oxidative status in animals—A review. Asian-Australas J. Anim. Sci. 2017, 30, 299. [Google Scholar] [CrossRef]
  33. Ighodaro, O.M.; Akinloye, O.A. First line defence antioxidants-superoxide dismutase (SOD), catalase (CAT) and glutathione peroxidase (GPX): Their fundamental role in the entire antioxidant defence grid. J. Clin. Investig. 2018, 54, 287–293. [Google Scholar] [CrossRef] [Green Version]
  34. Delles, R.M.; Xiong, Y.L.; True, A.D.; Ao, T.; Dawson, K.A. Dietary antioxidant supplementation enhances lipid and protein oxidative stability of chicken broiler meat through promotion of antioxidant enzyme activity. Poult Sci. 2014, 93, 1561–1570. [Google Scholar] [CrossRef]
  35. Mirzaie, S.; Zirak-Khattab, F.; Hosseini, S.A.; Donyaei-Darian, H. Effects of dietary Spirulina on antioxidant status, lipid profile, immune response and performance characteristics of broiler chickens reared under high ambient temperature. Asian-Australas J. Anim. Sci. 2018, 31, 556. [Google Scholar] [CrossRef] [PubMed]
  36. La, A.L.T.Z.; Pierce, K.M.; Liu, W.H.; Gao, S.T.; Bu, D.P.; Ma, L. Supplementation with Schizochytrium sp. enhances growth performance and antioxidant capability of dairy calves before weaning. Anim. Feed Sci. Technol. 2021, 271, 114779. [Google Scholar]
  37. Wang, B.; Xu, C.; Liu, C.; Qu, Y.; Zhang, H.; Luo, H. The effect of dietary lycopene supplementation on drip loss during storage of lamb meat by iTRAQ analysis. Antioxidants 2021, 10, 198. [Google Scholar] [CrossRef] [PubMed]
  38. Xiao, F.; Xing, J.; Li, H.; Xu, X.; Hu, Z.; Ji, H. Effects of the defatted Schizochytrium sp. on growth performance, fatty acid composition, histomorphology and antioxidant status of juvenile mirror carp (Cyprinus carpio var. specularis). Aquac. Res. 2021, 3, 3062–3076. [Google Scholar] [CrossRef]
  39. Zhang, Y.; Holman, B.W.; Mao, Y.; Chen, X.; Luo, X.; Hopkins, D.L.; Zhang, Y. Determination of a pH threshold for dark cutting beef based on visual evaluation by Asian consumers. Meat Sci. 2021, 172, 108347. [Google Scholar] [CrossRef]
  40. Ribeiro, T.; Lordelo, M.M.; Alves, S.P.; Bessa, R.J.B.; Costa, P.; Lemos, J.P.C.; Ferreira, L.M.A.; Fontes, C.M.G.A.; Prates, J.A.M. Direct supplementation of diet is the most efficient way of enriching broiler meat with n-3 long-chain polyunsaturated fatty acids. Br. Poult. Sci. 2013, 54, 753–765. [Google Scholar] [CrossRef]
  41. Hopkins, D.L.; Clayton, E.H.; Lamb, T.A.; Van de Ven, R.J.; Refshauge, G.; Kerr, M.J.; Bailes, K.; Lewandowski, P.; Ponnampalam, E.N. The impact of supplementing lambs with algae on growth, meat traits and oxidative status. Meat Sci. 2014, 98, 135–141. [Google Scholar] [CrossRef]
  42. Sardi, L.; Martelli, G.; Lambertini, L.; Parisini, P.; Mordenti, A. Effects of a dietary supplement of DHA-rich marine algae on Italian heavy pig production parameters. Livest. Sci. 2006, 103, 95–103. [Google Scholar] [CrossRef]
  43. Pannier, L.; Gardner, G.E.; Pearce, K.L.; McDonagh, M.; Ball, A.J.; Jacob, R.H.; Pethick, D.W. Associations of sire estimated breeding values and objective meat quality measurements with sensory scores in Australian lamb. Meat Sci. 2014, 96, 1076–1087. [Google Scholar] [CrossRef] [PubMed]
  44. Urrutia, O.; Mendizabal, J.A.; Insausti, K.; Soret, B.; Purroy, A.; Arana, A. Effects of addition of linseed and marine algae to the diet on adipose tissue development, fatty acid profile, lipogenic gene expression, and meat quality in lambs. PLoS ONE 2016, 11, e0156765. [Google Scholar] [CrossRef] [Green Version]
  45. Kalbe, C.; Priepke, A.; Nürnberg, G.; Dannenberger, D. Effects of long-term microalgae supplementation on muscle microstructure, meat quality and fatty acid composition in growing pigs. J. Anim. Phys. Anim. Nutri. 2019, 103, 574–582. [Google Scholar] [CrossRef] [PubMed]
  46. Givens, D.I.; Kliem, K.E.; Gibbs, R.A. The role of meat as a source of n−3 polyunsaturated fatty acids in the human diet. Meat Sci. 2006, 74, 209–218. [Google Scholar] [CrossRef]
  47. Nutrition Information Requirements. Available online: http://www.foodstandards.gov.au/foodstandards/userguides/nutritioninformation1406.cfm (accessed on 20 July 2016).
  48. Commission Regulation of European Union. Amending Regulation (EC) No 1924/2006 of the European Parliament and of the Council with regard to the list of nutrition claims. Off. J. Eur. Union. 2010, 37, 16–18. [Google Scholar]
  49. Calder, P.C. Very long-chain n-3 fatty acids and human health: Fact, fiction and the future. Proc. Nutr. Soc. 2018, 77, 52–72. [Google Scholar] [CrossRef] [Green Version]
  50. Burghardt, P.R.; Kemmerer, E.S.; Buck, B.J.; Osetek, A.J.; Yan, C.; Koch, L.G.; Britton, S.L.; Evans, S.J. Dietary n-3: n-6 fatty acid ratios differentially influence hormonal signature in a rodent model of metabolic syndrome relative to healthy controls. Nutr. Metab. 2010, 7, 1–6. [Google Scholar] [CrossRef] [PubMed] [Green Version]
  51. Jiang, Z.Y.; Xu, C.Y.; Chang, X.X.; Li, W.W.; Sun, L.Y.; Yang, X.B.; Yu, L.F. Fatty liver index correlates with non-alcoholic fatty liver disease, but not with newly diagnosed coronary artery atherosclerotic disease in Chinese patients. BMC Gastroenterol. 2013, 13, 1–6. [Google Scholar] [CrossRef] [Green Version]
  52. Kumar, F.; Tyagi, P.K.; Mir, N.A.; Dev, K.; Begum, J.; Biswas, A.; Sheikh, H.; Tyagi, P.; Sharma, D.; Sahu, B.; et al. Dietary flaxseed and turmeric is a novel strategy to enrich chicken meat with long chain ω-3 polyunsaturated fatty acids with better oxidative stability and functional properties. Food Chem. 2020, 305, 125458. [Google Scholar] [CrossRef]
  53. Rymer, C.; Gibbs, R.A.; Givens, D.I. Comparison of algal and fish sources on the oxidative stability of poultry meat and its enrichment with omega-3 polyunsaturated fatty acids. Poult. Sci. 2010, 89, 150–159. [Google Scholar] [CrossRef]
  54. Zhao, J.; Wang, M.; Xie, J.; Zhao, M.; Hou, L.; Liang, J.; Wang, S.; Cheng, J. Volatile flavor constituents in the pork broth of black-pig. Food Chem. 2017, 226, 51–60. [Google Scholar] [CrossRef]
  55. Kerth, C.R.; Miller, R.K. Beef flavor: A review from chemistry to consumer. J. Sci. Food Agric. 2015, 95, 2783–2798. [Google Scholar] [CrossRef] [PubMed]
  56. Jiang, T.; Busboom, J.R.; Nelson, M.L.; Mengarelli, R. Omega-3 fatty acids affected human perception of ground beef negatively. Meat Sci. 2011, 89, 390–399. [Google Scholar] [CrossRef]
  57. Piao, M.Y.; Yong, H.I.; Lee, H.J.; Fassah, D.M.; Kim, H.J.; Jo, C.; Baik, M. Comparison of fatty acid profiles and volatile compounds among quality grades and their association with carcass characteristics in longissimus dorsi and semimembranosus muscles of Korean cattle steer. Livest. Sci. 2017, 198, 147–156. [Google Scholar] [CrossRef]
  58. Utama, D.T.; Lee, C.W.; Park, Y.S.; Jang, A.; Lee, S.K. Comparison of meat quality, fatty acid composition and aroma volatiles of Chikso and Hanwoo beef. Asian-Australas J. Anim. Sci. 2018, 31, 1500. [Google Scholar] [CrossRef] [PubMed] [Green Version]
  59. Vasta, V.; Priolo, A. Ruminant fat volatiles as affected by diet. A review. Meat Sci. 2006, 73, 218–228. [Google Scholar] [CrossRef]
  60. Morán, L.; Giráldez, F.J.; Panseri, S.; Aldai, N.; Jordán, M.J.; Chiesa, L.M.; Andrés, S. Effect of dietary carnosic acid on the fatty acid profile and flavour stability of meat from fattening lambs. Food Chem. 2013, 138, 2407–2414. [Google Scholar] [CrossRef]
  61. Brewer, M.S. Irradiation effects on meat flavor: A review. Meat Sci. 2009, 81, 1–14. [Google Scholar] [CrossRef]
  62. Song, S.; Tang, Q.; Fan, L.; Xu, X.; Song, Z.; Hayat, K.; Feng, T.; Wang, Y. Identification of pork flavour precursors from enzyme-treated lard using Maillard model system assessed by GC–MS and partial least squares regression. Meat Sci. 2017, 124, 15–24. [Google Scholar] [CrossRef]
  63. Legako, J.F.; Dinh, T.T.N.; Miller, M.F.; Adhikari, K.; Brooks, J.C. Consumer palatability scores, sensory descriptive attributes, and volatile compounds of grilled beef steaks from three USDA Quality Grades. Meat Sci. 2016, 112, 77–85. [Google Scholar] [CrossRef] [PubMed]
  64. Lee, Y.; Lee, B.; Kim, H.K.; Yun, Y.K.; Kang, S.J.; Kim, K.T.; Kim, B.D.; Kim, E.J.; Choi, Y.M. Sensory quality characteristics with different beef quality grades and surface texture features assessed by dented area and firmness, and the relation to muscle fiber and bundle characteristics. Meat Sci. 2018, 145, 195–201. [Google Scholar] [CrossRef] [PubMed]
  65. Chail, A.; Legako, J.F.; Pitcher, L.R.; Ward, R.E.; Martini, S.; MacAdam, J.W. Consumer sensory evaluation and chemical composition of beef gluteus medius and triceps brachii steaks from cattle finished on forage or concentrate diets. J. Anim. Sci. 2017, 95, 1553–1564. [Google Scholar] [PubMed]
  66. Coelho, D.; Pestana, J.; Almeida, J.M.; Alfaia, C.M.; Fontes, C.M.; Moreira, O.; Prates, J.A. A high dietary incorporation level of Chlorella vulgaris improves the nutritional value of pork fat without impairing the performance of finishing pigs. Animals 2020, 10, 2384. [Google Scholar] [CrossRef] [PubMed]
Figure 1. The influence of dietary DHA-rich microalgae on the activities of (A) T-AOC, (B) SOD, (C) GSH-Px and (D) TBARS of beef. C = control group; FD1 = 100 g microalgae powder per bull per day of basal diet; FD2 = 200 g microalgae powder per bull per day of basal diet. Different letters indicate significant differences due to DHA-rich microalgae supplementation levels (p < 0.05).
Animals 11 03517 g001
Figure 2. Ion migration spectra of beef meat under different treatments. RIP, reactive ion peak. (A) C, control group; (B) FD1, 100 g microalgae powder per bull per day of basal diet; (C) FD2, 200 g microalgae powder per bull per day of basal diet.
Animals 11 03517 g002
Figure 3. Gallery plots of volatile compounds of beef treated with different levels of DHA-rich microalgae. All signal strengths are expressed in color. The redder the spot indicates the greater the amount of volatile compounds detected. C, control group; FD1, 100 g microalgae powder per bull per day of basal diet; FD2, 200 g microalgae powder per bull per day of basal diet.
Animals 11 03517 g003
Table 1. Ingredients and chemical compositions of experimental diets.
Ingredients (g/kg Fed Basis)Chemical Composition (g/kg DM Basis) 2
Oat Hay200Crude protein122.0
Alfalfa hay400Neutral detergent fiber315.5
Corn216Acid detergent fiber 169.0
Wheat bran24Calcium5.2
Wheat distillers dried grains with solubles20Phosphorus4.0
Soybean meal48Net energy/(MJ/kg) 35.3
Rapeseed meal40
Cottonseed meal16
Jujube powder12
Fatty Acid Calcium4
Sodium Chloride4
Mineral and vitamin premix 116
Fatty Acids, mg/g Diet
C14:00.13C16:10.10
C15:00.02C18:1 n-912.08
C16:09.19C18:2 n-616.44
C17:00.05C18:3 n-3 (ALA)0.94
C18:01.03C20:10.16
C20:00.17C20:2 n-60.01
C21:00.02C20:5 n-3 (EPA)0.02
C22:00.10
DM, dry matter; ALA, α-linolenic acid; EPA, eicosapentaenoic acid. 1 Vitamin and mineral premix supplied each kg of feeds with Vitamin A 4000 IU; Vitamin D3 300 IU; Vitamin E 45 IU; Cu 8 mg; Fe 48 mg; Mn 30 mg; Zn 25 mg; I 0.2 mg; Se 0.3 mg; Co 0.12 mg. 2 Analyzed value. 3 Calculated value.
Table 2. The fatty acid composition of Schizochytrium sp. used in diets.
Fatty Acid, mg/g Dried Powder
C14:01.96
C15:05.07
C16:073.04
C17:04.33
C18:03.26
C20:00.84
C21:00.02
C22:00.53
C23:00.11
C16:10.56
C18:1 n-90.03
C20:10.06
C18:2 n-60.15
C20:2 n-60.24
C18:3 n-3 (ALA)0.97
C20:3 n-60.82
C20:4 n-60.59
C20:5 n-3 (EPA)1.90
C22:6 n-3 (DHA)202.62
ALA, α-linolenic acid; EPA, eicosapentaenoic acid; DHA, docosahexaenoic acid.
Table 3. The influence of dietary DHA-rich microalgae on the physicochemical quality of beef meat.
ItemTreatmentsSEMp-Value
CFD1FD2
L* 30.0729.5229.731.720.66
a* 15.1714.3415.732.510.64
b* 6.376.726.941.670.84
C* 16.4715.9317.232.660.70
H*22.5125.6023.615.170.59
pH6.16.046.190.5220.885
Drip loss (%)1.971.781.560.440.294
Cooking loss (%)0.290.310.260.040.126
Protein (g/100 g)23.8423.5923.911.110.875
Fat (g/100 g)1.35 b1.76 a1.82 a0.270.047
SEM, standard error of means. C, control group; FD1, 100 g microalgae powder per bull per day of basal diet; FD2, 200 g microalgae powder per bull per day of basal diet. a,b Means within a row with different superscripts differ (p < 0.05).
Table 4. The influence of dietary DHA-rich microalgae on fatty acid profiles of beef meat.
Item
(mg/100 g Fresh Meat)
TreatmentsSEMp-Value
CFD1FD2
C14:017.6423.0024.998.110.297
C15:06.857.348.861.660.111
C16:0248.47 b327.77 a336.94 a59.860.042
C17:014.3919.1119.064.640.164
C18:0236.01331.83357.4286.440.065
C20:02.86 b3.35 ab4.41 a0.970.041
C21:01.711.891.390.530.285
C22:00.080.070.070.010.752
C23:01.011.111.160.190.386
SFA529.03 b715.48 a754.29 a111.740.007
C15:182.8890.4486.8517.870.768
C16:120.08 b27.86 a,b36.46 a7.120.004
C18:1 n-9213.31222.08286.4591.730.347
C20:11.881.901.980.640.962
C22:11.601.632.020.450.230
MUFA319.75343.92413.76104.800.301
C18:2 n-6165.56176.09160.4335.640.744
C18:3 n-61.291.541.200.280.128
C18:3 n-3 (ALA)5.31 b6.33 a6.82 a0.740.009
C20:2 n-65.095.025.681.260.614
C20:3 n-613.3911.8611.162.310.261
C20:4 n-673.7674.4885.729.910.096
C20:5 n-3 (EPA)3.46 c12.34 b18.87 a2.44<0.001
C22:6 n-3 (DHA)7.33 c60.30 b80.19 a5.24<0.001
PUFA275.19 b351.51 a370.09 a36.860.001
n-6 PUFA259.10268.98264.2036.540.897
n-3 PUFA16.10 c78.97 b105.89 a6.19<0.001
EPA + DHA10.79 c72.64 b99.06 a6.28<0.001
n-6/n-316.15 a3.43 b2.52 b1.13<0.001
SEM, standard error of means; SFA, saturated fatty acids; MUFA, monounsaturated fatty acids; PUFA, polyunsaturated fatty acids; DHA, docosahexaenoic acid; EPA, eicosapentaenoic acid; C, control group; FD1, 100 g microalgae powder per bull per day of basal diet; FD2, 200 g microalgae powder per bull per day of basal diet. Within a row, values with different superscript letters are significantly different. Different superscripts within a row differ significantly (p < 0.05). SFA = C14:0 + C15:0 + C16:0 + C17:0 + C18:0 + C20:0 + C21:0 + C22:0 + C23:0. MUFA = C15:1 + C16:1 + C18:1 n-9 + C20:1 + C22:1. PUFA = C18:2 n-6 + C18:3 n-6 + C20:2 n-6 + C20:3 n-6 + C20:4 n-6 + C18:3 n-3 + C20:5 n-3 + C22:6 n-3. n-6 PUFA = C18:2 n-6 + C18:3 n-6 + C20:2 n-6 + C20:3 n-6 + C20:4 n-6. n-3 PUFA = C18:3 n-3 + C20:5 n-3 + C22:6 n-3.
Table 5. The information on identified volatile compounds of beef meat (36 peaks for 24 compounds).
NumberCompoundCAS#FormulaMWRIRt [s]Dt [ms]
12-PentylfuranC3777693C9H14O138.2995.0588.1951.25804
2BenzaldehydeC100527C7H6O106.1958.7511.4891.15827
3n-NonanalC124196C9H18O142.21103.3790.9231.47531
4OctanalC124130C8H16O128.21011.5616.1931.40526
5MethionalC3268493C4H8OS104.2916.8435.2721.08542
6Heptanal (Monomer)C111717C7H14O114.2900.6409.0091.33262
7Heptanal (Dimer)C111717C7H14O114.2900.0408.0541.7041
82-heptanone (Monomer)C110430C7H14O114.2892.3396.1161.26633
92-Heptanone (Dimer)C110430C7H14O114.2891.9395.6391.64334
101-Hexanol (Monomer)C111273C6H14O102.2871.8368.4211.32986
111-Hexanol (Dimer)C111273C6H14O102.2872.1368.8981.64472
12Hexanal (Monomer)C66251C6H12O100.2792.4278.2261.25507
13Hexanal (Dimer)C66251C6H12O100.2791.8277.6021.57443
141-Pentanol (Monomer)C71410C5H12O88.1764.5251.3541.24767
151-Pentanol (Dimer)C71410C5H12O88.1762.4249.4791.51031
162-HexanoneC591786C6H12O100.2783.7269.791.18602
17Acetoin (Monomer)C513860C4H8O288.1716.1210.4191.05532
18Acetoin (Dimer)C513860C4H8O288.1713.6208.5441.34015
191-Butanol (Monomer)C71363C4H10O74.1663.8177.9221.18356
201-Butanol (Dimer)C71363C4H10O74.1659.9176.0471.37591
212-Butanone (Monomer)C78933C4H8O72.1581.6142.6121.06395
222-Butanone (Dimer)C78933C4H8O72.1588.9145.4241.25137
231-PropanolC71238C3H8O60.1560.7134.81.11204
24AcetoneC67641C3H6O58.1489.8111.3641.1256
252-PropanolC67630C3H8O60.1501.1114.8021.18232
26EthanolC64175C2H6O46.1458.3102.3031.04546
272-MethylpropanolC78831C4H10O74.1620.3158.2361.17492
282-Pentanone (Monomer)C107879C5H10O86.1685.3188.5461.12067
292-Pentanone (Dimer)C107879C5H10O86.1685.8188.781.37521
303-MethylbutanalC590863C5H10O86.1652.1172.4211.40027
311-Octen-3-ol (Monomer)C3391864C8H16O128.2985.9567.8571.16379
321-Octen-3-ol (Dimer)C3391864C8H16O128.2984.8565.5841.61059
331-Octen-3-ol (Trimer)C3391864C8H16O128.2987.3571.041.73824
34Pentanal (Monomer)C110623C5H10O86.1695.9195.4211.18443
35Pentanal (Dimer)C110623C5H10O86.1694.3194.2281.42808
362-EthylhexanolC104767C8H18O130.21043.5672.1221.40894
CAS#, the registration number of chemical substances; MW, molecular mass; RI, retention index; Rt, retention; Dt, drift time.
Table 6. Effect of dietary DHA-rich microalgae on sensory characteristics of beef.
ItemTreatmentsSEMp-Value
CFD1FD2
Initial juiciness5.13 b6.19 a6.21 a0.560.006
Sustained juiciness4.94 b5.94 a6.10 a0.630.012
Flavor intensity5.48 b6.33 a6.44 a0.450.004
Off-flavor intensity2.172.002.310.280.187
Initial tenderness5.52 b6.33 a6.50 a0.600.029
Sustained tenderness5.63 b6.35 a6.42 a0.560.049
Residue3.68 a3.21 b3.10 b0.340.022
SEM, standard error of means. C, control group; FD1, 100 g microalgae powder per bull per day of basal diet; FD2, 200 g microalgae powder per bull per day of basal diet. a,b Means within a row with different superscripts differ (p < 0.05).
Publisher’s Note: MDPI stays neutral with regard to jurisdictional claims in published maps and institutional affiliations.

