The Impact of Genotype and Age on Energy and Protein Utilization in Individually Housed Brown Laying Hens


Abstract
:Simple Summary
Abstract
1. Introduction
2. Materials and Methods
2.1. Experiment 1
2.2. Experiment 2
2.3. Statistical Analysis
2.4. Comparison between Experiments
3. Results
3.1. Experiment 1
3.2. Experiment 2
3.3. Comparison between Experiments
4. Discussion
4.1. Energy
4.2. Amino Acids
4.3. Feed Intake
4.4. Genotype
5. Conclusions
Author Contributions
Funding
Institutional Review Board Statement
Informed Consent Statement
Data Availability Statement
Acknowledgments
Conflicts of Interest
References
- Pelletier, N.; Ibarburu, M.; Xin, H. Comparison of the environmental footprint of the egg industry in the United States in 1960 and 2010. Poult. Sci. 2014, 93, 241–255. [Google Scholar] [CrossRef]
- Hy-Line. Hy-Line Brown Management Guide; Hy-Line Breeders: West Des Moines, IA, USA, 2019. [Google Scholar]
- Dunn, I.C. Long life layer; genetic and physiological limitations to extend the laying period. In Proceedings of the 19th European Symposium on Poultry Nutrition, Potsdam, Germany, 26–26 August 2013; Volume 19, pp. 124–129. [Google Scholar]
- Preisinger, R. Innovative layer genetics to handle global challenges in egg production. Br. Poult. Sci. 2018, 59, 1–6. [Google Scholar] [CrossRef]
- Hy-Line. Hy-Line Brown Management Guide; Hy-Line Breeders: West Des Moines, IA, USA, 2004. [Google Scholar]
- Hy-Line. Optimizing Egg Size in Commercial Layers; Hy-Line Breeders: West Des Moines, IA, USA, 2018. [Google Scholar]
- Morris, T.R.; Njuru, D.M. Protein requirement of fast- and slow-growing chicks. Br. Poult. Sci. 1990, 31, 803–809. [Google Scholar] [CrossRef] [PubMed]
- Lopez, G.; Leeson, S. Utilization of metabolizable energy by young broilers and birds of intermediate growth rate. Poult. Sci. 2005, 84, 1069–1076. [Google Scholar] [CrossRef]
- Kimiaeitalab, M.V.; Cámara, L.; Mirzaie Goudarzi, S.; Jiménez-Moreno, E.; Mateos, G.G. Effects of the inclusion of sunflower hulls in the diet on growth performance and digestive tract traits of broilers and pullets fed a broiler diet from zero to 21 d of age. A comparative study. Poult. Sci. 2017, 96, 581–592. [Google Scholar] [CrossRef] [PubMed]
- Havenstein, G.B.; Ferket, P.R.; Scheideler, S.E.; Larson, B.T. Growth, livability, and feed conversion of 1957 vs. 1991 broilers when fed typical 1957 and 1991 broiler diets. Poult. Sci. 1994, 73, 1785–1794. [Google Scholar] [CrossRef] [PubMed]
- Zuidhof, M.J.; Schneider, B.L.; Carney, V.L.; Korver, D.R.; Robinson, F.E. Growth, efficiency, and yield of commercial broilers from 1957, 1978, and 2005. Poult. Sci. 2014, 93, 2970–2982. [Google Scholar] [CrossRef]
- Elliot, M.A. Amino acid nutrition of commercial layers and pullets. In In Proceedings of the California Animal Nutrition Conference, Fresno, CA, USA, 20–23 May 2008; pp. 139–165. [Google Scholar]
- Lemme, A. Amino Acid Requirements for Laying Hens; Lohman Information: Cuxhaven, Germany, 2009; pp. 21–32. [Google Scholar]
- Kumar, D.; Raginski, C.; Schwean-Lardner, K.; Classen, H.L. Assessing the performance response of laying hens to intake levels of digestible balanced protein from 27 to 66 wk of age. Can. J. Anim. Sci. 2018, 98, 801–808. [Google Scholar] [CrossRef] [Green Version]
- Soares, L.; Sakomura, N.K.; Dorigam, J.C.D.P.; Liebert, F.; Sunder, A.; Nascimento, M.Q.D.; Leme, B.B. Optimal in-feed amino acid ratio for laying hens based on deletion method. J. Anim. Physiol. Anim. Nutr. 2019, 103, 170–181. [Google Scholar] [CrossRef] [PubMed] [Green Version]
- Kidd, M.T.; Loar, R.E. A synopsis of recent work on the amino acid nutrition of layers. JAPR 2021, 30, 100108. [Google Scholar] [CrossRef]
- Kleyn, F.J. An Application of the Systems Approach to Egg Production. Master’s Thesis, University of KwaZulu-Natal, Pietermaritzburg, South Africa, 1987. [Google Scholar]
- McNab, J.M.; Fisher, C. An assay for true and apparent metabolizable energy. In Proceedings of the XVII World’s Poultry Science Congress, Helsinki, Finland, 8–12 August 1984; pp. 374–376. [Google Scholar]
- Jansen, W.M.M.A. European Table of Energy Values for Poultry Feedstuffs, 3rd ed.; WPSA: Beekbergen, The Netherlands, 1989. [Google Scholar]
- van Krimpen, M.M.; Veldkamp, T.; van Riel, J.W.; Khaksar, V.; Hashemipour, H.; Blok, M.C.; Spek, W. Estimating Requirements for Apparent Faecal and Standardized Ileal Digestible Amino Acids in Laying Hens by a Meta-Analysis Approach; Wageningen UR Livestock Research: Wageningen, The Netherlands, 2015; Volume 848, p. 71.21. [Google Scholar]
- Spek, J.W. Standardized Ileal Digestible Lysine Requirement for Laying Hens; Wageningen Livestock Research: Wageningen, The Netherlands, 2018; p. 22. [Google Scholar]
- Mateos, G.G.; Cámara, L.; Saldaña, B.; Fondevila, G.; Lázaro, R. Critical review of the procedures used for estimation of the energy content of diets and ingredients in poultry. JAPR 2019, 28, 506–525. [Google Scholar] [CrossRef]
- O’Shea, C. Marathon versus 100 m—What are the hallmarks of persistency in late lay? In Proceedings of the 22nd European Symposium on Poultry Nutrition, Gdansk, Poland, 10–13 June 2019; pp. 32–37. [Google Scholar]
- Chwalibog, A.; Baldwin, R.L. Systems to predict the energy and protein requirements of laying fowl. World’s Poult. Sci. 1995, 51, 187–196. [Google Scholar] [CrossRef]
- Bouvarel, I.; Nys, Y.Y.; Lescoat, P. Hen Nutrition for Sustained Egg Quality; Woodhead Publishing Ltd.: Sawston, UK, 2011. [Google Scholar]
- Pérez-Bonilla, A.; Novoa, S.; García, J.; Mohiti-Asli, M.; Frikha, M.; Mateos, G.G. Effects of energy concentration of the diet on productive performance and egg quality of brown egg-laying hens differing in initial body weight. Poult. Sci. 2012, 91, 3156–3166. [Google Scholar] [CrossRef]
- Classen, H.L. Diet energy and feed intake in chickens. Anim. Feed. Sci. Technol. 2017, 233, 13–21. [Google Scholar] [CrossRef]
- Pottgüter, R. Nutritional challenges based on different housing systems—Do they exist? In Proceedings of the 19th European Symposium on Poultry Nutrition, Potsdam, Germany, 26–29 August 2013; pp. 108–111. [Google Scholar]
- Zhang, B.; Coon, C.N. Nutrient modelling for laying hens. JAPR 1994, 3, 416–431. [Google Scholar] [CrossRef]
- Pesti, G.M.; Vedenov, D.; Cason, J.A.; Billard, L. A comparison of methods to estimate nutritional requirements from experimental data. Br. Poult. Sci. 2009, 50, 16–32. [Google Scholar] [CrossRef] [PubMed] [Green Version]
- Fisher, C.; Morris, T.R.; Jennings, R.C. model for the description and prediction of the response of laying hens to amino acid intake. Br. Poult. Sci. 1973, 14, 469–484. [Google Scholar] [CrossRef]
- Spangler, H.; Utterback, P.; Parsons, C.M.; Tillman, P. Determining the digestible lysine requirement of 22- to 47-week-old Lohmann laying hens using an increasing protein titration methodology. Poult. Sci. 2019, 98, 1706–1715. [Google Scholar] [CrossRef]
- NRC. National Research Council Nutrient Requirements of Poultry—Ninth Revised Edition. JAPR 1994, 3, 101. [Google Scholar]
- Morris, T.R.; Gous, R.M. Partitioning of the response to protein between egg number and egg weight. Br. Poult. Sci. 1988, 29, 93–99. [Google Scholar] [CrossRef] [PubMed]
- Lerman, P.M.; Bie, S.W. Problems in determining the best levels of essential nutrients in feedingstuffs. J. Agric. Sci. 1975, 84, 459–468. [Google Scholar] [CrossRef]
- Gous, R.M.; Griessel, M.; Morris, T.R. Effect of dietary energy concentration on the response of laying hens to amino acids. Br. Poult. Sci. 1987, 28, 427–436. [Google Scholar] [CrossRef]
- Emmans, G.C. The Effects of Temperature on the Performance of Laying Hens; British Poulty Science: Edinburgh, Scotland, 1974; Volume 1. [Google Scholar]
- Chwalibog, A. Studies on Energy Metabolism in Laying Hens; Chwalibog, A., Ed.; National Institute of Animal Science, Department of Physiology and Biochemistry: Copenhagen, Denmark, 1985; p. 139. [Google Scholar]
- Sakomura, N.K.; Reis, M.D.P.; Ferreira, N.T.; Gous, R.M. Modeling egg production as a means of optimizing dietary nutrient contents for laying hens. Anim. Front. 2019, 9, 45–51. [Google Scholar] [CrossRef] [PubMed]
- Peguri, A.; Coon, C.N. The efficiency of utilization of dietary energy for layers and the law of diminishing return. In Proceedings of the Minnesota Nutrition Conference and Heartland Lysine Technical Symposium, Bloomington, IN, USA, 18–20 September 1989; pp. 270–299. [Google Scholar]
- McDonald, M.W. The effect on profit of Optimizing nutrient density for laying hens. Br. Poult. Sci. 1984, 25, 139–144. [Google Scholar] [CrossRef]
- Rostagno, H.; Albino, L.F.T.; Hannas, H.I.; Donzele, J.L.; Sakomura, N.K.; Perazzo, F.G.; Saraiva, A.; de Abreu, M.L.T.; Rodrigues, P.B.; de Oliveira, R.F.; et al. Brazilian Tables for Poultry and Swine; Universidade Federal de Vicosa: Vicosa, Brazil, 2017. [Google Scholar]
- Gous, R.M. Optimizing the amino acid intake, amino acid balance and nutrient density of feeds for laying hens. In Proceedings of the 17th World’s Poultry Scientific Day, Pretoria, South Africa, 5 November 1998. [Google Scholar]
- Leeson, S.; Summers, J.D. Commercial Poultry Nutrition; Nottingham University Press: Nottingham, UK, 2005. [Google Scholar]
- Mateos, G.G.; Camara, L.; Fondevila, G.; de Juan, A.F. Principles and practical feeding of the modern laying hen under alternative productions systems. In Effects on bird welfare and production. In Proceedings of the Australian Poultry Science Symposium, Sydney, Australia, 16–19 February 2020; pp. 21–28. [Google Scholar]
- Silva, E.P.; Malheiros, E.B.; Sakomura, N.K.; Venturini, K.S.; Hauschild, L.; Dorigam, J.C.P.; Fernandes, J.B.K. Lysine requirements of laying hens. Livestock Sci. 2015, 173, 69–77. [Google Scholar] [CrossRef]


| Feed Ingredient, g/kg | I | II | III | IV |
|---|---|---|---|---|
| Yellow maize | 506.2 | 377.4 | 681.4 | 522.4 |
| Wheat bran | 197 | 200 | 45 | 46 |
| Rice bran | – | 60.0 | – | – |
| Fishmeal | 20 | 20 | 20 | 20 |
| Cane molasses | 25 | – | – | – |
| Soybean meal | 73 | 204 | – | – |
| Full fat soybeans | – | – | 123 | 282 |
| Sunflower husk | 75 | 35 | – | – |
| Acid oil | – | – | 25 | 25 |
| DL-methionine | 0.32 | 0.12 | 0.11 | 0.15 |
| Salt | 4 | 4 | 4 | 4 |
| Limestone powder | 87 | 88 | 88 | 88 |
| Monocalcium phosphorus | 10 | 9 | 11 | 10 |
| Vitamin and mineral premix | 2.5 | 2.5 | 2.5 | 2.5 |
| Total | 1000 | 1000 | 1000 | 1000 |
| Exp.1 Calculated Nutrient, g/kg | I | II | III | IV |
|---|---|---|---|---|
| TMEn (MJ/kg) | 10.6 | 10.6 | 13.1 | 13.08 |
| Crude protein | 122 | 180 | 125 | 173 |
| Total lysine | 5.32 | 9.13 | 5.63 | 8.91 |
| Recalculated AMEn, MJ/kg, Standardized Ileal Digestible Amino Acids, Minerals, Lipid and Fibre, g/kg | ||||
| AMEn | 10.1 | 10.0 | 13.0 | 13.1 |
| Crude protein | 121 | 177 | 119 | 163 |
| Lysine 1,2 | 4.80 | 8.20 | 5.01 | 7.76 |
| Methionine | 2.23 | 2.76 | 2.13 | 2.62 |
| Methionine + Cysteine | 3.92 | 5.09 | 3.84 | 4.72 |
| Isoleucine | 4.06 | 6.58 | 4.33 | 6.35 |
| Tryptophan | 1.06 | 1.76 | 1.05 | 1.65 |
| Threonine | 3.61 | 5.60 | 3.80 | 5.31 |
| Valine | 4.79 | 6.63 | 5.14 | 6.86 |
| Arginine | 6.39 | 10.51 | 6.44 | 9.72 |
| Calcium | 35.1 | 35.4 | 35.1 | 35.3 |
| Available phosphorus | 3.11 | 3.33 | 3.15 | 3.26 |
| Sodium | 1.96 | 1.93 | 1.79 | 1.81 |
| Crude lipid | 32.9 | 37.4 | 77.4 | 99.7 |
| Crude fibre | 73.4 | 62.9 | 28.5 | 32.4 |
| Analysed TMEn, MJ/kg and Total Nutrients, g/kg 3 | ||||
| TMEn | 11.0 | 11.0 | 13.0 | 13.2 |
| Crude protein | 130 | 189 | 120 | 153 |
| Lysine | 5.10 | 8.50 | 4.90 | 7.20 |
| Methionine | 1.90 | 2.48 | 1.90 | 3.00 |
| Isoleucine | 4.60 | 7.40 | 4.40 | 6.00 |
| Threonine | 4.20 | 6.70 | 3.90 | 5.00 |
| Valine | 5.50 | 8.80 | 5.20 | 6.80 |
| Arginine | 6.10 | 11.50 | 5.90 | 8.00 |
| Calcium | 32.0 | 32.4 | 34.2 | 31.6 |
| Phosphorus | 5.50 | 7.20 | 5.60 | 6.00 |
| Basal Feed Blends (g/kg) | Basal Feed Blends, g/kg | Calculated Nutrient Levels | ||||||
|---|---|---|---|---|---|---|---|---|
| Feed Number | TMEn, MJ/kg 1 | Total Lysine, g/kg 1 | I | II | III | IV | AMEn, MJ/kg 2 | SID Lys, g/kg 2 |
| 1 | 10.0 | 5.0 | 1000 | – | – | – | 10.12 | 4.80 |
| 2 | 10.0 | 6.0 | 670 | 330 | – | – | 10.09 | 5.92 |
| 3 | 10.0 | 7.0 | 330 | 670 | – | – | 10.05 | 7.08 |
| 4 | 10.0 | 8.0 | - | 1000 | – | – | 10.02 | 8.20 |
| 5 | 11.0 | 5.0 | 670 | – | 330 | – | 11.08 | 4.87 |
| 6 | 11.0 | 6.0 | 450 | 220 | 220 | 110 | 11.06 | 5.92 |
| 7 | 11.0 | 7.0 | 220 | 450 | 110 | 220 | 11.04 | 7.00 |
| 8 | 11.0 | 8.0 | - | 670 | – | 330 | 11.03 | 8.05 |
| 9 | 12.0 | 5.0 | 330 | – | 670 | – | 12.07 | 4.94 |
| 10 | 12.0 | 6.0 | 220 | 110 | 450 | 220 | 12.07 | 5.92 |
| 11 | 12.0 | 7.0 | 110 | 220 | 220 | 450 | 12.07 | 6.93 |
| 12 | 12.0 | 8.0 | - | 330 | – | 670 | 12.06 | 7.91 |
| 13 | 13.0 | 5.0 | – | – | 1000 | – | 13.03 | 5.01 |
| 14 | 13.0 | 6.0 | - | – | 670 | 330 | 13.04 | 5.92 |
| 15 | 13.0 | 7.0 | – | – | 330 | 670 | 13.06 | 6.85 |
| 16 | 13.0 | 8.0 | – | – | – | 1000 | 13.07 | 7.76 |
| Feed Ingredient, g/kg | I | II | III | IV |
|---|---|---|---|---|
| Yellow maize 7.1% | 524 | 464 | 695 | 511 |
| Wheat middlings 15% | 189 | 75 | – | – |
| Soybean meal 46% | 78 | 252 | 136 | 284 |
| Sunflower meal 35.5% | 100.0 | 100 | 50.0 | 50.0 |
| Soya oil | 5.0 | 5.00 | 14.8 | 45.8 |
| Limestone | 90 | 89 | 89 | 89 |
| Monocalcium phosphate | 5.4 | 4.6 | 7.1 | 5.6 |
| Salt | 3.0 | 3.0 | 3.2 | 3.1 |
| BioLysine | 1.70 | – | 0.9 | – |
| DL-Methionine | 1.10 | 2.40 | 1.29 | 2.80 |
| L-Threonine | 0.16 | 0.09 | 0.11 | 0.33 |
| L-Valine 10% | – | 2.17 | – | 6.06 |
| Layer premix 1 | 2.50 | 2.50 | 2.50 | 2.50 |
| Phytase 1200 FYT 2 | 0.06 | 0.06 | 0.06 | 0.06 |
| Total | 1000 | 1000 | 1000 | 1000 |
| Nutrients, g/kg | I | II | III | IV |
|---|---|---|---|---|
| AMEn, MJ/kg | 10.94 | 10.96 | 12.39 | 12.50 |
| Crude protein | 142 | 200 | 135 | 189 |
| Total Lysine | 6.75 | 10.07 | 6.58 | 9.98 |
| Total Methionine + Cysteine | 6.07 | 8.91 | 5.89 | 8.78 |
| Total Threonine | 5.41 | 7.55 | 5.02 | 7.46 |
| Standardized ileal digestible amino acids, Ca, P, Fat, Fibre and Na, g/kg | ||||
| Lysine 1,2 | 6.01 | 9.01 | 6.01 | 9.00 |
| Methionine | 3.36 | 5.42 | 3.44 | 5.56 |
| Methionine + Cysteine | 5.41 | 8.12 | 5.43 | 8.10 |
| Isoleucine | 4.81 | 7.73 | 4.98 | 7.53 |
| Tryptophan | 1.34 | 2.07 | 1.24 | 1.94 |
| Threonine | 4.43 | 6.59 | 4.38 | 6.57 |
| Valine | 5.76 | 8.57 | 5.72 | 8.55 |
| Arginine | 8.53 | 12.84 | 7.88 | 11.91 |
| Calcium | 35.0 | 35.0 | 35.0 | 35.0 |
| Available phosphorus | 3.50 | 3.50 | 3.50 | 3.50 |
| Sodium | 1.78 | 1.77 | 1.77 | 1.78 |
| Fat | 37.5 | 34.0 | 46.3 | 72.3 |
| Crude fibre | 53.9 | 46.1 | 31.6 | 31.3 |
| Analysed total nutrients, g/kg 3 | ||||
| AMEn (MJ/kg) 3 | 10.86 | 10.51 | 11.35 | 11.70 |
| Crude protein | 148 | 199 | 137 | 194 |
| Lysine | 6.76 | 10.09 | 6.45 | 9.84 |
| Methionine | 3.05 | 5.34 | 3.39 | 5.99 |
| Methionine + Cystine | 6.05 | 8.29 | 5.57 | 8.66 |
| Threonine | 5.15 | 7.43 | 5.09 | 7.39 |
| Formulated Nutrient Levels | Basal Feed Blends, g/kg | |||||
|---|---|---|---|---|---|---|
| Feed Number | AMEn, MJ/kg | Digestible Lysine, g/kg | I | II | III | IV |
| 1 | 11.00 | 6.0 | 1000 | – | – | – |
| 2 | 11.00 | 7.0 | 667 | 333 | – | – |
| 3 | 11.00 | 8.0 | 333 | 667 | – | – |
| 4 | 11.00 | 9.0 | - | 1000 | – | - |
| 5 | 11.75 | 6.0 | 500 | – | 500 | - |
| 6 | 11.75 | 7.0 | 335 | 165 | 335 | 165 |
| 7 | 11.75 | 8.0 | 165 | 335 | 165 | 335 |
| 8 | 11.75 | 9.0 | – | 500 | - | 500 |
| 9 | 12.50 | 6.0 | - | – | 1000 | – |
| 10 | 12.50 | 7.0 | – | - | 667 | 333 |
| 11 | 12.50 | 8.0 | – | – | 333 | 667 |
| 12 | 12.50 | 9.0 | - | – | - | 1000 |
| Equation | Dependent Variable | Independent Variable | Parameter Estimate | Standard Error | p Value |
|---|---|---|---|---|---|
| 1 | AMEn intake, kJ/d (r2 = 0.557) | Intercept | 121.279 | 60.789 | 0.047 |
| Body weight, g | 0.352 | 13.810 | <0.001 | ||
| Egg output, g/d | 9.157 | 0.959 | <0.001 | ||
| 2 | Egg output, g/d (r2 = 0.374) | Intercept | −34.507 | 14.090 | 0.015 |
| AMEn intake, kJ/d | 0.111 | 0.021 | <0.001 | ||
| AMEn intake, kJ/d | −3.2 × 10⁻⁵ | 7.8 × 10⁻⁶ | <0.001 | ||
| Strain 1 | 1.911 | 0.478 | <0.001 | ||
| 3 | Egg output, g/d (r2 = 0.052) | Intercept | 71.138 | 3.997 | <0.001 |
| AMEn, MJ/kg | −1.3144 | 0.338 | <0.001 | ||
| Strain | 1.122 | 0.567 | =0.049 | ||
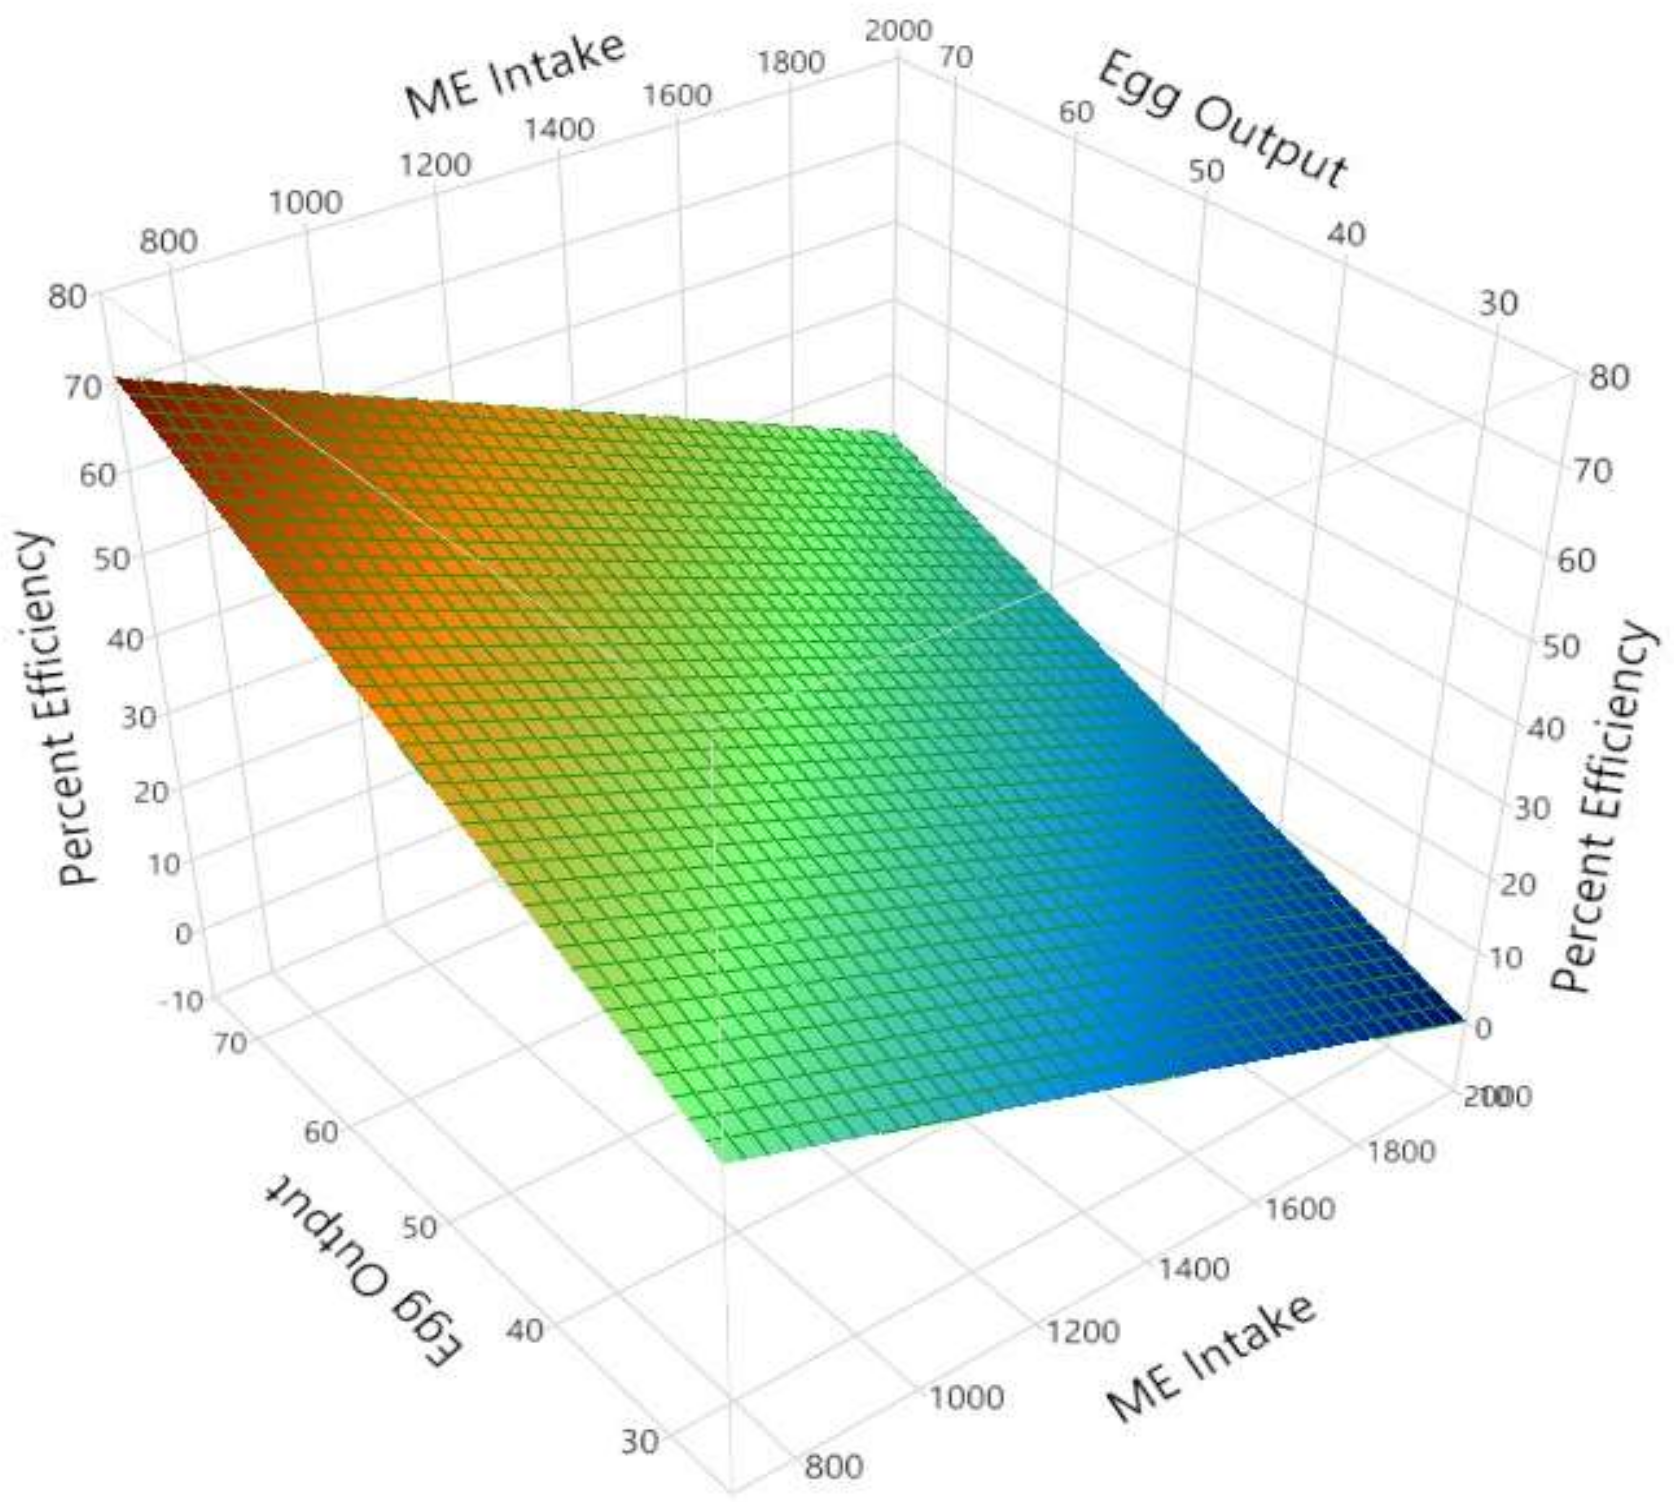
| 4 | AMEn utilization, % (r2 = 0.987) | Intercept | 37.399 | 0.264 | <0.001 |
| AMEn intake, kJ/g d | −0.028 | 0.000 | <0.001 | ||
| Egg output g/d | 0.696 | 0.005 | <0.001 | ||
| 5 | Feed intake, g/d (r2 = 0.716) | Intercept | 112.633 | 7.745 | <0.001 |
| Body weight, g | 0.026 | 2.130 | <0.001 | ||
| Egg output, g/d | 0.957 | 0.082 | <0.001 | ||
| SID Lys, g/kg | −1.703 | 0.327 | <0.001 | ||
| AMEn, MJ/kg | −7.762 | 0.470 | <0.001 | ||
| 6 | FCR, g feed/g egg (r2 = 0.588) | Intercept | 4.020 | 0.137 | <0.001 |
| Body weight, g | 4.5 × 10⁻⁴ | 0.038 | <0.001 | ||
| Egg output, g/d | −0.019 | 0.001 | <0.001 | ||
| SID Lys, g/kg | −0.029 | 0.006 | <0.001 | ||
| AMEn, MJ/kg | −0.135 | 0.008 | <0.001 |
| Equation | Dependent Variable | Independent Variable | Parameter Estimate | Standard Error | p Value |
|---|---|---|---|---|---|
| 7 | SID Lys intake, mg/d (r2 = 0.285) | Intercept | −25.956 | 77.876 | 0.739 |
| Egg output, g/d | 14.190 | 1.385 | <0.001 | ||
| Strain 1 | 56.526 | 14.507 | <0.001 | ||
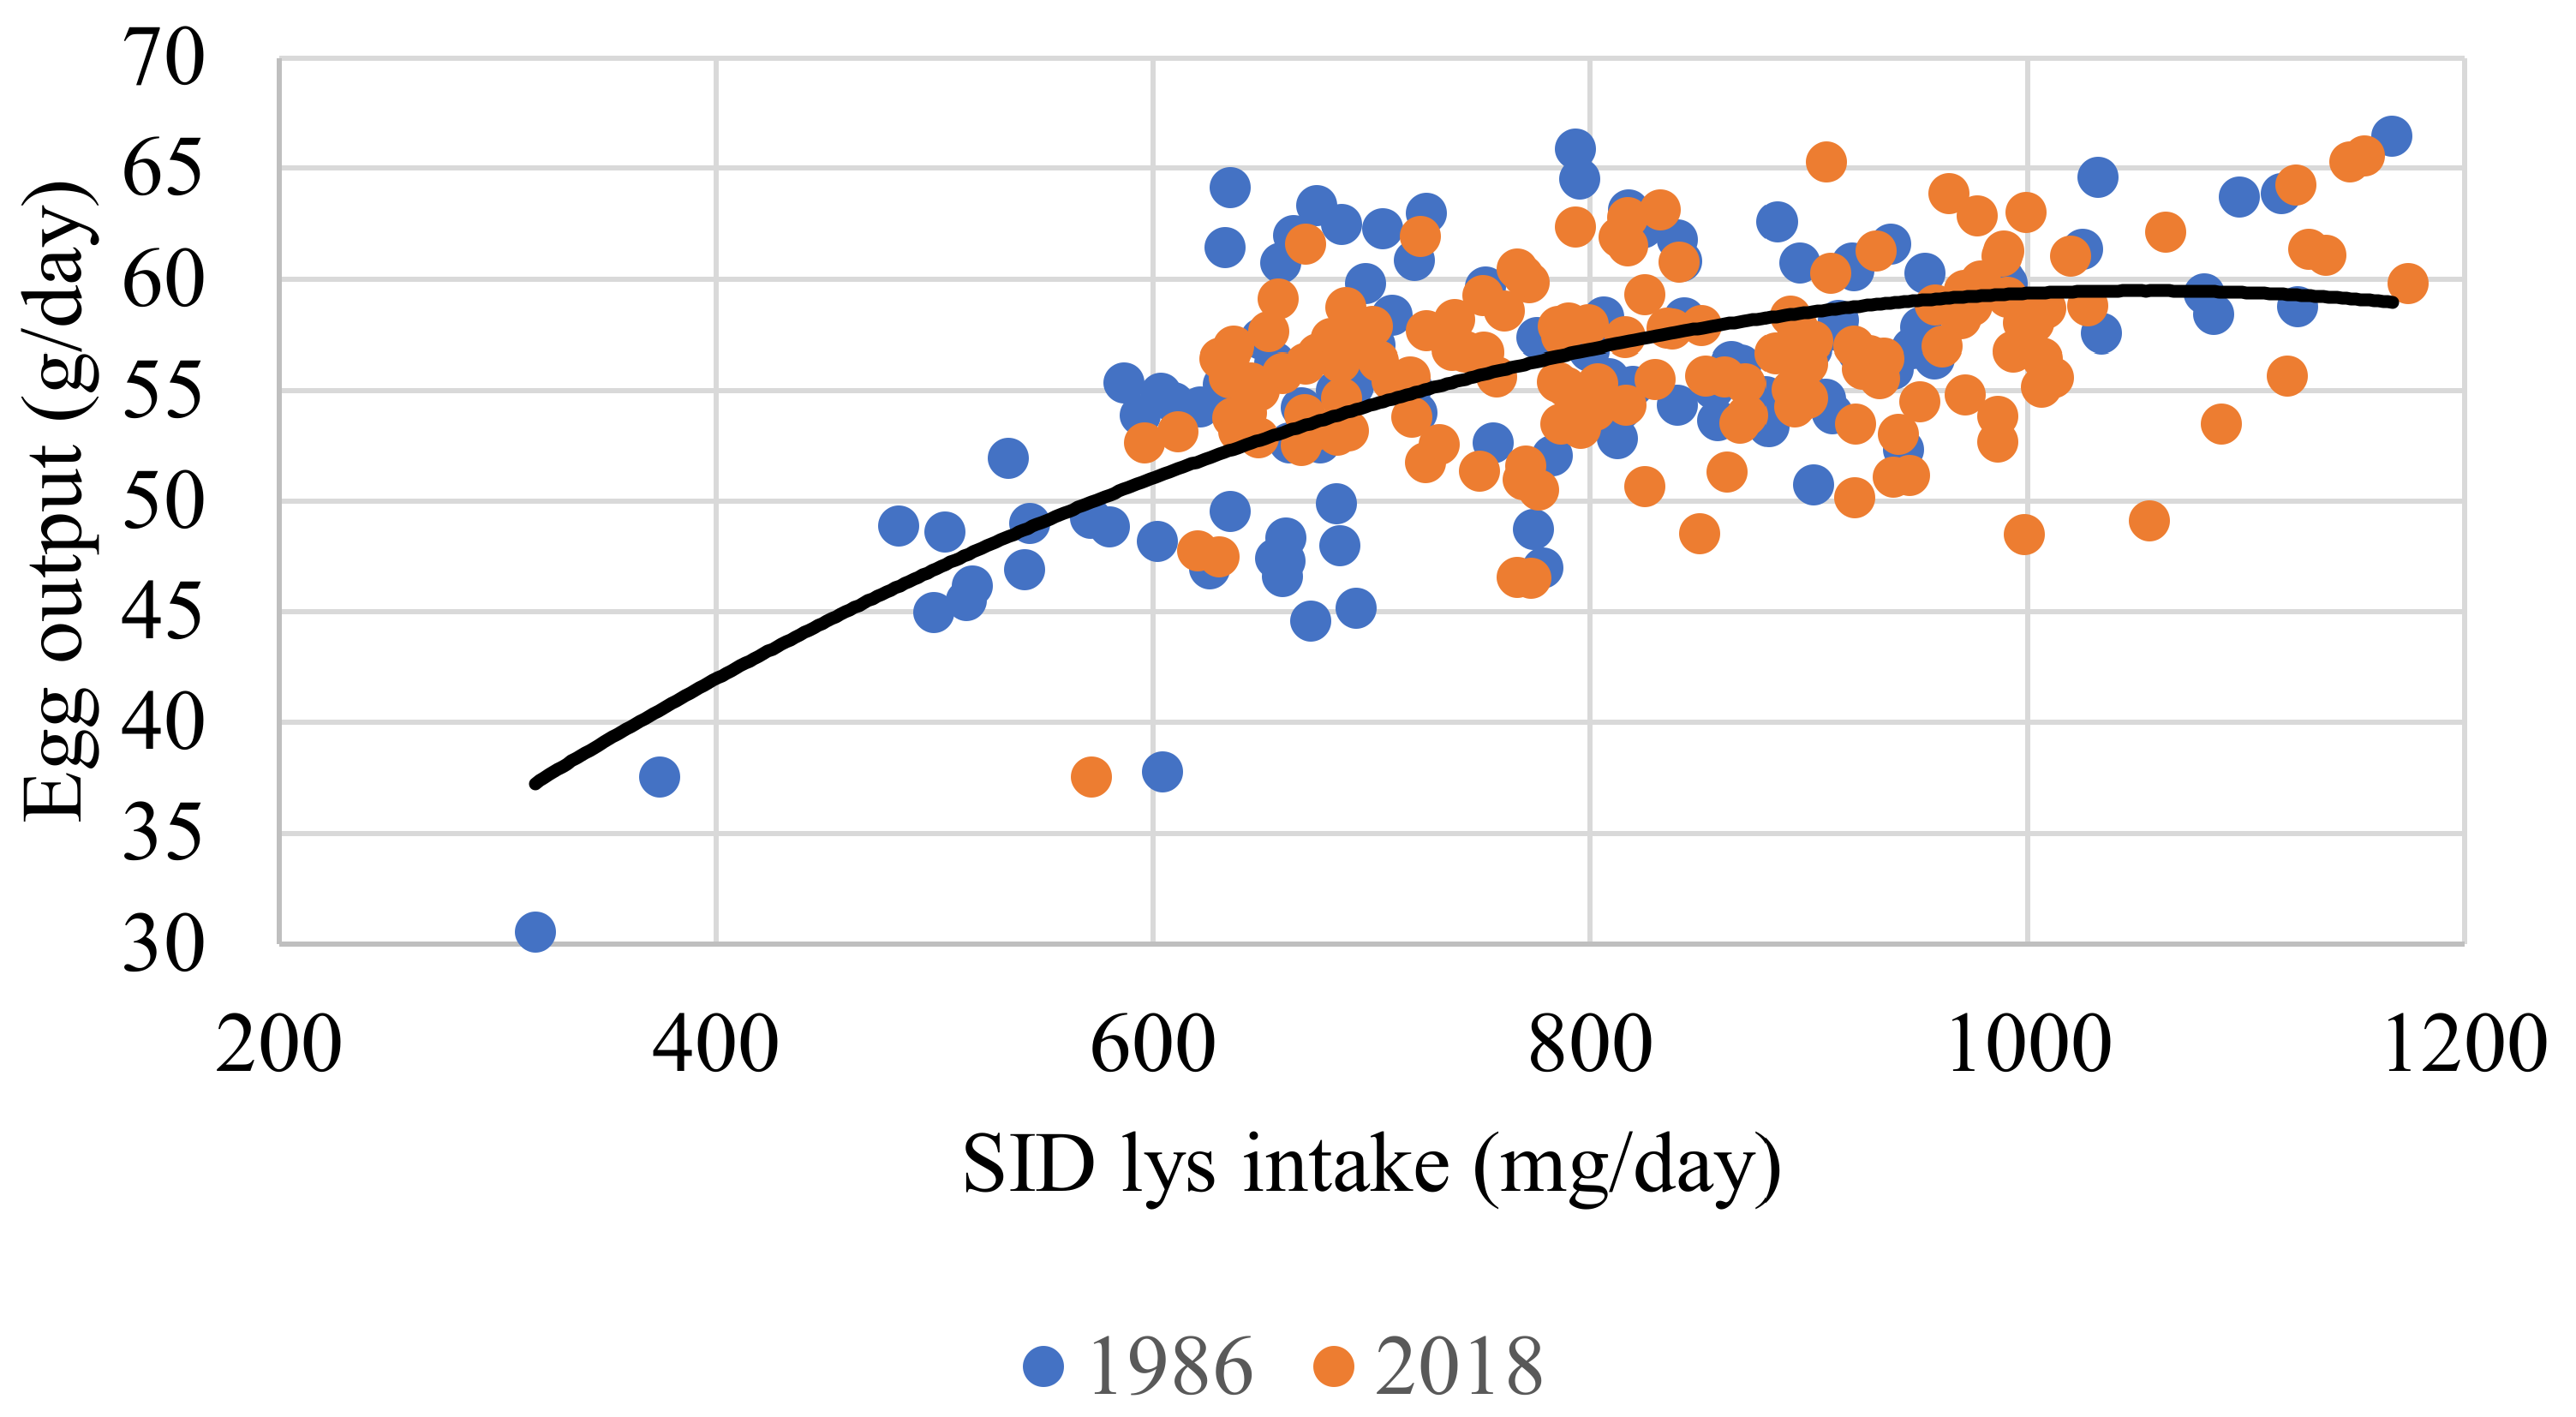
| 8 | Egg output, g/d (r2 = 0.299) | Intercept | 19.911 | 4.992 | <0.001 |
| SID Lys intake, mg/d | 0.076 | 0.013 | <0.001 | ||
| SID Lys intake mg/d | −3.6 × 10⁻⁵ | 7.7 × 10⁻⁶ | <0.001 | ||
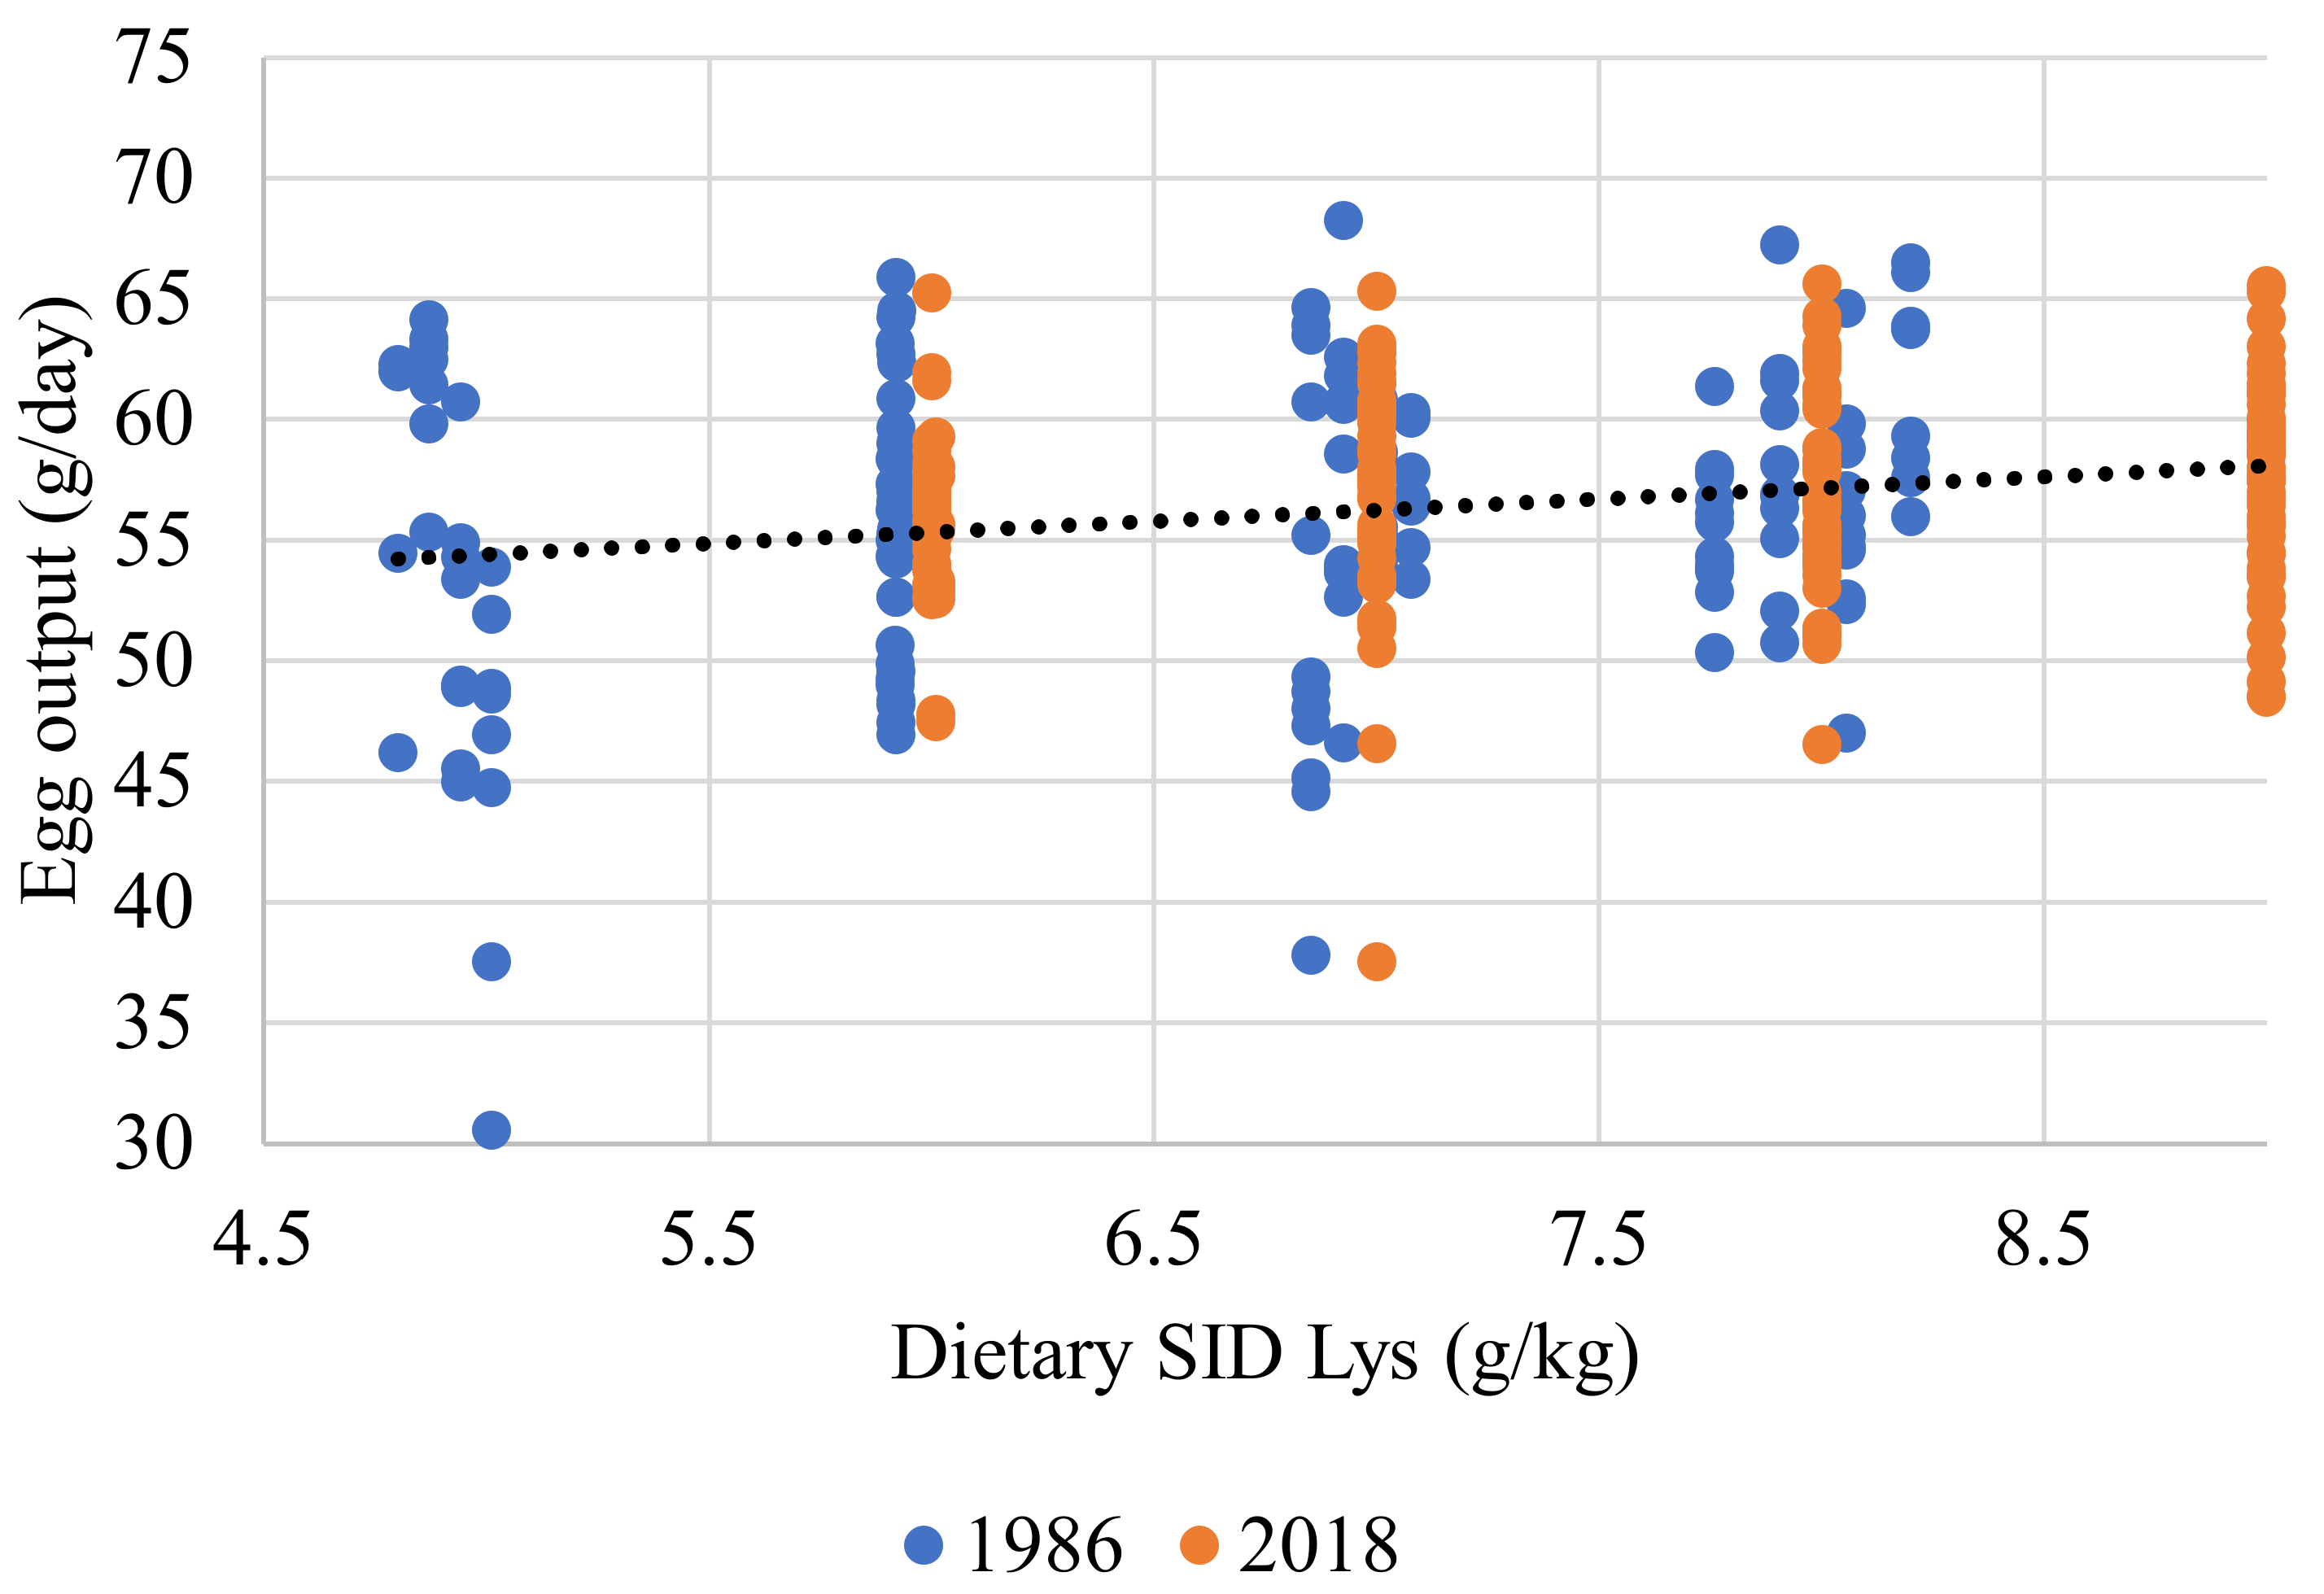
| 9 | Egg output,g/d (r2 = 0.042) | Intercept | 49.822 | 1.697 | <0.001 |
| Dietary SID Lys, g/kg | 0.918 | 0.235 | <0.001 | ||
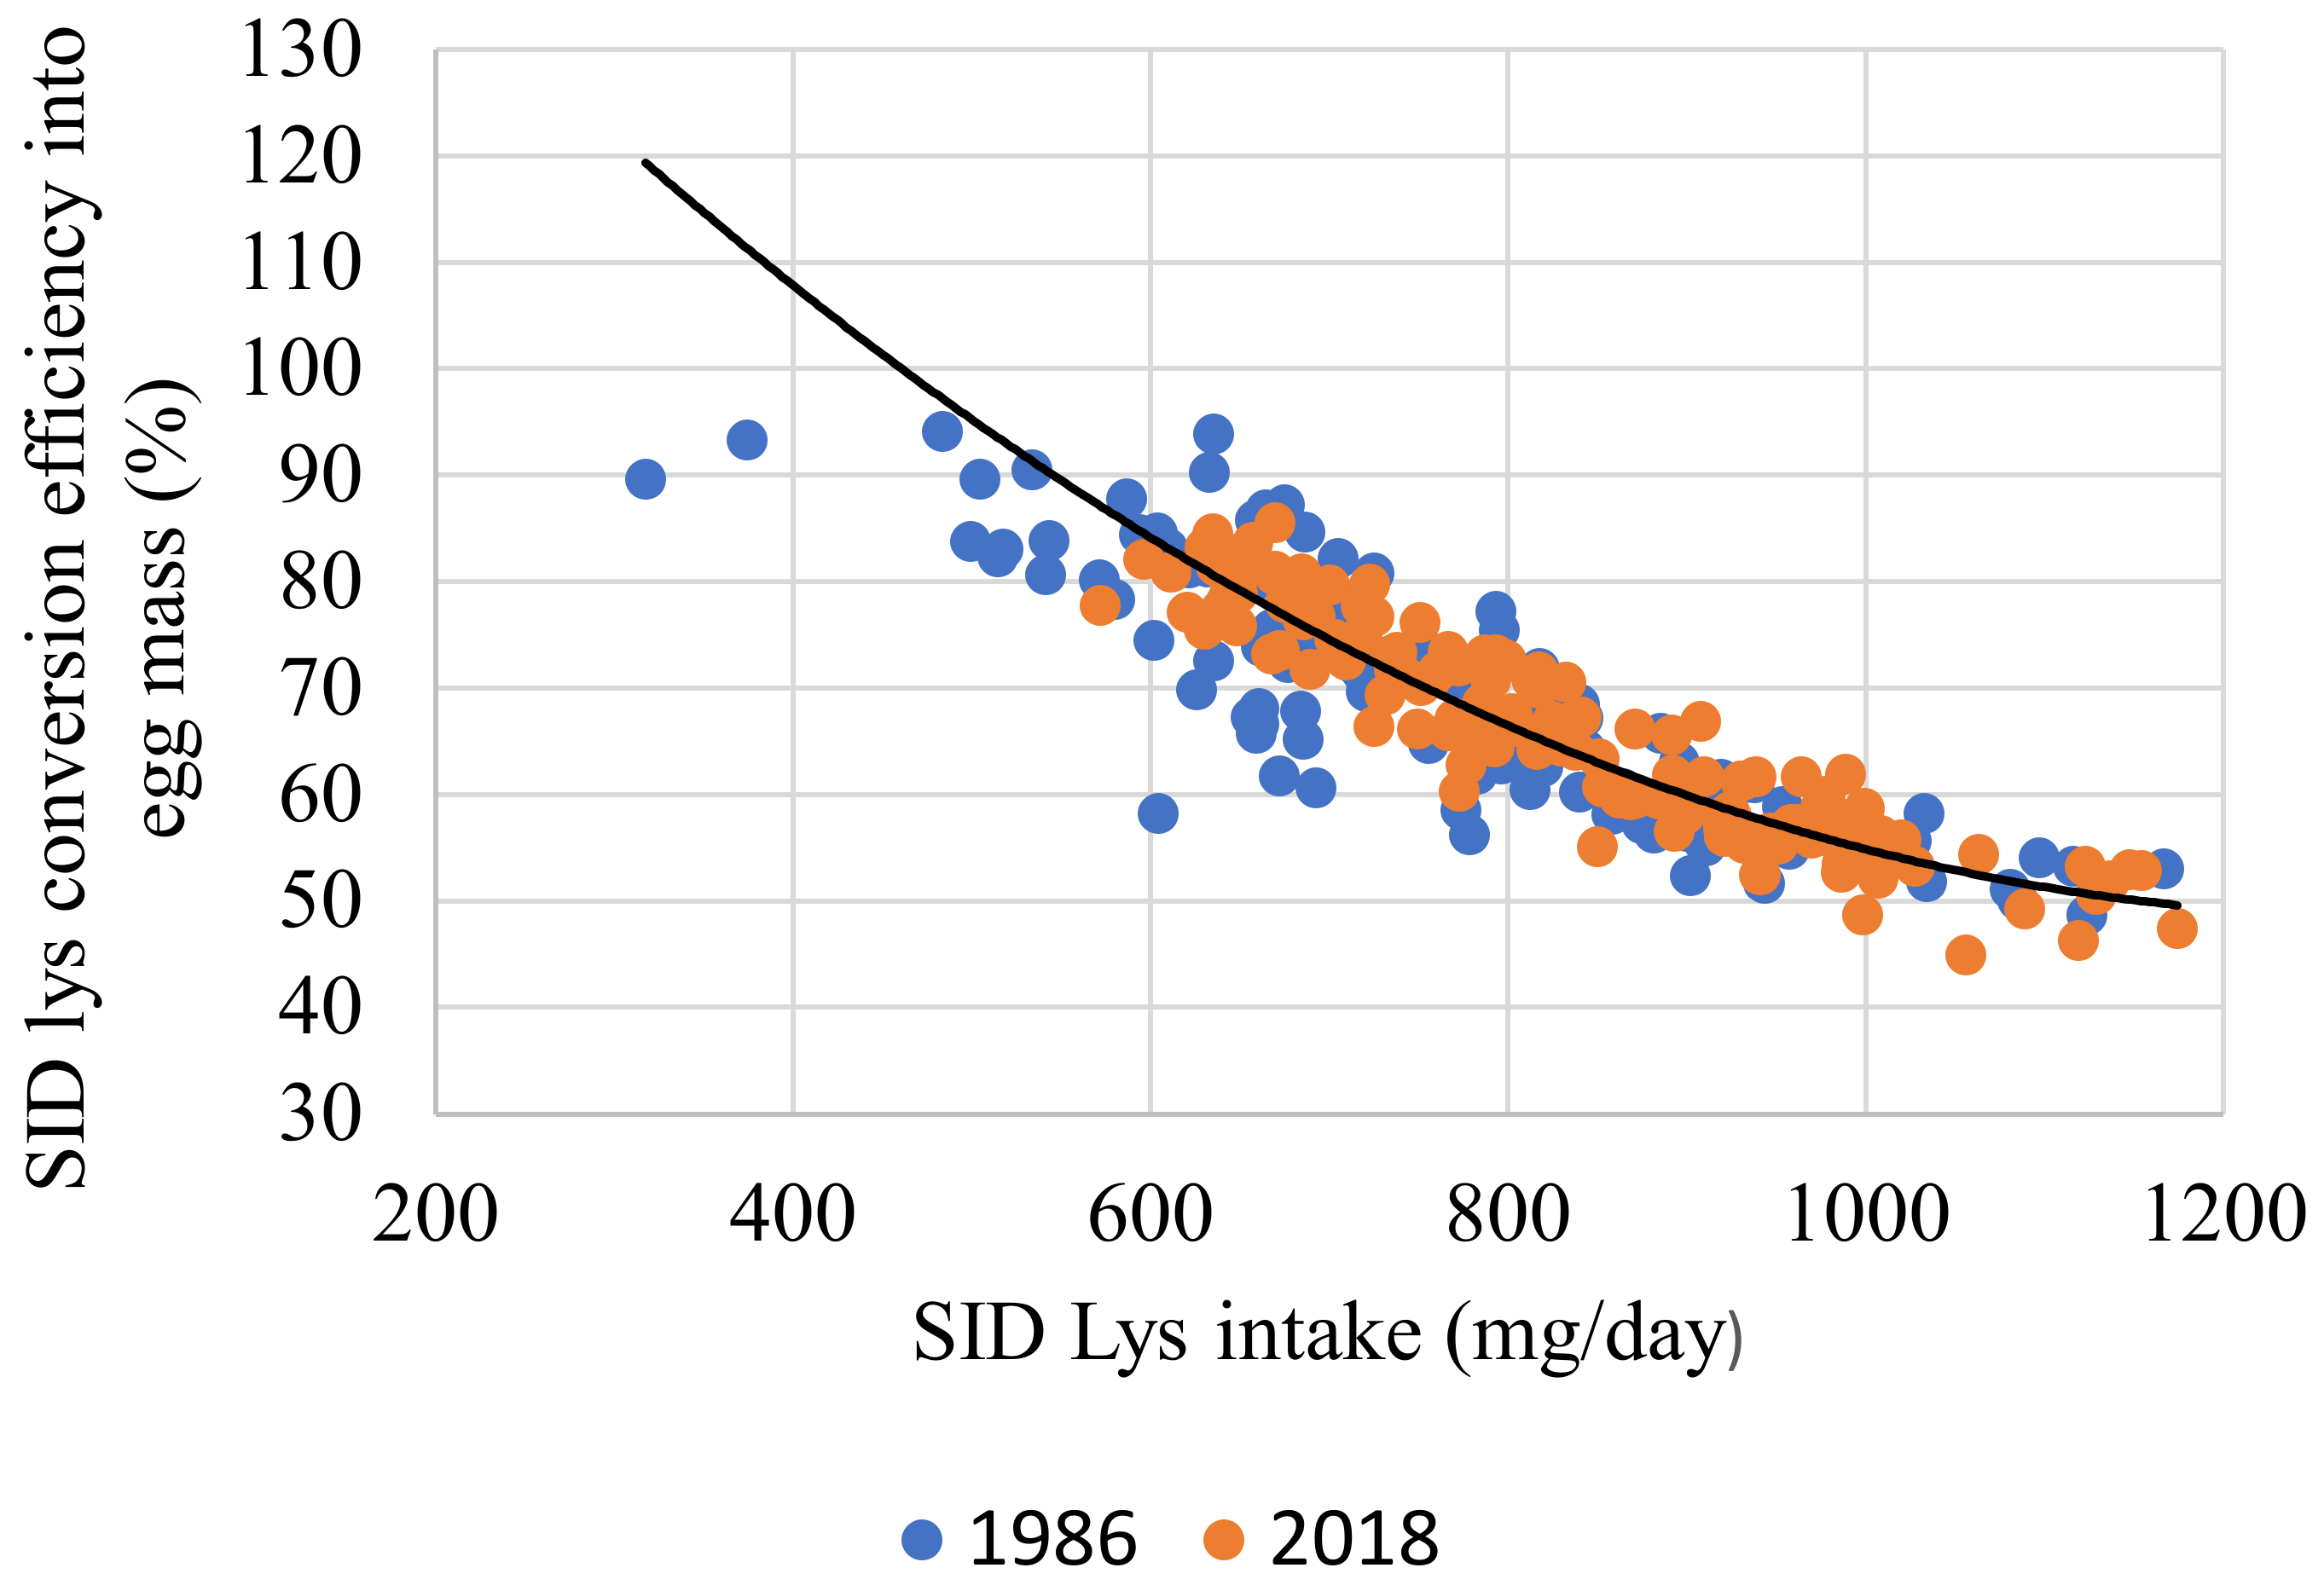
| 10 | SID Lys utilization, % r2 = 0.950) | Intercept | 73.626 | 1.541 | <0.001 |
| SID Lys intake, mg/d | −0.084 | 0.001 | <0.001 | ||
| Egg output, g/d | 1.083 | 0.032 | <0.001 | ||
| Strain | −0.625 | 0.294 | 0.034 |
| Treatment | Layer Performance | ||||||||
|---|---|---|---|---|---|---|---|---|---|
| AMEn, MJ/kg | SID Lys, g/kg | Hen Day, % | Egg Weight, g | Egg Output, g/d | Feed Intake, g/d | Body Weight, g | FCR, g Feed/g egg | AMEn Intake, kJ/d | SID Lys Intake, mg/d |
| 10.0 11.0 12.0 13.0 | 5.0 6.0 7.0 8.0 5.0 6.0 7.0 8.0 5.0 6.0 7.0 8.0 5.0 6.0 7.0 8.0 | 82.14 b,c 86.61 b,c,d 81.85 b 91.88 d 91.07 b,c,d 88.10 b,c,d 83.04 b,c,d 88.39 b,c,d 82.44 b,c,d 87.50 b,c,d 88.39 b,c,d 91.37 c,d 70.24 a 86.04 b,c,d 82.74 b,c,d 89.58 b,c,d | 59.28 62.74 58.77 64.08 60.94 62.07 61.70 62.81 58.83 63.53 63.98 60.14 59.20 62.18 63.60 61.85 | 50.93 b,c,d 54.36 b,c,d,e 49.35 b,c 58.97 e 55.84 d,e 54.53 b,c,d,e 51.22 b,c,d 55.42 c,d,e 48.32 b 55.60 c,d,e 56.49 d,e 56.11 d,e 41.60 a 53.30 b,c,d,e 52.43 b,c,d 55.41 c,d,e | 132.5 g 132.0 g 125.3 e,f,g 131.2 g 129.6 f,g 119.9 d,e,f 116.0 b,c,d,e 116.9 b,c,d,e 112.6 b,c,d 117.4 c,d,e 114.6 b,c,d 112.0 b,c,d 92.80 a 106.9 b,c 106.5 b 106.4 b | 2015 2092 2043 2048 2078 2054 2044 1993 2010 2181 2163 2129 1867 2066 2082 2117 | 2.739 g 2.452 f,g 2.680 g 2.239 b,c,d,e,f 2.352 d,e,f 2.201 a,b,c,d,e,f 2.329 c,d,e,f 2.110 a,b,c,d,e 2.371 e,f 2.133 a,b,c,d,e 2.049 a,b,c 2.029 a,b 2.253 b,c,d,e,f 2.011 a,b 2.056 a,b,c,d 1.917 a | 1341 b,c,d 1331 a,b,c,d 1260 a,b 1314 a,b,c,d 1436 d 1326 a,b,c,d 1281 a,b,c 1289 a,b,c 1360 b,c,d 1416 d 1382 b,c,d 1351 b,c,d 1209 a 1394 c,d 1390 c,d 1391 c,d | 636 c 782 e,f 887 g,h 1076 i 631 c 710 d 813 f 941 h 557 b 695 c,d 793 e,f 885 g,h 465 a 633 c 730 d,e 826 f,g |
| SEM Significance (p =) | 3.402 0.003 | 1.430 0.057 | 2.268< 0.001 | 3.775< 0.001 | 61.55 0.132 | 0.106< 0.001 | 46.350.027 | 4.26< 0.001 | |
| Treatment | Layer Performance | ||||||||
|---|---|---|---|---|---|---|---|---|---|
| Hen day, % | Egg weight, g | Egg output, g/d | Feed Intake, g/d | Body weight, g | FCR, g feed/g egg | AMEn intake, kJ/d | SID Lys intake, mg/d | ||
| Main effect: AMEn 10.0 11.0 12.0 13.0 Main effect:SID Lysine 5.0 6.0 7.0 8.0 Significance (p =) Dietary energy (AMEn) Digestible lysine (Lys) AMEn × Lys interaction | 85.49 87.65 87.43 82.07 81.16 a 86.98 b,c 84.04 a,b 90.40 c 0.094 0.002 0.132 | 61.16 61.88 61.62 61.70 59.47 a 62.71 b 61.93 b 62.21 b 0.942 0.009 0.153 | 53.28 54.25 54.13 50.63 48.91 a 54.46 b,c 52.34 b 56.53 c 0.105 <0.001 0.024 | 130.2 d 120.6 c 114.1 b 103.1 a 116.6 119.4 115.4 116.6 <0.001 0.577 0.028 | 2050 a,b 2042 a,b 2121 b 2032 a 1992 2093 2089 2071 0.018 0.461 0.914 | 2.534 c 2.248 b 2.145 a,b 2.061 a 2.435 c 2.206 b 2.278 a,b 2.071 a <0.001 <0.001 0.806 | 1312 1333 1377 1345 1334 1367 1327 1339 0.217 0.584 0.015 | 840 d 774 c 733 b 664 a 571 a 710 b 804 c 923 d <0.001 <0.001 0.141 | |
| Treatment | Layer Performance | ||||||||
|---|---|---|---|---|---|---|---|---|---|
| AMEn, MJ/kg | Digestible Lysine, g/kg | Hen Day, % | Egg Weight, g | Egg Output, g/d | Feed Intake, g/d | Body Weight, g | FCR, g Feed/g egg | AMEn Intake, kJ/d | SID Lys Intake, mg/d |
| 11.00 11.75 12.50 | 6.0 7.0 8.0 9.0 6.0 7.0 8.0 9.0 6.0 7.0 8.0 9.0 | 93.57 a 98.21 c 97.77 b,c 94.64 a,b 98.21 c 96.65 a,b,c 96.43 a,b,c 98.88 c 99.11 c 97.99 b,c 96.68 a,b,c 98.21 c | 56.13 a 57.37 a 58.21 a,b,c 58.41 a,b,c 57.64 a,b 58.43 a,b,c 60.29 c 60.04 bc 56.81 a 58.33 a,b,c 57.09 a 58.00 a,b,c | 52.44 a 56.36 b,c 56.93 b,c 55.30 a,b 56.61 b,c 56.52 b,c 58.13 b,c 59.38 c 56.28 b,c 57.30 b,c 55.25 a,b 57.00 b,c | 114.7 c,d,e,f 121.1 f 117.4 e,f 117.0 e,f 115.5 d,e,f 112.6 c,d,e 114.9 c,d,e,f 110.4 b,c,d 108.9 b,c 105.6 a,b 105.4 a,b 102.1 a | 1847 1885 1851 1834 1844 1869 1914 1900 1865 1878 1922 1910 | 2.198 f 2.157 e,f 2.062 d,e 2.135 e,f 2.040 c,d,e 2.005 c,d 1.984 c,d 1.860 a,b 1.934 b,c 1.851 a,b 1.928 b,c 1.798 a | 1255 1325 1285 1283 1347 1315 1343 1292 1349 1311 1310 1272 | 689 a 847 d 939 e 1053 g 693 a,b 788 c 919 e 994 f 653 a 739 b 843 d 919 e |
| SEM Main effect: AMEn 11.00 11.75 12.50 Main effect SID Lys 6.0 7.0 8.0 9.0 Significance (p =) ANOVA Dietary energy (AMEn) Digestible Lysine (Lys) AMEn x Lys interaction | 4.909 96.09 a 97.55 b,c 98.04 c 97.04 97.62 96.97 97.25 <0.010 0.070 0.903 <0.05 | 3.567 57.55 a 59.10 b 57.57 a 56.88 a 58.05 a,b 58.59 b 58.82 b 0.002 <0.05 <0.05 0.732 | 4.696 55.30 a 57.66 b 56.50 a,b 55.17 56.73 56.84 57.22 <0.001 <0.05 0.143 0.204 | 9.067 117.6 c 113.3 b 105.5 a 113.0 113.1 112.9 109.9 <0.001 <0.001 0.255 0.298 | 143.91 1854 1882 1893 1852 1877 1894 1881 0.095 0.290 0.527 0.839 | 0.174 2.137 c 1.972 b 1.876 a 2.054 b 2.004 b 1.994 a,b 1.931a <0.001 <0.001 <0.01 0.114 | 27.89 1287 1324 1310 1318 1317 1313 1282 0.196 0.131 0.293 0.315 | 18.184 885 c 848 b 787 a 678 a 792 b 903 c 989 d <0.001 <0.001 <0.001 0.124 | |
| Parameter Measured | Historic Stain | Modern Strain | p-Value 1 |
|---|---|---|---|
| Body weight, g | 2058 ± 206 | 1873 ±142 | <0.001 |
| Change in weight, g 2 | 1.102 ±3.39 | 5.838 ± 1.445 | <0.001 |
| Egg weight, g | 62.436 ± 4.159 | 58.207 ± 3.418 | 0.038 |
| Hen day production, % | 89.211 ± 8.671 | 97.684 ± 3.615 | <0.001 |
| Egg output, g/d | 55.675 ± 6.215 | 56.88 ± 4.192 | <0.001 |
| Feed intake, g/d | 115.701 ± 15.348 | 111.786 ± 9.562 | 0.005 |
| FCR, g feed/g egg | 2.082 ± 0.190 | 1.971 ± 0.165 | 0.005 |
Publisher’s Note: MDPI stays neutral with regard to jurisdictional claims in published maps and institutional affiliations. |
© 2021 by the authors. Licensee MDPI, Basel, Switzerland. This article is an open access article distributed under the terms and conditions of the Creative Commons Attribution (CC BY) license (https://creativecommons.org/licenses/by/4.0/).
Share and Cite
Kleyn, F.J.; Chrystal, P.V.; Ciacciariello, M. The Impact of Genotype and Age on Energy and Protein Utilization in Individually Housed Brown Laying Hens. Animals 2021, 11, 3508. https://doi.org/10.3390/ani11123508
Kleyn FJ, Chrystal PV, Ciacciariello M. The Impact of Genotype and Age on Energy and Protein Utilization in Individually Housed Brown Laying Hens. Animals. 2021; 11(12):3508. https://doi.org/10.3390/ani11123508
Chicago/Turabian StyleKleyn, Frederik J., Peter Vincent Chrystal, and Mariana Ciacciariello. 2021. "The Impact of Genotype and Age on Energy and Protein Utilization in Individually Housed Brown Laying Hens" Animals 11, no. 12: 3508. https://doi.org/10.3390/ani11123508
APA StyleKleyn, F. J., Chrystal, P. V., & Ciacciariello, M. (2021). The Impact of Genotype and Age on Energy and Protein Utilization in Individually Housed Brown Laying Hens. Animals, 11(12), 3508. https://doi.org/10.3390/ani11123508