
Changes in Biceps femoris Transcriptome along Growth in Iberian Pigs Fed Different Energy Sources and Comparative Analysis with Duroc Breed

 , , , and
Abstract
Simple Summary
Abstract
1. Introduction
2. Materials and Methods
2.1. Ethics Statement
2.2. Animals and Sampling
2.3. Muscle Tissue Composition, Meat Tenderness and Histological Analyses
2.4. Statistical Analyses of Phenotypic Data
2.5. RNA Isolation, Library Construction and Sequencing
2.6. Bioinformatic Analyses
2.7. Differential Expression Analysis
2.8. Validation by qPCR
2.9. Functional Interpretation
3. Results and Discussion
3.1. Age, Breed and Diet Effects on Phenotype
3.2. Age, Breed and Diet Effects on the Biceps Femoris Transcriptome
3.2.1. Changes in Muscle Transcriptome along Growth in Iberian Pigs
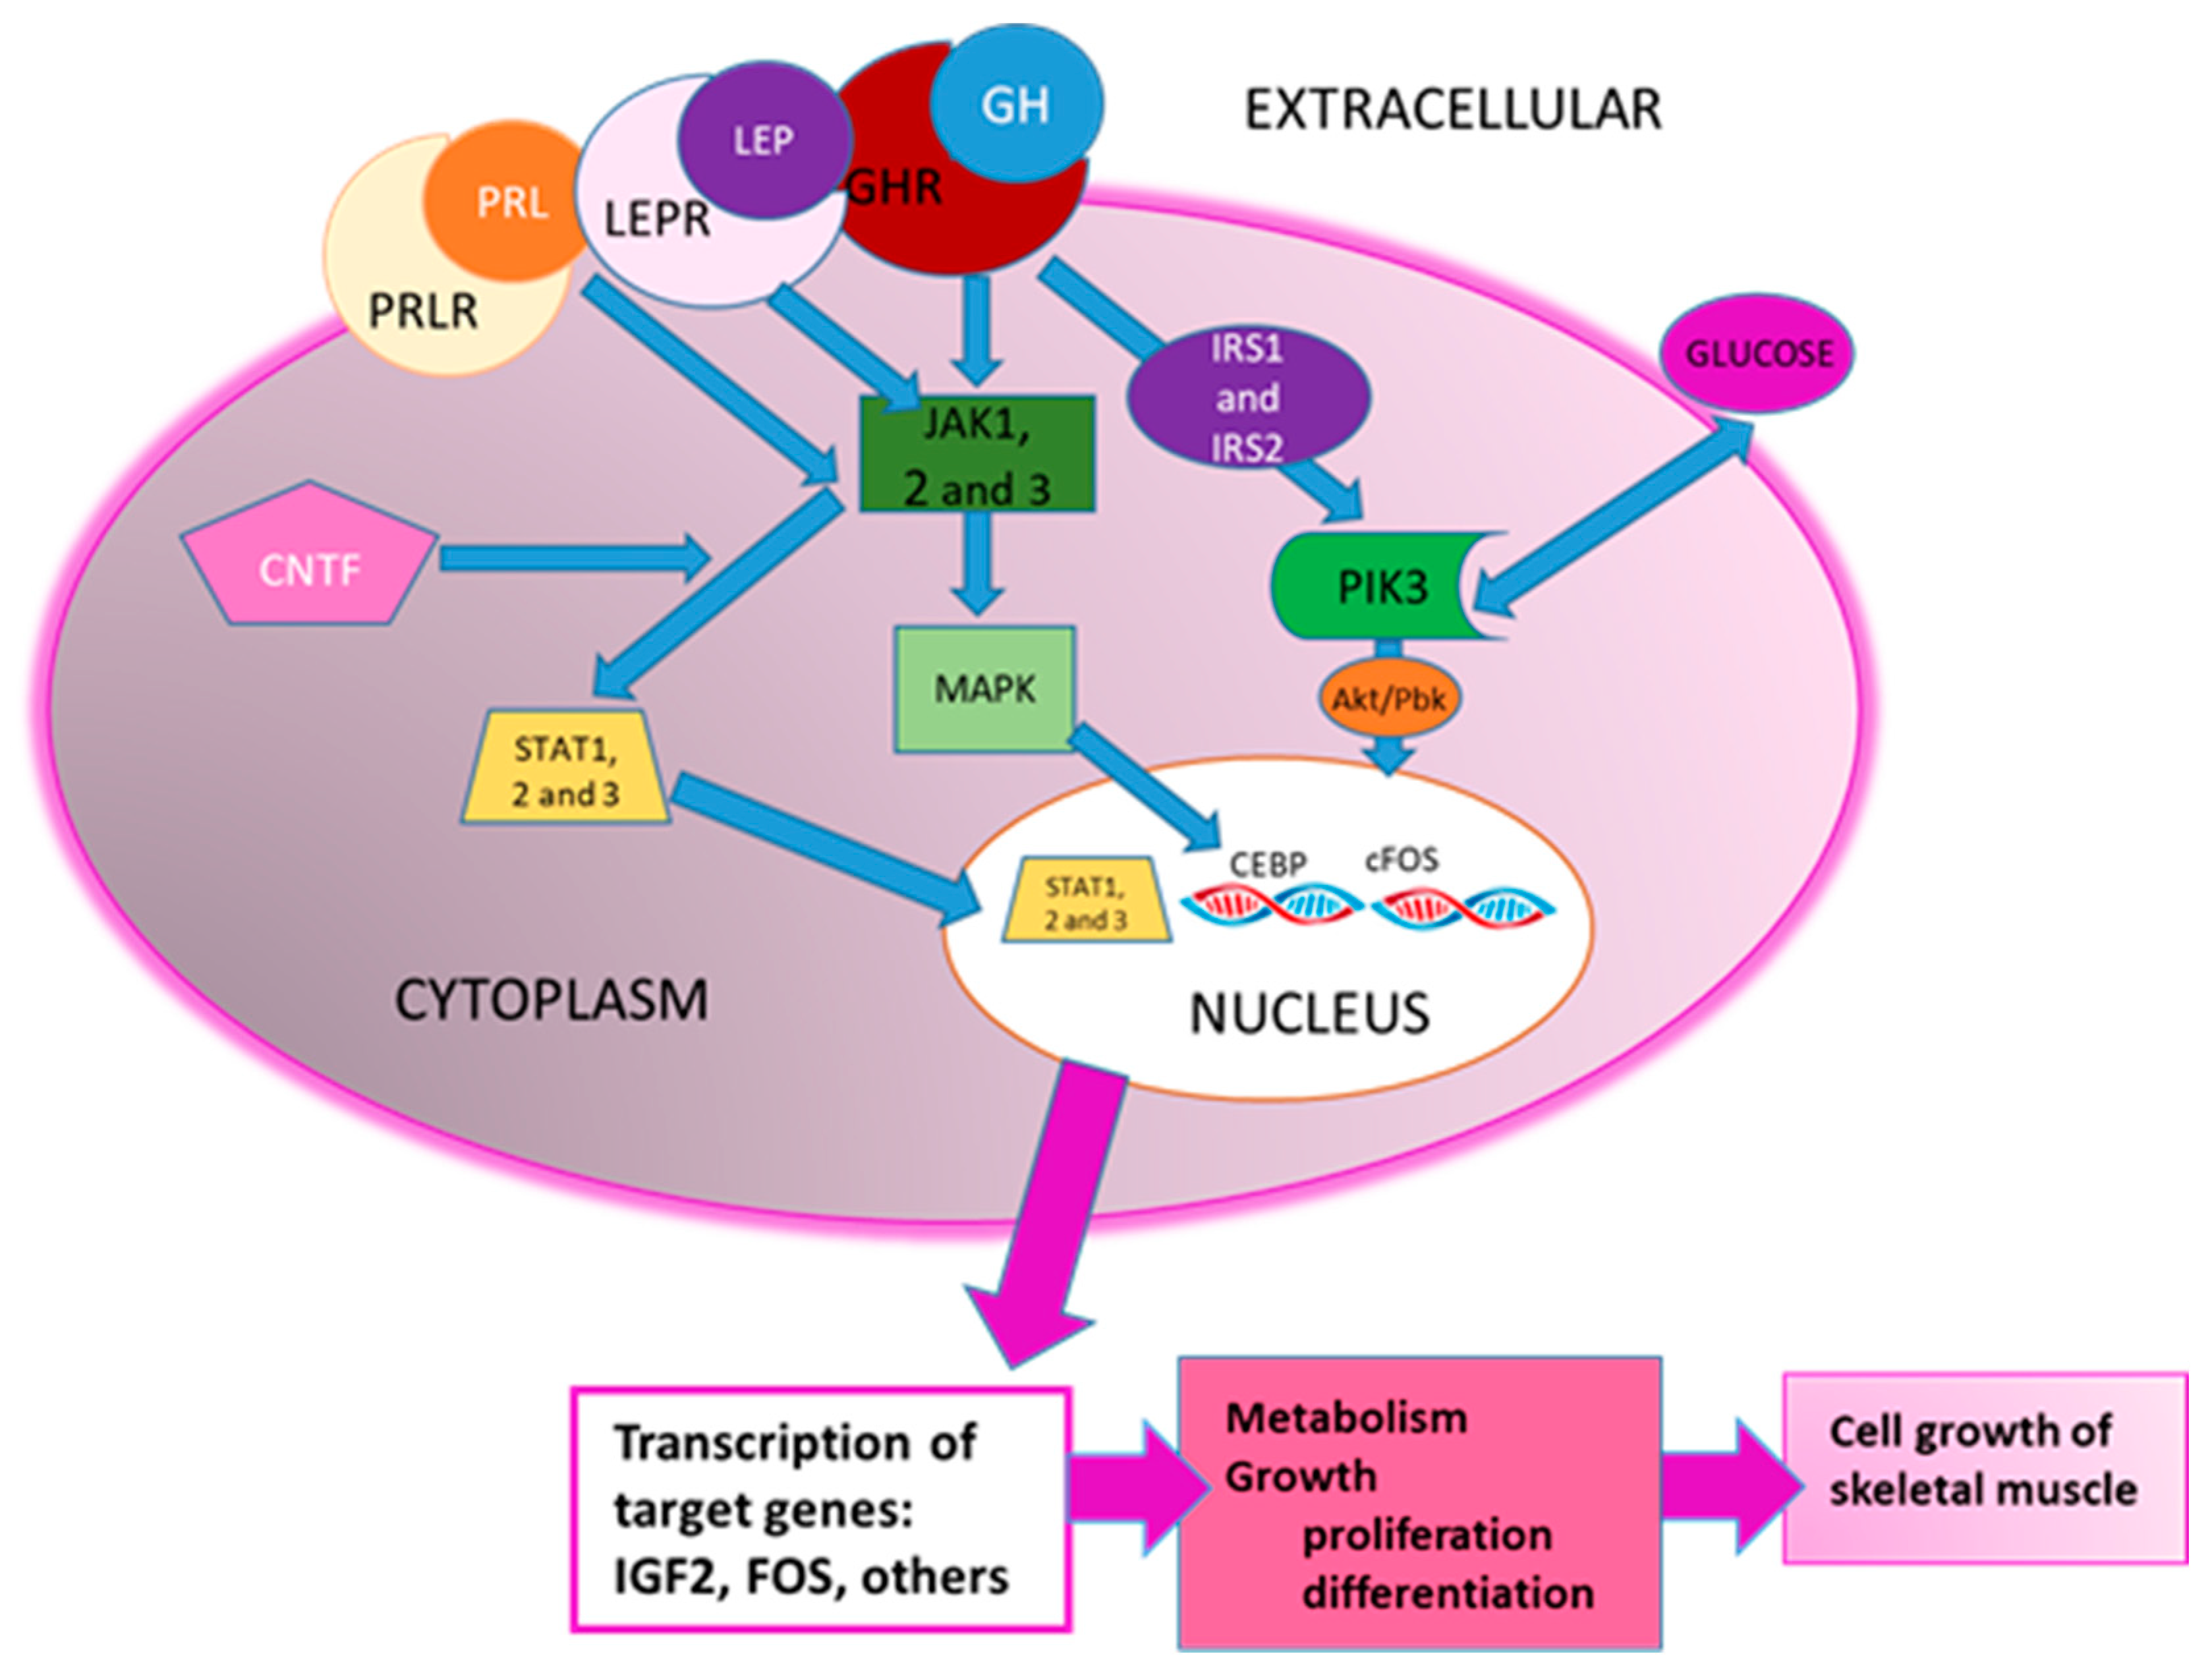
Functional Interpretation
Upstream Regulator Analysis
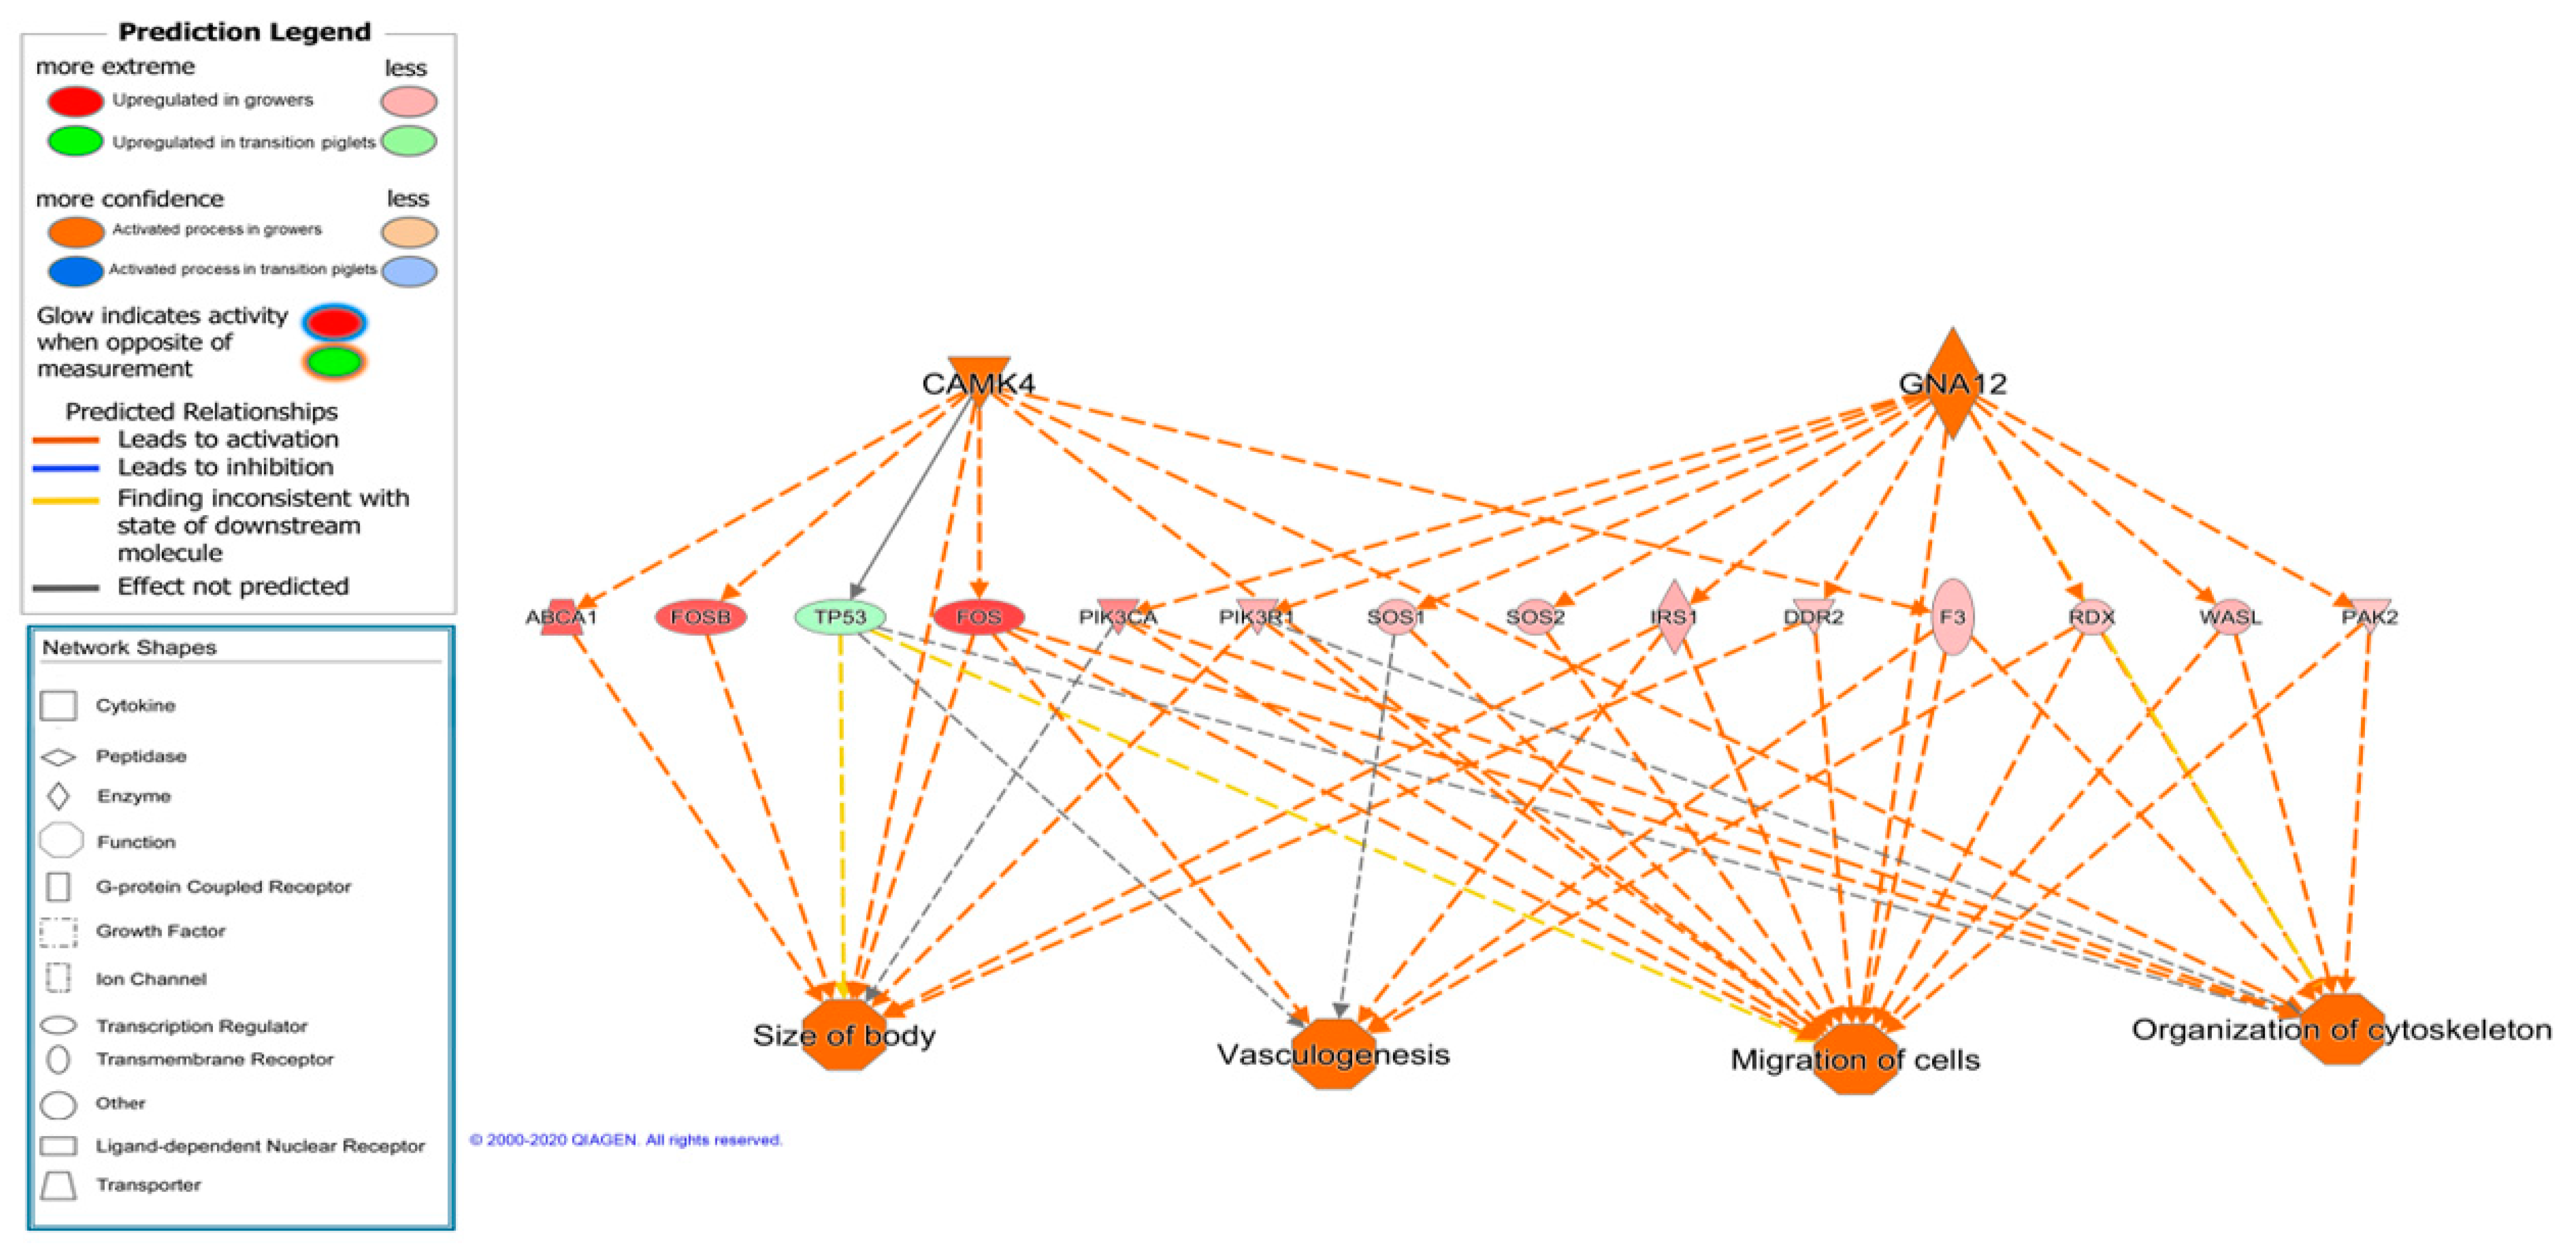
3.2.2. Breed Effects on the Transcriptome of Grower Pigs
Functional Interpretation
Upstream Regulator Analysis
Joint Interpretation of Age and Breed Effects on Muscle Transcriptome
3.2.3. Diet Effects on Muscle Transcriptome
3.2.4. Interactions Effects
3.2.5. Results Validation by Quantitative PCR (qPCR)
4. Conclusions
Supplementary Materials
Author Contributions
Funding
Institutional Review Board Statement
Informed Consent Statement
Data Availability Statement
Acknowledgments
Conflicts of Interest
References
- Lopez-Bote, C.J. Sustained Utilization of the Iberian Pig Breed. Meat Sci. 1998, 49, S17–S27. [Google Scholar] [CrossRef]
- Nieto, R.; García-Casco, J.; Lara, L.; Palma-Granados, P.; Izquierdo, M.; Hernandez, F.; Dieguez, E.; Luis Duarte, J.; Batorek-Lukač, N. Ibérico (iberian) pig. In European Local Pig Breeds—Diversity and Performance; A Study of Project Treasure; Candek-Potokar, M., Nieto Linan, R.M., Eds.; IntechOpen: London, UK, 2019. [Google Scholar] [CrossRef]
- Pugliese, C.; Sirtori, F. Quality of Meat and Meat Products Produced from Southern European Pig Breeds. Meat Sci. 2012, 90, 511–518. [Google Scholar] [CrossRef]
- Ayuso, M.; Fernández, A.; Núñez, Y.; Benítez, R.; Isabel, B.; Fernández, A.I.; Rey, A.I.; González-Bulnes, A.; Medrano, J.F.; Cánovas, Á.; et al. Developmental Stage, Muscle and Genetic Type Modify Muscle Transcriptome in Pigs: Effects on Gene Expression and Regulatory Factors Involved in Growth and Metabolism. PLoS ONE 2016, 11, e0167858. [Google Scholar] [CrossRef] [PubMed]
- Benítez, R.; Trakooljul, N.; Núñez, Y.; Isabel, B.; Murani, E.; De Mercado, E.; Gómez-Izquierdo, E.; García-Casco, J.; López-Bote, C.; Wimmers, K.; et al. Breed, Diet, and Interaction Effects on Adipose Tissue Transcriptome in Iberian and Duroc Pigs Fed Different Energy Sources. Genes 2019, 10, 589. [Google Scholar] [CrossRef]
- Pérez-Enciso, M.; Ferraz, A.L.J.; Ojeda, A.; López-Béjar, M. Impact of Breed and Sex on Porcine Endocrine Transcriptome: A Bayesian Biometrical Analysis. BMC Genom. 2009, 10, 89. [Google Scholar] [CrossRef] [PubMed]
- Ventanas, S.; Ventanas, J.; Jurado, A.; Estévez, M. Quality Traits in Muscle Biceps Femoris and Back-Fat from Purebred Iberian and Reciprocal Iberian × Duroc Crossbred Pigs. Meat Sci. 2006, 73, 651–659. [Google Scholar] [CrossRef] [PubMed]
- Benítez, R.; Fernández, A.; Isabel, B.; Núñez, Y.; De Mercado, E.; Gómez-Izquierdo, E.; García-Casco, J.; López-Bote, C.; Óvilo, C. Modulatory Effects of Breed, Feeding Status, and Diet on Adipogenic, Lipogenic, and Lipolytic Gene Expression in Growing Iberian and Duroc Pigs. Int. J. Mol. Sci. 2017, 19, 22. [Google Scholar] [CrossRef] [PubMed]
- Mayoral, A.I.; Dorado, M.; Guillén, M.T.; Robina, A.; Vivo, J.M.; Vázquez, C.; Ruiz, J. Development of Meat and Carcass Quality Characteristics in Iberian Pigs Reared Outdoors. Meat Sci. 1999, 52, 315–324. [Google Scholar] [CrossRef]
- Wood, J.D.; Enser, M.; Fisher, A.V.; Nute, G.R.; Sheard, P.R.; Richardson, R.I.; Hughes, S.I.; Whittington, F.M. Fat Deposition, Fatty Acid Composition and Meat Quality: A Review. Meat Sci. 2008, 78, 343–358. [Google Scholar] [CrossRef] [PubMed]
- Gao, S.Z.; Zhao, S.-M. Physiology, Affecting Factors and Strategies for Control of Pig Meat Intramuscular Fat. Recent Pat. Food Nutr. Agric. 2009, 1, 59–74. [Google Scholar]
- Sepe, A.; Tchkonia, T.; Thomou, T.; Zamboni, M.; Kirkland, J.L. Aging and Regional Differences in Fat Cell Progenitors—A Mini-Review. Gerontology 2011, 57, 66–75. [Google Scholar] [CrossRef]
- Gregoire, F.M.; Smas, C.M.; Sul, H.S. Understanding Adipocyte Differentiation. Physiol. Rev. 1998, 78, 783–809. [Google Scholar] [CrossRef]
- Schiaffino, S.; Dyar, K.A.; Ciciliot, S.; Blaauw, B.; Sandri, M. Mechanisms Regulating Skeletal Muscle Growth and Atrophy. FEBS J. 2013, 280, 4294–4314. [Google Scholar] [CrossRef] [PubMed]
- Zhao, X.; Mo, D.; Li, A.; Gong, W.; Xiao, S.; Zhang, Y.; Qin, L.; Niu, Y.; Guo, Y.; Liu, X.; et al. Comparative Analyses by Sequencing of Transcriptomes during Skeletal Muscle Development between Pig Breeds Differing in Muscle Growth Rate and Fatness. PLoS ONE 2011, 6, e19774. [Google Scholar] [CrossRef]
- Zhao, Y.; Li, J.; Liu, H.; Xi, Y.; Xue, M.; Liu, W.; Zhuang, Z.; Lei, M. Dynamic Transcriptome Profiles of Skeletal Muscle Tissue across 11 Developmental Stages for Both Tongcheng and Yorkshire Pigs. BMC Genom. 2015, 16, 377. [Google Scholar] [CrossRef]
- Ferraz, A.L.J.; Ojeda, A.; López-Béjar, M.; Fernandes, L.T.; Castelló, A.; Folch, J.M.; Pérez-Enciso, M. Transcriptome Architecture across Tissues in the Pig. BMC Genom. 2008, 9, 173. [Google Scholar] [CrossRef]
- Te Pas, M.F.W.; De Wit, A.A.W.; Priem, J.; Cagnazzo, M.; Davoli, R.; Russo, V.; Pool, M.H. Transcriptome Expression Profiles in Prenatal Pigs in Relation to Myogenesis. J. Muscle Res. Cell Motil. 2005, 26, 157–165. [Google Scholar] [CrossRef] [PubMed]
- Karlsson, A.; Enfält, A.C.; Essén-Gustavsson, B.; Lundström, K.; Rydhmer, L.; Stern, S. Muscle Histochemical and Biochemical Properties in Relation to Meat Quality during Selection for Increased Lean Tissue Growth Rate in Pigs. J. Anim. Sci. 1993, 71, 930–938. [Google Scholar] [CrossRef] [PubMed]
- Lefaucheur, L.; Lebret, B.; Ecolan, P.; Louveau, I.; Damon, M.; Prunier, A.; Billon, Y.; Sellier, P.; Gilbert, H. Muscle Characteristics and Meat Quality Traits Are Affected by Divergent Selection on Residual Feed Intake in Pigs. J. Anim. Sci. 2011, 89, 996–1010. [Google Scholar] [CrossRef]
- Liu, H.; Xi, Y.; Liu, G.; Zhao, Y.; Li, J.; Lei, M. Comparative Transcriptomic Analysis of Skeletal Muscle Tissue during Prenatal Stages in Tongcheng and Yorkshire Pig Using RNA-Seq. Funct. Integr. Genom. 2018, 18, 195–209. [Google Scholar] [CrossRef] [PubMed]
- Xu, J.; Wang, C.; Jin, E.; Gu, Y.; Li, S.; Li, Q. Identification of Differentially Expressed Genes in Longissimus Dorsi Muscle between Wei and Yorkshire Pigs Using RNA Sequencing. Genes Genom. 2018, 40, 413–421. [Google Scholar] [CrossRef] [PubMed]
- Óvilo, C.; Benítez, R.; Fernández, A.; Núñez, Y.; Ayuso, M.; Fernández, A.; Rodríguez, C.; Isabel, B.; Rey, A.; López-Bote, C.; et al. Longissimus Dorsi Transcriptome Analysis of Purebred and Crossbred Iberian Pigs Differing in Muscle Characteristics. BMC Genom. 2014, 15, 413. [Google Scholar] [CrossRef]
- Ayuso, M.; Fernández, A.; Núñez, Y.; Benítez, R.; Isabel, B.; Barragán, C.; Fernández, A.I.; Rey, A.I.; Medrano, J.F.; Cánovas, Á.; et al. Comparative Analysis of Muscle Transcriptome between Pig Genotypes Identifies Genes and Regulatory Mechanisms Associated to Growth, Fatness and Metabolism. PLoS ONE 2015, 10, e0145162. [Google Scholar] [CrossRef]
- Segura, J.; Lopez-Bote, C.J. A Laboratory Efficient Method for Intramuscular Fat Analysis. Food Chem. 2014, 145, 821–825. [Google Scholar] [CrossRef]
- Lopez-Bote, C.; Rey, A.; Ruiz, J.; Isabel, B.; Sanz Arias, R. Effect of Feeding Diets High in Monounsaturated Fatty Acids and α-Tocopheryl Acetate to Rabbits on Resulting Carcass Fatty Acid Profile and Lipid Oxidation. J. Anim. Sci. 1997, 64, 177–186. [Google Scholar] [CrossRef]
- Fernández-Barroso, M.Á.; Silió, L.; Rodríguez, C.; Palma-Granados, P.; López, A.; Caraballo, C.; Sánchez-Esquiliche, F.; Gómez-Carballar, F.; García-Casco, J.M.; Muñoz, M. Genetic Parameter Estimation and Gene Association Analyses for Meat Quality Traits in Open-air Free-range Iberian Pigs. J. Anim. Breed. Genet. 2020, 137, 581–598. [Google Scholar] [CrossRef]
- Garcia del Moral, R. Laboratorio de Anatomía Patológica; Interamericana-McGraw-Hill: Madrid, Spain, 1993. [Google Scholar]
- Kim, D.; Pertea, G.; Trapnell, C.; Pimentel, H.; Kelley, R.; Salzberg, S.L. TopHat2: Accurate Alignment of Transcriptomes in the Presence of Insertions, Deletions and Gene Fusions. Genome Biol. 2013, 14, R36. [Google Scholar] [CrossRef] [PubMed]
- Zerbino, D.R.; Achuthan, P.; Akanni, W.; Amode, M.R.; Barrell, D.; Bhai, J.; Billis, K.; Cummins, C.; Gall, A.; Girón, C.G.; et al. Ensembl 2018. Nucleic Acids Res. 2018, 46, D754–D761. [Google Scholar] [CrossRef]
- Lassmann, T.; Hayashizaki, Y.; Daub, C.O. SAMStat: Monitoring Biases in next Generation Sequencing Data. Bioinformatics 2011, 27, 130–131. [Google Scholar] [CrossRef] [PubMed]
- Okonechnikov, K.; Conesa, A.; García-Alcalde, F. Qualimap 2: Advanced Multi-Sample Quality Control for High-Throughput Sequencing Data. Bioinformatics 2016, 32, 292–294. [Google Scholar] [CrossRef]
- Anders, S.; Pyl, P.T.; Huber, W. HTSeq—A Python Framework to Work with High-Throughput Sequencing Data. Bioinformatics 2015, 31, 166–169. [Google Scholar] [CrossRef]
- Love, M.I.; Huber, W.; Anders, S. Moderated Estimation of Fold Change and Dispersion for RNA-Seq Data with DESeq2. Genome Biol. 2014, 15, 550. [Google Scholar] [CrossRef] [PubMed]
- Miron, M.; Woody, O.Z.; Marcil, A.; Murie, C.; Sladek, R.; Nadon, R. A Methodology for Global Validation of Microarray Experiments. BMC Bioinform. 2006, 7, 333. [Google Scholar] [CrossRef] [PubMed]
- Steibel, J.P.; Poletto, R.; Coussens, P.M.; Rosa, G.J.M. A Powerful and Flexible Linear Mixed Model Framework for the Analysis of Relative Quantification RT-PCR Data. Genomics 2009, 94, 146–152. [Google Scholar] [CrossRef] [PubMed]
- Vandesompele, J.; De Preter, K.; Pattyn, F.; Poppe, B.; Van Roy, N.; De Paepe, A.; Speleman, F. Accurate Normalization of Real-Time Quantitative RT-PCR Data by Geometric Averaging of Multiple Internal Control Genes. Genome Biol. 2002, 3. [Google Scholar] [CrossRef]
- Andersen, C.L.; Jensen, J.L.; Ørntoft, T.F. Normalization of Real-Time Quantitative Reverse Transcription-PCR Data: A Model-Based Variance Estimation Approach to Identify Genes Suited for Normalization, Applied to Bladder and Colon Cancer Data Sets. Cancer Res. 2004, 64, 5245–5250. [Google Scholar] [CrossRef]
- Krämer, A.; Green, J.; Pollard, J.; Tugendreich, S. Causal Analysis Approaches in Ingenuity Pathway Analysis. Bioinformatics 2014, 30, 523–530. [Google Scholar] [CrossRef] [PubMed]
- Lopes, P.A.; Costa, A.S.H.; Costa, P.; Pires, V.M.R.; Madeira, M.S.; Achega, F.; Pinto, R.M.A.; Prates, J.A.M. Contrasting Cellularity on Fat Deposition in the Subcutaneous Adipose Tissue and Longissimus Lumborum Muscle from Lean and Fat Pigs under Dietary Protein Reduction. Animal 2014, 8, 629–637. [Google Scholar] [CrossRef]
- Niñoles, L.; Mulet, A.; Ventanas, S.; Benedito, J. Ultrasonic Characterisation of B. Femoris from Iberian Pigs of Different Genetics and Feeding Systems. Meat Sci. 2011, 89, 174–180. [Google Scholar] [CrossRef]
- Rosenvold, K.; Andersen, H.J. Factors of Significance for Pork Quality-a Review. Meat Sci. 2003, 64, 219–237. [Google Scholar] [CrossRef]
- Boleman, S.J.; Boleman, S.L.; Miller, R.K.; Taylor, J.F.; Cross, H.R.; Wheeler, T.L.; Koohmaraie, M.; Shackelford, S.D.; Miller, M.F.; West, R.L.; et al. Consumer Evaluation of Beef of Known Categories of Tenderness. J. Anim. Sci. 1997, 75, 1521. [Google Scholar] [CrossRef]
- Fonseca, L.F.S.; Gimenez, D.F.J.; dos Santos Silva, D.B.; Barthelson, R.; Baldi, F.; Ferro, J.A.; Albuquerque, L.G. Differences in Global Gene Expression in Muscle Tissue of Nellore Cattle with Divergent Meat Tenderness. BMC Genom. 2017, 18, 945. [Google Scholar] [CrossRef] [PubMed]
- Carrapiso, A.I.; García, C. Instrumental Colour of Iberian Ham Subcutaneous Fat and Lean (Biceps Femoris): Influence of Crossbreeding and Rearing System. Meat Sci. 2005, 71, 284–290. [Google Scholar] [CrossRef] [PubMed]
- Almeida, J.; Bressan, M.C.; Santos-Silva, J.; Moreira, O.; Bettencourt, C.; Gama, L.T. Physicochemical Characteristics and Sensory Attributes of Meat from Heavy-Weight Iberian and F1 Large White × Landrace Pigs Finished Intensively or in Free-Range Conditions. J. Anim. Sci. 2018, 96, 2734–2746. [Google Scholar] [CrossRef] [PubMed]
- Lindahl, G.; Lundström, K.; Tornberg, E. Contribution of Pigment Content, Myoglobin Forms and Internal Reflectance to the Colour of Pork Loin and Ham from Pure Breed Pigs. Meat Sci. 2001, 59, 141–151. [Google Scholar] [CrossRef]
- Kouba, M.; Enser, M.; Whittington, F.M.; Nute, G.R.; Wood, J.D. Effect of a High-Linolenic Acid Diet on Lipogenic Enzyme Activities, Fatty Acid Composition, and Meat Quality in the Growing Pig. J. Anim. Sci. 2003, 81, 1967–1979. [Google Scholar] [CrossRef]
- Wood, J.D.; Nute, G.R.; Richardson, R.I.; Whittington, F.M.; Southwood, O.; Plastow, G.; Mansbridge, R.; da Costa, N.; Chang, K.C. Effects of Breed, Diet and Muscle on Fat Deposition and Eating Quality in Pigs. Meat Sci. 2004, 67, 651–667. [Google Scholar] [CrossRef] [PubMed]
- Bosch, L.; Tor, M.; Reixach, J.; Estany, J. Age-Related Changes in Intramuscular and Subcutaneous Fat Content and Fatty Acid Composition in Growing Pigs Using Longitudinal Data. Meat Sci. 2012, 91, 358–363. [Google Scholar] [CrossRef]
- Óvilo, C.; Benítez, R.; Fernández, A.; Isabel, B.; Núñez, Y.; Fernández, A.I.; Rodríguez, C.; Daza, A.; Silió, L.; López-Bote, C. Dietary Energy Source Largely Affects Tissue Fatty Acid Composition but Has Minor Influence on Gene Transcription in Iberian Pigs. J. Anim. Sci. 2014, 92, 939–954. [Google Scholar] [CrossRef]
- Guillevic, M.; Kouba, M.; Mourot, J. Effect of a Linseed Diet on Lipid Composition, Lipid Peroxidation and Consumer Evaluation of French Fresh and Cooked Pork Meats. Meat Sci. 2009, 81, 612–618. [Google Scholar] [CrossRef] [PubMed]
- Wang, H.F.; Ye, J.A.; Li, C.Y.; Liu, J.X.; Wu, Y.M. Effects of Feeding Whole Crop Rice Combined with Soybean Oil on Growth Performance, Carcass Quality Characteristics, and Fatty Acids Profile of Longissimus Muscle and Adipose Tissue of Pigs. Livest. Sci. 2011, 136, 64–71. [Google Scholar] [CrossRef]
- Pérez-Palacios, T.; Ruiz, J.; Tejeda, J.F.; Antequera, T. Subcutaneous and Intramuscular Lipid Traits as Tools for Classifying Iberian Pigs as a Function of Their Feeding Background. Meat Sci. 2009, 81, 632–640. [Google Scholar] [CrossRef] [PubMed]
- Ventanas, S.; Ventanas, J.; Ruiz, J. Sensory Characteristics of Iberian Dry-Cured Loins: Influence of Crossbreeding and Rearing System. Meat Sci. 2007, 75, 211–219. [Google Scholar] [CrossRef] [PubMed]
- Ix, J.H.; Shlipak, M.G.; Brandenburg, V.M.; Ali, S.; Ketteler, M.; Whooley, M.A. Association between Human Fetuin-A and the Metabolic Syndrome: Data from the Heart and Soul Study. Circulation 2006, 113, 1760–1767. [Google Scholar] [CrossRef] [PubMed]
- Chen, B.; You, W.; Wang, Y.; Shan, T. The Regulatory Role of Myomaker and Myomixer–Myomerger–Minion in Muscle Development and Regeneration. Cell. Mol. Life Sci. 2020, 77, 1551–1569. [Google Scholar] [CrossRef] [PubMed]
- Mohammadabadi, M.; Bordbar, F.; Jensen, J.; Du, M.; Guo, W. Key Genes Regulating Skeletal Muscle Development and Growth in Farm Animals. Animals 2021, 11, 835. [Google Scholar] [CrossRef]
- Wagner, K.R. Muscle Regeneration through Myostatin Inhibition. Curr. Opin. Rheumatol. 2005, 17, 720–724. [Google Scholar] [CrossRef]
- Cooper, G.M. The Cell: A Molecular Approach, 2nd ed.; ASM Press: Washington, DC, USA, 2000. [Google Scholar]
- Jang, Y.-N.; Baik, E.J. JAK-STAT Pathway and Myogenic Differentiation. JAK STAT 2013, 2, e23282. [Google Scholar] [CrossRef]
- Pagliarini, D.J.; Calvo, S.E.; Chang, B.; Sheth, S.A.; Vafai, S.B.; Ong, S.E.; Walford, G.A.; Sugiana, C.; Boneh, A.; Chen, W.K.; et al. A Mitochondrial Protein Compendium Elucidates Complex I Disease Biology. Cell 2008, 134, 112–123. [Google Scholar] [CrossRef] [PubMed]
- Verdin, E.; Hirschey, M.D.; Finley, L.W.S.; Haigis, M.C. Sirtuin Regulation of Mitochondria: Energy Production, Apoptosis, and Signaling. Trends Biochem. Sci. 2010, 35, 669–675. [Google Scholar] [CrossRef]
- Romanello, V.; Guadagnin, E.; Gomes, L.; Roder, I.; Sandri, C.; Petersen, Y.; Milan, G.; Masiero, E.; Del Piccolo, P.; Foretz, M.; et al. Mitochondrial Fission and Remodelling Contributes to Muscle Atrophy. EMBO J. 2010, 29, 1774–1785. [Google Scholar] [CrossRef]
- Benard, G.; Faustin, B.; Passerieux, E.; Galinier, A.; Rocher, C.; Bellance, N.; Delage, J.-P.; Casteilla, L.; Letellier, T.; Rossignol, R. Physiological Diversity of Mitochondrial Oxidative Phosphorylation. Am. J. Physiol. Cell Physiol. 2006, 291, 1172–1182. [Google Scholar] [CrossRef]
- Fernández-Vizarra, E.; Enríquez, J.A.; Pérez-Martos, A.; Montoya, J.; Fernández-Silva, P. Tissue-Specific Differences in Mitochondrial Activity and Biogenesis. Mitochondrion 2011, 11, 207–213. [Google Scholar] [CrossRef]
- Crupi, A.N.; Nunnelee, J.S.; Taylor, D.J.; Thomas, A.; Vit, J.-P.; Riera, C.E.; Gottlieb, R.A.; Goodridge, H.S. Oxidative Muscles Have Better Mitochondrial Homeostasis than Glycolytic Muscles throughout Life and Maintain Mitochondrial Function during Aging. Aging 2018, 10, 3327–3352. [Google Scholar] [CrossRef]
- Wagatsuma, A.; Sakuma, K. Mitochondria as a Potential Regulator of Myogenesis. Sci. World J. 2013, 2013, 593267. [Google Scholar] [CrossRef]
- Shintaku, J.; Peterson, J.M.; Talbert, E.E.; Gu, J.-M.; Ladner, K.J.; Williams, D.R.; Mousavi, K.; Wang, R.; Sartorelli, V.; Guttridge, D.C. MyoD Regulates Skeletal Muscle Oxidative Metabolism Cooperatively with Alternative NF-ΚB. Cell Rep. 2016, 17, 514–526. [Google Scholar] [CrossRef] [PubMed]
- Hüttemann, M.; Lee, I.; Samavati, L.; Yu, H.; Doan, J.W. Regulation of Mitochondrial Oxidative Phosphorylation through Cell Signaling. Biochim. Biophys. Acta (BBA) Mol. Cell Res. 2007, 1773, 1701–1720. [Google Scholar] [CrossRef] [PubMed]
- Srivastava, S. The Mitochondrial Basis of Aging and Age-Related Disorders. Genes 2017, 8, 398. [Google Scholar] [CrossRef] [PubMed]
- Olson, E.N.; Perry, M.; Schulz, R.A. Regulation of Muscle Differentiation by the MEF2 Family of MADS Box Transcription Factors. Dev. Biol. 1995, 172, 2–14. [Google Scholar] [CrossRef] [PubMed]
- Al-Khalili, L.; Chibalin, A.V.; Yu, M.; Sjödin, B.; Nylén, C.; Zierath, J.R.; Krook, A. MEF2 Activation in Differentiated Primary Human Skeletal Muscle Cultures Requires Coordinated Involvement of Parallel Pathways. Am. J. Physiol. Cell Physiol. 2004, 286, 1410–1416. [Google Scholar] [CrossRef]
- Potthoff, M.J.; Olson, E.N. MEF2: A Central Regulator of Diverse Developmental Programs. Development 2007, 134, 4131–4140. [Google Scholar] [CrossRef] [PubMed]
- Ohno, Y.; Saeki, K.; Yasunaga, S.; Kurogi, T.; Suzuki-Takedachi, K.; Shirai, M.; Mihara, K.; Yoshida, K.; Voncken, J.W.; Ohtsubo, M.; et al. Transcription of the Geminin Gene Is Regulated by a Negative-Feedback Loop. Mol. Biol. Cell 2014, 25, 1374–1383. [Google Scholar] [CrossRef] [PubMed]
- Blaeser, F.; Ho, N.; Prywes, R.; Chatila, T.A. Ca2+/− Dependent Gene Expression Mediated by MEF2 Transcription Factors. J. Biol. Chem. 2000, 275, 197–209. [Google Scholar] [CrossRef] [PubMed]
- Tateiwa, K.; Katoh, H.; Negishi, M. Socius, a Novel Binding Partner of Gα12/13, Promotes the Gα12-Induced RhoA Activation. Biochem. Biophys. Res. Commun. 2005, 337, 615–620. [Google Scholar] [CrossRef] [PubMed]
- Costa, M.L. Cytoskeleton and Adhesion in Myogenesis. ISRN Dev. Biol. 2014, 2014, 1–15. [Google Scholar] [CrossRef]
- Muroyama, A.; Lechler, T. Microtubule Organization, Dynamics and Functions in Differentiated Cells. Development 2017, 144, 3012–3021. [Google Scholar] [CrossRef]
- Xie, X.; Mahmood, S.R.; Gjorgjieva, T.; Percipalle, P. Emerging Roles of Cytoskeletal Proteins in Regulating Gene Expression and Genome Organization during Differentiation. Nucleus 2020, 11, 53–65. [Google Scholar] [CrossRef] [PubMed]
- Valiron, O.; Caudron, N.; Job, D. Microtubule Dynamics. Cell. Mol. Life Sci. 2001, 58, 2069–2084. [Google Scholar] [CrossRef]
- Mustyatsa, V.V.; Boyakhchyan, A.V.; Ataullakhanov, F.I.; Gudimchuk, N.B. EB-Family Proteins: Functions and Microtubule Interaction Mechanisms. Biochemistry 2017, 82, 791–802. [Google Scholar] [CrossRef]
- Wickstead, B.; Gull, K. The Evolution of the Cytoskeleton. J. Cell Biol. 2011, 194, 513–525. [Google Scholar] [CrossRef]
- Wang, E.; Gundersen, D. Increased Organization of Cytoskeleton Accompanying the Aging of Human Fibroblasts in Vitro. Exp. Cell Res. 1984, 154, 191–202. [Google Scholar] [CrossRef]
- Dogterom, M.; Koenderink, G.H. Actin-Microtubule Crosstalk in Cell Biology. Nat. Rev. Mol. Cell Biol. 2019, 20, 38–54. [Google Scholar] [CrossRef] [PubMed]
- Velleman, S.G. Meat Science and Muscle Biology Symposium: Extracellular Matrix Regulation of Skeletal Muscle Formation. J. Anim. Sci. 2012, 90, 936–941. [Google Scholar] [CrossRef]
- Thorsteinsdóttir, S.; Deries, M.; Cachaço, A.S.; Bajanca, F. The Extracellular Matrix Dimension of Skeletal Muscle Development. Dev. Biol. 2011, 354, 191–207. [Google Scholar] [CrossRef] [PubMed]
- Csapo, R.; Gumpenberger, M.; Wessner, B. Skeletal Muscle Extracellular Matrix—What Do We Know About Its Composition, Regulation, and Physiological Roles? A Narrative Review. Front. Physiol. 2020, 11, 253. [Google Scholar] [CrossRef] [PubMed]
- Ahmad, K.; Lee, E.; Moon, J.; Park, S.-Y.; Choi, I. Multifaceted Interweaving Between Extracellular Matrix, Insulin Resistance, and Skeletal Muscle. Cells 2018, 7, 148. [Google Scholar] [CrossRef]
- Vuolteenaho, R.; Nissinen, M.; Sainio, K.; Byers, M.; Eddy, R.; Hirvonen, H.; Shows, T.B.; Sariola, H.; Engvall, E.; Tryggvason, K. Human Laminin M Chain (Merosin): Complete Primary Structure, Chromosomal Assignment, and Expression of the M and A Chain in Human Fetal Tissues. J. Cell Biol. 1994, 124, 381–394. [Google Scholar] [CrossRef] [PubMed]
- Bhattacharya, T.K.; Shukla, R.; Chatterjee, R.N.; Bhanja, S.K. Comparative Analysis of Silencing Expression of Myostatin (MSTN) and Its Two Receptors (ACVR2A and ACVR2B) Genes Affecting Growth Traits in Knock down Chicken. Sci. Rep. 2019, 9, 7789. [Google Scholar] [CrossRef]
- Dietert, K.; Reppe, K.; Mundhenk, L.; Witzenrath, M.; Gruber, A.D. MCLCA3 Modulates IL-17 and CXCL-1 Induction and Leukocyte Recruitment in Murine Staphylococcus Aureus Pneumonia. PLoS ONE 2014, 9, e102606. [Google Scholar] [CrossRef] [PubMed]
- Yang, J.; Kalhan, S.C.; Hanson, R.W. What Is the Metabolic Role of Phosphoenolpyruvate Carboxykinase? J. Biol. Chem. 2009, 284, 27025–27029. [Google Scholar] [CrossRef] [PubMed]
- Brown, D.M.; Williams, H.; Ryan, K.J.P.; Wilson, T.L.; Daniel, Z.C.T.R.; Mareko, M.H.D.; Emes, R.D.; Harris, D.W.; Jones, S.; Wattis, J.A.D.; et al. Mitochondrial Phosphoenolpyruvate Carboxykinase (PEPCK-M) and Serine Biosynthetic Pathway Genes Are Co-Ordinately Increased during Anabolic Agent-Induced Skeletal Muscle Growth. Sci. Rep. 2016, 6, 28693. [Google Scholar] [CrossRef]
- He, K.; Wang, Q.; Wang, Z.; Pan, Y. Association Study between Gene Polymorphisms in PPAR Signaling Pathway and Porcine Meat Quality Traits. Mamm. Genome 2013, 24, 322–331. [Google Scholar] [CrossRef]
- Wise, E.M.; Ball, E.G. Malic enzyme and lipogenesis. Proc. Natl. Acad. Sci. USA 1964, 52, 1255–1263. [Google Scholar] [CrossRef] [PubMed]
- Stelmańska, E. Regulation of extramitochondrial malic enzyme gene expression in lipogenic tissues. Postepy Hig. Med. Dosw. 2007, 61, 664–671. [Google Scholar]
- Albuquerque, A.; Óvilo, C.; Núñez, Y.; Benítez, R.; López-Garcia, A.; García, F.; do Rosario Félix, M.; Laranjo, M.; Charneca, R.; Martins, J.M. Comparative Transcriptomic Analysis of Subcutaneous Adipose Tissue from Local Pig Breeds. Genes 2020, 11, 422. [Google Scholar] [CrossRef] [PubMed]
- Wakil, S.J.; Stoops, J.K.; Joshi, V.C. Fatty Acid Synthesis and Its Regulation. Annu. Rev. Biochem. 1983, 52, 537–579. [Google Scholar] [CrossRef]
- Heckmann, B.L.; Zhang, X.; Xie, X.; Liu, J. The G0/G1 Switch Gene 2 (G0S2): Regulating Metabolism and Beyond. Biochim. Biophys. Acta (BBA) Mol. Cell Biol. Lipids 2013, 1831, 276–281. [Google Scholar] [CrossRef]
- Behal, R.H.; Buxton, D.B.; Robertson, J.G.; Olson, M.S. Regulation of the Pyruvate Dehydrogenase Multienzyme Complex. Ann. Rev. Nutr. 1993, 13, 497–520. [Google Scholar] [CrossRef] [PubMed]
- Cadoudal, T.; Distel, E.; Durant, S.; Fouque, F.; Blouin, J.-M.; Collinet, M.; Bortoli, S.; Forest, C.; Benelli, C. Pyruvate Dehydrogenase Kinase 4: Regulation by Thiazolidinediones and Implication in Glyceroneogenesis in Adipose Tissue. Diabetes 2008, 57, 2272–2279. [Google Scholar] [CrossRef] [PubMed]
- Lan, J.; Lei, M.-G.; Zhang, Y.-B.; Wang, J.-H.; Feng, X.-T.; Xu, D.-Q.; Gui, J.-F.; Xiong, Y.-Z. Characterization of the Porcine Differentially Expressed PDK4 Gene and Association with Meat Quality. Mol. Biol. Rep. 2009, 36, 2003–2010. [Google Scholar] [CrossRef]
- Núñez, Y.; Radović, Č.; Savić, R.; García-Casco, J.M.; Čandek-Potokar, M.; Benítez, R.; Radojković, D.; Lukić, M.; Gogić, M.; Muñoz, M.; et al. Muscle Transcriptome Analysis Reveals Molecular Pathways Related to Oxidative Phosphorylation, Antioxidant Defense, Fatness and Growth in Mangalitsa and Moravka Pigs. Animals 2021, 11, 844. [Google Scholar] [CrossRef]
- Palma-Granados, P.; Seiquer, I.; Benítez, R.; Óvilo, C.; Nieto, R. Effects of Lysine Deficiency on Carcass Composition and Activity and Gene Expression of Lipogenic Enzymes in Muscles and Backfat Adipose Tissue of Fatty and Lean Piglets. Animal 2019, 13, 2406–2418. [Google Scholar] [CrossRef] [PubMed]
- Van Laere, A.-S.; Nguyen, M.; Braunschweig, M.; Nezer, C.; Collette, C.; Moreau, L.; Archibald, A.L.; Haley, C.S.; Buys, N.; Tally, M.; et al. A Regulatory Mutation in IGF2 Causes a Major QTL Effect on Muscle Growth in the Pig. Nature 2003, 425, 832–836. [Google Scholar] [CrossRef]
- Burgos, C.; Galve, A.; Moreno, C.; Altarriba, J.; Reina, R.; García, C.; López-Buesa, P. The Effects of Two Alleles of IGF2 on Fat Content in Pig Carcasses and Pork. Meat Sci. 2012, 90, 309–313. [Google Scholar] [CrossRef]
- Alves, E.; Fernández, A.I.; García-Cortés, L.A.; López, Á.; Benítez, R.; Rodríguez, C.; Silió, L. Is It Possible the Breed Origin Traceability of Iberian Pigs? CIHEAM 2012, 101, 8. [Google Scholar]
- Muñoz, M.; Bozzi, R.; García, F.; Núñez, Y.; Geraci, C.; Crovetti, A.; García-Casco, J.; Alves, E.; Škrlep, M.; Charneca, R.; et al. Diversity across Major and Candidate Genes in European Local Pig Breeds. PLoS ONE 2018, 13, e0207475. [Google Scholar] [CrossRef]
- Wang, Y.; Hudak, C.; Sul, H.S. Role of Preadipocyte Factor 1 in Adipocyte Differentiation. Clin. Lipidol. 2010, 5, 109–115. [Google Scholar] [CrossRef] [PubMed]
- Geven, C.; Kox, M.; Pickkers, P. Adrenomedullin and Adrenomedullin-Targeted Therapy as Treatment Strategies Relevant for Sepsis. Front. Immunol. 2018, 9, 292. [Google Scholar] [CrossRef]
- Bhat, F.A.; Advani, J.; Khan, A.A.; Mohan, S.; Pal, A.; Gowda, H.; Chakrabarti, P.; Keshava Prasad, T.S.; Chatterjee, A. A Network Map of Thrombopoietin Signaling. J. Cell Commun. Signal. 2018, 12, 737–743. [Google Scholar] [CrossRef]
- Torres-Rovira, L.; Astiz, S.; Caro, A.; Lopez-Bote, C.; Ovilo, C.; Pallares, P.; Perez-Solana, M.L.; Sanchez-Sanchez, R.; Gonzalez-Bulnes, A. Diet-Induced Swine Model with Obesity/Leptin Resistance for the Study of Metabolic Syndrome and Type 2 Diabetes. Sci. World J. 2012, 2012, 510149. [Google Scholar] [CrossRef]
- García-Contreras, C.; Madsen, O.; Groenen, M.A.M.; López-García, A.; Vázquez-Gómez, M.; Astiz, S.; Núñez, Y.; Benítez, R.; Fernández, A.; Isabel, B.; et al. Impact of Genotype, Body Weight and Sex on the Prenatal Muscle Transcriptome of Iberian Pigs. PLoS ONE 2020, 15, e0227861. [Google Scholar] [CrossRef]
- Szanto, A.; Narkar, V.; Shen, Q.; Uray, I.P.; Davies, P.J.A.; Nagy, L. Retinoid X Receptors: X-Ploring Their (Patho)Physiological Functions. Cell Death Differ. 2004, 11 (Suppl. S2), 126–143. [Google Scholar] [CrossRef] [PubMed]
- Lu, M.; Hartmann, D.; Braren, R.; Gupta, A.; Wang, B.; Wang, Y.; Mogler, C.; Cheng, Z.; Wirth, T.; Friess, H.; et al. Oncogenic Akt-FOXO3 Loop Favors Tumor-Promoting Modes and Enhances Oxidative Damage-Associated Hepatocellular Carcinogenesis. BMC Cancer 2019, 19, 887. [Google Scholar] [CrossRef]
- Stupack, D.G.; Cheresh, D.A. Integrins and Angiogenesis. Curr. Top. Dev. Biol. 2004, 64, 207–238. [Google Scholar] [CrossRef]
- Duda, D.G.; Fukumura, D.; Jain, R.K. Role of ENOS in Neovascularization: NO for Endothelial Progenitor Cells. Trends Mol. Med. 2004, 10, 143–145. [Google Scholar] [CrossRef]
- Van der Flier, A.; Sonnenberg, A. Function and Interactions of Integrins. Cell Tissue Res. 2001, 305, 285–298. [Google Scholar] [CrossRef]
- Purslow, P.P.; Archile-Contreras, A.C.; Cha, M.C. Meat Science and Muscle Biology Symposium: Manipulating Meat Tenderness by Increasing the Turnover of Intramuscular Connective Tissue. J. Anim. Sci. 2012, 90, 950–959. [Google Scholar] [CrossRef]
- Hausman, G.J.; Richardson, R.L.; Simmen, F.A. Expression of Insulin-like Growth Factor Binding Proteins (IGFBPs) before and during the Hormone Sensitive Period of Adipose Tissue Development in the Fetal Pig. Growth Dev. Aging 2000, 64, 51–67. [Google Scholar]
- Karunaratne, J.F.; Ashton, C.J.; Stickland, N.C. Fetal Programming of Fat and Collagen in Porcine Skeletal Muscles. J. Anat. 2005, 207, 763–768. [Google Scholar] [CrossRef] [PubMed]
- Karunaratne, J.P.; Bayol, S.A.; Ashton, C.J.; Simbi, B.H.; Stickland, N.C. Potential Molecular Mechanisms for the Prenatal Compartmentalisation of Muscle and Connective Tissue in Pigs. Differentiation 2009, 77, 290–297. [Google Scholar] [CrossRef] [PubMed]
- Serrano, M.P.; Valencia, D.G.; Nieto, M.; Lázaro, R.; Mateos, G.G. Influence of Sex and Terminal Sire Line on Performance and Carcass and Meat Quality of Iberian Pigs Reared under Intensive Production Systems. Meat Sci. 2008, 78, 420–428. [Google Scholar] [CrossRef]
- Girardi, E.; Fiume, G.; Goldmann, U.; Sin, C.; Müller, F.; Lindinger, S.; Sedlyarov, V.; Srndic, I.; Agerer, B.; Kartnig, F.; et al. A Systematic Genetic Interaction Map of Human Solute Carriers Assigns a Role to SLC25A51/MCART1 in Mitochondrial NAD Uptake. Cell Biol. 2020. [Google Scholar] [CrossRef]
- He, L.; Vasiliou, K.; Nebert, D.W. Analysis and Update of the Human Solute Carrier (SLC) Gene Superfamily. Hum. Genom. 2009, 3, 195. [Google Scholar] [CrossRef] [PubMed]
- Rivera-Ferre, M.G.; Aguilera, J.F.; Nieto, R. Muscle Fractional Protein Synthesis Is Higher in Iberian than in Landrace Growing Pigs Fed Adequate or Lysine-Deficient Diets. J. Nutr. 2005, 135, 469–478. [Google Scholar] [CrossRef][Green Version]
- Rivera-Ferre, M.G.; Aguilera, J.F.; Nieto, R. Differences in Whole-Body Protein Turnover between Iberian and Landrace Pigs Fed Adequate or Lysine-Deficient Diets 1, 2. J. Anim. Sci. 2006, 84, 3346–3355. [Google Scholar] [CrossRef]
- Nieto, R.; Miranda, A.; García, M.A.; Aguilera, J.F. The Effect of Dietary Protein Content and Feeding Level on the Rate of Protein Deposition and Energy Utilization in Growing Iberian Pigs from 15 to 50 kg Body Weight. Br. J. Nutr. 2002, 88, 39–49. [Google Scholar] [CrossRef]
- Duran-Montgé, P.; Theil, P.K.; Lauridsen, C.; Esteve-Garcia, E. Fat Metabolism Is Regulated by Altered Gene Expression of Lipogenic Enzymes and Regulatory Factors in Liver and Adipose Tissue but Not in Semimembranosus Muscle of Pigs during the Fattening Period. Animal 2009, 3, 1580–1590. [Google Scholar] [CrossRef]
- Benítez, R.; Núñez, Y.; Fernández, A.; Isabel, B.; Fernández, A.I.; Rodríguez, C.; Barragán, C.; Martín-Palomino, P.; López-Bote, C.; Silió, L.; et al. Effects of Dietary Fat Saturation on Fatty Acid Composition and Gene Transcription in Different Tissues of Iberian Pigs. Meat Sci. 2015, 102, 59–68. [Google Scholar] [CrossRef] [PubMed]
- Sihag, R.K.; Inagaki, M.; Yamaguchi, T.; Shea, T.B.; Pant, H.C. Role of Phosphorylation on the Structural Dynamics and Function of Types III and IV Intermediate Filaments. Exp. Cell Res. 2007, 313, 2098–2109. [Google Scholar] [CrossRef]
- Mallya, M.; Campbell, R.D.; Aguado, B. Transcriptional Analysis of a Novel Cluster of LY-6 Family Members in the Human and Mouse Major Histocompatibility Complex: Five Genes with Many Splice Forms. Genomics 2002, 80, 113–123. [Google Scholar] [CrossRef] [PubMed]
- Savio-Galimberti, E.; Weeke, P.; Muhammad, R.; Blair, M.; Ansari, S.; Short, L.; Atack, T.C.; Kor, K.; Vanoye, C.G.; Olesen, M.S.; et al. SCN10A/Nav1.8 Modulation of Peak and Late Sodium Currents in Patients with Early Onset Atrial Fibrillation. Cardiovasc. Res. 2014, 104, 355–363. [Google Scholar] [CrossRef] [PubMed]
- Heissler, S.M.; Sellers, J.R. Myosin Light Chains: Teaching Old Dogs New Tricks. BioArchitecture 2014, 4, 169–188. [Google Scholar] [CrossRef] [PubMed]
- Martin, C.; Passilly-Degrace, P.; Gaillard, D.; Merlin, J.-F.; Chevrot, M.; Besnard, P. The Lipid-Sensor Candidates CD36 and GPR120 Are Differentially Regulated by Dietary Lipids in Mouse Taste Buds: Impact on Spontaneous Fat Preference. PLoS ONE 2011, 6, e24014. [Google Scholar] [CrossRef] [PubMed]
- Degrace-Passilly, P.; Besnard, P. CD36 and Taste of Fat. Curr. Opin. Clin. Nutr. Metab. Care 2012, 15, 107–111. [Google Scholar] [CrossRef]


| Diets | Carbohydrate (CH) 2 | High Oleic (HO) 3 |
|---|---|---|
| Chemical composition, g/kg of feed | ||
| Moisture | 87.4 | 88.81 |
| Lipids | 24.53 | 77.65 |
| Crude protein | 156.00 | 156.00 |
| Crude fiber | 29.71 | 45.27 |
| Nitrogen-free extractives | 515.75 | 404.39 |
| Ash | 44.34 | 67.91 |
| Main Fatty acids, g/kg of feed | ||
| C14:0 | 0.14 | 0.13 |
| C16:0 | 4.83 | 7.19 |
| C18:0 | 0.84 | 1.83 |
| C18:1 n-9 | 9.47 | 36.82 |
| C18:2 n-6 | 14.24 | 16.68 |
| C18:3 n-3 | 0.99 | 1.21 |
| Ingredients, % | ||
| Wheat | 30 | 25 |
| Wheat bran | -- | 7 |
| Corn | 33.90 | -- |
| Barley | 16.87 | 38.87 |
| Soybean meal (44%) | 16.88 | 15.53 |
| Calcium carbonate | 0.83 | 0.75 |
| Bicalcium phosphate | 0.85 | 0.69 |
| Marine Salt | 0.40 | 0.40 |
| Sepiolite | -- | 2.00 |
| High oleic sunflower oil | -- | 6.00 |
| L-Lysine | 0.07 | 0.06 |
| Vitamin and mineral premix | 0.2 | 0.2 |
| Diet Effect | Breed Effect | Interaction Effect | |||||
|---|---|---|---|---|---|---|---|
| Trait | CH (n = 22) Mean (s.e) | HO (n = 27) Mean (s.e) | p-Value | Iberian (n = 30) Mean (s.e) | Duroc (n = 19) Mean (s.e) | p-Value | p-Value Diet × Breed |
| Thawing Loss (%) | 16.78(1.37) | 16.26(1.32) | n.s. | 16.18(1.10) | 17.22(1.58) | n.s. | n.s. |
| Cooking Loss (%) | 27.74(1.21) | 28.65(1.17) | n.s. | 25.63(0.98) | 30.77(1.39) | 0.005 | n.s. |
| Shear Force (Kg/cm2) | 4.35(0.26) | 4.16(0.25) | 0.07 | 3.87(0.25) | 4.64(0.29) | 0.05 | 0.03 |
| L* Lightness | 48.83(0.78) | 48.38(0.75) | n.s. | 49.29(0.67) | 47.91(0.90) | 0.09 | n.s. |
| a* redness | 5.53(0.39) | 5.79(0.38) | n.s. | 5.43(0.34) | 5.88(0.46) | n.s. | n.s. |
| b* yellowness | 6.27(0.16) | 6.52(0.15) | n.s. | 6.77(0.15) | 6.02(0.18) | 0.009 | n.s. |
| Pathways Activated in Transition Piglets | |||
| Pathways | Related Functions | p-Value | z-Score |
| Oxidative Phosphorylation | Cell proliferation | 0.001 | −4.243 |
| Cell cycle control of chromosomal replication | Cell proliferation | 5.13 × 10⁻⁷ | −2.668 |
| PTEN Signaling | Cell proliferation and differentiation | 0.003 | −2.500 |
| Estrogen-mediated S-phase Entry | Regulation of cell cycle | 0.0001 | −2.333 |
| Pathways Activated in Grower Pigs | |||
| Pathways | Related Functions | p-Value | z-Score |
| NF-kB Signaling | Development and cell growth | 0.005 | 4.379 |
| Adrenomedullin signaling pathway | Angiogenesis | 0.001 | 3.922 |
| Melanocyte Development and Pigmentation Signaling | Development | 6.3 × 10⁻⁶ | 3.578 |
| NGF Signaling | Regulation of development and differentiation | 1.2 × 10⁻⁶ | 3.411 |
| ERK5 Signaling | Cell proliferation and differentiation | 1.2 × 10⁻⁶ | 3.3 |
| AMPK Signaling | Regulating growth and reprogramming metabolism | 2.8 × 10⁻⁵ | 3.272 |
| CNTF Signaling | Activates JAK-STAT signaling, related to myogenic differentiation | 1.6 × 10⁻⁵ | 3.207 |
| FGF Signaling | Regulation of proliferation, survival, migration and differentiation | 0.004 | 3.207 |
| p38 MAPK Signaling | Myogenic differentiation | 0.008 | 3.207 |
| Role of NANOG in Mammalian Embryonic Stem Cell Pluripotency | Embryonic development | 0.0002 | 3.051 |
| ErbB Signaling | Cell migration, proliferation, differentiation | 0.002 | 2.84 |
| Ephrin Receptor Signaling | Controls actin cytoskeleton dynamics | 0.0005 | 2.837 |
| HGF Signaling | Regulates cell growth, motility, and morphogenesis | 0.0007 | 2.828 |
| GM-CSF Signaling | Cell survival, proliferation and functional activation | 0.006 | 2.714 |
| IL-6 Signaling | Multifunctional cytokine that regulates organ development | 0.0002 | 2.683 |
| Sirtuin Signaling Pathway | Cell proliferation, differentiation, senescence, apoptosis, and metabolism | 0.0008 | 2.611 |
| IL-2 Signaling | Organ development | 0.006 | 2.53 |
| Thrombopoietin Signaling | Proliferation, differentiation and cell survival | 0.008 | 2.53 |
| EGF Signaling | Regulate cell growth, survival, proliferation and differentiation | 0.0002 | 2.496 |
| Antiproliferative Role of Somatostatin Receptor 2 | Inhibition of proliferation and/or the induction of apoptosis via interactions with a GPRCs family | 0.01 | 2.333 |
| PDGF Signaling | Development, cell proliferation, migration and angiogenesis | 0.0007 | 2.324 |
| Prolactin Signaling | Growth and development | 0.0001 | 2.138 |
| Growth Hormone Signaling | Growth and development | 0.0008 | 2.138 |
| Signaling by Rho Family GTPases | Cytoskeleton signaling and ECM | 0.0009 | 2.117 |
| Apelin Endothelial Signaling Pathway | Angiogenesis | 0.0004 | 2.065 |
| Actin Cytoskeleton Signaling | Cytoskeleton signaling and ECM | 0.005 | 2.041 |
| JAK/Stat Signaling | Myogenic differentiation | 9.1 × 10⁻⁵ | 2 |
| Upstream Regulator | Molecule Type | Activation z-Score 1 | p-Value | Molecules in Dataset | Related Functions |
|---|---|---|---|---|---|
| Activated in Transition Piglets | |||||
| CSF2 | cytokine | −4.590 | 1.10 × 10⁻⁸ | 52 | Inflammatory and immune response |
| ERBB2 | kinase | −4.408 | 8.77 × 10⁻⁹ | 78 | Cell growth and division |
| STK11 | kinase | −4.207 | 3.20 × 10⁻⁵ | 32 | Cell metabolism and energy homeostasis |
| MIR17HG | other | −3.756 | 4.70 × 10⁻⁴ | 21 | Cell survival, proliferation, differentiation, and angiogenesis |
| EP400 | other | −3.317 | 1.77 × 10⁻¹⁰ | 18 | Cell proliferation |
| AREG | growth factor | −3.308 | 6.11 × 10⁻⁶ | 18 | Regulation of cell population proliferation |
| PTGER2 | G-protein-coupled receptor | −3.273 | 1.65 × 10⁻⁵ | 21 | Regulation of cell population proliferation and inflammatory response |
| MITF | transcription regulator | −3.272 | 1.56 × 10⁻⁶ | 28 | Regulation of melanocyte development |
| E2f | group | −3.259 | 5.45 × 10⁻⁵ | 20 | Protein synthesis |
| RABL6 | other | −3.176 | 4.00 × 10⁻⁷ | 18 | Cell growth and survival |
| GMNN | transcription regulator | −3.162 | 0.01 | 12 | Cell cycle control |
| Activated in growers | |||||
| RICTOR | other | 4.730 | 0.03 | 30 | Regulation of cell cycle |
| CD24 | other | 4.600 | 7.90 × 10⁻¹⁰ | 28 | Modulation and differentiation of cell B growth |
| KLF4 | transcription regulator | 3.386 | 0.005 | 26 | Down-regulation of cell proliferation |
| MEF2D | transcription regulator | 3.238 | 0.0001 | 14 | Control of muscle and neuronal cell differentiation |
| Irgm1 | other | 3.148 | 0.002 | 10 | Innate immune response |
| TCF7L2 | transcription regulator | 3.072 | 3.05 × 10⁻⁵ | 46 | Glucose metabolism |
| PDGF BB | complex | 3.062 | 0.001 | 20 | Regulate cell growth and division |
| Canonical Pathways | p-Value | Activation | z-Score | Molecules |
|---|---|---|---|---|
| GM-CSF Signaling | 0.08 | Iberian | −2.236 | CISH, JAK2, PIK3R1, RASD2, RUNX1, STAT1 |
| Growth Hormone Signaling | 0.09 | Iberian | −2.236 | FOS, GHR, IGF2, JAK2, PIK3R1, STAT1 |
| Retinol Biosynthesis | 0.03 | Duroc | 2.236 | CEL, CES1, CES3, RBP7, RDH13 |
| LXR/RXR Activation | 0.001 | Duroc | 2.111 | ARG2, FASN, IL18, IL1RAP, ITIH4, LDLR, LYZ, MLXIPL, NOR1, NOS2, PON3, RBP4, SERPINA1, TNFR1B |
| Superpathway of Serine and Glycine Biosynthesis I | 0.0001 | Duroc | 2.000 | PHGDH, PSAT1, PSPH, SHMT2 |
| Retinoate Biosynthesis I | 0.05 | Duroc | 2.000 | DHRS7C, RBP7, RDH13, RDH16 |
| Upstream Regulator | Molecule Type | Activation z-Score 1 | p-Value | Molecules in Dataset | Related Functions |
|---|---|---|---|---|---|
| Activated in Iberian | |||||
| NUPR1 | transcription regulator | −2.897 | 0.00005 | 10 | Muscle cell apoptotic process |
| FOXO3 | transcription regulator | −2.845 | 0.00006 | 10 | Cellular response to glucose stimulus, hypoxia and oxidative stress. Control muscle growth |
| ALDH2 | enzyme | −2.813 | 8.08 × 10⁻⁷ | 8 | Carbohydrate metabolic, oxidation–reduction and apoptotic process |
| PDGF BB | complex | −2.764 | 0.0008 | 10 | Proliferation and phosphorylation |
| HDL-cholesterol | complex | −2.400 | 0.006 | 6 | Transport of lipids |
| GLI3 | transcription regulator | −2.339 | 0.001 | 9 | Developmental growth |
| F7 | peptidase | −2.236 | 0.009 | 5 | Regulation of leukocyte chemotaxis, protein processing, response to cholesterol and hypoxia |
| Rb | group | −2.219 | 0.0006 | 8 | Cell differentiation and growth regulation of cell cycle |
| ICAM1 | transmembrane receptor | −2.200 | 0.008 | 5 | Cellular response to glucose stimulus, nutrient levels and hypoxia. Inflammatory response |
| MAP3K8 | kinase | −2.145 | 0.002 | 10 | MAPK and Insulin signaling, immune response and protein phosphorylation |
| IB3 | kinase | −2.135 | 0.00001 | 8 | Response to stress, insulin signaling, FA biosynthetic and lipid metabolic process |
| HDAC2 | transcription regulator | −2.121 | 0.01 | 10 | Circadian regulation of gene expression, muscle cell development and deacetylase activity |
| Activated in Duroc | |||||
| MITF | transcription regulator | 2.688 | 0.0003 | 10 | Development and growth |
| COL6A1 | other | 2.214 | 0.0003 | 5 | Extracellular matrix organization and platelet-derived growth factor binding |
| IGF2BP1 | translation regulator | 2.200 | 0.009 | 5 | Growth, regulator of IGF2 translation |
| COLQ | other | 2.178 | 0.01 | 8 | Extracellular matrix organization and protein binding |
| RABL6 | other | 2.121 | 0.009 | 8 | Cell growth and GPT protein binding |
| UCP1 | transporter | 2.055 | 0.000008 | 10 | Response to cold, fatty acid and ROS, long-chain fatty acid binding and oxidative phosphorylation |
| IDO1 | enzyme | 2.000 | 0.01 | 5 | Inflammatory response, immune system process |
| Group of Animals | No. DEGs | No. Upregulated in HO | Genes Upregulated in HO | FC Rank | No. Upregulated in CH | Genes Upregulated in CH | FC Rank |
|---|---|---|---|---|---|---|---|
| Iberian transition piglets | 8 | 6 | FGG, FGB, ALB, FGF21, MIOX, CYP2D25 | 5.3–38.3 | 2 | PHACTR3, INSIG1 | 1.9–3.9 |
| Iberian growers | 8 | 4 | ENSSSCG00000003278, MYL4, ACP5, UNC93B1 | 1.6–10.7 | 4 | PDE7B, DNAJB1, NEDD4L, ENSSSCG00000029160 | 1.6–1.9 |
| Duroc growers | 3 | 1 | MYH11 | 1.7 | 2 | SLA-5, MYL4 | 3.5–4.4 |
| AGE EFFECT IN IBERIAN | RNA Seq (n = 12) | qPCR (n = 12) | p-Value | |||
| Gene Symbol | p-Value | Fold Change | p-Value | Fold Change | Correlation (r) | (H0: r = 0) |
| Genes upregulated in piglets | ||||||
| PVALB | 4.76 × 10⁻⁷ | 2.70 | 0.02 | 1.34 | 0.75 | 0.004 |
| DAPK3 | 1.36 × 10⁻⁶ | 1.58 | <0.0001 | 5.21 | 0.62 | 0.004 |
| GPX2 | 2.80 × 10⁻¹⁰ | 7.24 | 0.01 | 1.93 | 0.86 | 5.81 × 10⁻⁸ |
| MTUS2 | 4.94 × 10⁻¹⁰ | 3.57 | 0.01 | 1.82 | 0.61 | 0.002 |
| MGLL | 0.05 | 1.24 | 0.4 | 1.34 | 0.58 | 0.03 |
| Genes upregulated in growers | ||||||
| ME1 | 3.10 × 10⁻⁴ | 0.59 | 0.02 | 0.59 | 0.84 | 2.15 × 10⁻⁷ |
| LEP | 0.001 | 0.33 | 0.0009 | 0.32 | 0.82 | 1.11 × 10⁻⁶ |
| MSTN | 5.00 × 10⁻⁵ | 0.44 | 0.01 | 0.7 | 0.83 | 4.08 × 10⁻⁷ |
| IGF2 | 0.43 | 0.88 | 0.7 | 0.96 | 0.52 | 0.01 |
| FASN | 0.01 | 0.48 | 0.06 | 0.73 | 0.78 | 8.04 × 10⁻⁶ |
| NR4A3 | 0.59 | 0.76 | 0.5 | 0.67 | 0.94 | 1.84 × 10⁻¹¹ |
| PON3 | 0.009 | 0.75 | 0.002 | 0.63 | 0.7 | 0.01 |
| BREED EFFECT | RNA Seq (n = 12) | qPCR (n = 12) | p-Value | |||
| Gene Symbol | p-Value | Fold Change | p-Value | Fold Change | Correlation (r) | (H0: r = 0) |
| Genes upregulated in Iberian pigs | ||||||
| FASN | 0.01 | 1.99 | 0.08 | 1.21 | 0.77 | 1.03 × 10⁻⁵ |
| ME1 | 4.45 × 10⁻⁵ | 1.62 | 0.02 | 1.57 | 0.84 | 2.44 × 10⁻⁷ |
| NR4A3 | 0.01 | 2.74 | 0.05 | 1.48 | 0.90 | 1.76 × 10⁻⁹ |
| PON3 | 4.59 × 10⁻¹⁰ | 12.34 | <0.0001 | 5.30 | 0.89 | 4.77 × 10⁻⁹ |
| LEP | 0.07 | 1.62 | 0.08 | 1.15 | 0.81 | 1.71 × 10⁻⁶ |
| MSTN | 0.06 | 1.37 | 0.2 | 1.08 | 0.78 | 6.31 × 10⁻⁶ |
| Genes upregulated in Duroc pigs | ||||||
| IGF2 | 1.92 × 10⁻⁷ | 0.33 | <0.0001 | 0.40 | 0.83 | 5.06 × 10⁻⁷ |
| PVALB | 2.62 × 10⁻⁶ | 0.42 | 0.0008 | 0.55 | 0.68 | 0.0003 |
| DAPK3 | 1.61 × 10⁻¹³ | 0.53 | 0.001 | 0.58 | 0.73 | 4.69 × 10⁻⁵ |
| GPX2 | 4.78 × 10⁻¹⁰ | 0.12 | 0.003 | 0.49 | 0.80 | 2.50 × 10⁻⁶ |
| MTUS2 | 2.52 × 10⁻¹⁸ | 0.31 | <0.0001 | 0.30 | 0.78 | 6.16 × 10⁻⁶ |
| MGLL | 0.0001 | 0.66 | 0.03 | 0.73 | 0.69 | 0.0003 |
Publisher’s Note: MDPI stays neutral with regard to jurisdictional claims in published maps and institutional affiliations. |
© 2021 by the authors. Licensee MDPI, Basel, Switzerland. This article is an open access article distributed under the terms and conditions of the Creative Commons Attribution (CC BY) license (https://creativecommons.org/licenses/by/4.0/).
Share and Cite
Benítez, R.; Núñez, Y.; Ayuso, M.; Isabel, B.; Fernández-Barroso, M.A.; De Mercado, E.; Gómez-Izquierdo, E.; García-Casco, J.M.; López-Bote, C.; Óvilo, C. Changes in Biceps femoris Transcriptome along Growth in Iberian Pigs Fed Different Energy Sources and Comparative Analysis with Duroc Breed. Animals 2021, 11, 3505. https://doi.org/10.3390/ani11123505
Benítez R, Núñez Y, Ayuso M, Isabel B, Fernández-Barroso MA, De Mercado E, Gómez-Izquierdo E, García-Casco JM, López-Bote C, Óvilo C. Changes in Biceps femoris Transcriptome along Growth in Iberian Pigs Fed Different Energy Sources and Comparative Analysis with Duroc Breed. Animals. 2021; 11(12):3505. https://doi.org/10.3390/ani11123505
Chicago/Turabian StyleBenítez, Rita, Yolanda Núñez, Miriam Ayuso, Beatriz Isabel, Miguel A. Fernández-Barroso, Eduardo De Mercado, Emilio Gómez-Izquierdo, Juan M. García-Casco, Clemente López-Bote, and Cristina Óvilo. 2021. "Changes in Biceps femoris Transcriptome along Growth in Iberian Pigs Fed Different Energy Sources and Comparative Analysis with Duroc Breed" Animals 11, no. 12: 3505. https://doi.org/10.3390/ani11123505
APA StyleBenítez, R., Núñez, Y., Ayuso, M., Isabel, B., Fernández-Barroso, M. A., De Mercado, E., Gómez-Izquierdo, E., García-Casco, J. M., López-Bote, C., & Óvilo, C. (2021). Changes in Biceps femoris Transcriptome along Growth in Iberian Pigs Fed Different Energy Sources and Comparative Analysis with Duroc Breed. Animals, 11(12), 3505. https://doi.org/10.3390/ani11123505