Evaluation of Phosphorus Digestibility from Monocalcium and Dicalcium Phosphate Sources and Comparison between Total Tract and Prececal Digestibility Standard Methods in Broilers
Abstract
Simple Summary
Abstract
1. Introduction
2. Materials and Methods
2.1. Animals
2.2. Test Products
2.3. Diets
2.4. Experimental Procedure
2.5. Analytical Methods
2.6. Phosphorus Digestibility Calculations
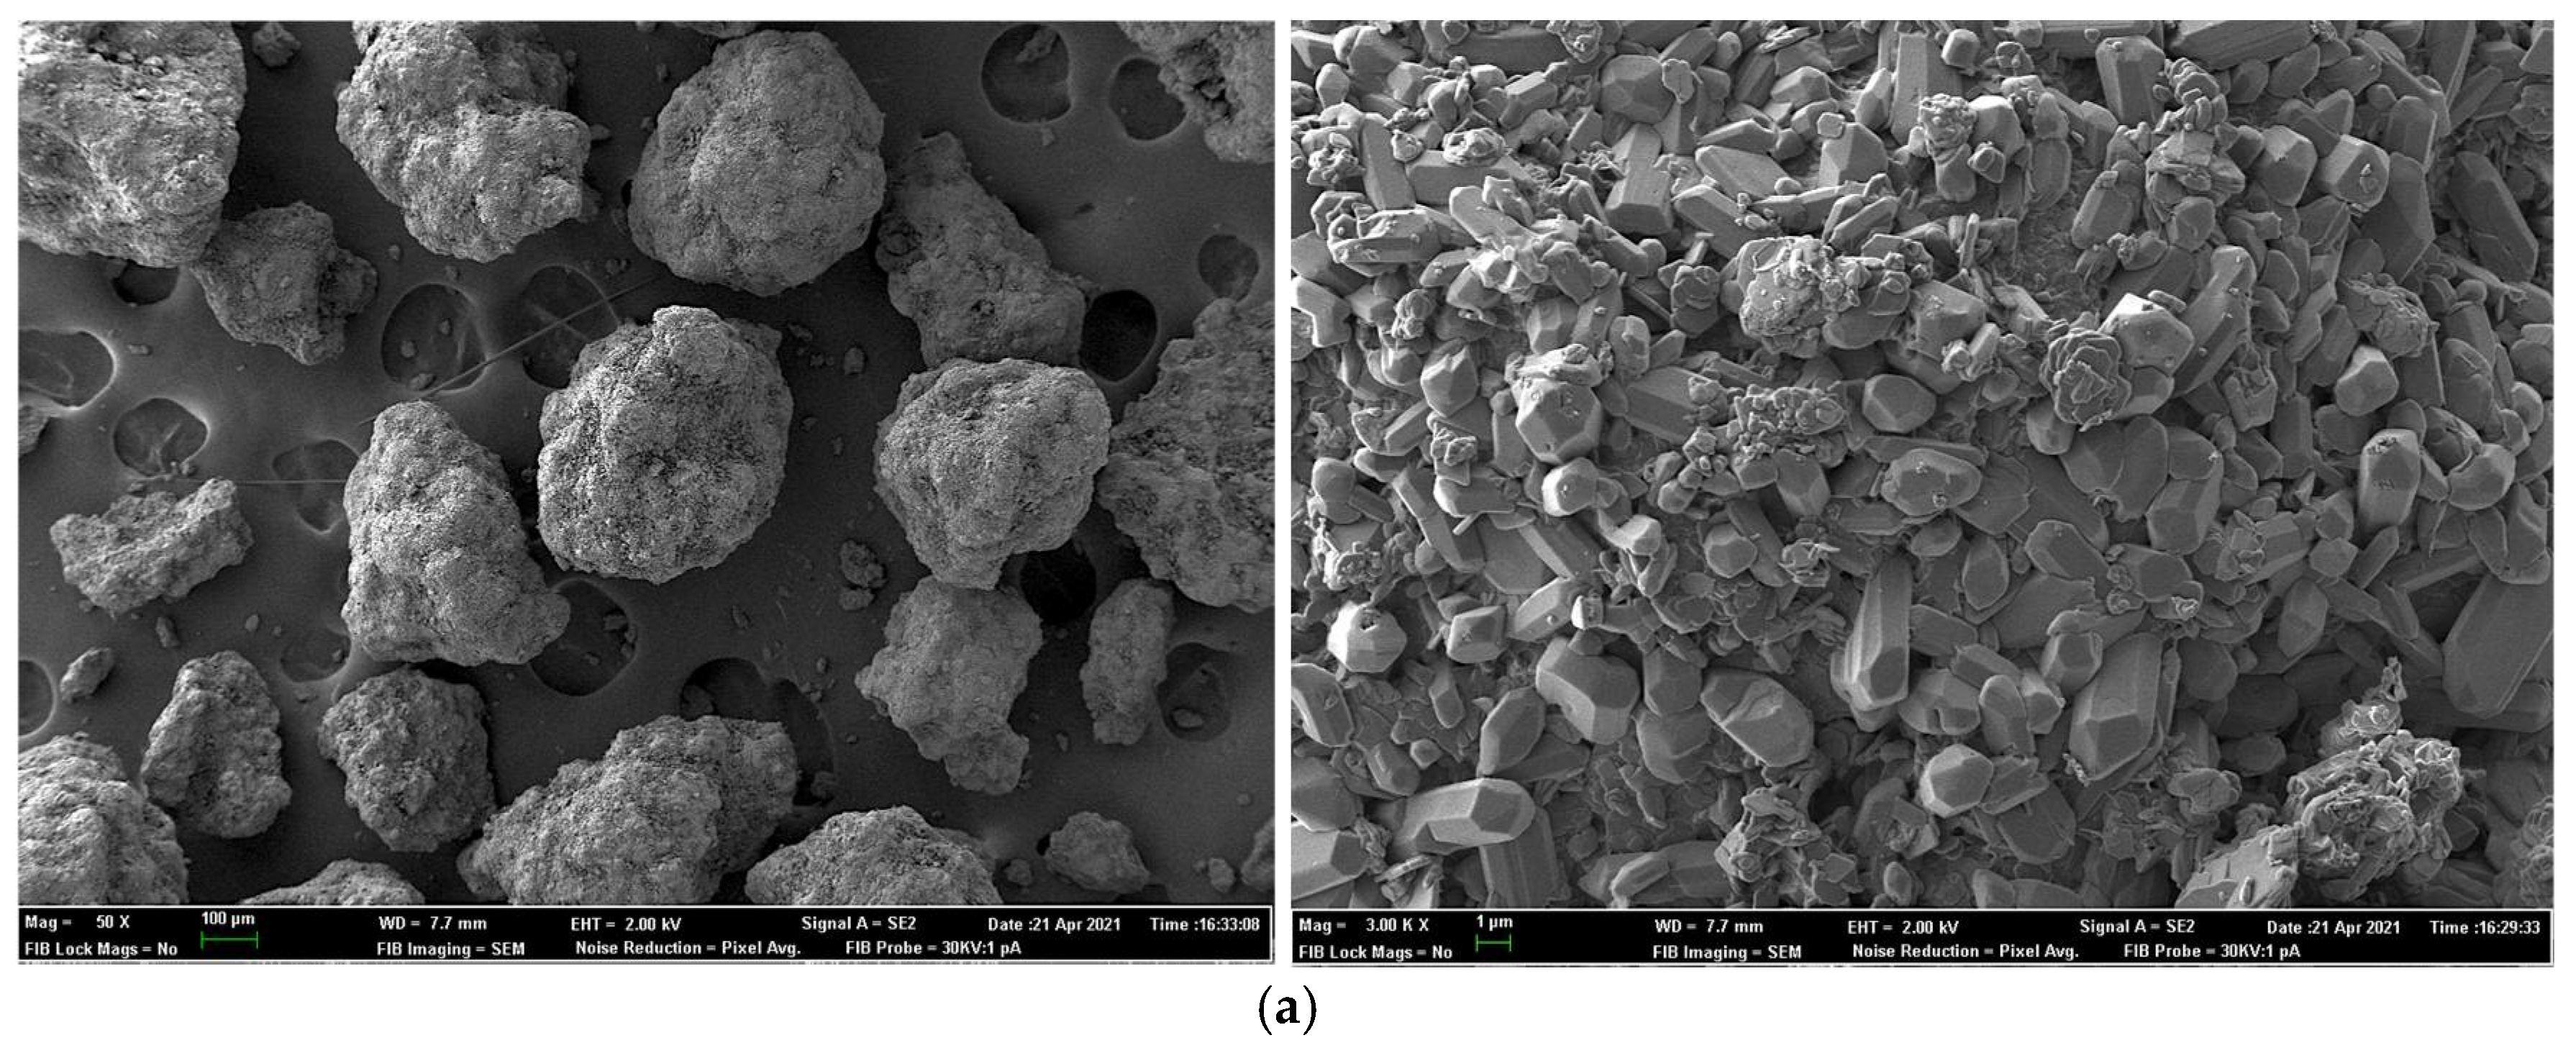
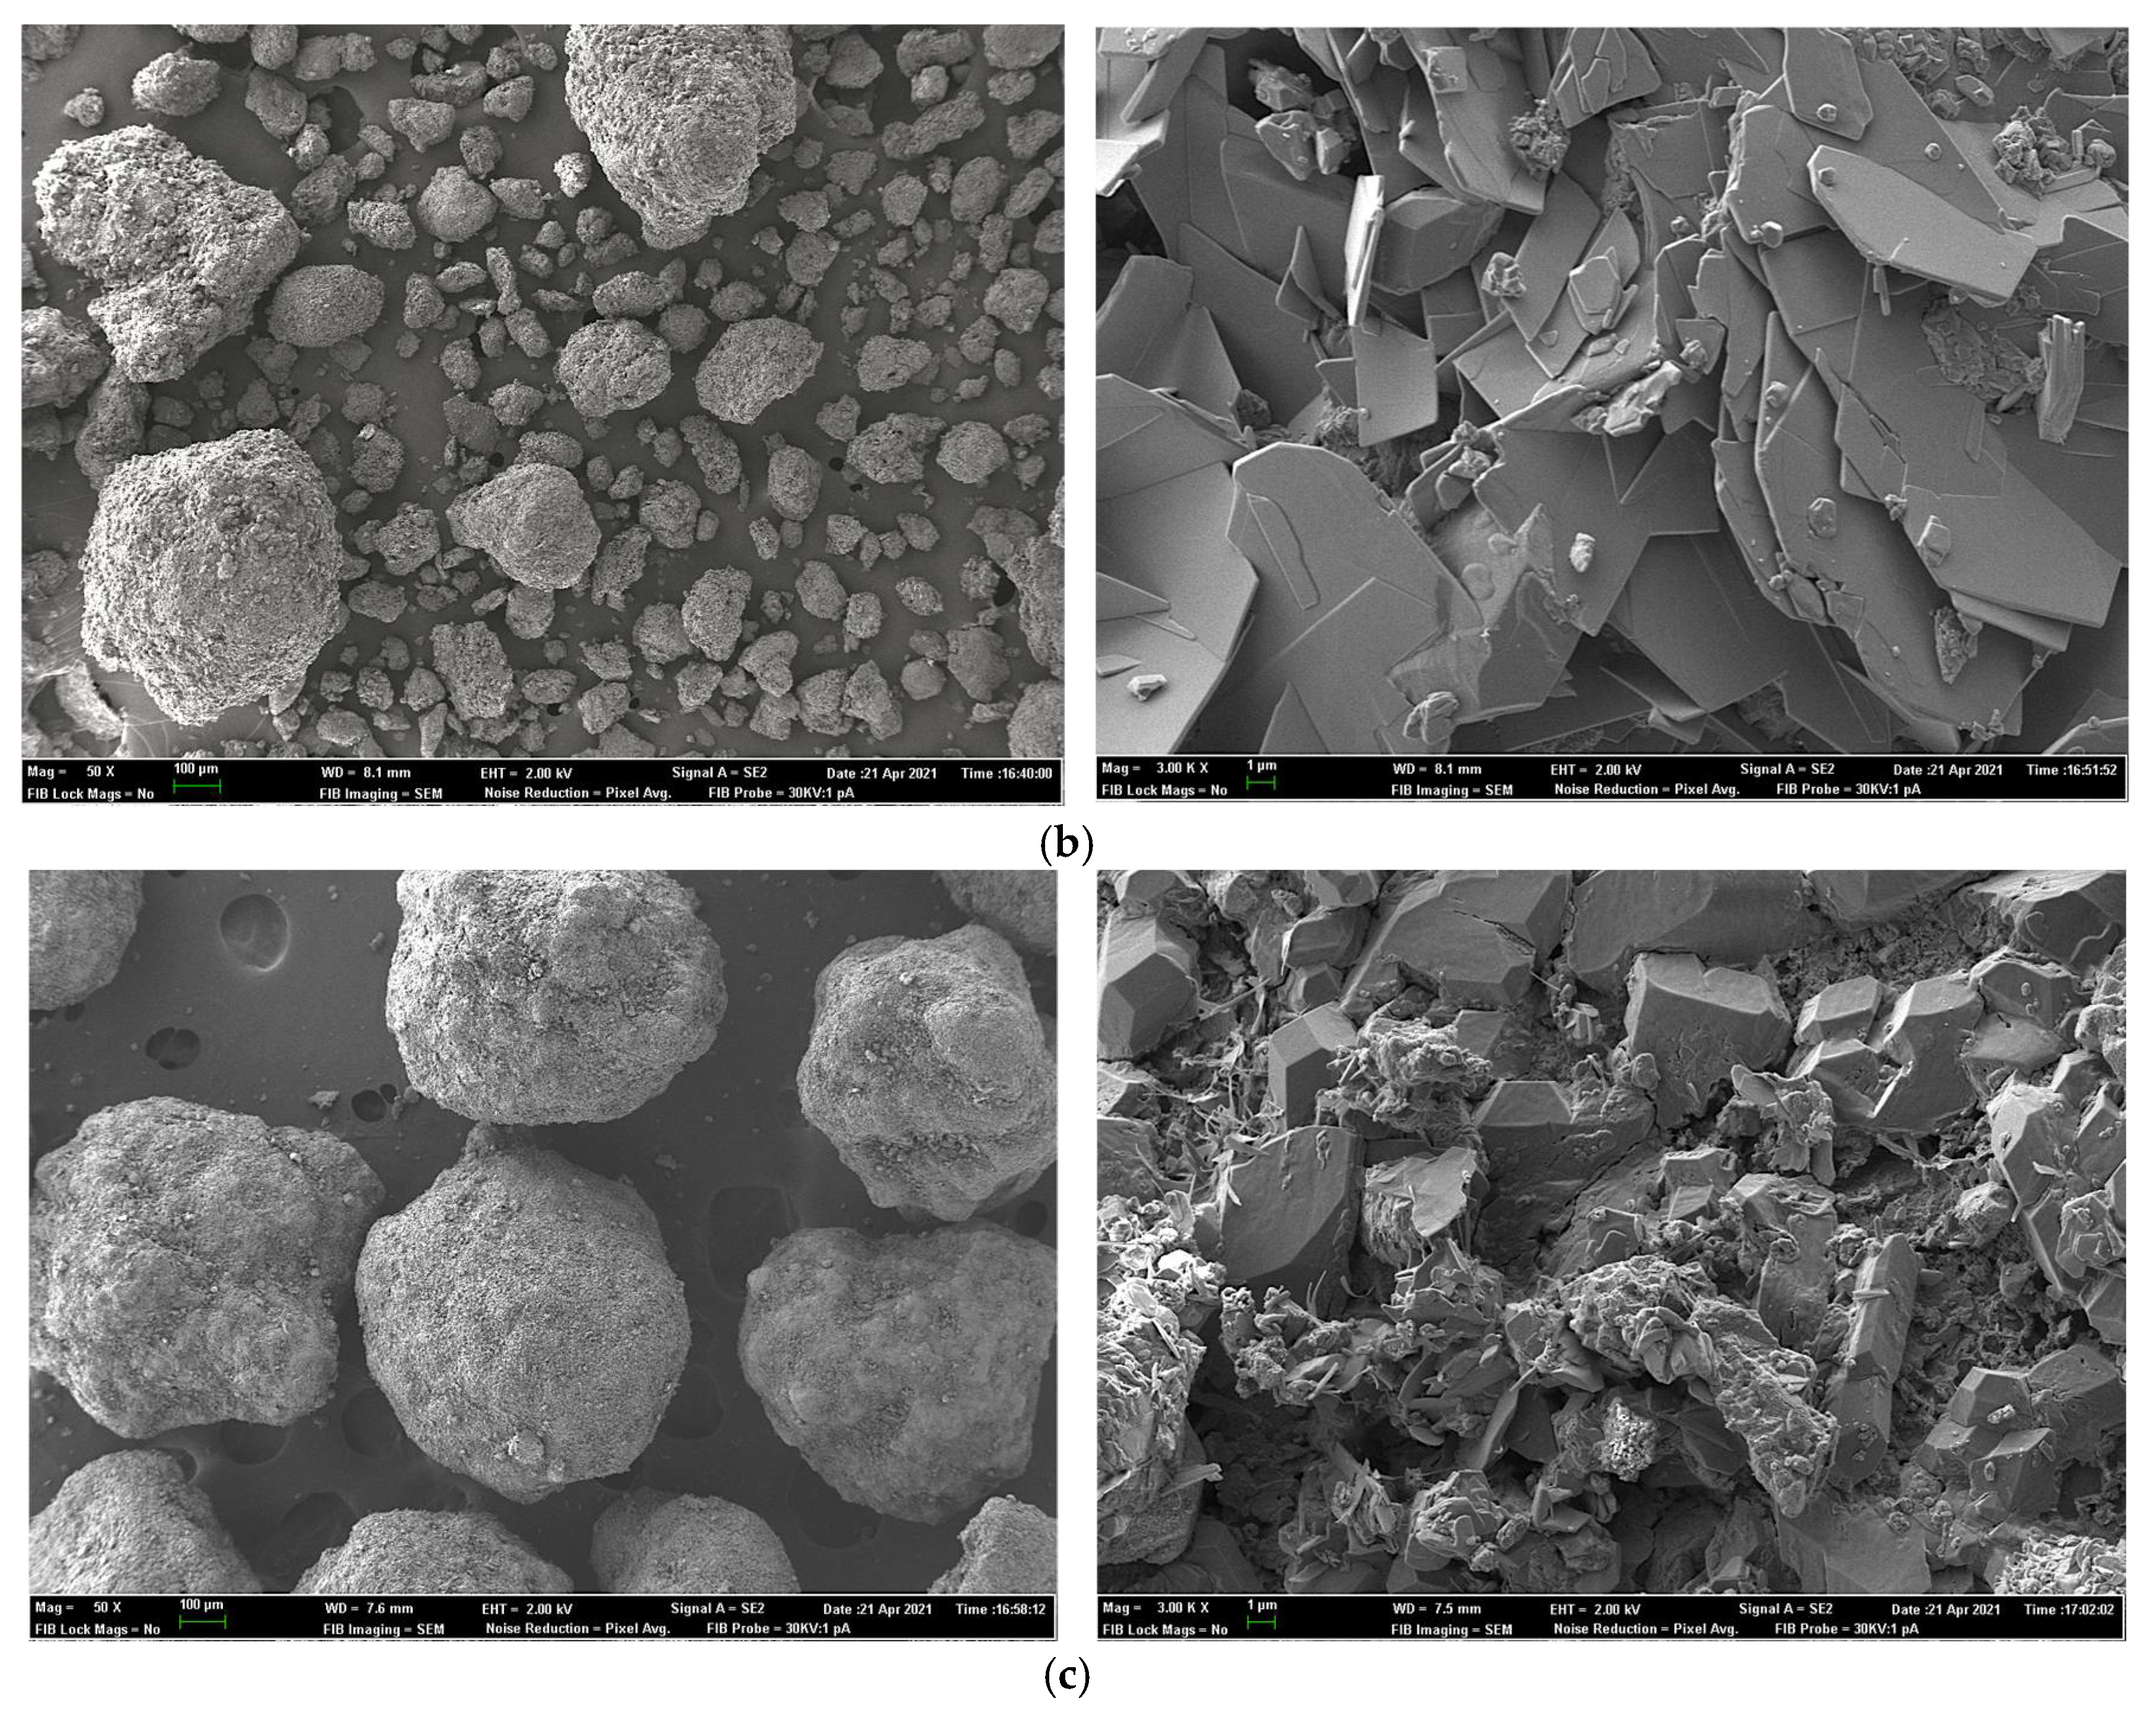
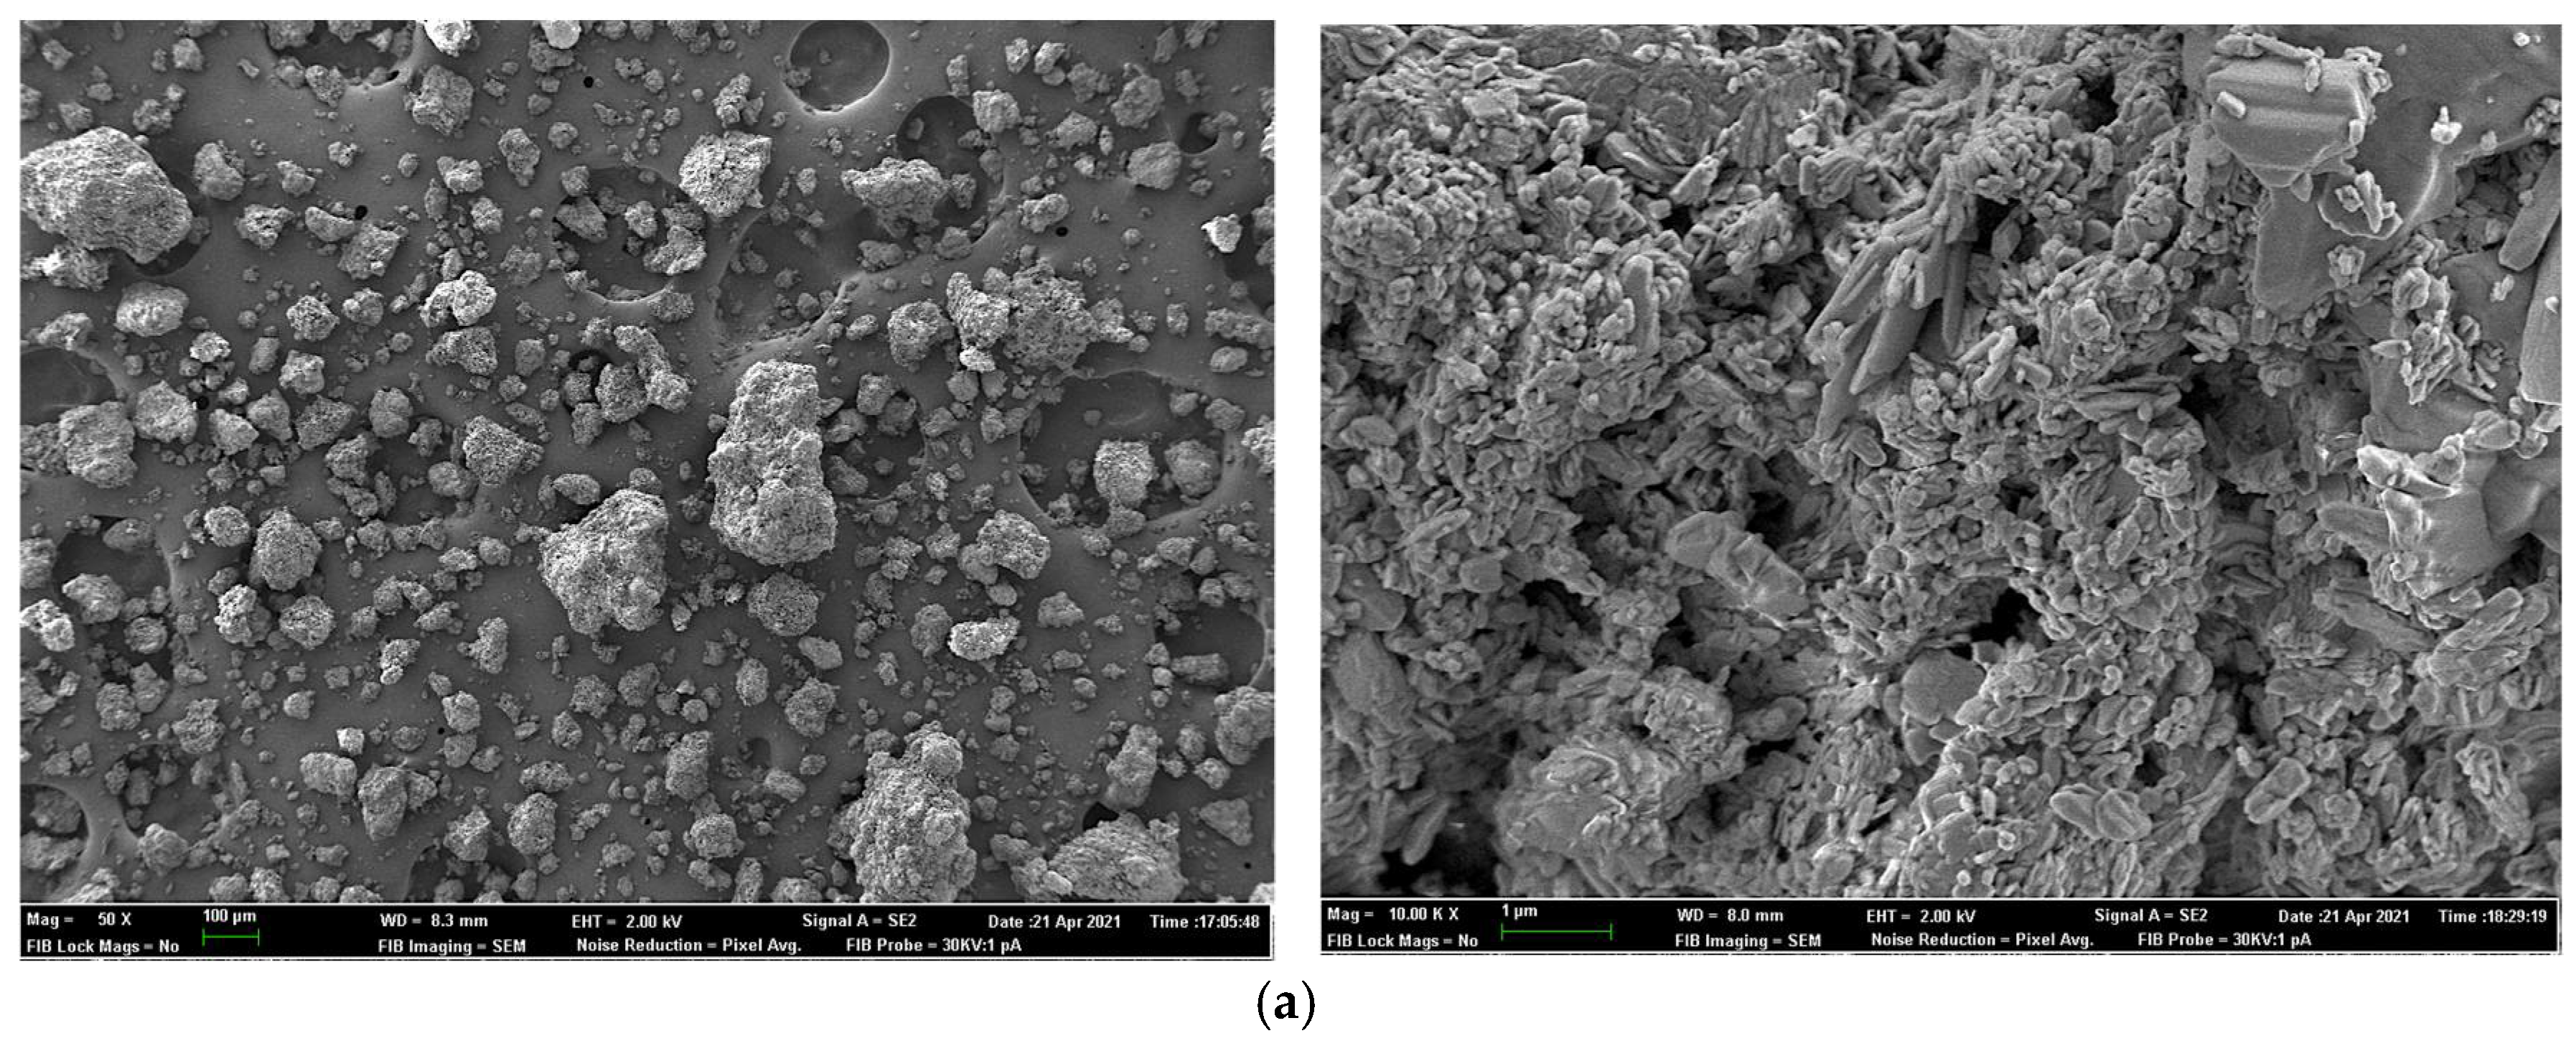
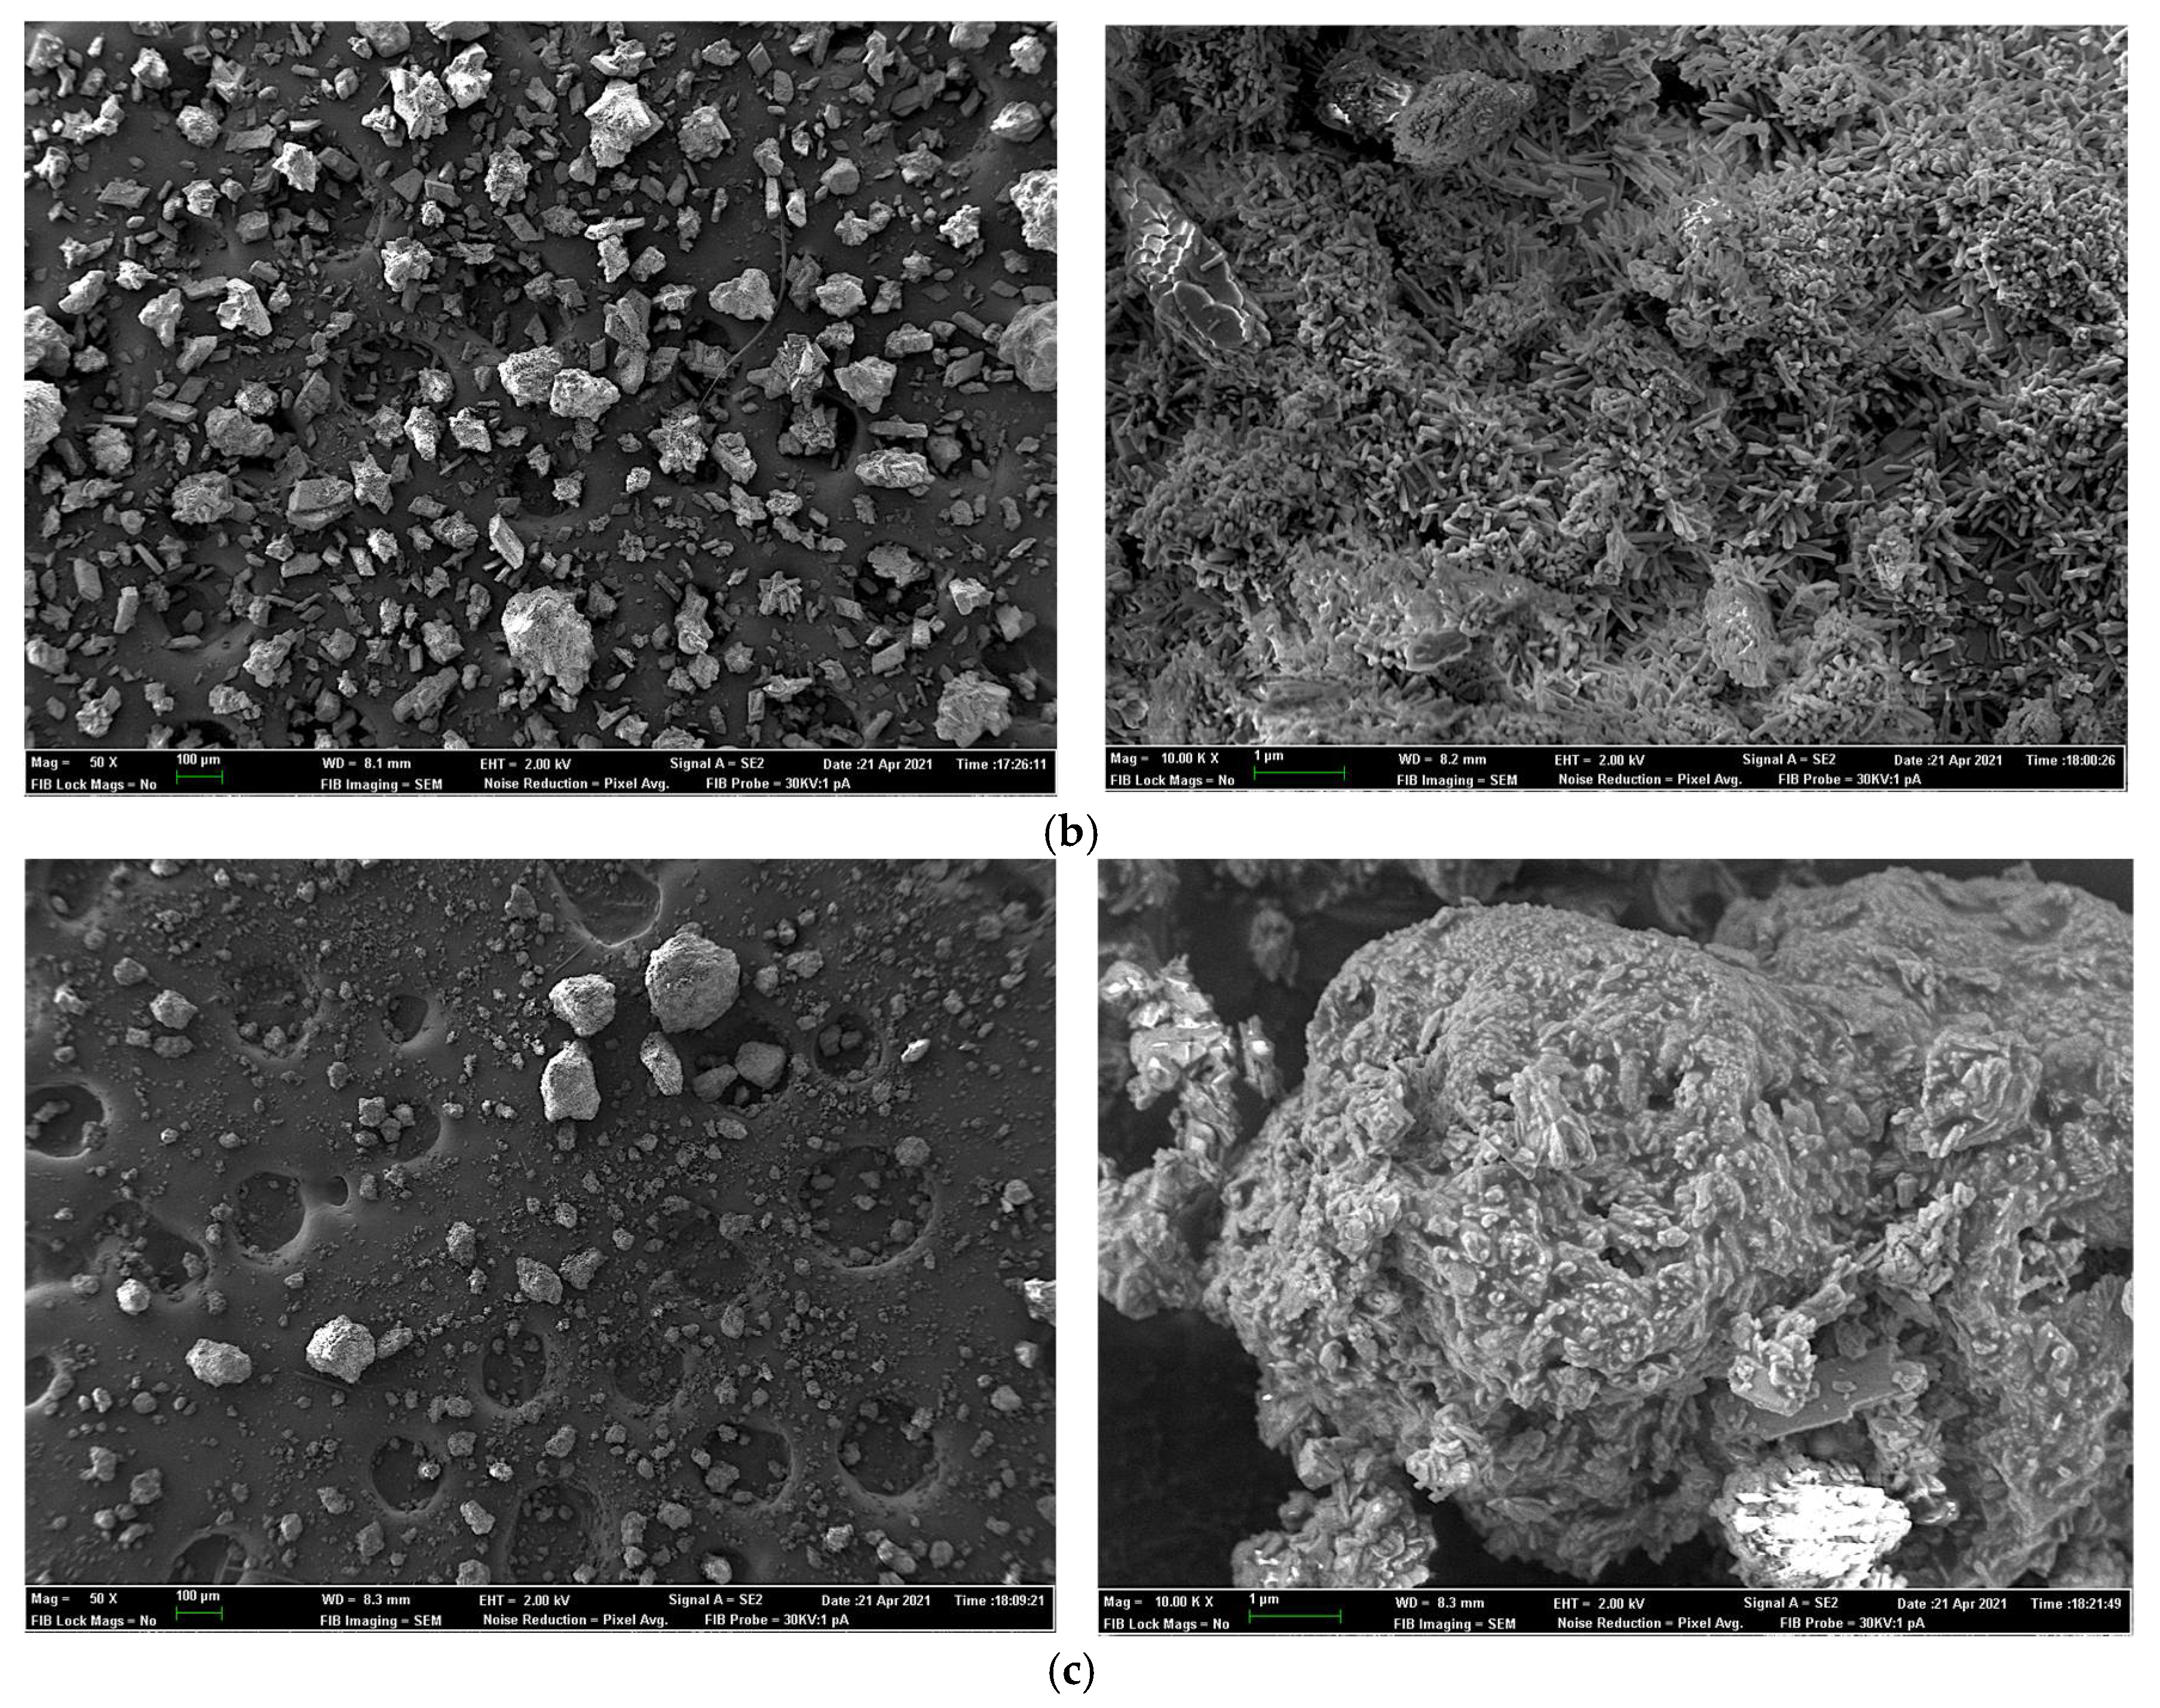
2.7. Field Emission Scanning Electron Microscopy for Sample Surface and X-ray Elemental Microanalysis
2.8. Statistical Analysis
3. Results
3.1. Experiment 1
3.2. Experiment 2
4. Discussion
5. Conclusions
Author Contributions
Funding
Institutional Review Board Statement
Informed Consent Statement
Data Availability Statement
Acknowledgments
Conflicts of Interest
References
- McDonald, P.; Edwards, R.A.; Greenhalgh, J.F.D.; Morgan, C.A.; Sinclail, L.A.; Wilkinson, R.G. Animal Nutrition, 7th ed.; Pearson Education: Harlow, UK, 2011. [Google Scholar]
- FEDNA. Tablas de Composición y Valor Nutritivo de Alimentos para la Fabricación de Piensos Compuestos, 4th ed.; de Blas, C., García-Rebollar, P., Gorrachategui, M., Mateos, G.G., Eds.; Fundación Española para el Desarrollo de la Nutrición Animal, FEDNA: Madrid, Spain, 2019. [Google Scholar]
- Banhazi, T.M.; Lehr, H.; Black, J.L.; Crabtree, H.; Schofield, P.; Tscharke, M.; Berckmans, D. Precision livestock farming: An international review of scientific and commercial aspects. Int. J. Agric. Biol. 2012, 5, 1–9. [Google Scholar]
- Leske, K.; Coon, C. The development of feedstuff retainable phosphorus values for broilers. Poult. Sci. 2002, 81, 1681–1693. [Google Scholar] [CrossRef]
- Shastak, Y.; Rodehutscord, M. Determination and estimation of phosphorus availability in growing poultry and their historical development. World Poult. Sci. 2013, 69, 569–586. [Google Scholar] [CrossRef]
- WPSA (World’s Poultry Science Association, Working Group 2: Nutrition of the European Federation of Branches). Determination of phosphorus availability in poultry. World Poult. Sci. 2013, 69, 687–698. [Google Scholar] [CrossRef]
- Mutucumarana, R.K.; Ravindran, V.; Ravindran, G.; Cowieson, A.J. Measurement of true ileal phosphorus digestibility in maize and soybean meal for broiler chickens: Comparison of two methodologies. Anim. Feed Sci. Tech. 2015, 206, 76–86. [Google Scholar] [CrossRef]
- An, S.H.; Sung, J.Y.; Kong, C. Ileal Digestibility and total tract retention of phosphorus in inorganic phosphates fed to broiler chickens using the direct method. Animals 2020, 10, 2167. [Google Scholar] [CrossRef] [PubMed]
- Munoz, J.A.; Utterback, P.L.; Parsons, C.M. Phosphorus digestibility and bioavailability in soybean meal, spray-dried plasma protein, and meat and bone meal determined using different methods. Poult. Sci. 2020, 99, 4998–5006. [Google Scholar] [CrossRef]
- Sales, J.; Janssens, G.P.J. The use of markers to determine energy metabolizability and nutrient digestibility in avian species. World Poult. Sci. J. 2003, 59, 314–327. [Google Scholar] [CrossRef]
- Hurwitz, S.; Dubrov, D.; Elsner, U.; Risenfeld, G.; Bar, A. Phosphate absorption and excretion in the young turkey as influenced by calcium intake. J. Nutr. 1978, 108, 1329–1335. [Google Scholar] [CrossRef]
- Shastak, Y.; Witzig, M.; Hartung, K.; Rodehutscord, M. Comparison of retention and prececal digestibility measurements in evaluating mineral phosphorus sources in broilers. Poult. Sci. 2012, 91, 2201–2209. [Google Scholar] [CrossRef]
- Mutucumarana, R.K.; Ravindran, V.; Ravindran, G.; Cowieson, A.J. Measurement of true ileal digestibility of phosphorus in some feed ingredients for broiler chickens. J. Anim. Sci. 2014, 92, 5520–5529. [Google Scholar] [CrossRef]
- Trairatapiwan, T.; Ruangpanit, Y.; Songserm, O.; Attamangkune, S. True ileal phosphorus digestibility of monocalcium phosphate, monodicalcium phosphate and dicalcium phosphate for broiler chickens. Anim. Feed Sci. Tech. 2018, 241, 1–7. [Google Scholar] [CrossRef]
- Gueguen, L. Valeur comparée des phosphates minéraux comme sources de phosphore pour les animaux. Ann. Zootech. 1961, 10, 177–196. [Google Scholar] [CrossRef]
- Rodehutscord, M.; Dieckmann, A.; Witzig, M.; Shastak, Y. A note on sampling digesta from the ileum of broilers in phosphorus digestibility studies. Poult. Sci. 2012, 91, 965–971. [Google Scholar] [CrossRef]
- Santomá, G.; Mateos, G.G. Normas FEDNA de Necesidades Nutricionales para Avicultura, 2nd ed.; Fundación Española para el Desarrollo de la Nutrición Animal, FEDNA: Madrid, Spain, 2018; p. 194. [Google Scholar]
- AOAC. Official Methods of Analysis of the Association of Official’s Analytical Chemists, 21st ed.; Association of Official Analytical Chemists: Arlington, VA, USA, 2019. [Google Scholar]
- Short, F.J.; Gorton, P.; Wiseman, J.; Boorman, K.N. Determination of titanium dioxide added as an inert marker in chicken digestibility studies. Anim. Feed Sci. Tech. 1996, 59, 215–221. [Google Scholar] [CrossRef]
- Catalá-Gregori, P.; García, V.; Hernández, F.; Madrid, J.; Cerón, J.J. Response of broilers to feeding low-calcium and phosphorus diets plus phytase under different environmental conditions: Body weight and tibiotarsus mineralization. Poult. Sci. 2006, 85, 1923–1931. [Google Scholar] [CrossRef]
- Adeola, O.; Cowieson, A.J. Board-invited review: Opportunities and challenges in using exogenous enzymes to improve nonruminant animal production. J. Anim. Sci. 2011, 89, 3189–3218. [Google Scholar] [CrossRef]
- Jongbloed, A.W.; Kemme, P.A. Phosphorus supply to pigs without products of animal origin. Lohmann Inf. Arch. 2002, 27, 3–9. [Google Scholar]
- Shastak, Y.; Witzig, M.; Hartung, K.; Bessei, W.; Rodehutscord, M. Comparison and evaluation of bone measurements for the assessment of mineral phosphorus sources in broilers. Poult. Sci. 2012, 91, 2210–2220. [Google Scholar] [CrossRef]
- Ravindran, V.; Kornegay, E.T.; Potter, L.M.; Ogunabameru, B.O.; Welten, M.K.; Wilson, J.H.; Potchanakorn, M. An evaluation of various response criteria in assessing biological availability of phosphorus for broilers. Poult. Sci. 1995, 74, 1820–1830. [Google Scholar] [CrossRef]
- Hemme, A.; Spark, M.; Wolf, P.; Paschertz, H.; Kamphues, J. Effects of different phosphorus sources in the diet on bone composition and stability (breaking strength) in broilers. J. Anim. Physiol. Anim. Nutr. 2005, 89, 129–133. [Google Scholar] [CrossRef]
- Hamdi, M.; Solà Oriol, D.; Franco Rosselló, R.; Aligué i Alemany, R.M.; Pérez, J.F. Comparison of how different feed phosphates affect performance, bone mineralization and phosphorus retention in broilers. Span. J. Agric. Res. 2017, 15, e0605. [Google Scholar] [CrossRef][Green Version]
- Lamp, A.E.; Mereu, A.; Ruiz-Ascacibar, I.; Moritz, J.S. Inorganic feed phosphate type determines mineral digestibility, broiler performance, and bone mineralization. J. Appl. Poult. Res. 2020, 29, 559–572. [Google Scholar] [CrossRef]
- Bikker, P.; Spek, J.W.; Van Emous, R.A.; Van Krimpen, M.M. Precaecal phosphorus digestibility of inorganic phosphate sources in male broilers. Br. Poult. Sci. 2016, 57, 810–817. [Google Scholar] [CrossRef]
- van Harn, J.; Spek, J.W.; Van Vuure, C.A.; Van Krimpen, M.M. Determination of pre-cecal phosphorus digestibility of inorganic phosphates and bone meal products in broilers. Poult. Sci. 2017, 96, 1334–1340. [Google Scholar] [CrossRef]
- Jacobs, B.M.; Patience, J.F.; Lindemann, M.D.; Stalder, K.J.; Kerr, B.J. Disappearance and appearance of an indigestible marker in feces from growing pigs as affected by previous-and current-diet composition. J. Anim. Sci. Biotechnol. 2017, 8, 32. [Google Scholar] [CrossRef][Green Version]
- Roza, L.F.; Tavernari, F.D.C.; Surek, D.; Sordi, C.; Albino, L.F.T.; Paiano, D.; Boiago, M.M.; Petrolli, T.G.; Júnior, A.C. Metabolizable energy and amino acid digestibility of mash and pelleted diets for broilers determined under different methodologies. Anim. Feed Sci. Tech. 2018, 235, 1–7. [Google Scholar] [CrossRef]
- Wang, T.; Adeola, O. Digestibility index marker type, but not inclusion level affects apparent digestibility of energy and nitrogen and marker recovery in growing pigs regardless of added oat bran. J. Anim. Sci. 2018, 96, 2817–2825. [Google Scholar] [CrossRef] [PubMed]
- Liu, J.B.; Chen, D.W.; Adeola, O. Phosphorus digestibility response of broiler chickens to dietary calcium-to-phosphorus ratios. Poult. Sci. 2013, 92, 1572–1578. [Google Scholar] [CrossRef]
- Mutucumarana, R.K.; Ravindran, V. Measurement of endogenous phosphorus losses in broiler chickens. J. Poult. Sci. 2020, 58, 58–63. [Google Scholar] [CrossRef]
- Witzig, M.; Ingelmann, C.J.; Möhring, J.; Rodehutscord, M. Variability of prececal phosphorus digestibility of triticale and wheat in broiler chickens. Poult. Sci. 2018, 97, 910–919. [Google Scholar] [CrossRef] [PubMed]
- Carpintero, L.; Donadeu, A.; Dupuy, J.; Macías-Vidal, J. EPCD Index: Predictive Equations for Digestibility Comparison among Different Sources of Commercial Phosphates in Poultry. 2020. Available online: https://globalfeed.es/en/news/163-epcd-index (accessed on 4 October 2021).
- Lima, F.; Júnior, C.M.; Alvarez, J.C.; Garzillo, J.M.; Ghion, E.; Leal, P.M. Biological evaluations of commercial dicalcium phosphates as sources of available phosphorus for broiler chicks. Poult. Sci. 1997, 76, 1707–1713. [Google Scholar] [CrossRef] [PubMed]
- Burnell, T.W.; Cromwell, G.L.; Stahly, T.S. Effects of particle size on the biological availability of calcium and phosphorus in defluorinated phosphate for chicks. Poult. Sci. 1990, 69, 1110–1117. [Google Scholar] [CrossRef] [PubMed]
- Gillis, M.B.; Edwards, H.M., Jr.; Young, R.J. Studies on the availability of calcium orthophosphates to chickens and turkeys. J. Nutr. 1962, 78, 155–161. [Google Scholar] [CrossRef] [PubMed]
- Rodehutscord, M.; Adeola, O.; Angel, R.; Bikker, P.; Delezie, E.; Dozier, W.A., III; Faruk, M.U.; Francesch, M.; Kwakernaak, C.; Narcy, A.; et al. Results of an international phosphorus digestibility ring test with broiler chickens. Poult. Sci. 2017, 96, 1679–1687. [Google Scholar] [CrossRef] [PubMed]


| Experiment 1 | Experiment 2 | |||||||
|---|---|---|---|---|---|---|---|---|
| Inorganic Phosphates | MCP1 | DCP1 | MCP1 | MCP2 | MCP3 | DCP1 | DCP2 | DCP3 |
| Dry matter (g/kg) | 990 | 985 | 901 | 965 | 983 | 983 | 982 | 955 |
| Phosphorus (P) (g/kg) | 230 | 183 | 229 | 224 | 212 | 181 | 196 | 183 |
| Calcium (g/kg) | 167 | 244 | 168 | 160 | 183 | 248 | 256 | 287 |
| P solubility in water (%) | 87.3 | 58.1 | 88.6 | 79.0 | 80.2 | 50.0 | 3.2 | 0.1 |
| Particle size (%) | ||||||||
| >2.50 mm | 0.00 | 0.00 | 0.00 | 0.00 | 0.00 | 0.00 | 0.00 | 0.00 |
| >2.00 mm | 0.20 | 0.00 | 0.50 | 0.1 | 2.70 | 0.00 | 0.00 | 0.00 |
| >1.80 mm | 1.50 | 0.00 | 1.10 | 0.20 | 5.20 | 0.00 | 0.00 | 0.30 |
| >1.60 mm | 25.0 | 0.50 | 18.0 | 0.30 | 9.20 | 0.70 | 0.20 | 0.30 |
| >1.25 mm | 37.0 | 1.30 | 32.0 | 5.20 | 23.1 | 2.10 | 0.50 | 0.70 |
| >0.40 mm | 97.0 | 20.0 | 95.0 | 94.3 | 98.8 | 24.2 | 2.30 | 6.90 |
| <0.40 mm | 3.0 | 80.0 | 5.0 | 5.7 | 1.2 | 75.8 | 97.7 | 93.1 |
| Global size classification | Coarse | Fine-coarse | Coarse | Coarse | Coarse | Fine-coarse | Fine | Fine |
| Ingredients | g/kg |
|---|---|
| Corn grain | 375 |
| Corn starch | 268 |
| Potato protein | 162 |
| Soybean meal 44% crude protein | 83 |
| Oat hulls | 54 |
| Soy oil | 20 |
| DL-methionine | 2.7 |
| L-arginine | 2.5 |
| Sodium bicarbonate | 5.0 |
| Sodium chloride | 1.7 |
| Vitamin-mineral premix 1 | 6.0 |
| Titanium dioxide | 5.0 |
| Limestone | 3.4 |
| Diatomaceous earth (Celite) | 12.2 |
| Experiment 1 | Experiment 2 | ||||||||||
|---|---|---|---|---|---|---|---|---|---|---|---|
| Basal Diet | MCP1 Level 1 | MCP1 Level 2 | DCP1 Level 1 | DCP1 Level 2 | MCP1 Level 2 | MCP2 Level 2 | MCP3 Level 2 | DCP1 Level 2 | DCP2 Level 2 | DCP3 Level 2 | |
| Calculated composition | |||||||||||
| Metabolizable energy (Kcal/kg) | 3134 | 3134 | 3134 | 3134 | 3134 | 3134 | 3134 | 3134 | 3134 | 3134 | 3134 |
| Crude protein | 190 | 190 | 190 | 190 | 190 | 190 | 190 | 190 | 190 | 190 | 190 |
| Total phosphorus (P) | 2.25 | 3.01 | 3.76 | 3.01 | 3.76 | 3.76 | 3.76 | 3.76 | 3.76 | 3.75 | 3.75 |
| Available P | 0.69 | 1.32 | 1.95 | 1.23 | 1.77 | 1.94 | 1.95 | 1.95 | 1.77 | 1.77 | 1.77 |
| Total calcium (Ca) | 3.00 | 4.02 | 5.03 | 4.03 | 5.05 | 5.03 | 5.03 | 5.05 | 5.05 | 5.02 | 5.04 |
| Ca: P | 1.33 | 1.34 | 1.34 | 1.34 | 1.35 | 1.34 | 1.34 | 1.34 | 1.34 | 1.34 | 1.34 |
| Analyzed composition | |||||||||||
| Dry matter | 897 | 894 | 895 | 895 | 894 | 894 | 894 | 894 | 894 | 894 | 895 |
| Total P | 2.25 | 2.90 | 3.45 | 2.95 | 3.70 | 4.10 | 3.75 | 3.60 | 3.60 | 3.70 | 3.80 |
| Total Ca | 3.00 | 4.00 | 4.70 | 3.95 | 4.80 | 5.10 | 4.85 | 4.65 | 4.75 | 4.95 | 5.05 |
| Ca:P | 1.33 | 1.38 | 1.36 | 1.34 | 1.30 | 1.24 | 1.29 | 1.29 | 1.32 | 1.34 | 1.33 |
| Basal Diet | MCP1 Level 1 | MCP1 Level 2 | DCP1 Level 1 | DCP1 Level 2 | SEM 1 | p-Value | |
|---|---|---|---|---|---|---|---|
| Performance traits: | |||||||
| Body weight at 15 days, g | 494.7 | 484.0 | 486.7 | 487.9 | 487.4 | 11.90 | 0.971 |
| Body weight at 25 days, g | 782.0 | 856.9 | 788.9 | 817.1 | 814.3 | 26.43 | 0.239 |
| Average daily feed intake, g/day | 50.2 | 58.3 | 50.8 | 54.8 | 52.7 | 2.80 | 0.190 |
| Average daily gain, g/day | 29.4 | 36.9 | 30.1 | 32.9 | 32.6 | 2.64 | 0.240 |
| Feed conversion ratio | 1.74 | 1.61 | 1.75 | 1.68 | 1.63 | 0.059 | 0.266 |
| Bone mineralization traits: | |||||||
| Tibia weight, g | 1.49 b | 1.66 ab | 1.73 a | 1.65 ab | 1.74 a | 0.048 | 0.004 |
| Tibia ash, % | 36.5 c | 39.8 b | 42.2 a | 39.0 b | 42.0 a | 0.56 | <0.001 |
| P in ash, % | 16.5 | 16.8 | 16.8 | 16.8 | 16.8 | 0.11 | 0.1026 |
| Ca in ash, % | 34.9 | 35.1 | 35.3 | 35.7 | 35.3 | 0.23 | 0.126 |
| P, mg in tibia | 87.3 b | 110.5 a | 122.8 a | 108.4 a | 122.2 a | 3.97 | <0.001 |
| Ca, mg in tibia | 185.1 b | 231.9 a | 256.8 a | 230.4 a | 257.4 a | 8.21 | <0.001 |
| Basal Diet | MCP1 Level 1 | MCP1 Level 2 | DCP1 Level 1 | DCP1 Level 2 | SEM 1 | p-Value | |
|---|---|---|---|---|---|---|---|
| Dry matter digestibility (%) | |||||||
| ATTD-tc of DM | 78.1 b | 79.9 a | 80.2 a | 78.6 a | 79.5 a | 0.55 | 0.038 |
| ATTD-m of DM | 80.1 ab | 79.8 abc | 79.5 bc | 79.1 c | 80.7 a | 0.26 | 0.001 |
| pc-D of DM | 80.9 | 79.1 | 78.7 | 79.6 | 80.3 | 1.03 | 0.529 |
| Phosphorous digestibility (%) | |||||||
| ATTD-tc of P | 46.5 b | 57.6 a | 61.6 a | 58.2 a | 60.2 a | 2.56 | <0.001 |
| ATTD-m of P | 50.1 b | 57.3 ab | 60.2 a | 59.0 ab | 62.3 a | 2.08 | 0.012 |
| pc-D of P | 45.9 b | 58.8 a | 62.8 a | 59.4 a | 62.6 a | 2.83 | <0.001 |
| Phosphorus Digestibility Method | Regression Equation | SE 1 of the Slope | r2 | P Digestibility Coefficient (%) |
|---|---|---|---|---|
| Monocalcium phosphate, MCP | ||||
| ATTDP-tc | 1.188 + 0.835 × Padded 2 | 0.054 | 0.926 | 83.48 |
| ATTDP-m | 1.266 + 0.752 × Padded | 0.057 | 0.901 | 75.21 |
| pc-DP | 1.183 + 0.874 × Padded | 0.070 | 0.886 | 87.42 |
| p-value slope comparison | 0.188 | |||
| Dicalcium phosphate, DCP | ||||
| ATTDP-tc | 1.208 + 0.808 × Padded | 0.070 | 0.875 | 80.76 |
| ATTDP-m | 1.274 + 0.805 × Padded | 0.067 | 0.899 | 80.45 |
| pc-DP | 1.197 + 0.866 × Padded | 0.082 | 0.862 | 86.62 |
| p-value slope comparison | - | - | - | 0.560 |
| Parameters | MCP1 Level 2 | MCP2 Level 2 | MCP3 Level 2 | SEM 1 | p-Value | DCP1 Level 2 | DCP2 Level 2 | DCP3 Level 2 | SEM | p-Value |
|---|---|---|---|---|---|---|---|---|---|---|
| Performance traits: | ||||||||||
| Body weight at 15 days, g | 487.7 | 486.4 | 486.4 | 9.89 | 0.994 | 486.5 | 488.6 | 490.9 | 10.51 | 0.957 |
| Body weight at 25 days, g | 834.6 | 845.7 | 802.6 | 26.08 | 0.450 | 808.1 | 839.9 | 824.0 | 26.75 | 0.672 |
| Average daily feed intake, g/day | 55.4 | 59.5 | 52.7 | 2.86 | 0.267 | 52.7 | 54.2 | 55.3 | 2.79 | 0.809 |
| Average daily gain, g/day | 34.8 | 37.8 | 31.6 | 2.56 | 0.261 | 32.1 | 35.2 | 33.7 | 2.67 | 0.672 |
| Feed conversion ratio | 1.64 | 1.60 | 1.70 | 0.054 | 0.427 | 1.67 | 1.59 | 1.78 | 0.078 | 0.240 |
| Bone mineralization traits: | ||||||||||
| Tibia weight, g | 1.81 | 1.72 | 1.74 | 0.061 | 0.494 | 1.69 | 1.74 | 1.70 | 0.036 | 0.552 |
| Tibia weight, %BW | 0.22 | 0.20 | 0.22 | 0.004 | 0.065 | 0.22 | 0.22 | 0.21 | 0.006 | 0.834 |
| Tibia ash, % | 42.2 | 41.9 | 41.9 | 0.40 | 0.811 | 41.9 | 41.3 | 41.6 | 0.370 | 0.596 |
| P in ash, % | 16.9 | 16.8 | 16.9 | 0.08 | 0.537 | 16.9 | 16.9 | 16.8 | 0.122 | 0.765 |
| Ca in ash, % | 35.1 | 34.9 | 35.4 | 0.22 | 0.356 | 35.5 | 35.6 | 35.2 | 0.287 | 0.483 |
| P, mg | 128.8 | 120.9 | 122.9 | 3.84 | 0.302 | 120.3 | 121.6 | 118.2 | 2.44 | 0.630 |
| Ca, mg | 267.9 | 251.7 | 256.8 | 7.46 | 0.275 | 252.9 | 255.9 | 247.5 | 5.58 | 0.566 |
| Digestibility Coefficients | MCP1 Level 2 | MCP2 Level 2 | MCP3 Level 2 | SEM 1 | p-Value | DCP1 Level 2 | DCP2 Level 2 | DCP3 Level 2 | SEM | p-Value |
|---|---|---|---|---|---|---|---|---|---|---|
| ATTD-tc of DM, % | 79.6 | 78.5 | 77.9 | 1.03 | 0.442 | 78.8 | 79.4 | 79.4 | 0.42 | 0.525 |
| ATTD-tc of P, % | 59.8 | 56.3 | 54.2 | 2.48 | 0.249 | 60.0 | 58.2 | 56.5 | 1.06 | 0.092 |
| Diets | ||||
|---|---|---|---|---|
| Test Ingredient | Regression Equation | SE 1 of the Slope | r2 | P Digestibility Coefficient (%) |
| Monocalcium phosphate | ||||
| MCP1 Level2 | 1.167 + 0.796 × Padded 2 | 0.024 | 0.997 | 79.58 |
| MCP2 Level2 | 1.167 + 0.702 × Padded | 0.032 | 0.994 | 70.15 |
| MCP3 Level2 | 1.167 + 0.656 × Padded | 0.068 | 0.971 | 65.58 |
| p-value slope comparison | 0.151 | |||
| Dicalcium phosphate | ||||
| DCP1 Level2 | 1.167 + 0.801 × Padded | 0.026 | 0.996 | 80.06 |
| DCP2 Level2 | 1.167 + 0.774 × Padded | 0.034 | 0.994 | 77.37 |
| DCP3 Level2 | 1.167 + 0.714 × Padded | 0.030 | 0.995 | 71.44 |
| p-value slope comparison | - | - | - | 0.110 |
| Parameters | MCP1 Level 2 | MCP2 Level 2 | MCP3 Level 2 | SEM 1 | p-Value |
|---|---|---|---|---|---|
| Sodium | 1.60 a | 0.00 b | 0.00 b | 0.233 | 0.0004 |
| Magnesium | 1.29 b | 6.02 a | 7.12 a | 0.781 | 0.0004 |
| Aluminium | 0.45 b | 2.00 a | 0.25 b | 0.230 | 0.0003 |
| Silicon | 0.00 b | 0.00 b | 0.51 a | 0.052 | <0.0001 |
| Sulphur | 0.08 | 0.11 | 0.19 | 0.075 | 0.543 |
| Potassium | 0.17 b | 1.79 a | 0.12 b | 0.112 | <0.0001 |
| Iron | 0.09 b | 2.70 a | 0.21 b | 0.173 | <0.0001 |
| Parameters | DCP1 Level 2 | DCP2 Level 2 | DCP3 Level 2 | SEM 1 | p-Value |
|---|---|---|---|---|---|
| Sodium | 0.08 | 0.00 | 0.00 | 0.034 | 0.197 |
| Magnesium | 1.15 a | 0.15c | 0.74 b | 0.113 | <0.0001 |
| Aluminium | 0.30 a | 0.16 b | 0.15 b | 0.034 | 0.013 |
| Silicon | 0.01 b | 0.20 a | 0.15 ab | 0.048 | 0.033 |
| Sulphur | 2.06 ab | 0.52 b | 4.02 a | 0.989 | 0.028 |
| Chlorine | 0.00 b | 0.62 a | 0.00 b | 0.035 | <0.0001 |
| Potassium | 0.11 a | 0.00 b | 0.00 b | 0.025 | 0.010 |
| Iron | 0.08 | 0.03 | 0.00 | 0.043 | 0.347 |
| Copper | 0.00 | 0.12 | 0.00 | 0.010 | 0.489 |
Publisher’s Note: MDPI stays neutral with regard to jurisdictional claims in published maps and institutional affiliations. |
© 2021 by the authors. Licensee MDPI, Basel, Switzerland. This article is an open access article distributed under the terms and conditions of the Creative Commons Attribution (CC BY) license (https://creativecommons.org/licenses/by/4.0/).
Share and Cite
Cambra-López, M.; Moset, V.; del Carmen López, M.; Sebastián Mesa, J.; Carpintero, L.; Donadeu, A.; Dupuy, J.; Macías-Vidal, J.; Cerisuelo, A.; Ferrer, P.; et al. Evaluation of Phosphorus Digestibility from Monocalcium and Dicalcium Phosphate Sources and Comparison between Total Tract and Prececal Digestibility Standard Methods in Broilers. Animals 2021, 11, 3427. https://doi.org/10.3390/ani11123427
Cambra-López M, Moset V, del Carmen López M, Sebastián Mesa J, Carpintero L, Donadeu A, Dupuy J, Macías-Vidal J, Cerisuelo A, Ferrer P, et al. Evaluation of Phosphorus Digestibility from Monocalcium and Dicalcium Phosphate Sources and Comparison between Total Tract and Prececal Digestibility Standard Methods in Broilers. Animals. 2021; 11(12):3427. https://doi.org/10.3390/ani11123427
Chicago/Turabian StyleCambra-López, María, Verónica Moset, María del Carmen López, Juan Sebastián Mesa, Laura Carpintero, Andrés Donadeu, Javier Dupuy, Judit Macías-Vidal, Alba Cerisuelo, Pablo Ferrer, and et al. 2021. "Evaluation of Phosphorus Digestibility from Monocalcium and Dicalcium Phosphate Sources and Comparison between Total Tract and Prececal Digestibility Standard Methods in Broilers" Animals 11, no. 12: 3427. https://doi.org/10.3390/ani11123427
APA StyleCambra-López, M., Moset, V., del Carmen López, M., Sebastián Mesa, J., Carpintero, L., Donadeu, A., Dupuy, J., Macías-Vidal, J., Cerisuelo, A., Ferrer, P., & Pascual, J. J. (2021). Evaluation of Phosphorus Digestibility from Monocalcium and Dicalcium Phosphate Sources and Comparison between Total Tract and Prececal Digestibility Standard Methods in Broilers. Animals, 11(12), 3427. https://doi.org/10.3390/ani11123427


