
High Prevalence of Antibiotic-Resistant Escherichia coli Isolates from Retail Poultry Products in Spain

 ,
,
Abstract
:Simple Summary
Abstract
1. Introduction
2. Materials and Methods
2.1. Sampling
2.2. Enterobacteriaceae Counts: Isolation and Identification of Escherichia coli
2.3. Phenotypic Sensitivity Test of E. coli Isolates
Growth Curves of Beta-Lactam- and Tetracycline-Resistant E. coli
2.4. Multiplex Polymerase Chain Reaction (PCR) for the Detection of Antibiotic Resistance Genes
2.4.1. Beta-Lactam Resistance Genes
2.4.2. Tetracycline Resistance Genes
2.5. Latex Agglutination Test for E. coli O157:H7
2.6. Statistical Analysis
3. Results
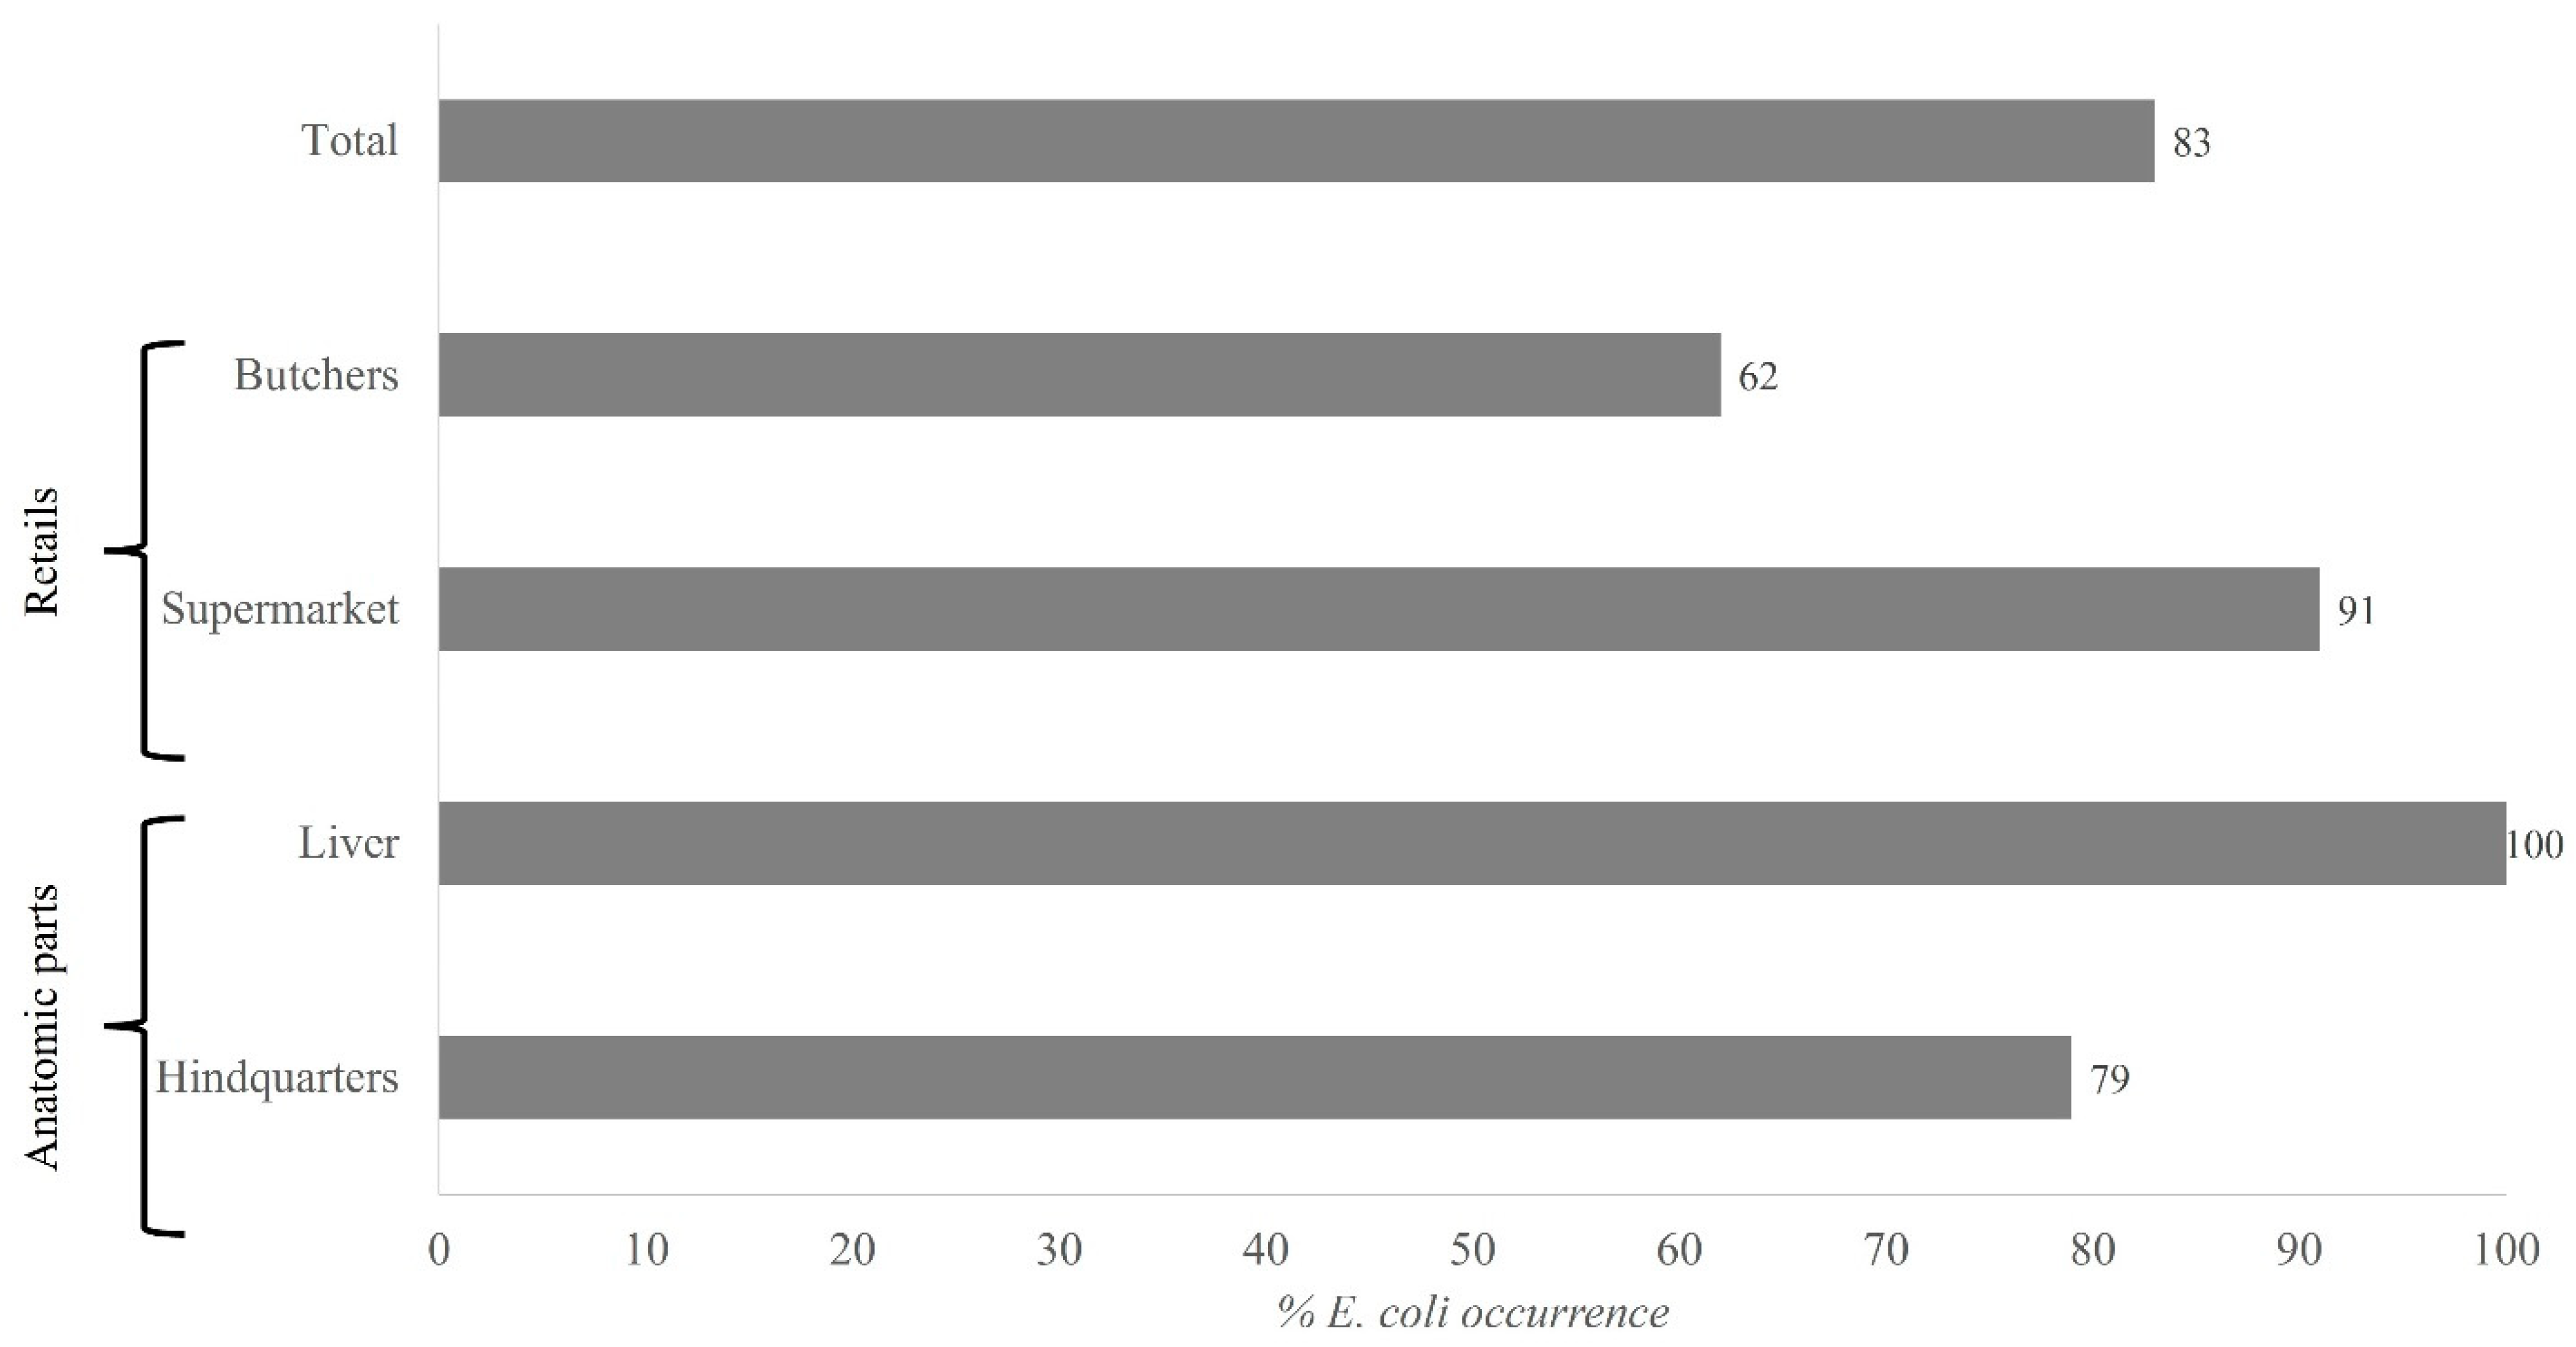
3.1. Enterobacteriaceae Counts: Isolation and Identification of Escherichia coli
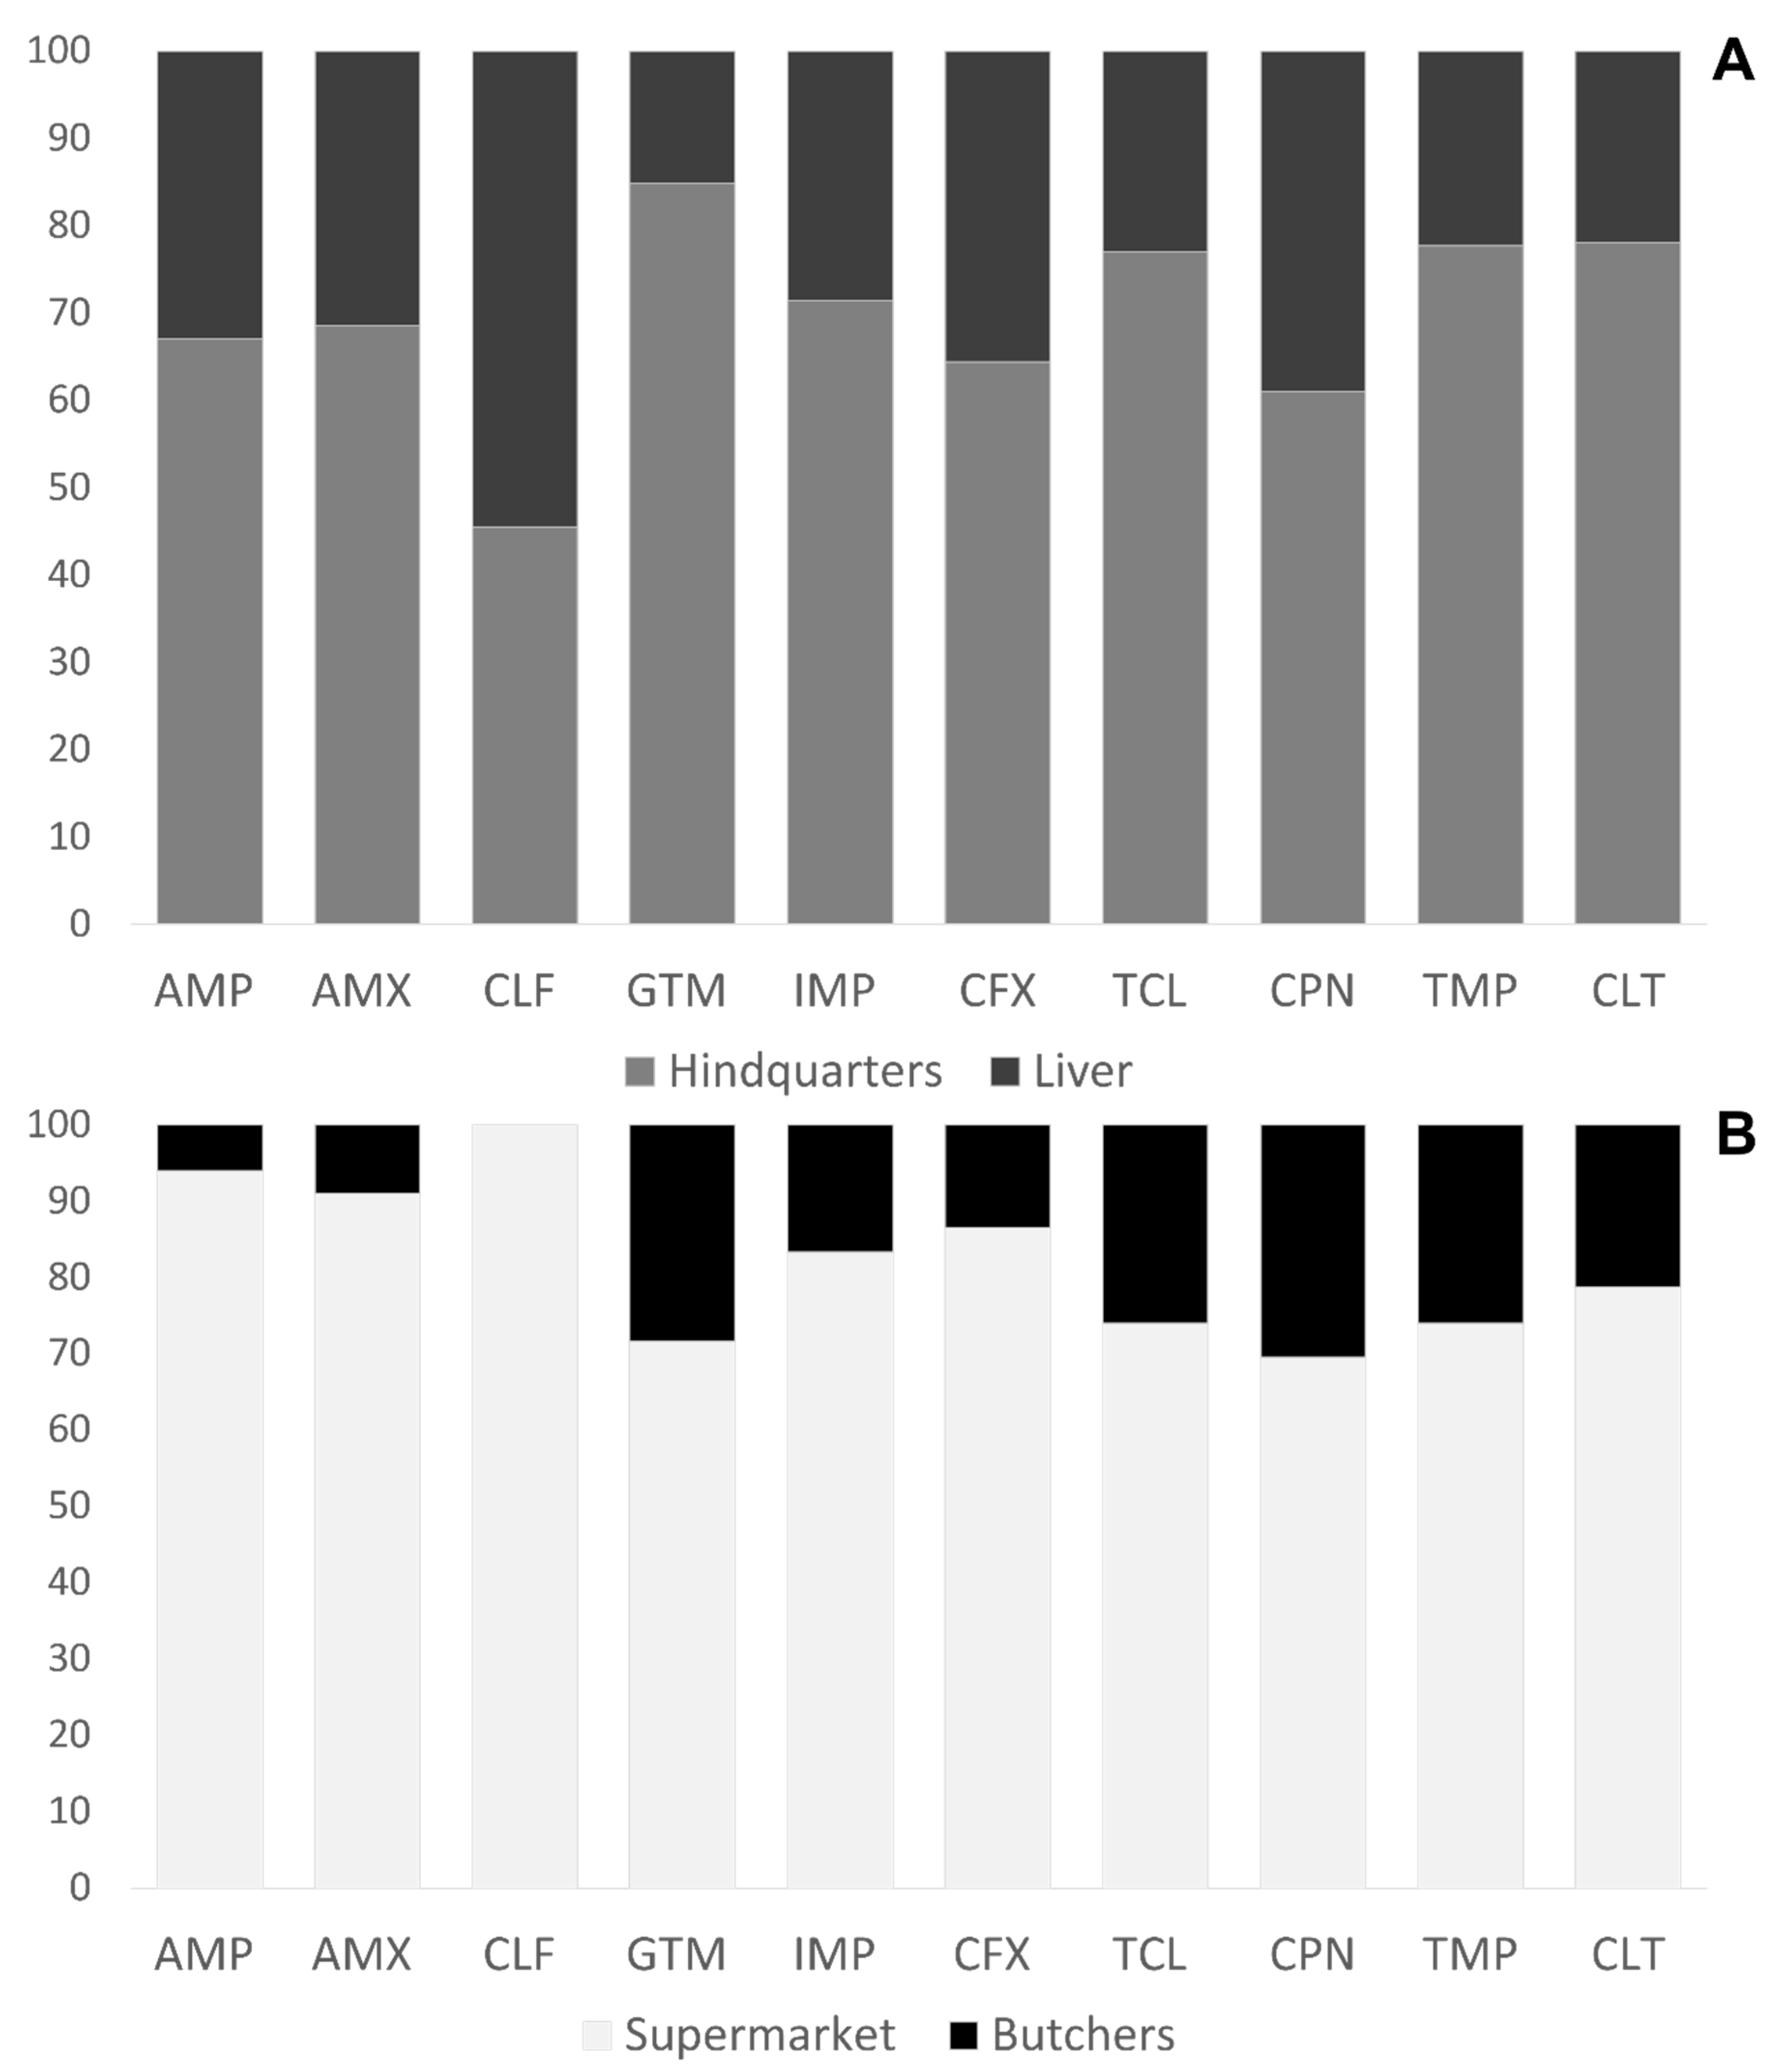
3.2. Phenotypic Sensitivity Test of E. coli Isolates
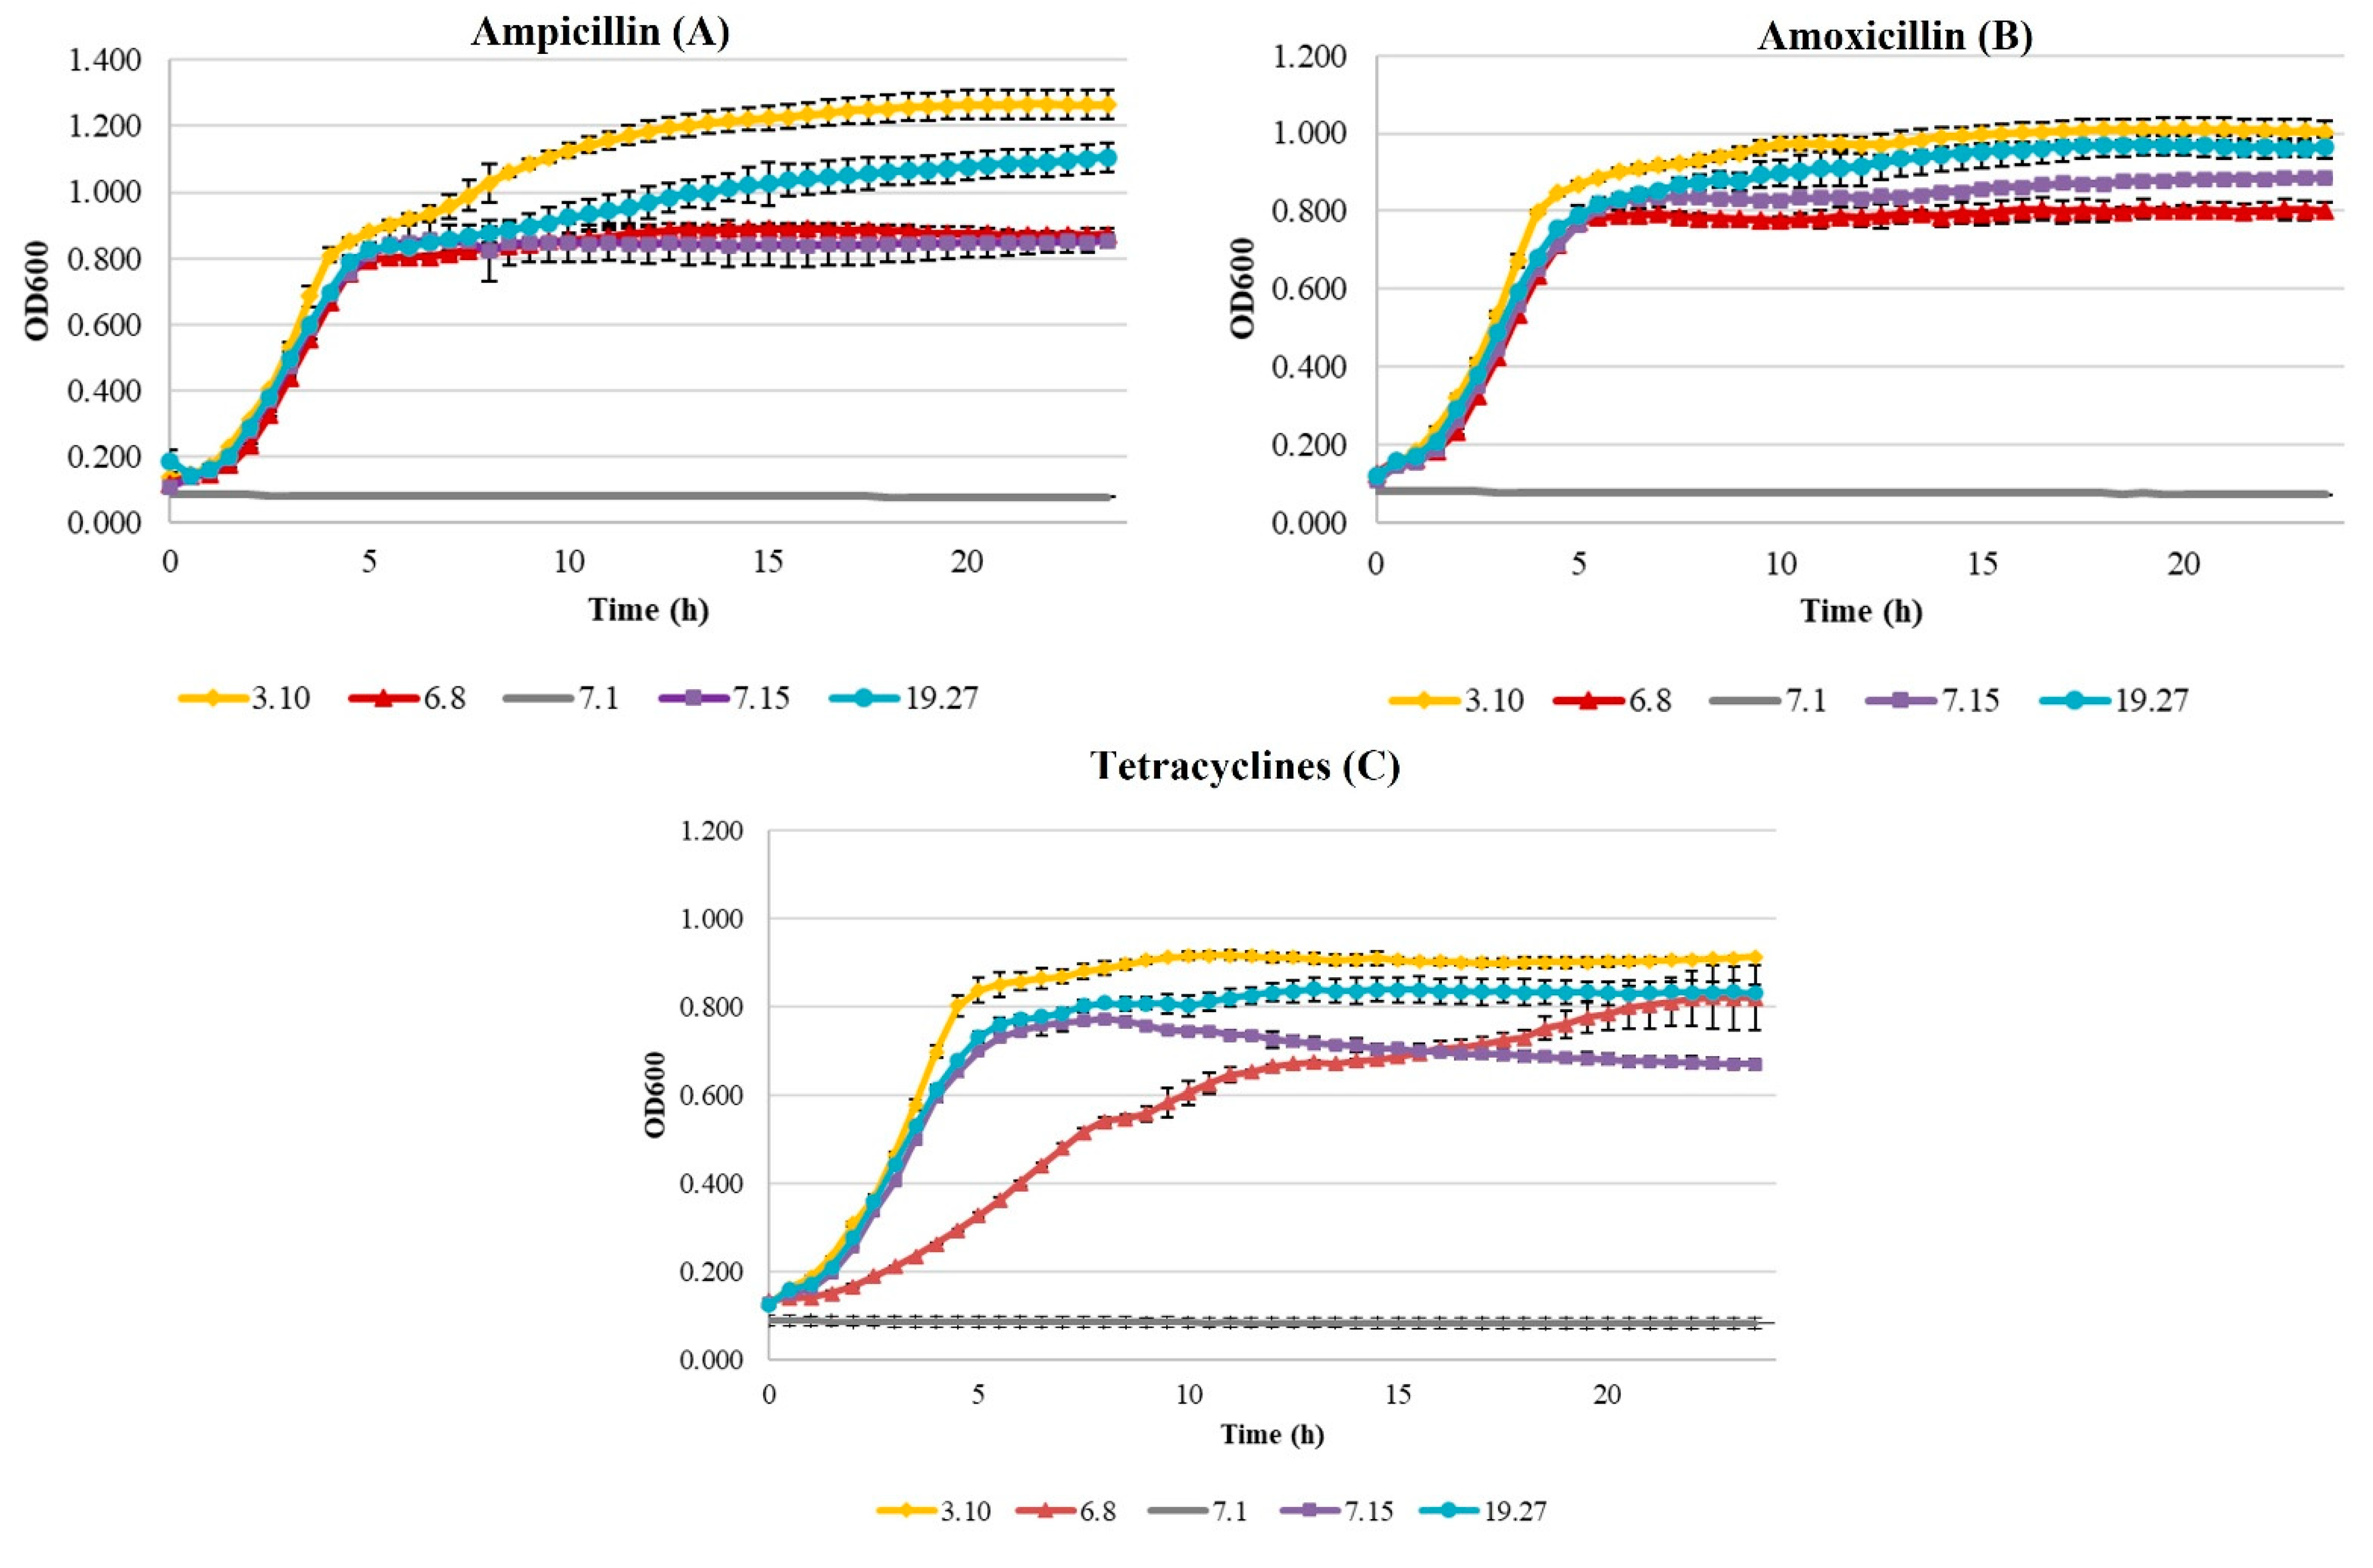
Growth Curves of Beta-Lactam- and Tetracycline-Resistant E. coli
3.3. Multiplex PCR for Detection of Beta-Lactam and Tetracycline Resistance Genes
3.4. Latex Agglutination Test for E. coli O157:H7
4. Discussion
5. Conclusions
Author Contributions
Funding
Institutional Review Board Statement
Informed Consent Statement
Data Availability Statement
Conflicts of Interest
References
- European Commission. Poultry: Information on an Overview of EU Poultry, Market Measures and Standards, Trade Measures, Market Monitoring, Legal Bases and Committees. 2021. Available online: https://ec.europa.eu/info/sites/default/files/food-farming-fisheries/farming/documents/poultry-meat-dashboard_en.pdf (accessed on 21 October 2021).
- MAPA. Informe del Consumo Alimentario en España 2019. 2020. Available online: https://www.mapa.gob.es/en/alimentacion/temas/consumo-tendencias/informe2019_v2_tcm38-540250.pdf (accessed on 12 October 2020).
- Muaz, K.; Riaz, M.; Akhtar, S.; Park, S.; Ismail, A. Antibiotic residues in chicken meat: Global prevalence, threats, and decontamination strategies: A review. J. Food Protect. 2018, 81, 619–627. [Google Scholar] [CrossRef]
- Mund, M.D.; Khan, U.H.; Tahir, U.; Mustafa, B.E.; Fayyaz, A. Antimicrobial drug residues in poultry products and implications on public health: A review. Int. J. Food Propert. 2017, 20, 1433–1446. [Google Scholar] [CrossRef]
- Manyi-Loh, C.; Mamphweli, S.; Meyer, E.; Okoh, A. Antibiotic use in agriculture and its consequential resistance in environmental sources: Potential public health implications. Molecules 2018, 23, 795. [Google Scholar] [CrossRef] [PubMed] [Green Version]
- Anadón, A. The EU ban of antibiotics as feed additives (2006): Alternatives and consumer safety. J. Vet. Pharm. Therap. 2006, 29, 41–44. [Google Scholar] [CrossRef]
- Witte, W. Selective pressure by antibiotic use in livestock. Int. J. Antimicrob. Agents 2000, 16, 19–24. [Google Scholar] [CrossRef]
- Schroeder, C.M.; White, D.G.; Meng, J. Retail meat and poultry as a reservoir of antimicrobial-resistant Escherichia coli. Food Microbiol. 2004, 21, 249–255. [Google Scholar] [CrossRef]
- Clavijo, V.; Flórez, M.J.V. The gastrointestinal microbiome and its association with the control of pathogens in broiler chicken production: A review. Poult. Sci. 2018, 97, 1006–1021. [Google Scholar] [CrossRef]
- EFSA. The European Union Summary Report on Antimicrobial Resistance in Zoonotic and Indicator Bacteria from Humans, Animals and Food in 2017. 2017. Available online: https://efsa.onlinelibrary.wiley.com/doi/epdf/10.2903/j.efsa.2019.5598 (accessed on 17 October 2020).
- Jiang, H.X.; Lü, D.H.; Chen, Z.L.; Wang, X.M.; Chen, J.R.; Liu, Y.-H.; Liao, X.P.; Liu, J.H.; Zeng, Z.L. High prevalence and widespread distribution of multi-resistant Escherichia coli isolates in pigs and poultry in China. Vet. J. 2011, 187, 99–103. [Google Scholar] [CrossRef]
- Ghodousi, A.; Bonura, C.; Di Noto, A.M.; Mammina, C. Extended-spectrum ß-Lactamase, AmpC-Producing, and fluoroquinolone-resistant Escherichia coli in retail broiler chicken meat, Italy. Foodborne Pathog. Dis. 2015, 12, 619–625. [Google Scholar] [CrossRef] [Green Version]
- Bezerra, W.G.A.; da Silva, I.N.G.; Vasconcelos, R.H.; Machado, D.N.; Lopes, E.D.S.; Lima, S.V.G.; de Teixeira, R.S.C.; Lima, J.B.; Oliveira, F.R.; Maciel, W.C. Isolation and antimicrobial resistance of Escherichia coli and Salmonella enterica subsp. Enterica (O: 6, 8) in broiler chickens. Acta Sci. Vet. 2018, 44, 1–7. [Google Scholar] [CrossRef] [Green Version]
- PRAN. Plan Nacional Frente a la Resistencia a los Antibióticos 2019–2021. 2019. Available online: http://www.resistenciaantibioticos.es/es/system/files/field/files/pran_2019-2021_0.pdf?file=1&type=node&id=497&force=0 (accessed on 30 October 2020).
- Warringer, J.; Blomberg, A. Automated screening in environmental arrays allows analysis of quantitative phenotypic profiles in Saccharomyces cerevisiae. Yeast 2003, 20, 53–67. [Google Scholar] [CrossRef] [PubMed]
- Kozak, G.K.; Boerlin, P.; Janecko, N.; Reid-Smith, R.J.; Jardine, C. Antimicrobial resistance in Escherichia coli isolates from Swine and wild small mammals in the proximity of swine farms and in natural environments in Ontario, Canada. Appl. Environ. Microbiol. 2009, 75, 559–566. [Google Scholar] [CrossRef] [Green Version]
- Travis, R.M.; Gyles, C.L.; Reid-Smith, R.; Poppe, C.; McEwen, S.A.; Friendship, R.; Janecko, N.; Boerlin, P. Chloramphenicol and kana-mycin resistance among porcine Escherichia coli in Ontario. J. Antimicrob. Chemother. 2006, 58, 173–177. [Google Scholar] [CrossRef]
- Lanz, R.; Kuhnert, P.; Boerlin, P. Antimicrobial resistance andresistance gene determinants in clinical Escherichia coli from different ani-mal species in Switzerland. Vet. Microbiol. 2003, 91, 73–84. [Google Scholar] [CrossRef]
- Goswami, P.S.; Gyles, C.L.; Friendship, R.M.; Poppe, C.; Kozak, G.K.; Boerlin, P. Effect of plasmid pTENT2 on severity of porcine post-weaning diarrhoea induced by an O149 enterotoxigenic Escherichia coli. Vet. Microbiol. 2008, 131, 400–405. [Google Scholar] [CrossRef] [PubMed]
- Fernández-Pacheco, P.; García-Béjar, B.; Jiménez-del Castillo, M.; Carreño-Domínguez, J.; Briones Pérez, A.; Arévalo-Villena, M. Potential probiotic and food protection role of wild yeasts isolated from pistachio fruits (Pistacia vera). J. Sci. Food Agric. 2020, 101, 2201–2209. [Google Scholar] [CrossRef]
- Roth, N.; Käsbohrer, A.; Mayrhofer, S.; Zitz, U.; Hofacre, C.; Domig, K.J. The application of antibiotics in broiler production and the resulting antibiotic resistance in Escherichia coli: A global overview. Poultry Sci. 2019, 98, 1791–1804. [Google Scholar] [CrossRef]
- Jay, J.M.; Loessner, M.J.; Golden, D.A. Modern Food Microbiology, 7th ed.; Springer: New York, NY, USA, 2005. [Google Scholar]
- Blanco Guarner, N. Detección de Cepas Multirresistentes de Escherichia coli Mediante Análisis de Resistencia Fenotípica y Genotípica, en Productos Avícolas Destinados a Consumo Humano. 2019. Available online: https://riunet.upv.es/handle/10251/126824 (accessed on 30 November 2020).
- Miranda, J.; Vazquez, B.; Fente, C.; Barros-Velázquez, J.; Cepeda, A.; Franco, C. Antimicrobial resistance in Escherichia coli strains isolated from organic and conventional pork meat: A comparative survey. Eur. Food Res. Technol. 2008, 226, 371–375. [Google Scholar] [CrossRef]
- Hussain, A.; Shaik, S.; Ranjan, A.; Nandanwar, N.; Tiwari, S.K.; Majid, M.; Baddam, R.; Qureshi, I.A.; Semmler, T.; Wieler, L.H.; et al. Risk of transmission of antimicrobial resistant Escherichia coli from commercial broiler and free-range retail chicken in India. Front. Microbiol. 2017, 8, 2120. [Google Scholar] [CrossRef]
- EMA; ESVAC. Sales of Veterinary Antimicrobial Agents in 31 European Countries in 2018. 2020. Available online: https://www.ema.europa.eu/en/documents/report/sales-veterinary-antimicrobial-agents-31-european-countries-2018-trends-2010-2018-tenth-esvac-report_en.pdf (accessed on 27 October 2020).
- EMA; ESVAC. Sales of Veterinary Antimicrobial Agents in 30 European Countries in 2016. 2018. Available online: https://www.ema.europa.eu/en/documents/report/sales-veterinary-antimicrobial-agents-30-european-countries-2016-trends-2010-2016-eighth-esvac_en.pdf (accessed on 27 October 2020).
- Hao Van, T.T.; Yidana, Z.; Smooker, P.; Coloe, P. Antibiotic use in food animals in the world with focus on Africa: Pluses and minuses. J. Glob Antimicrob. Resist. 2019, 20, 170–177. [Google Scholar] [CrossRef] [PubMed]
- EFSA; ECDC. The European Union summary report on antimicrobial resistance in zoonotic and indicator bacteria from humans, animals and food in 2017/2018. EFSA J. 2020, 18, e06007. [Google Scholar]
- Abbassi, M.S.; Kilani, H.; Zouari, M.; Mansouri, R.; Oussama, E.F.; Hammami, S.; Chehida, N.B. Antimicrobial resistance in Escherichia coli isolates from healthy poultry, bovine and ovine in Tunisia: A real animal and human health threat. J. Clin. Microbiol. Biochem. Technol. 2017, 3, 19–23. [Google Scholar] [CrossRef] [Green Version]
- WHO; FAO; OIE. Monitoring Global Progress on Addressing Antimicrobial Resistance: Analysis Report of the Second Round of Results of AMR Country Self-Assessment Survey 2018. World Health Organization. 2018. Available online: https://apps.who.int/iris/handle/10665/273128 (accessed on 27 October 2020).
- Founou, L.L.; Founou, R.C.; Essack, S.Y. Antibiotic Resistance in the Food Chain: A Developing Country-Perspective. Front Microbiol. 2016, 7, 1881. [Google Scholar] [CrossRef]
- Martínez-Vázquez, A.V.; Rivera-Sánchez, G.; Lira-Méndez, K.; Reyes-López, M.A.; Bocanegra-García, V. Prevalence, antimicrobial resistance and virulence genes of Escherichia coli isolated from retail meat in Tamaulipas, Mexico. J. Glob. Antimicrob. Res. 2018, 14, 266–272. [Google Scholar] [CrossRef] [PubMed]
- Dutil, L.; Irwin, R.J.; Finley, R.; Ng, L.K.; Avery, B.P.; Boerlin, P.; Bourgault, A.M.; Cole, L.; Daignault, D.; Desruisseau, A.; et al. Ceftiofur resistance in Salmonella enterica serovar Heidelberg from chicken meat and humans, Canada. Emerg. Infect. Dis. 2010, 16, 48. [Google Scholar] [CrossRef] [PubMed]
- Davis, G.S.; Waits, K.; Nordstrom, L.; Grande, H.; Weaver, B.; Papp, K.; Horwinski, J.; Koch, B.; Hungate, B.A.; Liu, C.M.; et al. Antibiotic-resistant Escherichia coli from retail poultry meat with different antibiotic use claims. BMC Microbiol. 2018, 18, 174. [Google Scholar] [CrossRef] [PubMed]
- Liu, Y.Y.; Wang, Y.; Walsh, T.R.; Yi, L.X.; Zhang, R.; Spencer, J.; Doi, Y.; Tian, G.; Dong, B.; Huang, X.; et al. Emergence of plasmid-mediated colistin resistance mechanism MCR-1 in animals and human beings in China: A microbiological and molecular biological study. Lancet Infect. Dis. 2016, 16, 161–168. [Google Scholar] [CrossRef]
- Kar, D.; Bandyopadhyay, S.; Bhattacharyya, D.; Samanta, I.; Mahanti, A.; Nanda, P.K.; Mondal, B.; Dandapat, P.; Das, A.K.; Dutta, T.K.; et al. Molecular and phylogenetic characterization of multidrug resistant extended spectrum beta-lactamase producing Escherichia coli isolated from poultry and cattle in Odisha, India. Infect. Genet. Evol. 2015, 29, 82–90. [Google Scholar] [CrossRef]
- Chika, E.; Ifeanyi, I.; Amaechi, C.; Malachy, U.; Peter, E.; Chidinma, I.; Ogene, L.; Orinya, C. Multiple antibiotic resistance, antibiogram and phenotypic detection of Metallo-Beta-Lactamase (MBL) from Escherichia coli of poultry origin. J. Appl. Microbioliol. Biochem. 2017, 1, 15. [Google Scholar] [CrossRef] [Green Version]
- Yourassowsky, E.; Van der Linden, M.P.; Lismont, M.J.; Crokaert, F.; Glupczynski, Y. Correlation between growth curve and killing curve of Escherichia coli after a brief exposure to suprainhibitory concentrations of ampicillin and piperacillin. Antimicrob. Agents Chemother. 1985, 28, 756–760. [Google Scholar] [CrossRef] [Green Version]
- Bertrand, R.L. Lag Phase Is a Dynamic, Organized, Adaptive, and Evolvable Period That Prepares Bacteria for Cell Division. J. Bacteriol. 2019, 201, e00697-18. [Google Scholar] [CrossRef] [PubMed]
- Li, X.Z.; Nikaido, H. Efflux-mediated drug resistance in bacteria: An update. Drugs 2009, 69, 1555–1623. [Google Scholar] [CrossRef] [PubMed]
- Vuthy, Y.; Lay, K.S.; Seiha, H.; Kerleguer, A.; Aidara-Kane, A. Antibiotic susceptibility and molecular characterization of resistance genes among Escherichia coli and among Salmonella subsp. in chicken food chains. Asian Pac. J. Trop. Biomed. 2017, 7, 670–674. [Google Scholar] [CrossRef]
- Maamar, E.; Hammami, S.; Alonso, C.A.; Dakhli, N.; Abbassi, M.S.; Ferjani, S.; Hamzaoui, Z.; Saidani, M.; Torres, C.; Boutiba-Ben Boubaker, I. High prevalence of extended-spectrum and plasmidic AmpC beta-lactamase-producing Escherichia coli from poultry in Tunisia. Int. J. Food Microbiol. 2016, 231, 69–75. [Google Scholar] [CrossRef] [PubMed]
- Ugbo, E.N.; Anyamene, C.O.; Moses, I.B.; Iroha, I.R.; Babalola, O.O.; Ukpai, E.G.; Chukwunwejim, C.R.; Egbule, C.U.; Emioye, A.A.; Okata-Nwali, O.D.; et al. Prevalence of blaTEM, blaSHV, and blaCTX-M genes among extended spectrum beta-lactamase-producing Escherichia coli and Klebsiella pneumoniae of clinical origin. Gene Rep. 2020, 21, 100909. [Google Scholar] [CrossRef]


| Antibiotic Group | Gene | Oligonucleotides | Band Size (pb) | Reference |
|---|---|---|---|---|
| Beta-lactam | blaTEM | 5′-TTAACTGGCGAACTACTTAC-3′ | 247 | [16] |
| 5′-GTCTATTTCGTTCATCCATA-3′ | ||||
| blaSHV | 5′-AGGATTGACTGCCTTTTTG-3′ | 393 | [17] | |
| 5′-ATTTGCTGATTTCGCTCG-3′ | ||||
| blaCMY-2 | 5′-GACAGCCTCTTTCTCCACA-3′ | 1000 | [16] | |
| 5′-TGGACACGAAGGCTACGTA-3′ | ||||
| Tetracycline | tet(A) | 5′-GGCGGTCTTCTTCATCATGC-3′ | 502 | [18] |
| 5′-CGGCAGGCAGAGCAAGTAGA-3′ | ||||
| tet(B) | 5′-CGCCCAGTGCTGTTGTTGTC-3′ | 173 | [19] | |
| 5′-CGCGTTGAGAAGCTGAGGTG-3′ |
| Poultry Product | Retail | Enterobacteriaceae Log[CFU/g] | E. coli Presence | E. coli Log[CFU/g] (Proportion) |
|---|---|---|---|---|
| Hindquarters | Supermarket | 3.5 ± 0.1 c | + | 0.3 ± 0.0 (8%) |
| 5.2 ± 0.0 l | + | 1.5 ± 0.1 (30%) | ||
| 5.5 ± 0.0 m | + | 0.1 ± 0.0 (2%) | ||
| 6.5 ± 0.0 ñ | + | 0.2 ± 0.0 (3%) | ||
| 3.3 ± 0.1 a,b | + | 0.2 ± 0.0 (5%) | ||
| 5.2 ± 0.1 l | + | 0.8 ± 0.1 (16%) | ||
| 6.5 ± 0.0 ñ | - | - | ||
| 4.5 ± 0.1 h,i | + | 0.1 ± 0.0 (2%) | ||
| 4.5 ± 0.0 h,i | + | 0.1 ± 0.0 (3%) | ||
| 4.4 ± 0.0 g,h | + | 0.2 ± 0.0 (5%) | ||
| 4.0 ± 0.0 e | + | 0.1 ± 0.0 (3%) | ||
| 3.4 ± 0.0 b,c | + | 2.5 ± 0.1 (74%) | ||
| 3.2 ± 0.0 a | + | 0.5 ± 0.0 (15%) | ||
| 3.5 ± 0.0 c | + | 0.1 ± 0.0 (3%) | ||
| 4.5 ± 0.0 h,i | + | 0.7 ± 0.0 (16%) | ||
| 6.2 ± 0.1 n | - | - | ||
| 5.0 ± 0.0 k | + | 0.1 ± 0.0 (1%) | ||
| 4.6 ± 0.1 i | + | 0.2 ± 0.0 (5%) | ||
| Butcher | 4.3 ± 0.0 g | + | 1.4 ± 0.2 (24%) | |
| 4.7 ± 0.1 j | - | - | ||
| 4.2 ± 0.1 f | + | 0.1 ± 0.0 (2%) | ||
| 3.4 ± 0.0 b,c | + | 0.1 ± 0.0 (4%) | ||
| 3.4 ± 0.0 b,c | + | 0.2 ± 0.0 (5%) | ||
| 5.0 ± 0.0 k | - | - | ||
| Liver | Supermarket | 3.7 ± 0.1 d | + | 0.2 ± 0.0 (4%) |
| 5.4 ± 0.0 m | + | 0.5 ± 0.1 (9%) | ||
| 4.0 ± 0.0 e | + | 0.8 ± 0.1 (20%) | ||
| 4.5 ± 0.1 h,i | + | 0.2 ± 0.0 (5%) | ||
| Butcher | 4.0 ± 0.1 e | + | 2.3 ± 0.2 (57%) | |
| 5.2 ± 0.1 l | + | 0.2 ± 0.0 (3%) |
| Supermarket | Butcher | |||
|---|---|---|---|---|
| Resistance Phenotype | Hindquarters | Livers | Hindquarters | Livers |
| Suscepetible | 0 | 0 | 1 | 0 |
| Resistance to 1 | 2 | 0 | 1 | 0 |
| Resistance to 2 | 5 | 6 | 3 | 0 |
| Resistance to 3 | 18 | 4 | 27 | 0 |
| Resistance to 4 | 20 | 5 | 11 | 0 |
| Resistance to 5 | 29 | 3 | 6 | 0 |
| Resistance to 6 | 38 | 2 | 1 | 4 |
| Resistance to 7 | 22 | 1 | 0 | 5 |
| Resistance to 8 | 12 | 1 | 0 | 5 |
| Resistance to 9 | 6 | 0 | 0 | 2 |
| Resistance to 10 | 0 | 0 | 0 | 1 |
| Total | 152 | 22 | 50 | 17 |
| Antibiotic | E. coli Isolate Code | Rate (h−1) | Generation Time (h) | ODmax | Latency Phase (h) |
|---|---|---|---|---|---|
| Ampicillin | 3.10 (high resistance) | 0.19 c ± 0.00 | 1.61 a ± 0.01 | 1.274 c ± 0.42 | 1.90 b ± 0.02 |
| 6.8 (medium resistance) | 0.18 b ± 0.00 | 1.71 b ± 0.04 | 0.891 b ± 0.01 | 1.79 a ± 0.18 | |
| 7.1 (sensitive) | 0.00 a ± 0.00 | >24 c | 0.084 a ± 0.00 | >24 c | |
| 7.15 (medium resistance) | 0.17 b ± 0.00 | 1.75 b ± 0.02 | 0.859 b ± 0.04 | 1.77 a ± 0.00 | |
| 19.27 (high resistance) | 0.17 b ± 0.00 | 1.75 b ± 0.03 | 1.099 c ± 0.05 | 2.02 b ± 0.13 | |
| Amoxicillin | 3.10 (high resistance) | 0.18 b ± 0.01 | 1.69 a ± 0.06 | 1.010 c ± 0.03 | 1.94 c ± 0.01 |
| 6.8 (medium resistance) | 0.17 b ± 0.01 | 1.75 a ± 0.13 | 0.846 b ± 0.06 | 1.89 b ± 0.10 | |
| 7.1 (sensitive) | 0.00 a ± 0.00 | >24 c | 0.082 a ± 0.00 | >24 d | |
| 7.15 (medium resistance) | 0.16 b ± 0.00 | 1.86 b ± 0.02 | 0.904 b ± 0.13 | 1.86 a,b ± 0.04 | |
| 19.27 (high resistance) | 0.16 b ± 0.00 | 1.88 b ± 0.03 | 0.972 c ± 0.03 | 2.06 c ± 0.01 | |
| Tetracycline | 3.10 (high resistance) | 0.17 d ± 0.00 | 1.78 a ± 0.01 | 0.917 c ± 0.01 | 2.08 b ± 0.05 |
| 6.8 (medium resistance) | 0.09 b ± 0.01 | 3.23 c ± 0.16 | 0.800 b ± 0.07 | 1.71 a ± 0.03 | |
| 7.1 (sensitive) | 0.00 a ± 0.01 | >24 d | 0.088 a ± 0.01 | >24 c | |
| 7.15 (medium resistance) | 0.15 c ± 0.07 | 1.98 a,b ± 0.04 | 0.765 b ± 0.01 | 1.68 a ± 0.04 | |
| 19.27 (high resistance) | 0.14 c ± 0.01 | 2.04 b ± 0.06 | 0.839 c ± 0.03 | 1.96 b ± 0.13 |
| Antibiotic | Total E.coli Resistant Isolates | Amplified Gene | E. coli | % |
|---|---|---|---|---|
| Beta-lactam (ampicillin and amoxicillin) | 156 | blaSHV | 0 | 0 |
| blaTEM | 156 | 100 | ||
| blaCMY-2 | 0 | 0 | ||
| All genes | 0 | 0 | ||
| No gene | 0 | 0 | ||
| Tetracycline | 176 | tet(A) | 117 | 67 |
| tet(B) | 16 | 9 | ||
| All genes | 0 | 0 | ||
| No gene | 42 | 24 |
Publisher’s Note: MDPI stays neutral with regard to jurisdictional claims in published maps and institutional affiliations. |
© 2021 by the authors. Licensee MDPI, Basel, Switzerland. This article is an open access article distributed under the terms and conditions of the Creative Commons Attribution (CC BY) license (https://creativecommons.org/licenses/by/4.0/).
Share and Cite
García-Béjar, B.; García de Blas Martín, I.; Arévalo-Villena, M.; Briones Pérez, A. High Prevalence of Antibiotic-Resistant Escherichia coli Isolates from Retail Poultry Products in Spain. Animals 2021, 11, 3197. https://doi.org/10.3390/ani11113197
García-Béjar B, García de Blas Martín I, Arévalo-Villena M, Briones Pérez A. High Prevalence of Antibiotic-Resistant Escherichia coli Isolates from Retail Poultry Products in Spain. Animals. 2021; 11(11):3197. https://doi.org/10.3390/ani11113197
Chicago/Turabian StyleGarcía-Béjar, Beatriz, Izan García de Blas Martín, María Arévalo-Villena, and Ana Briones Pérez. 2021. "High Prevalence of Antibiotic-Resistant Escherichia coli Isolates from Retail Poultry Products in Spain" Animals 11, no. 11: 3197. https://doi.org/10.3390/ani11113197