
Roaming in a Land of Milk and Honey: Life Trajectories and Metabolic Rate of Female Inbred Mice Living in a Semi Naturalistic Environment


Abstract
:Simple Summary
Abstract
1. Introduction
2. Materials and Methods
2.1. Animal Husbandry
2.2. Transponder Injection
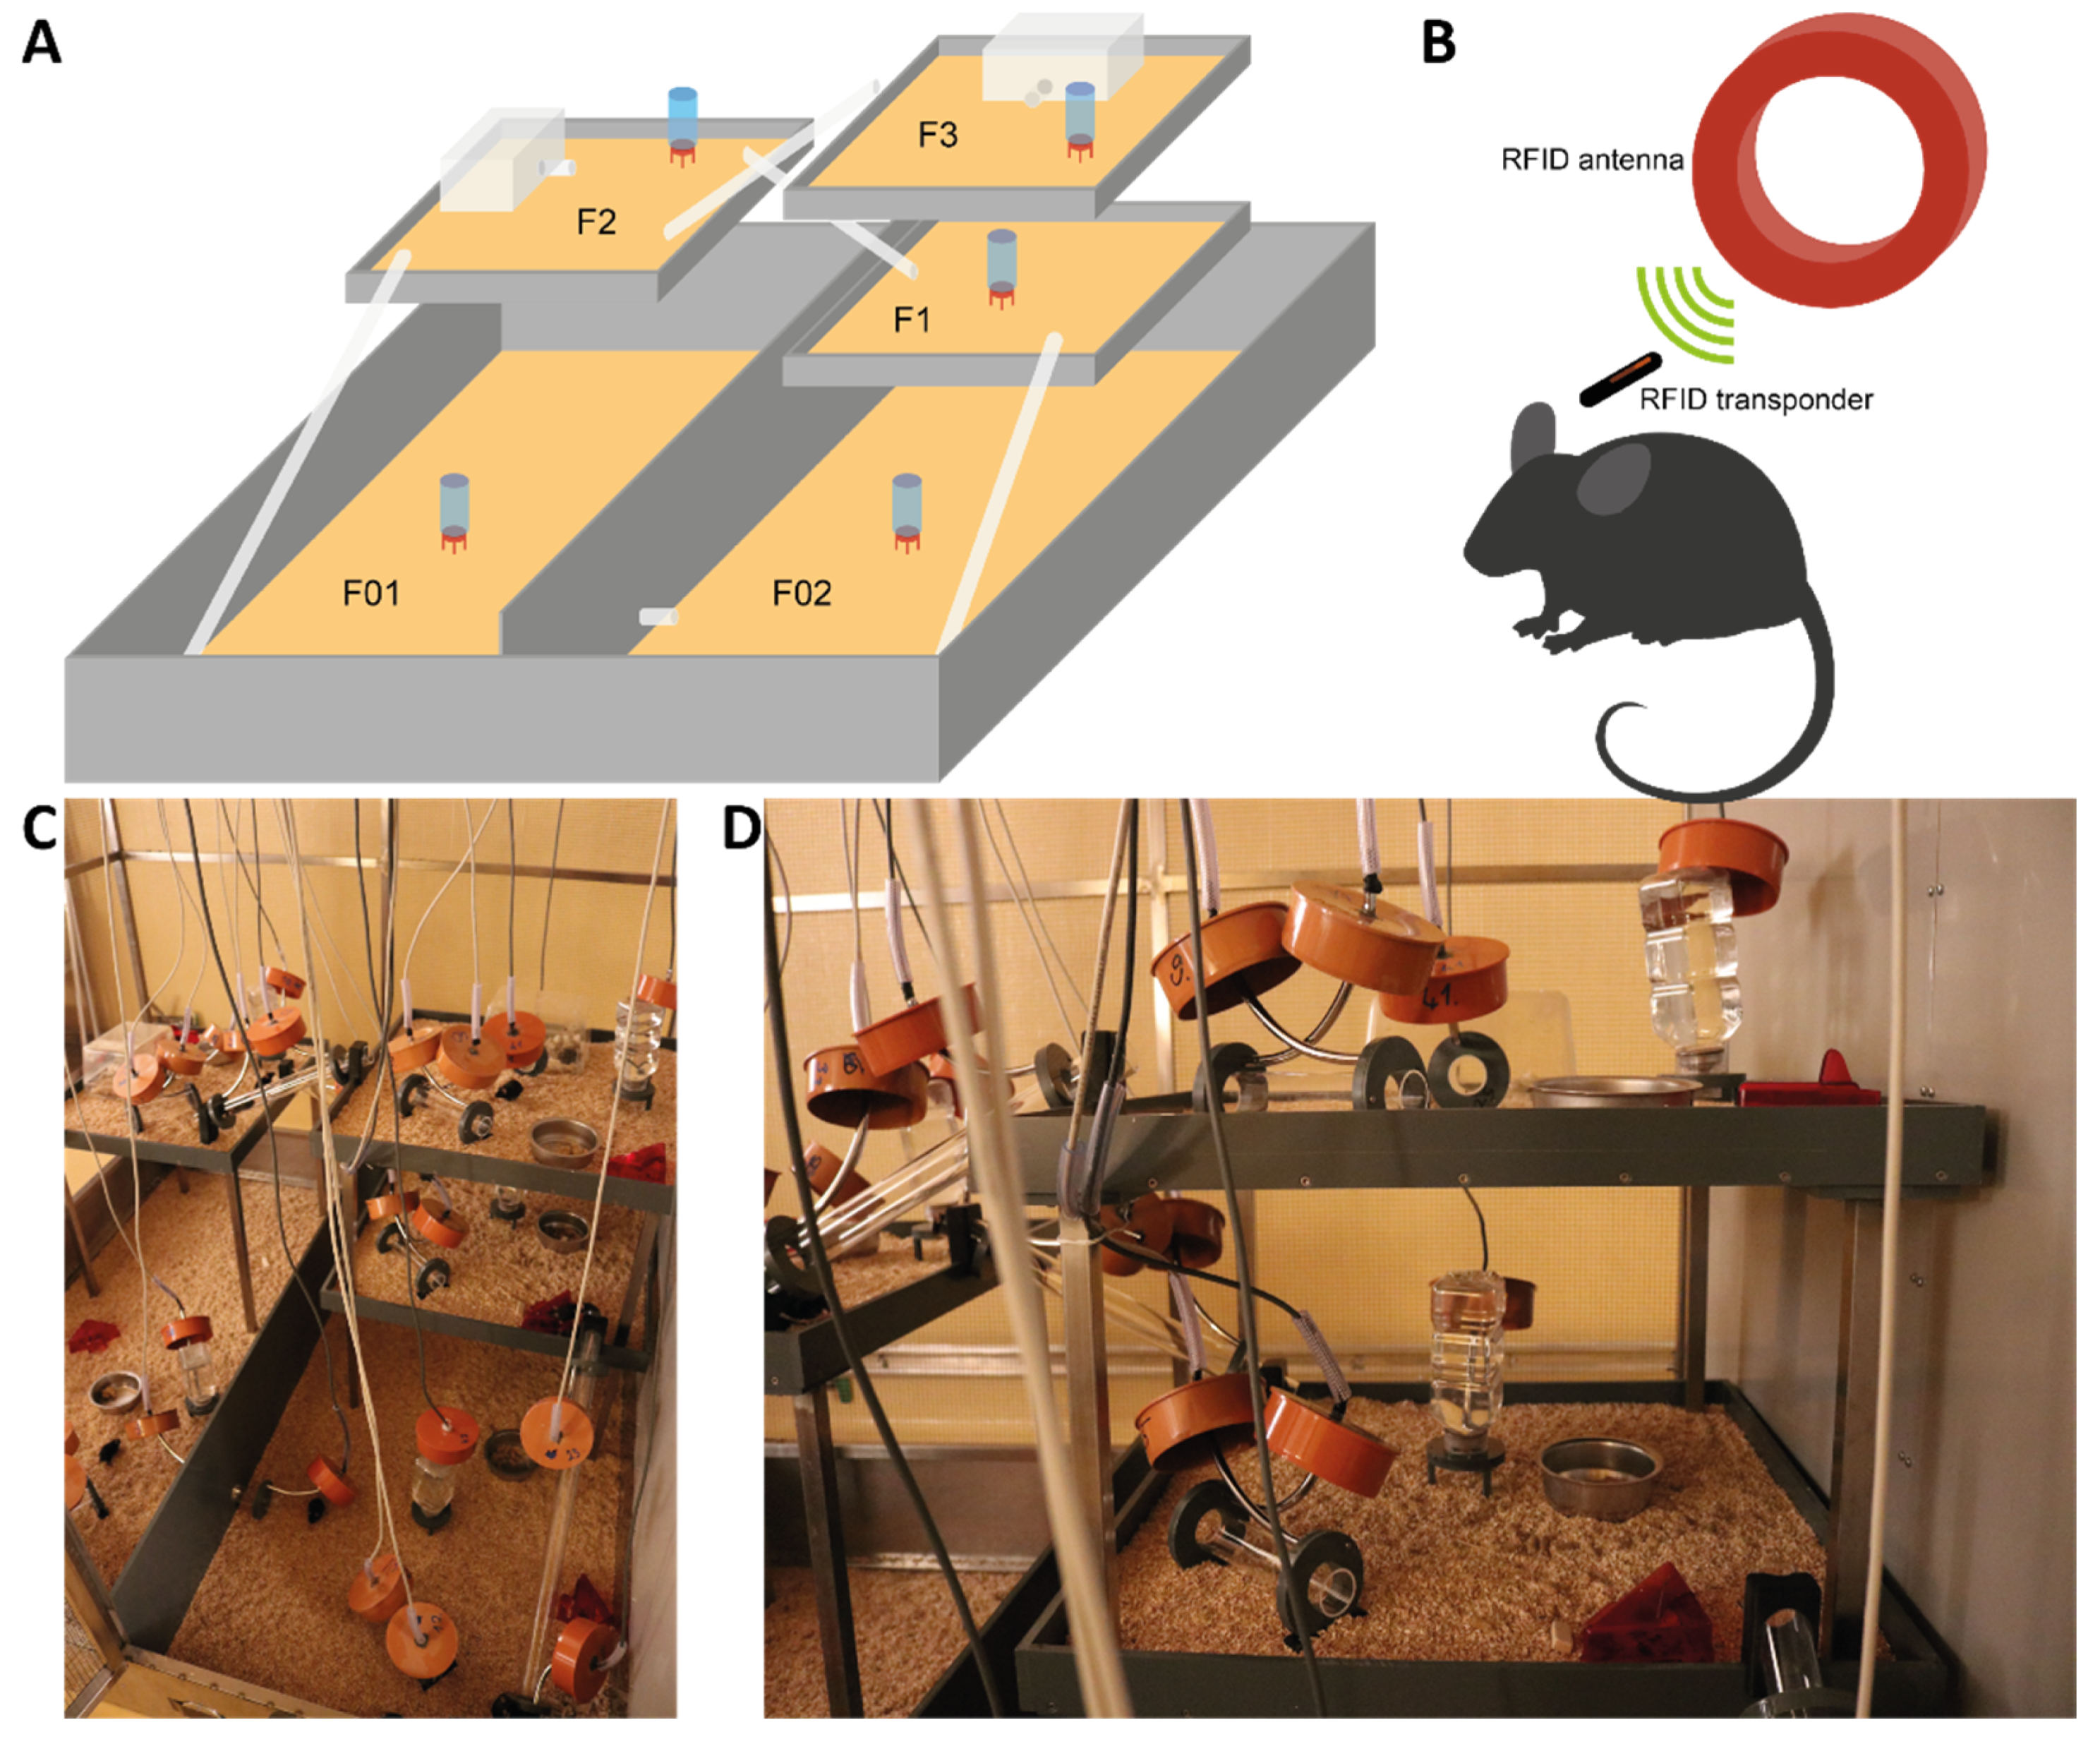
2.3. Semi Naturalistic Environment
2.4. Measurement of Activity
2.5. Behavioral Observation
2.6. Metabolic Rate
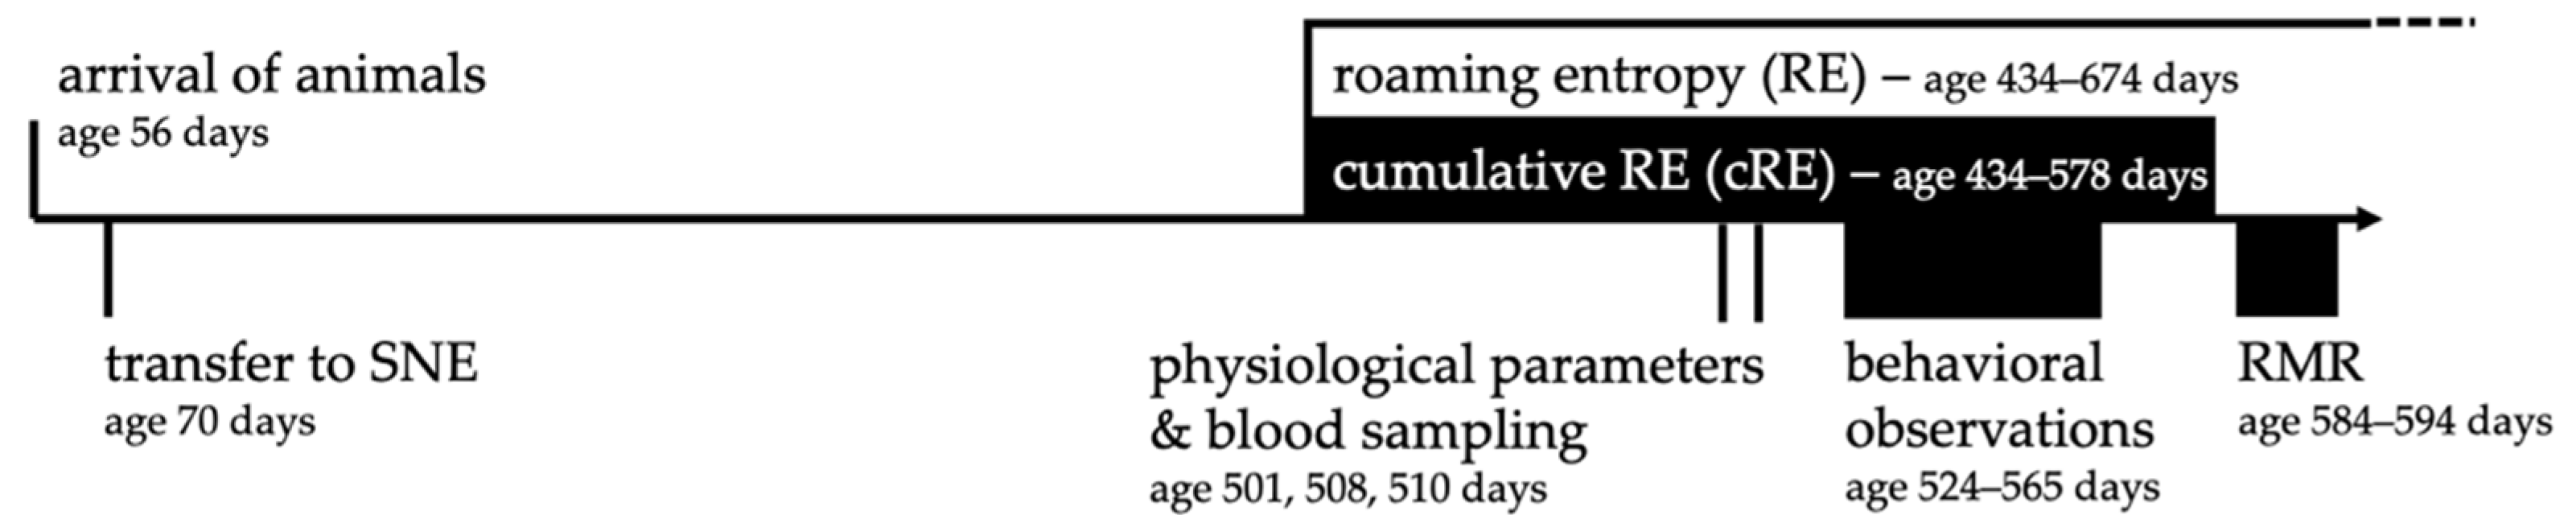
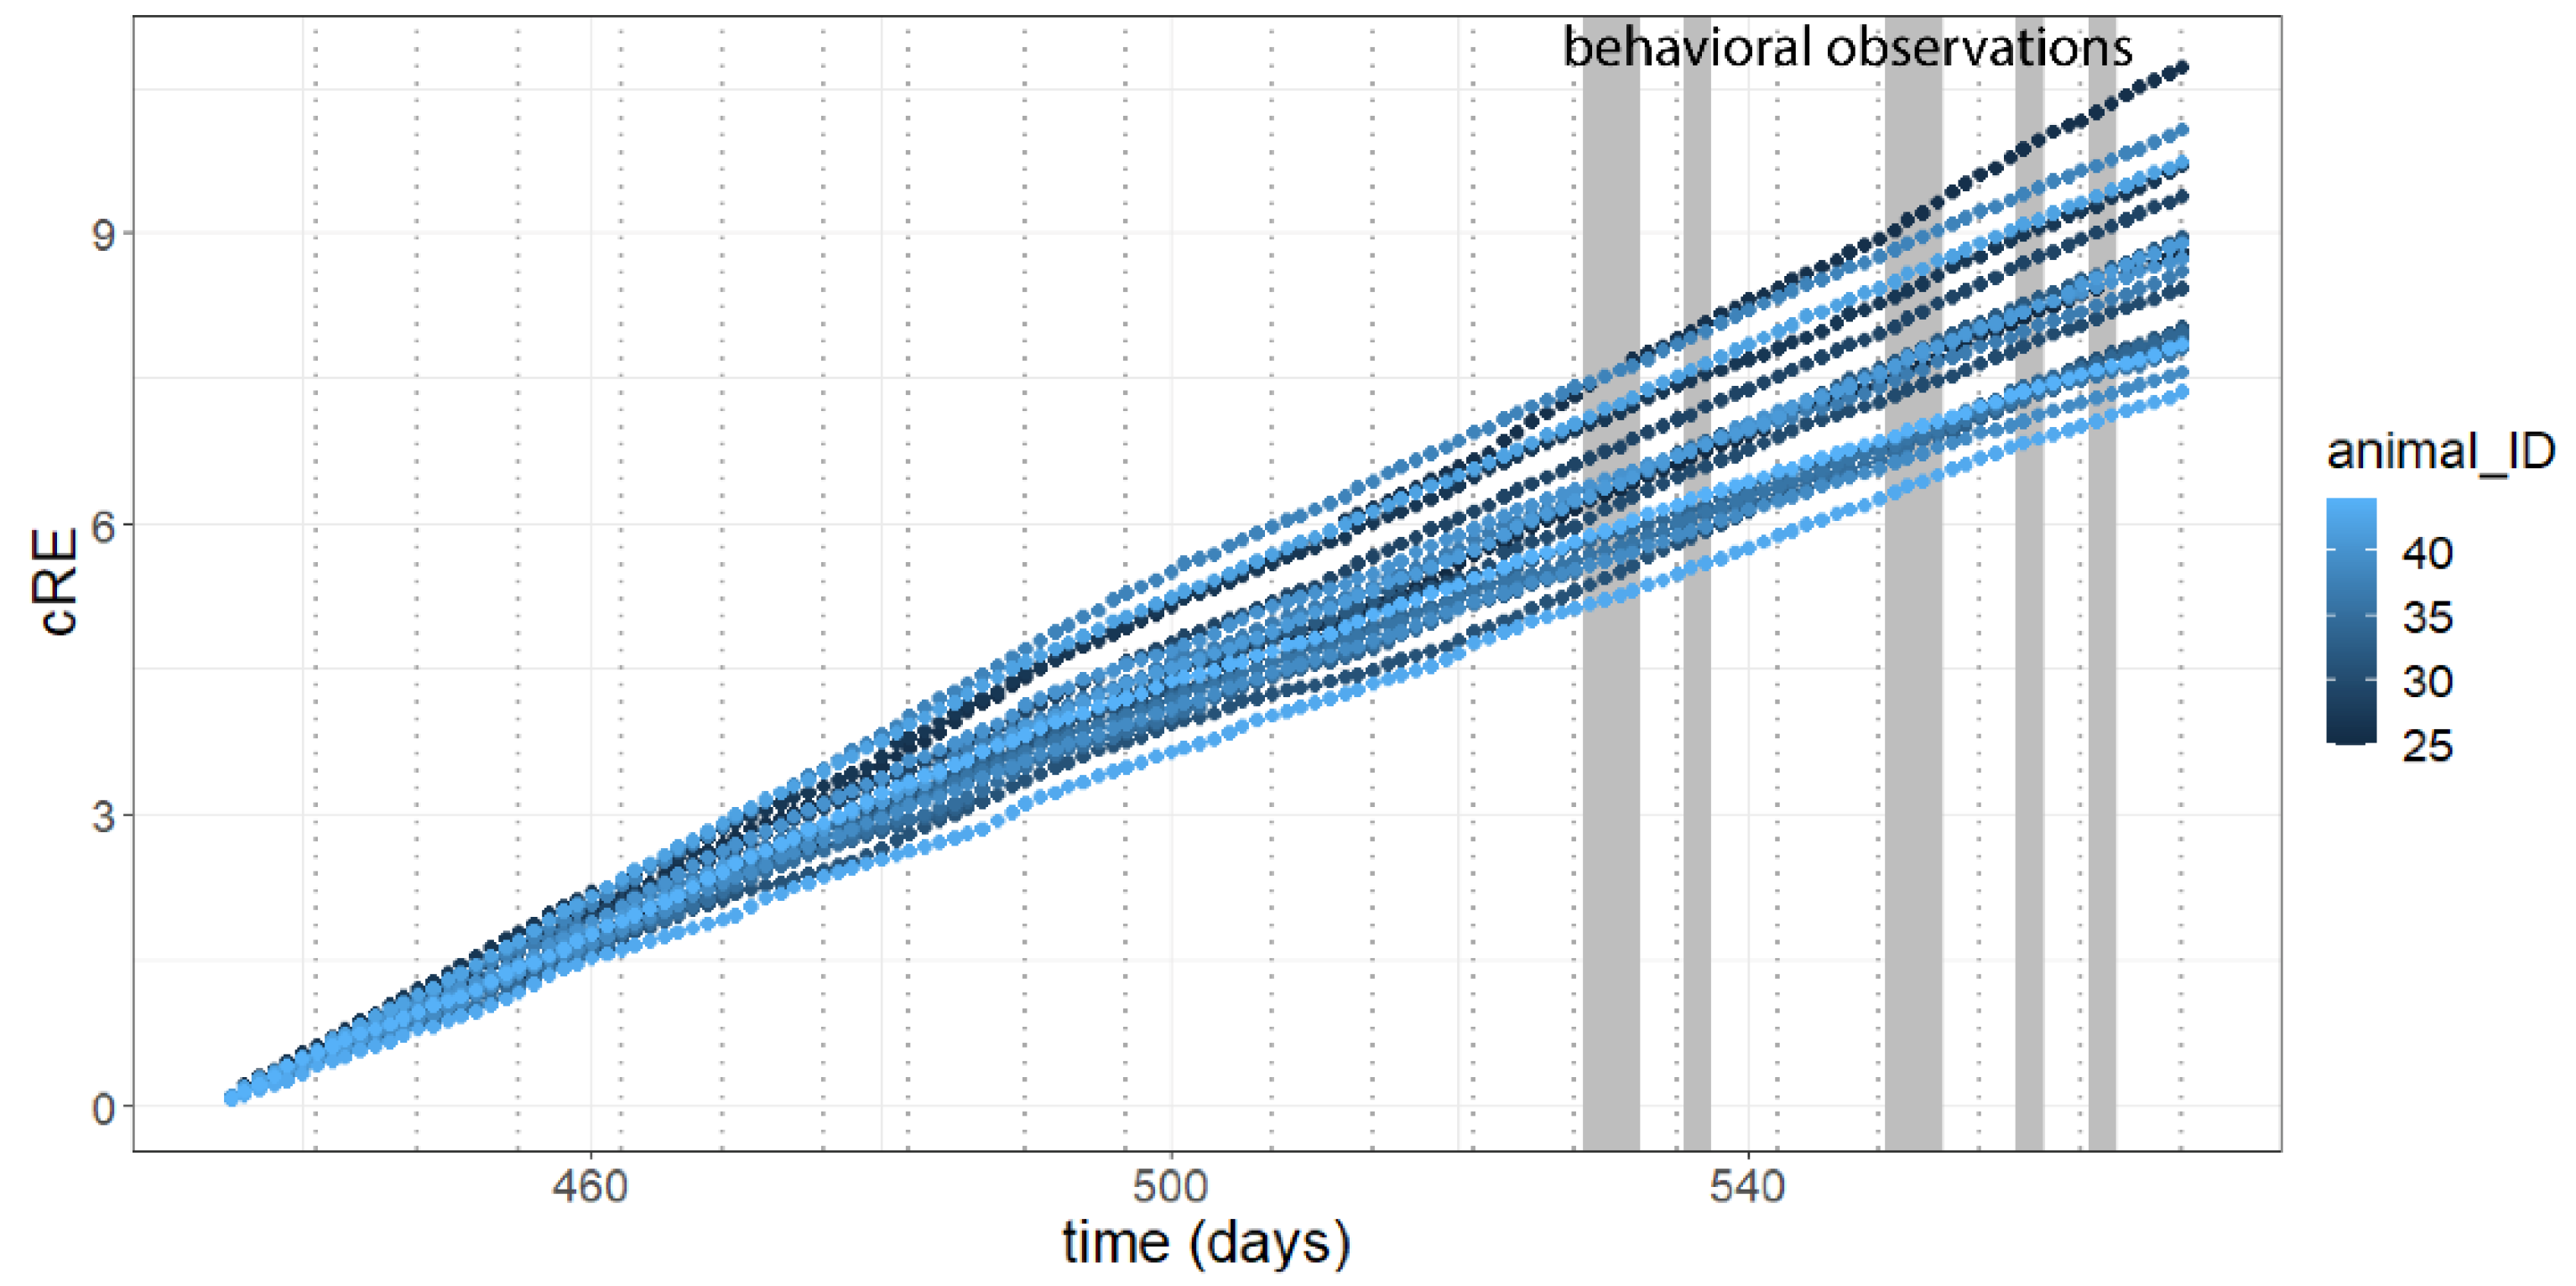
2.7. Timeline of Experiments
2.8. Statistical Analysis and Calculations
3. Results
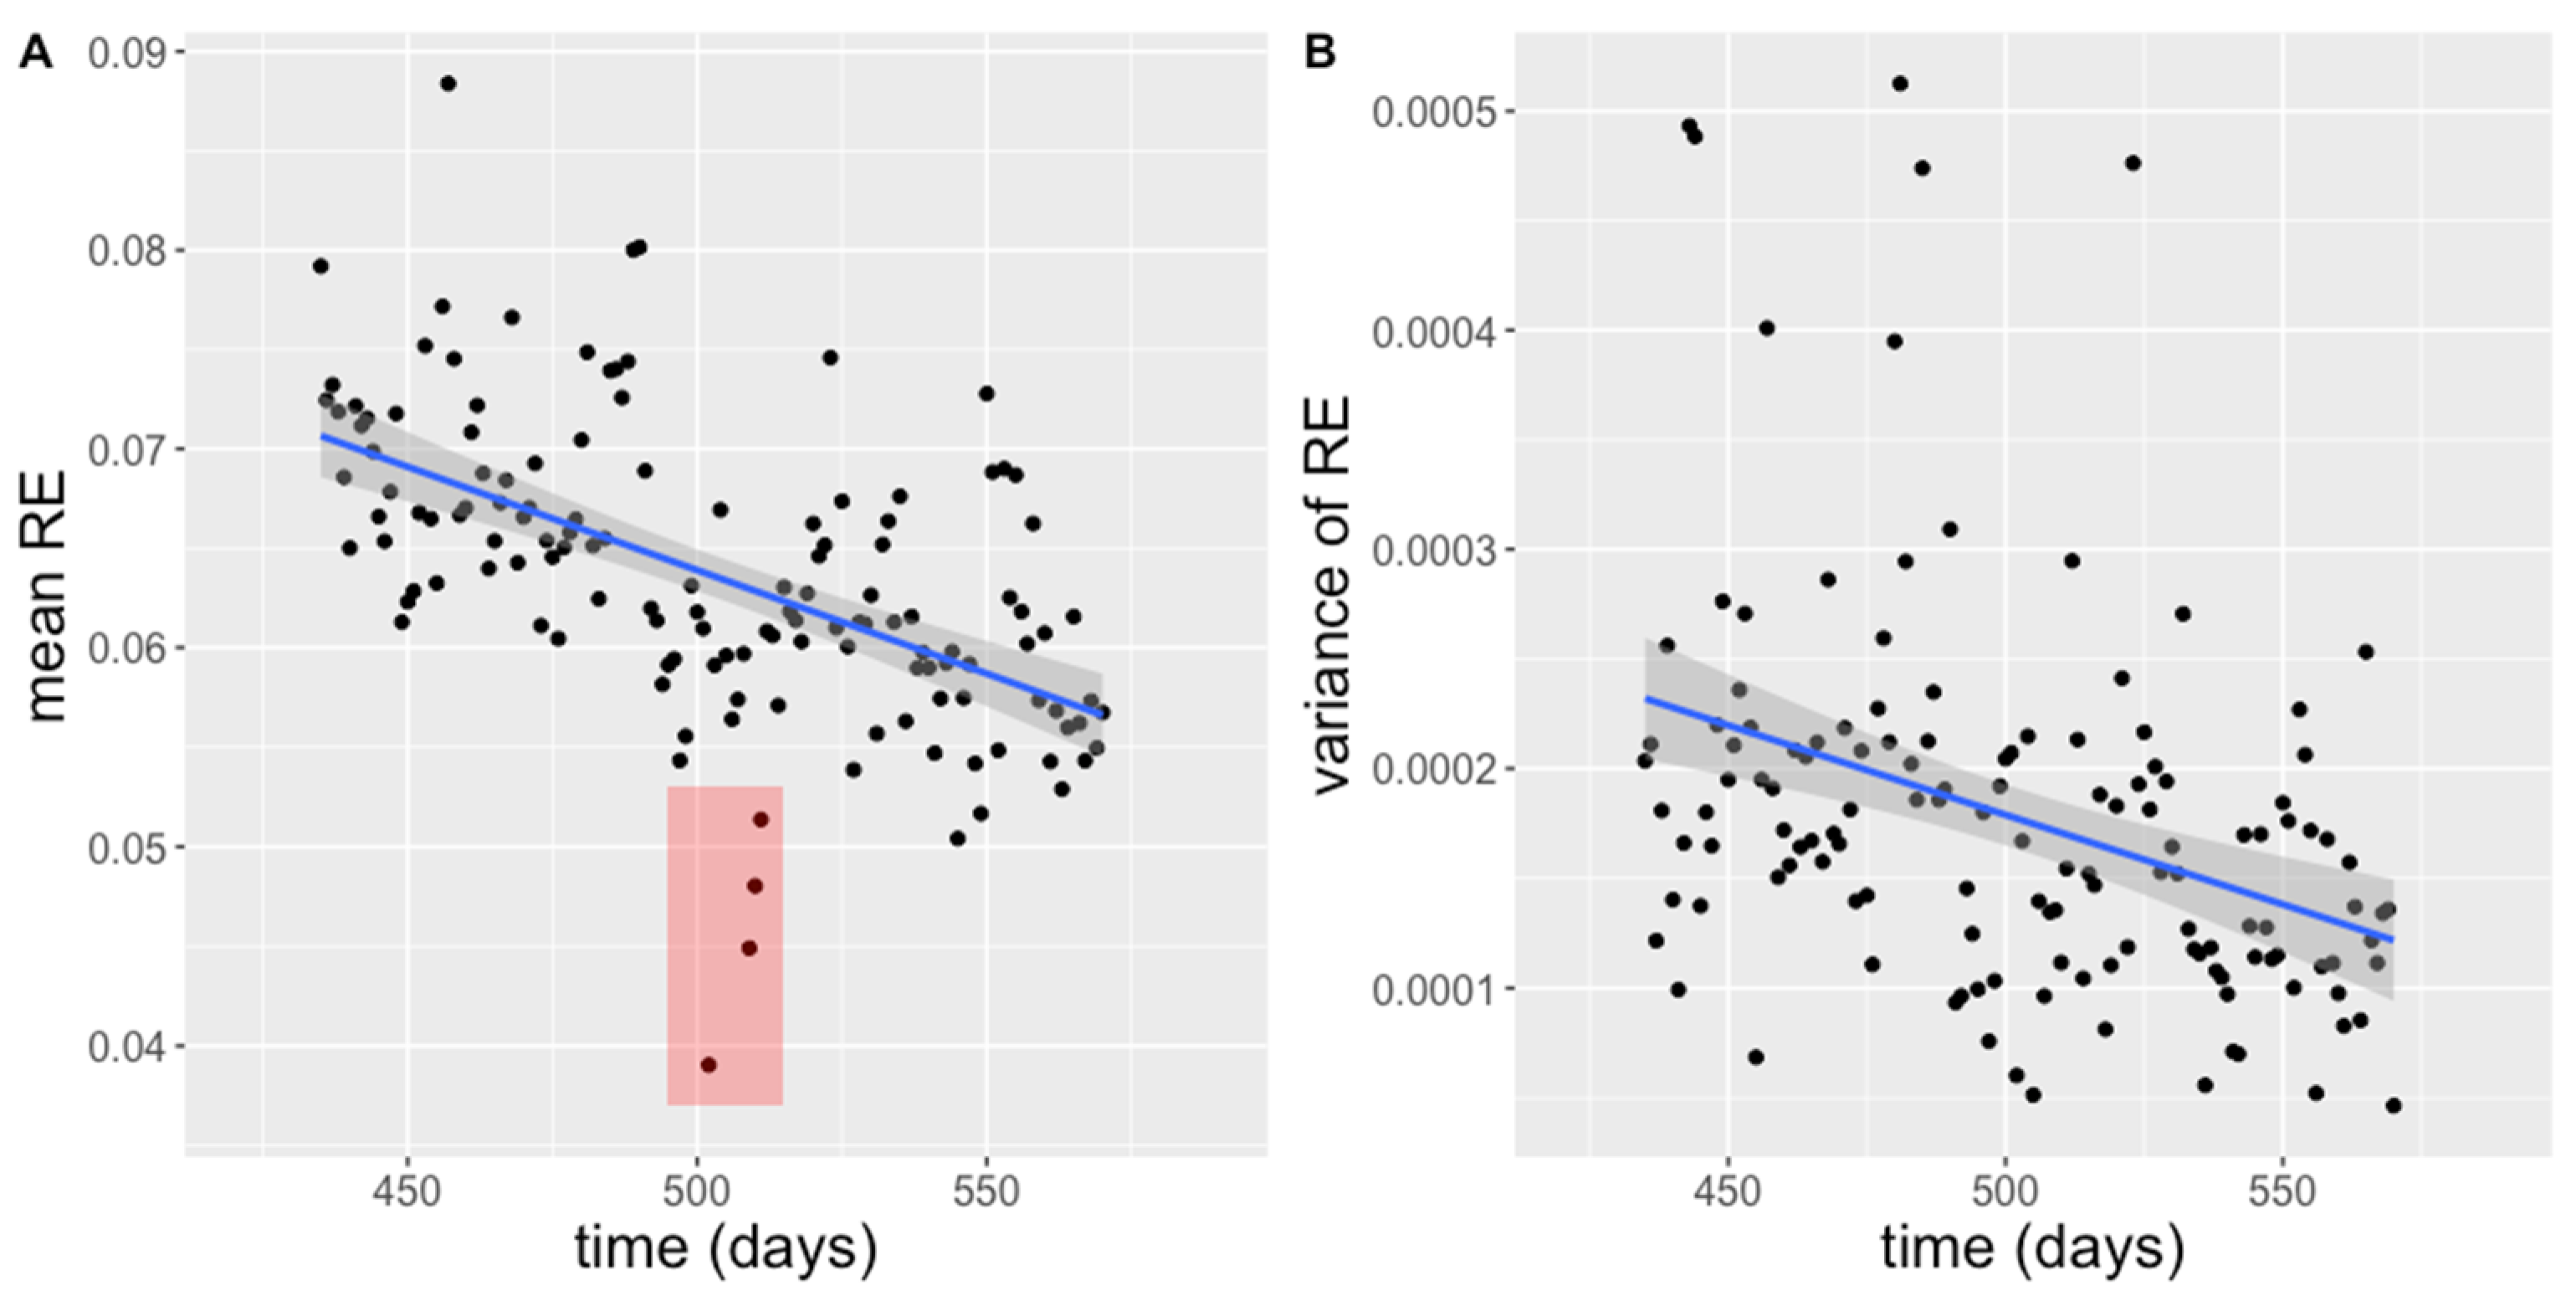
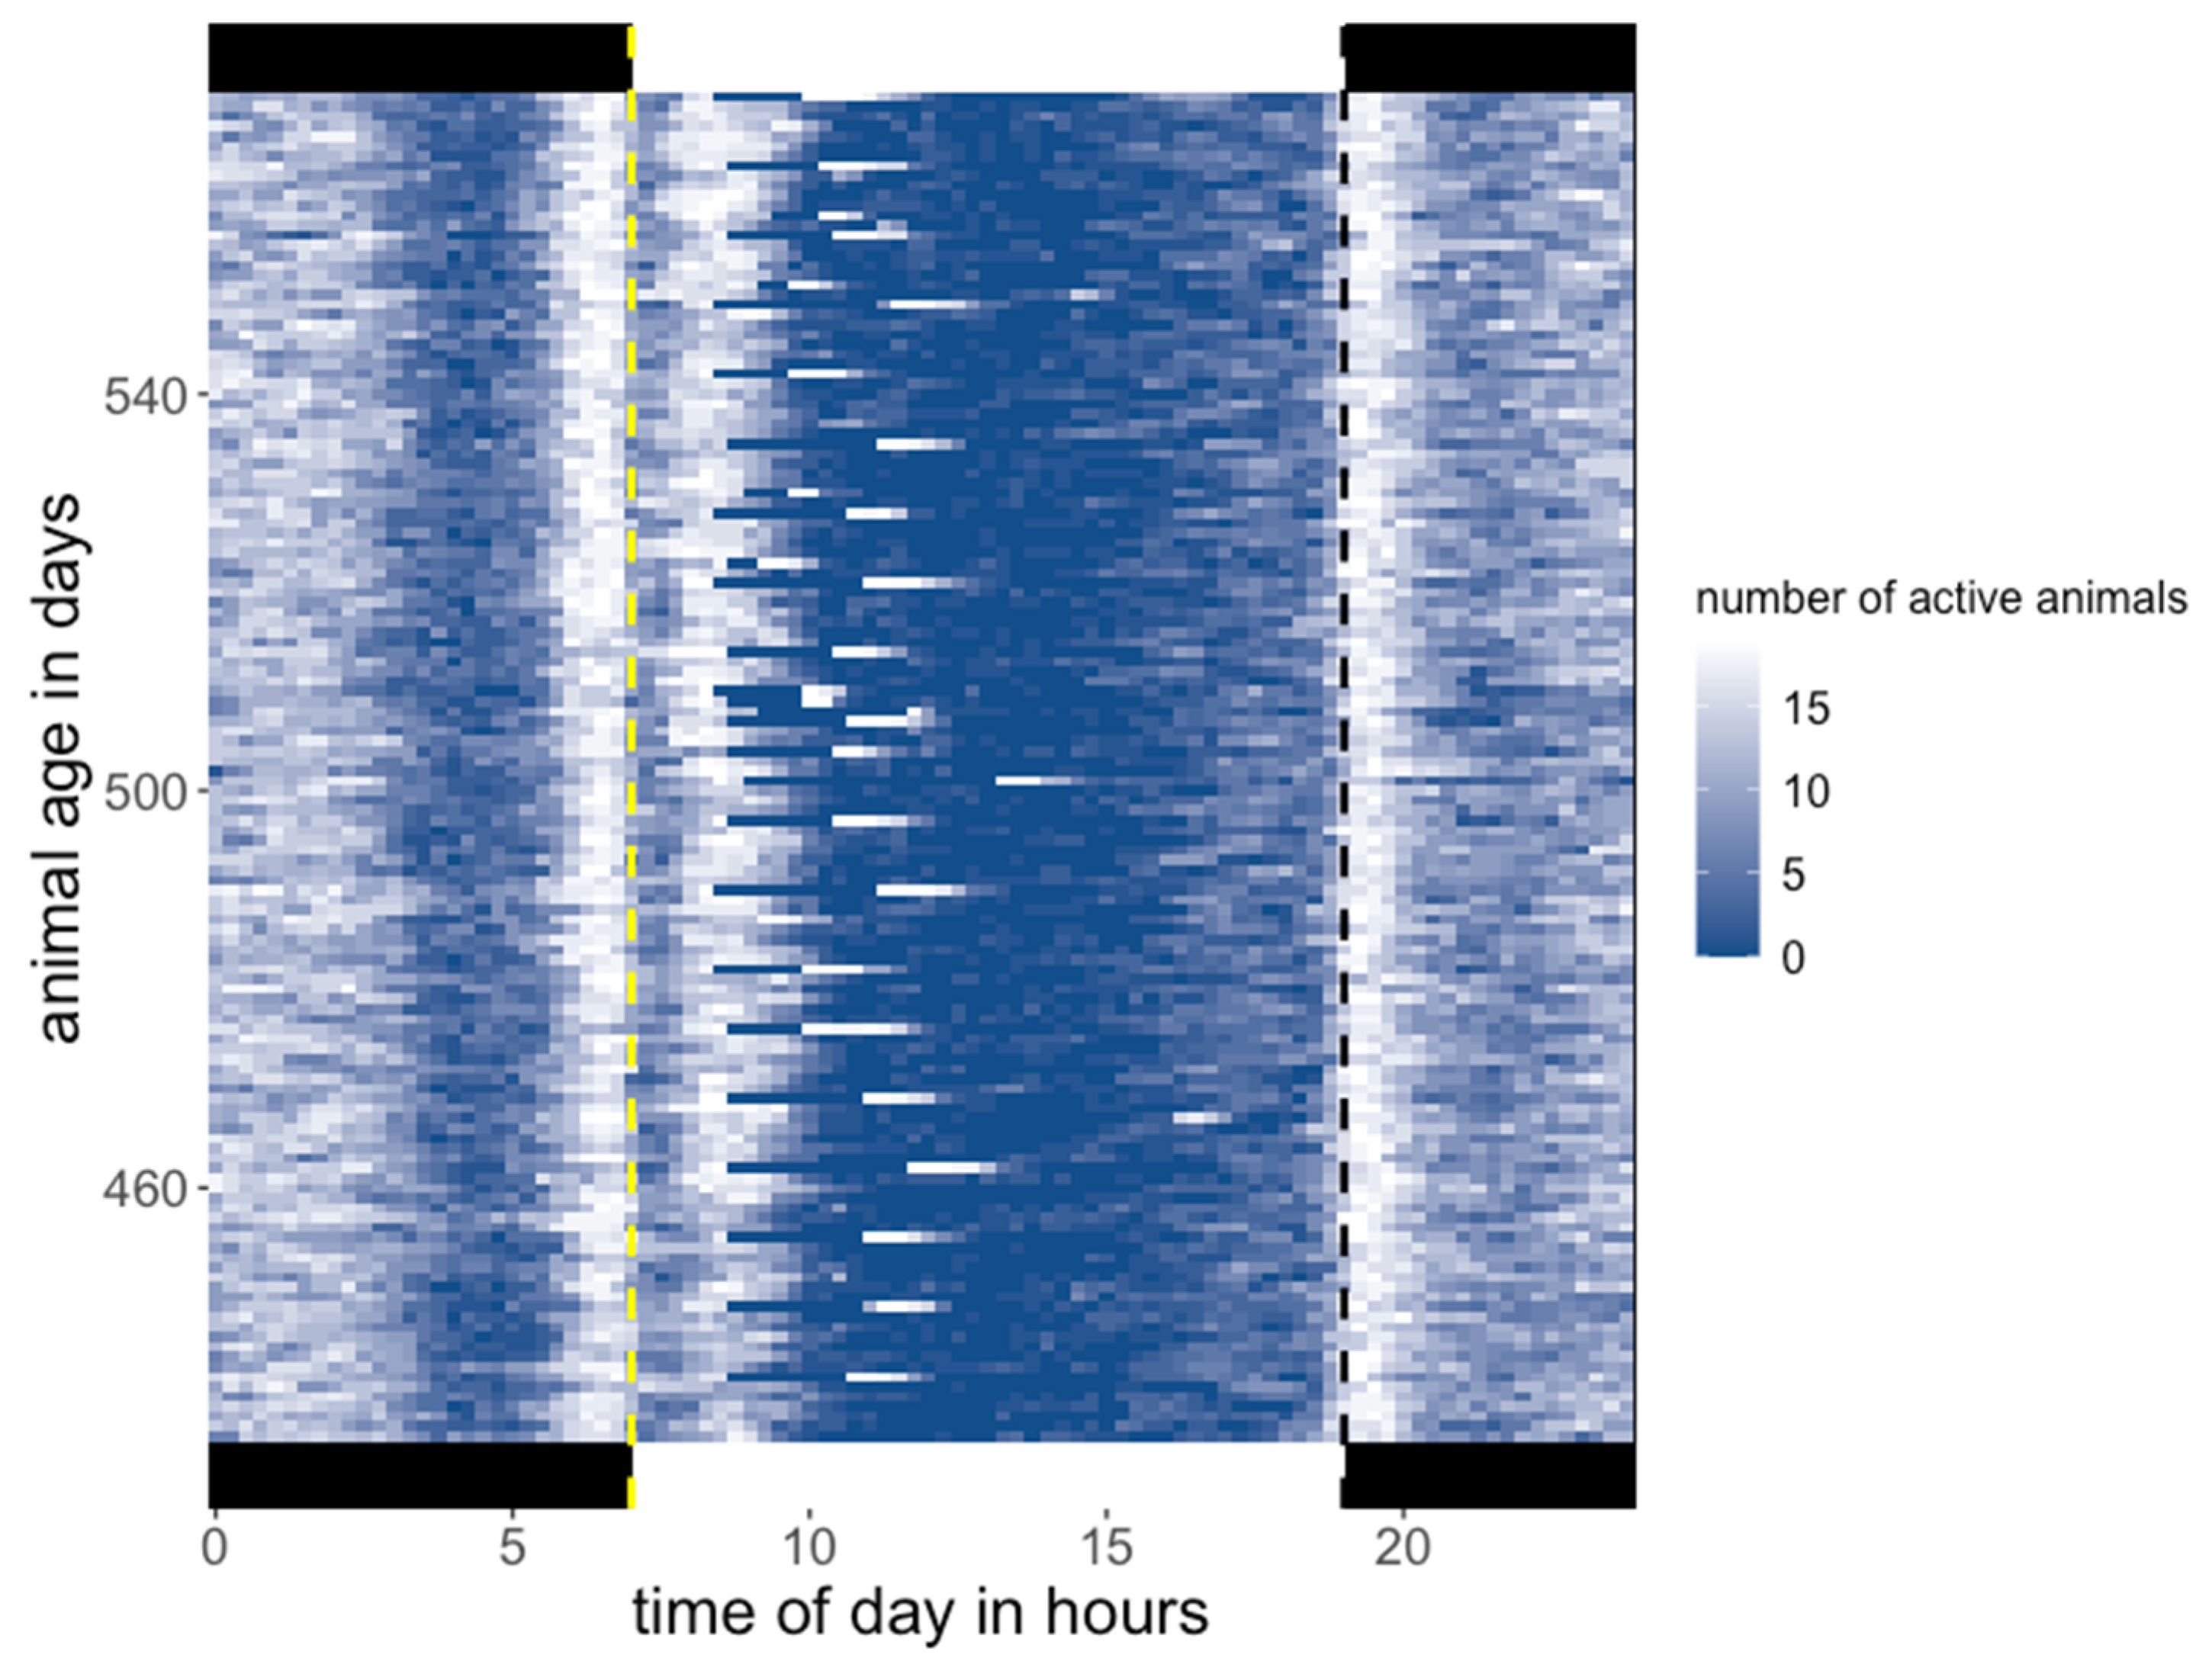
3.1. Activity
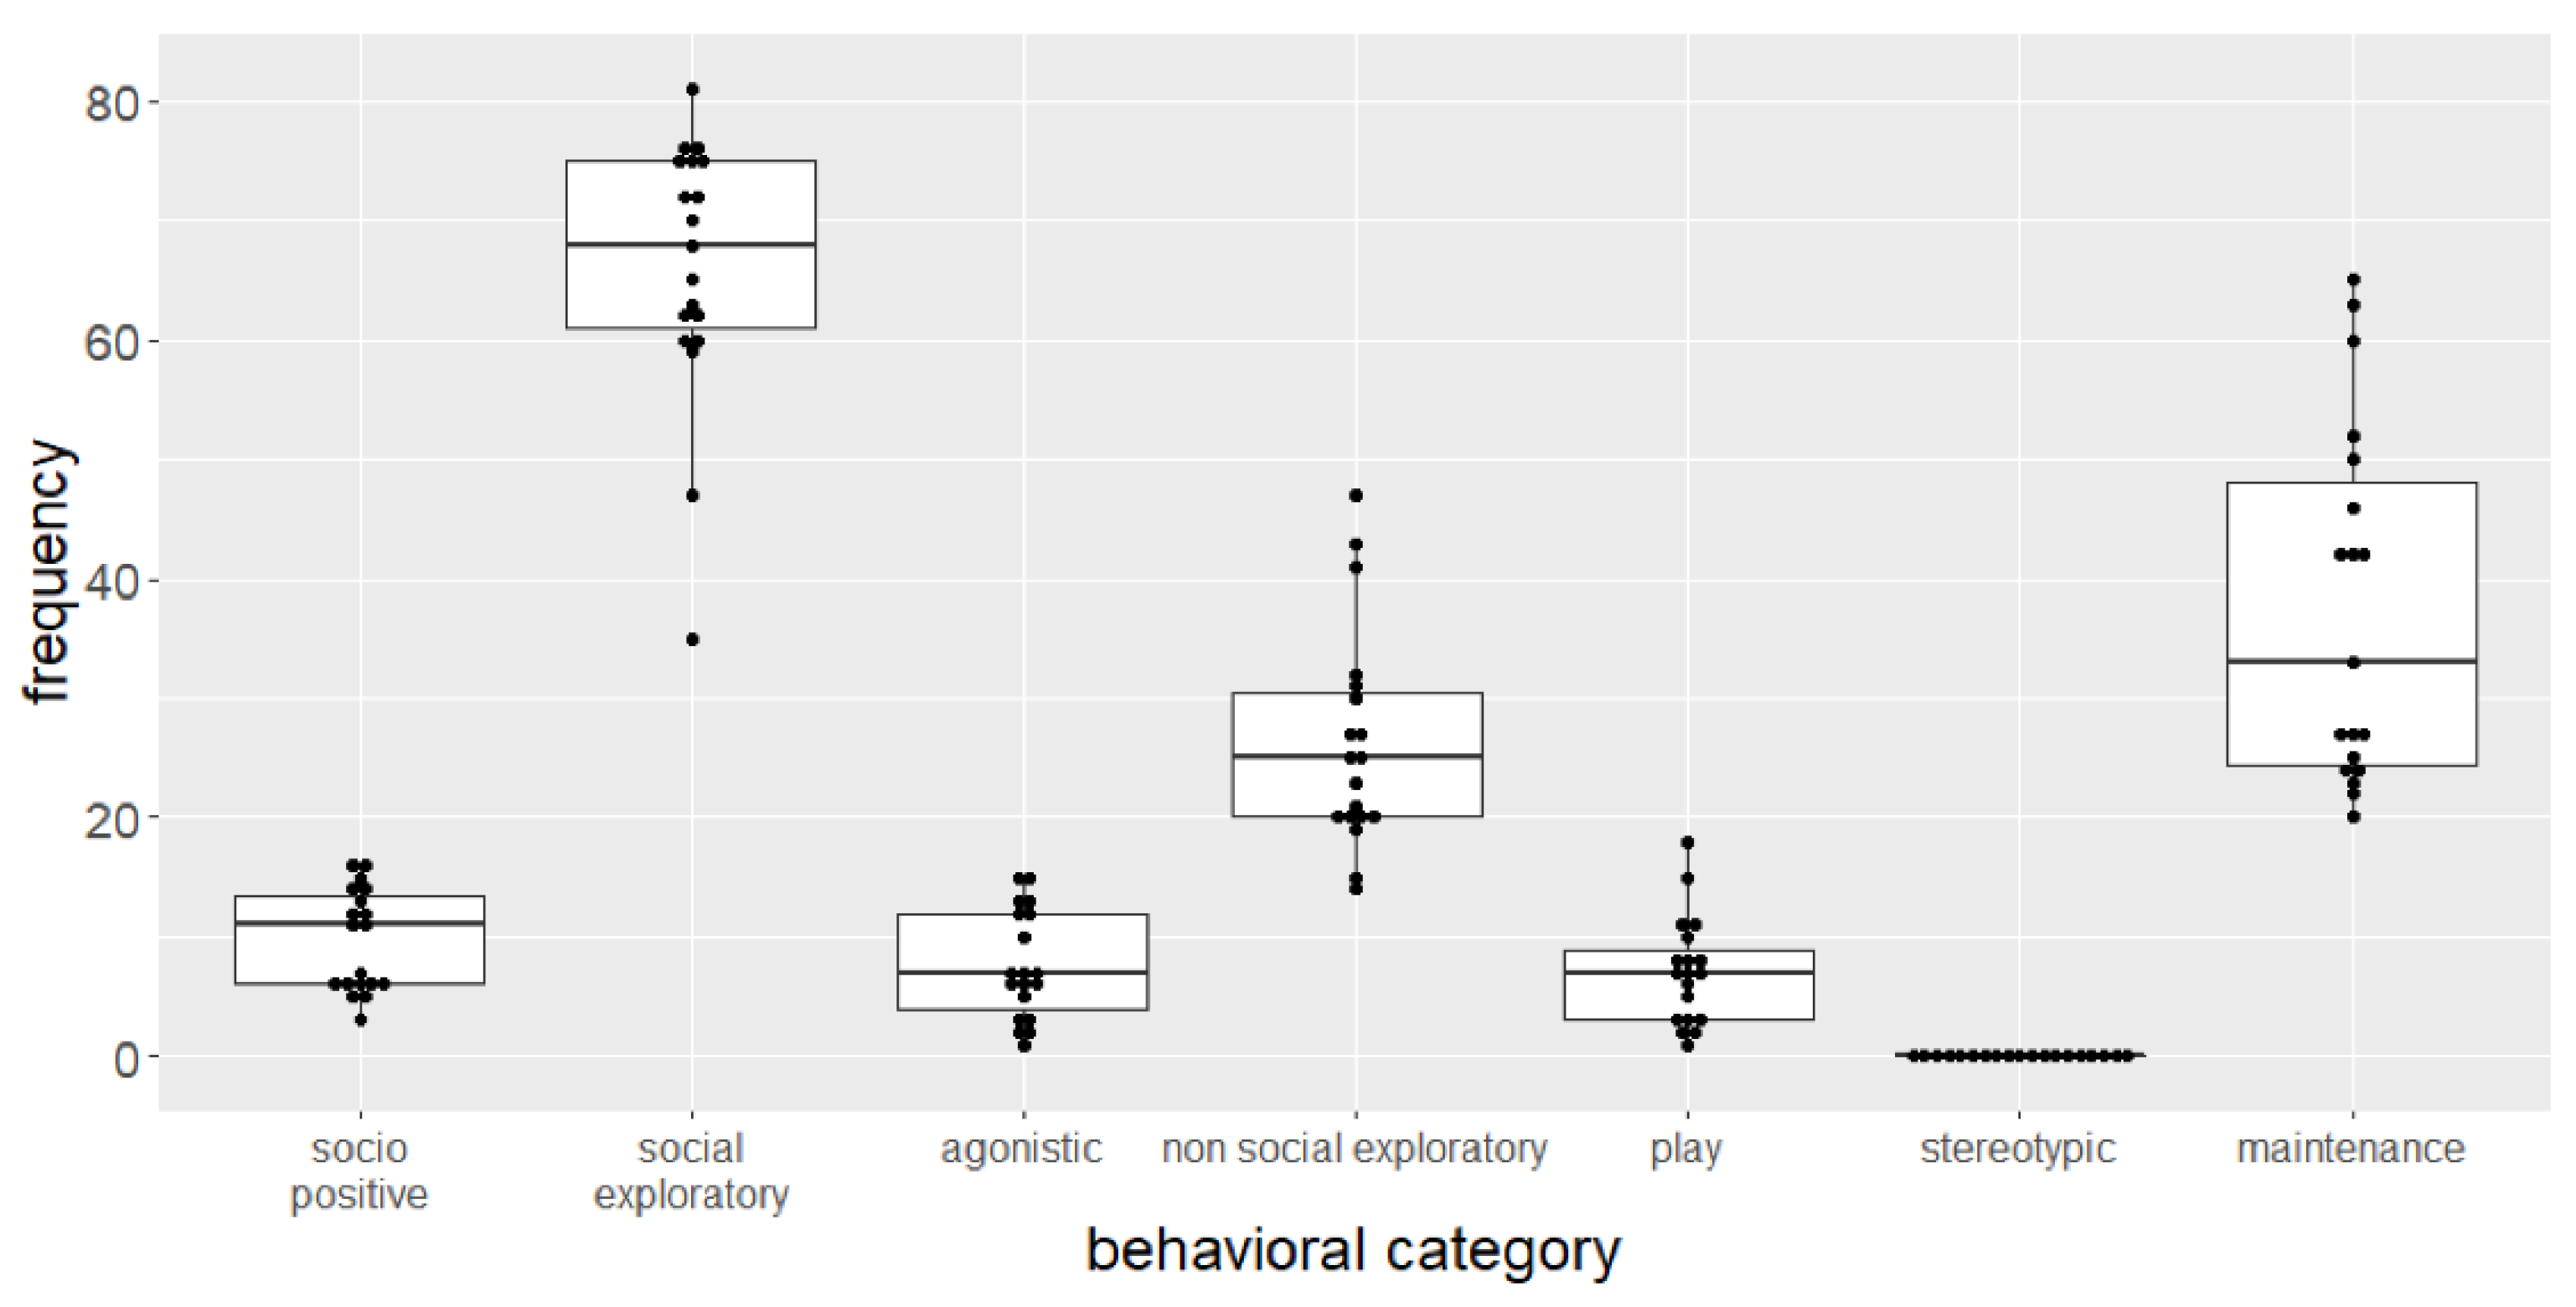
3.2. Spontaneous Behavior
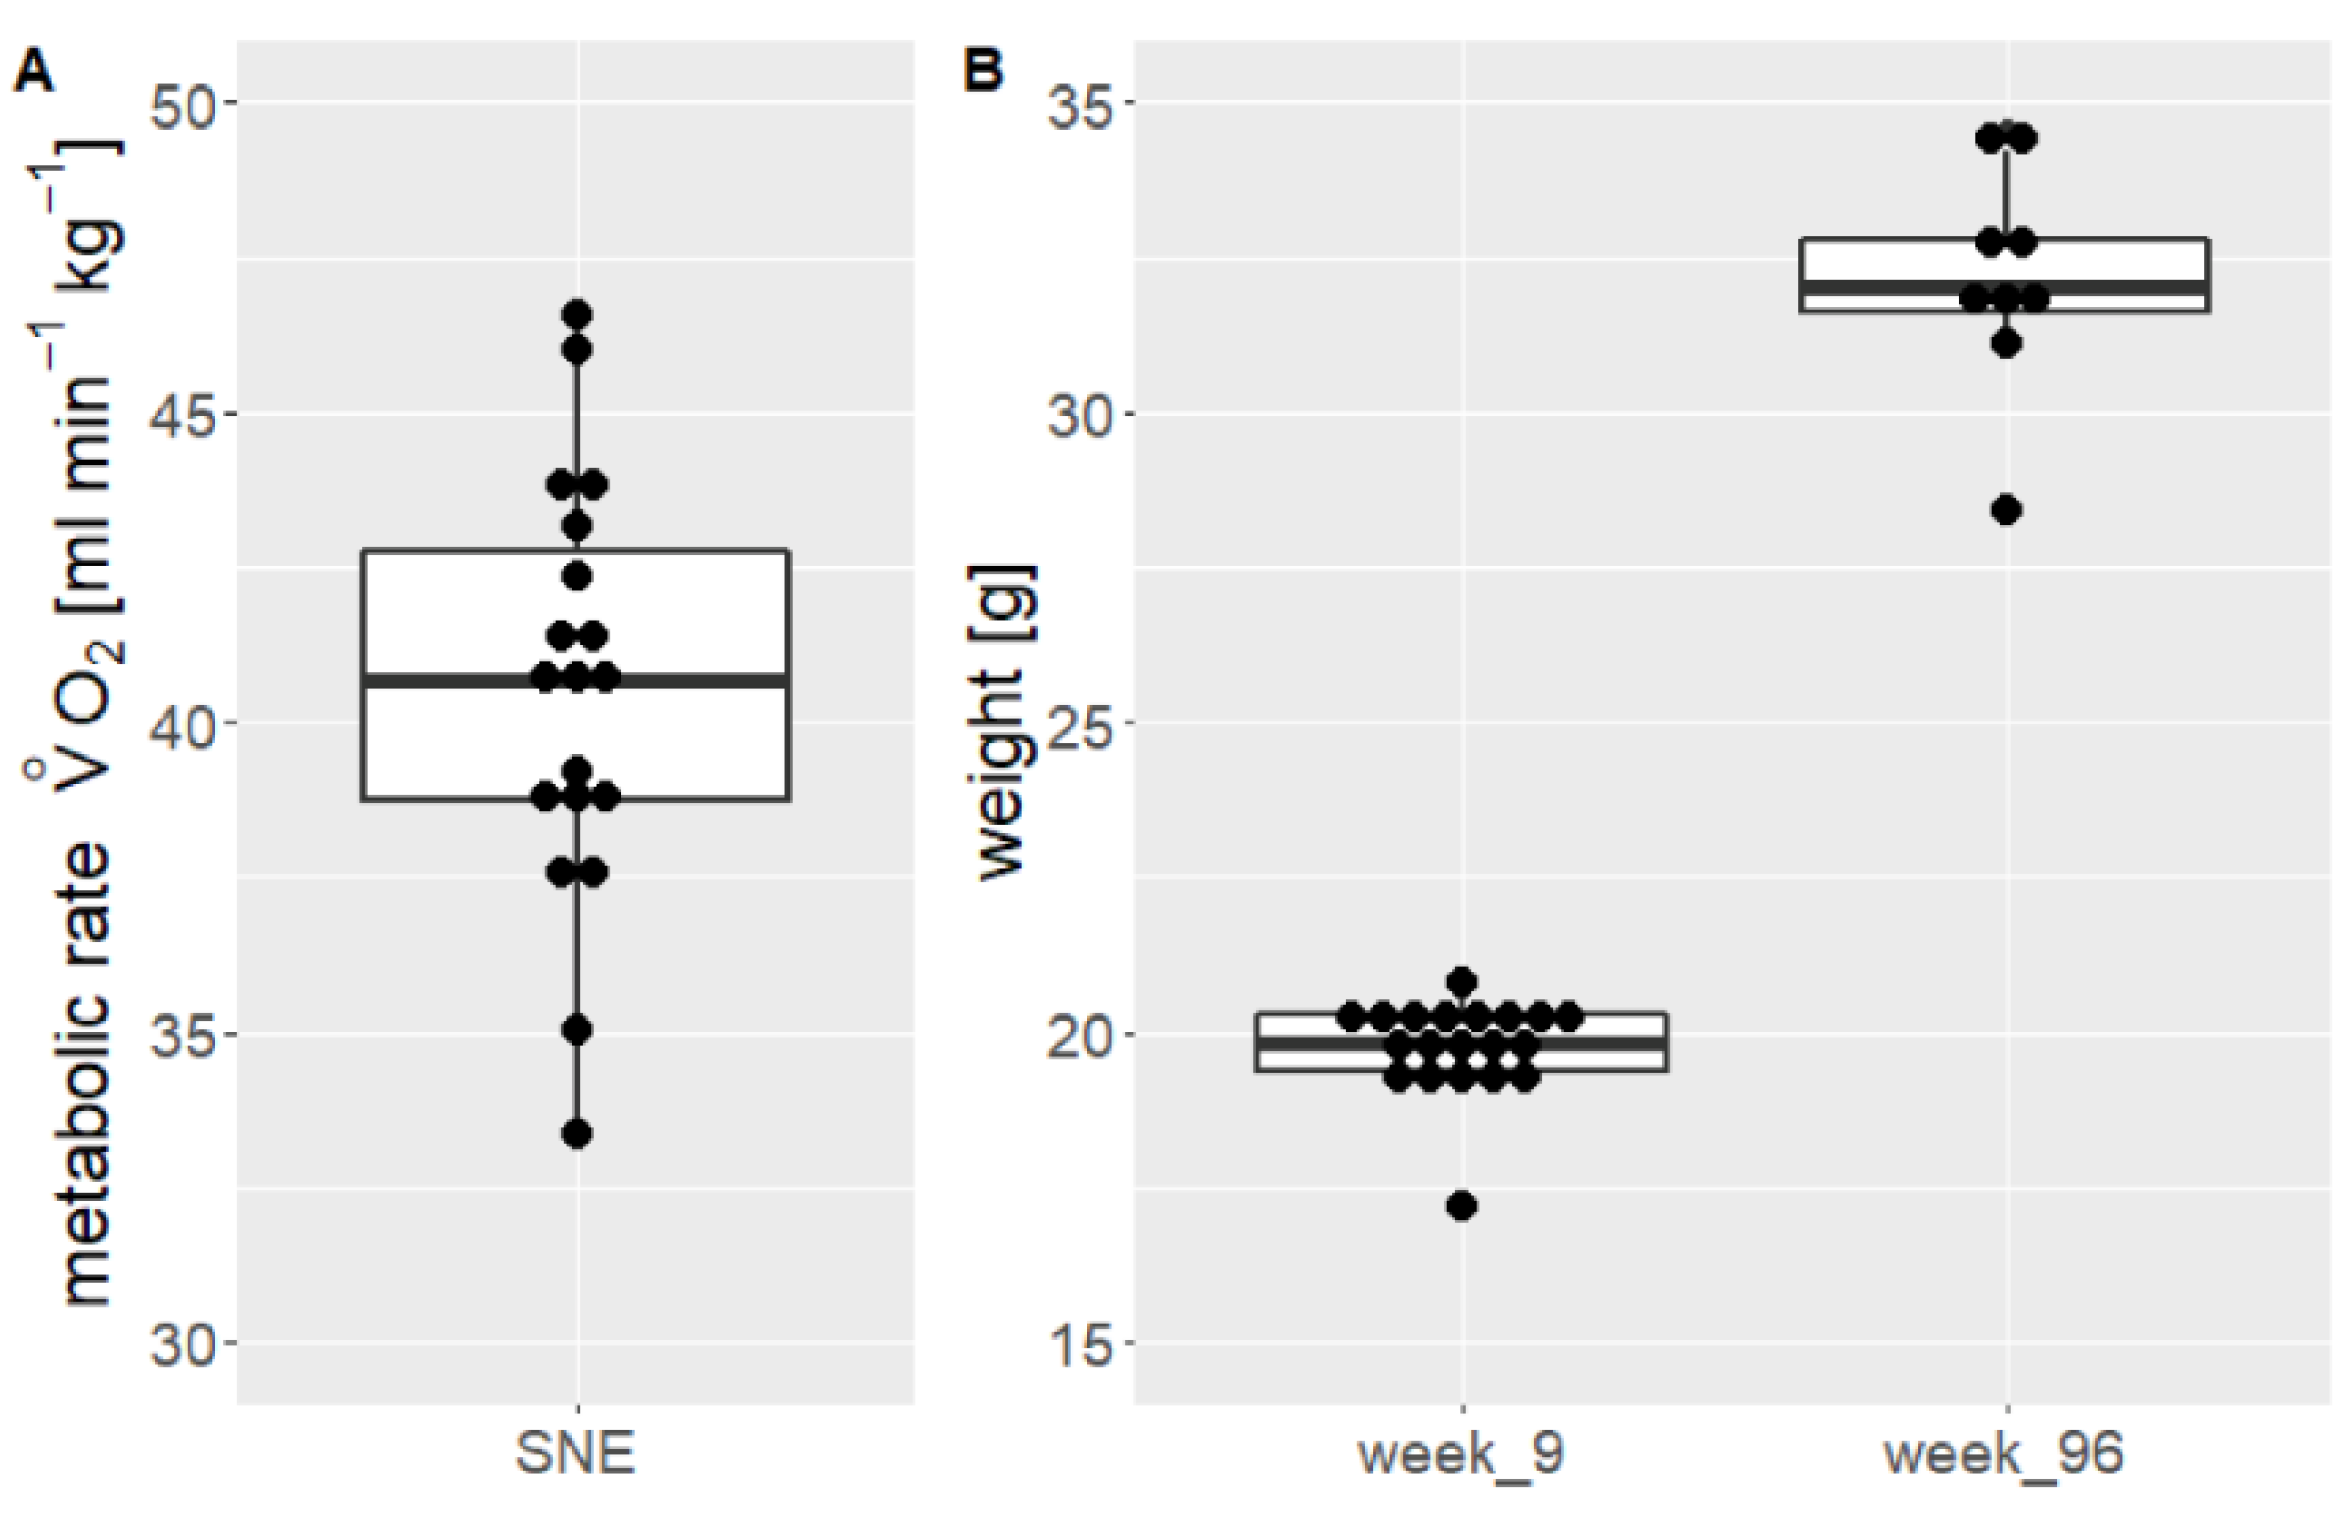
3.3. Metabolic Rate
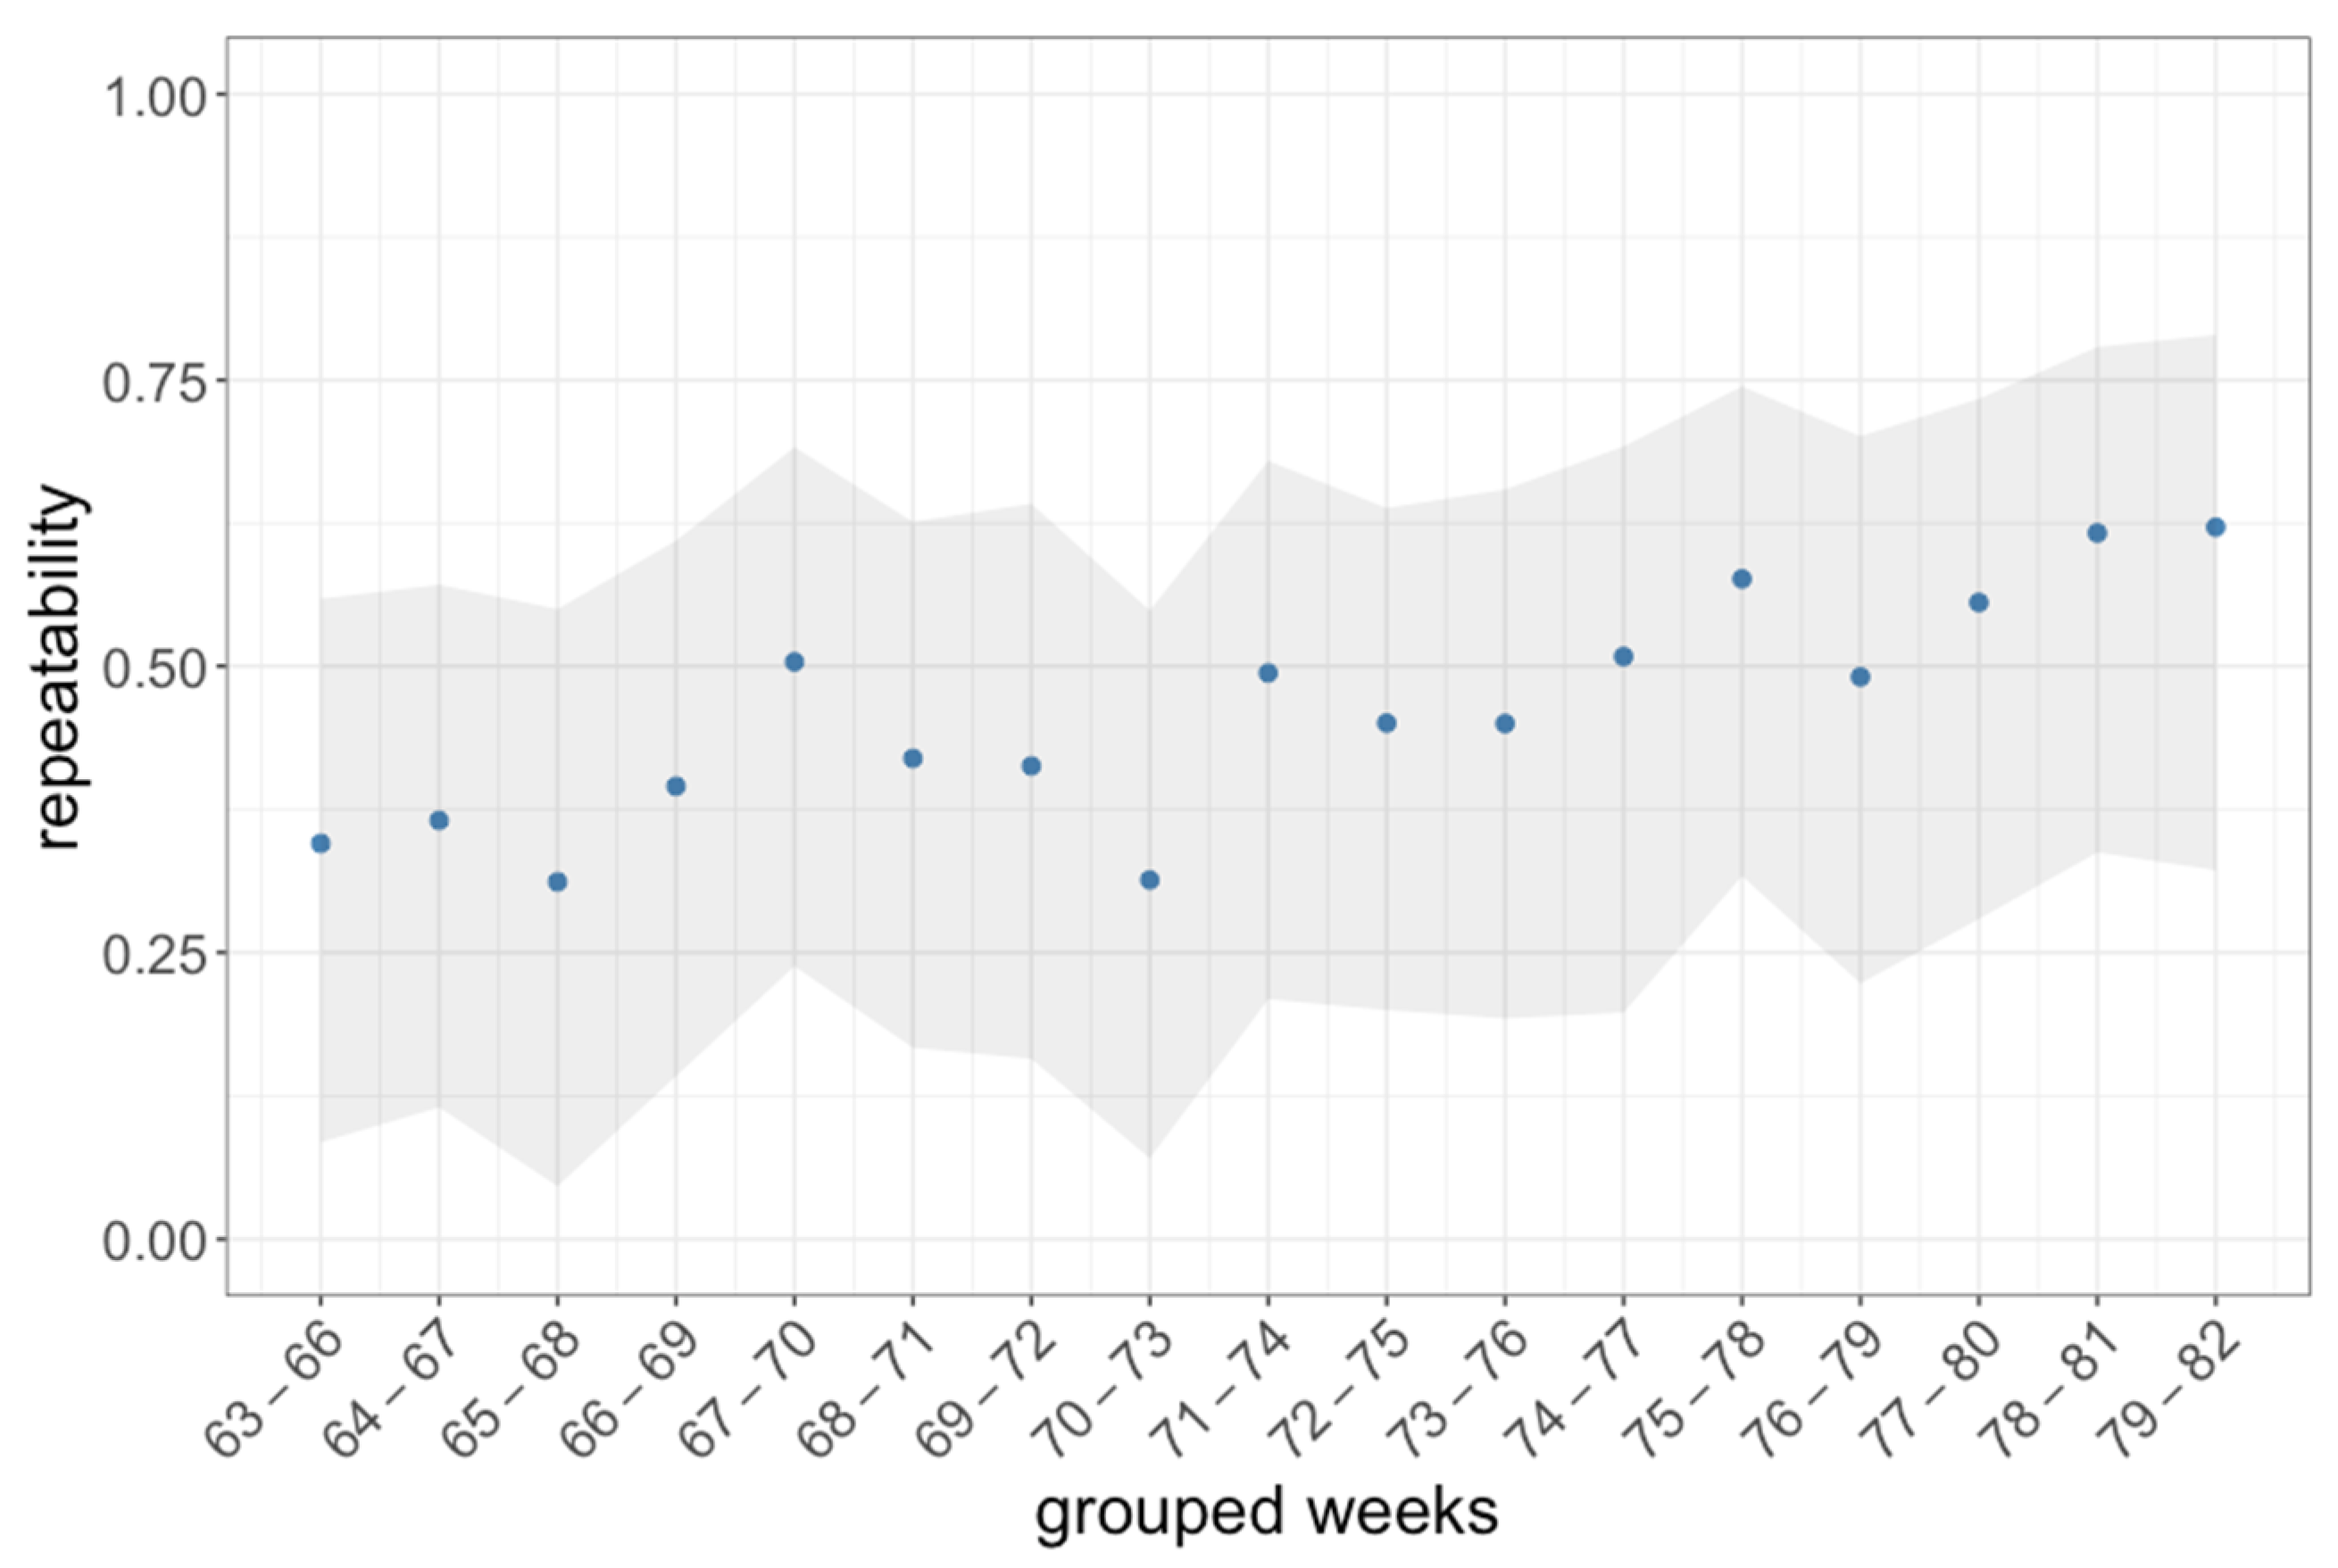
3.4. Correlation Analysis
4. Discussion
5. Conclusions
Author Contributions
Funding
Institutional Review Board Statement
Informed Consent Statement
Data Availability Statement
Acknowledgments
Conflicts of Interest
Appendix A

| Correlated Parameters | cRE (d578) | Weight (d502) | Weight (d510) | Weight (d565) | Weight (d578) | Weight Change (d434–d578) |
|---|---|---|---|---|---|---|
| cRE (d502) | −0.452 | |||||
| 0.0520 | ||||||
| cRE (d510) | −0.418 | |||||
| 0.0746 | ||||||
| cRE (d565) | −0.537 | |||||
| 0.0177 | ||||||
| metabolic rate | 0.0283 | 0.158 | ||||
| 0.9086 | 0.518 | |||||
| cRE (d578) | −0.45 | |||||
| 0.0535 | ||||||
| slope RE (d434–d578) | −0.647 | |||||
| 0.0027 |
References
- Lewejohann, L.; Schwabe, K.; Häger, C.; Jirkof, P. Impulse for animal welfare outside the experiment. Lab. Anim. 2020, 54, 150–158. [Google Scholar] [CrossRef]
- Sherwin, C. The motivation of group-housed laboratory mice, Mus musculus, for additional space. Anim. Behav. 2004, 67, 711–717. [Google Scholar] [CrossRef]
- Lopez, M.F.; Doremus-Fitzwater, T.L.; Becker, H.C. Chronic social isolation and chronic variable stress during early development induce later elevated ethanol intake in adult C57BL/6J mice. Alcohol 2011, 45, 355–364. [Google Scholar] [CrossRef] [PubMed] [Green Version]
- Huang, H.; Wang, L.; Cao, M.; Marshall, C.; Gao, J.; Xiao, N.; Hu, G.; Xiao, M. Isolation Housing Exacerbates Alzheimer’s Disease-Like Pathophysiology in Aged APP/PS1 Mice. Int. J. Neuropsychopharmacol. 2015, 18, 1–10. [Google Scholar] [CrossRef] [PubMed] [Green Version]
- Beery, A.K.; Holmes, M.M.; Lee, W.; Curley, J.P. Stress in groups: Lessons from non-traditional rodent species and housing models. Neurosci. Biobehav. Rev. 2020, 113, 354–372. [Google Scholar] [CrossRef] [PubMed]
- Dell’Omo, G.; Ricceri, L.; Wolfer, D.P.; Poletaeva, I.I.; Lipp, H.-P. Temporal and spatial adaptation to food restriction in mice under naturalistic conditions. Behav. Brain Res. 2000, 115, 1–8. [Google Scholar] [CrossRef]
- Vyssotski, A.L. Long-term monitoring of hippocampus-dependent behavior in naturalistic settings: Mutant mice lacking neurotrophin receptor TrkB in the forebrain show spatial learning but impaired behavioral flexibility. Hippocampus 2002, 12, 27–38. [Google Scholar] [CrossRef]
- Lewejohann, L.; Reefmann, N.; Widmann, P.; Ambrée, O.; Herring, A.; Keyvani, K.; Paulus, W.; Sachser, N. Transgenic Alzheimer mice in a semi-naturalistic environment: More plaques, yet not compromised in daily life. Behav. Brain Res. 2009, 201, 99–102. [Google Scholar] [CrossRef]
- Butler, R. Population size, social behaviour, and dispersal in house mice: A quantitative investigation. Anim. Behav. 1980, 28, 78–85. [Google Scholar] [CrossRef]
- Lewejohann, L.; Hoppmann, A.M.; Kegel, P.; Kritzler, M.; Krüger, A.; Sachser, N. Behavioral phenotyping of a murine model of Alzheimer’s disease in a seminaturalistic environment using RFID tracking. Behav. Res. Methods 2009, 41, 850–856. [Google Scholar] [CrossRef]
- Lewejohann, L.; Zipser, B.; Sachser, N. “Personality” in Laboratory Mice Used for Biomedical Research: A Way of Understanding Variability? Dev. Psychobiol. 2011, 53, 624–630. [Google Scholar] [CrossRef]
- Brust, V.; Schindler, P.M.; Lewejohann, L. Lifetime development of behavioural phenotype in the house mouse (Mus musculus). Front. Zoo. 2015, 12, S17. [Google Scholar] [CrossRef] [Green Version]
- Freund, J.; Brandmaier, A.M.; Lewejohann, L.; Kirste, I.; Kritzler, M.; Krüger, A.; Sachser, N.; Lindenberger, U.; Kempermann, G. Emergence of Individuality in Genetically Identical Mice. Science 2013, 340, 756–759. [Google Scholar] [CrossRef] [Green Version]
- Freund, J.; Brandmaier, A.; Lewejohann, L.; Kirste, I.; Kritzler, M.; Krüger, A.; Sachser, N.; Lindenberger, U.; Kempermann, G. Association between exploratory activity and social individuality in genetically identical mice living in the same enriched environment. Neuroscience 2015, 309, 140–152. [Google Scholar] [CrossRef] [Green Version]
- Kritzler, M.; Lewejohann, L.; Krueger, A.; Raubal, M.; Sachser, N. An RFID-based Tracking System for Laboratory Mice in a Semi Natural Environment. In PTA2006 Workshop, PERVASIVE—Pervasive Technology Applied Real-World Experiences with RFID and Sensor Networks; Schmidt, A., Spiekermann, S., Gershman, A., Michahelles, F., Eds.; PTA: Dublin, Ireland, 2006. [Google Scholar]
- Wolfer, D.P.; Litvin, O.; Morf, S.; Nitsch, R.M.; Lipp, H.-P.; Würbel, H. Cage enrichment and mouse behaviour. Nat. Cell Biol. 2004, 432, 821–822. [Google Scholar] [CrossRef]
- Kritzler, M.; Lewejohann, L.; Krüger, A. Analysing movement and behavioural patterns of laboratory mice in a semi natural environment based on data collected via RFID-technology. In Workshop on Behaviour Monitoring and Interpretation; Gottfried, B., Ed.; BMI: Osnabrück, Germany, 2007. [Google Scholar]
- Friard, O.; Gamba, M. BORIS: A free, versatile open-source event-logging software for video/audio coding and live observations. Methods Ecol. Evol. 2016, 7, 1325–1330. [Google Scholar] [CrossRef]
- Nickerson, D.M.; Facey, D.E.; Grossman, G.D. Estimating Physiological Thresholds with Continuous Two-Phase Regression. Physiol. Zoo. 1989, 62, 866–887. [Google Scholar] [CrossRef] [Green Version]
- Lewejohann, L.; Reinhard, C.; Schrewe, A.; Brandewiede, J.; Haemisch, A.; Görtz, N.; Schachner, M.; Sachser, N. Environmental bias? Effects of housing conditions, laboratory environment and experimenter on behavioral tests. Genes Brain Behav. 2005, 5, 64–72. [Google Scholar] [CrossRef]
- Bailoo, J.D.; Murphy, E.; Boada-Saña, M.; Varholick, J.; Hintze, S.; Baussière, C.; Hahn, K.C.; Göpfert, C.; Palme, R.; Voelkl, B.; et al. Effects of Cage Enrichment on Behavior, Welfare and Outcome Variability in Female Mice. Front. Behav. Neurosci. 2018, 12, 232. [Google Scholar] [CrossRef] [PubMed]
- Bates, D.; Mächler, M.; Bolker, B.M.; Walker, S.C. Fitting linear mixed-effects models using lme4. J. Stat. Softw. 2015, 67, 1. [Google Scholar] [CrossRef]
- Fahlström, A.; Yu, Q.; Ulfhake, B. Behavioral changes in aging female C57BL/6 mice. Neurobiol. Aging 2011, 32, 1868–1880. [Google Scholar] [CrossRef]
- Lewejohann, L.; Skryabin, B.; Sachser, N.; Prehn, C.; Heiduschka, P.; Thanos, S.; Jordan, U.; Dell’Omo, G.; Vyssotski, A.; Pleskacheva, M.; et al. Role of a neuronal small non-messenger RNA: Behavioural alterations in BC1 RNA-deleted mice. Behav. Brain Res. 2004, 154, 273–289. [Google Scholar] [CrossRef] [Green Version]
- König, C.; Plank, A.-C.; Kapp, A.; Timotius, I.K.; von Hörsten, S.; Zimmermann, K. Thirty Mouse Strain Survey of Voluntary Physical Activity and Energy Expenditure: Influence of Strain, Sex and Day–Night Variation. Front. Neurosci. 2020, 14, 531. [Google Scholar] [CrossRef]
- Van Loo, P.L.; Mol, J.A.; Koolhaas, J.M.; Van Zutphen, B.F.; Baumans, V. Modulation of aggression in male mice: Influence of group size and cage size. Physiol. Behav. 2001, 72, 675–683. [Google Scholar] [CrossRef] [Green Version]
- Buhot-Averseng, M.; Goyens, J. Effects of cohabitation with another female on aggressive behaviour in pregnant mice. Aggress. Behav. 1981, 7, 111–121. [Google Scholar] [CrossRef]
- Wolff, R.J. Solitary and social play in wild Mus musculus (Mammalia). J. Zool. 1981, 195, 405–412. [Google Scholar] [CrossRef]
- Poole, T.B.; Fish, J. An investigation of playful behaviour in Rattus norvegicus and Mus musculus (Mammalia). J. Zool. 1975, 175, 61–71. [Google Scholar] [CrossRef]
- Marashi, V.; Barnekow, A.; Ossendorf, E.; Sachser, N. Effects of different forms of environmental enrichment on behavioral, endocrinological, and immunological parameters in male mice. Horm. Behav. 2003, 43, 281–292. [Google Scholar] [CrossRef]
- Ahloy-Dallaire, J.; Espinosa, J.; Mason, G. Play and optimal welfare: Does play indicate the presence of positive affective states? Behav. Process. 2018, 156, 3–15. [Google Scholar] [CrossRef] [PubMed]
- Jirkof, P.; Rudeck, J.; Lewejohann, L. Assessing Affective State in Laboratory Rodents to Promote Animal Welfare—What Is the Progress in Applied Refinement Research? Animals 2019, 9, 1026. [Google Scholar] [CrossRef] [PubMed] [Green Version]
- Konarzewski, M.; Diamond, J. Evolution of Basal Metabolic Rate and Organ Masses in Laboratory Mice. Evolution 1995, 49, 1239. [Google Scholar] [CrossRef] [PubMed] [Green Version]
- Williams, T.D.; Chambers, J.; Henderson, R.P.; Rashotte, M.E.; Overton, J.M. Cardiovascular responses to caloric restriction and thermoneutrality in C57BL/6J mice. Am. J. Physiol. Integr. Comp. Physiol. 2002, 282, R1459–R1467. [Google Scholar] [CrossRef] [PubMed] [Green Version]
- Schefer, V.; Talan, M.I. Oxygen consumption in adult and aged C57BL/6J mice during acute treadmill exercise of different intensity. Exp. Gerontol. 1996, 31, 387–392. [Google Scholar] [CrossRef]
- Mount, L.E.; Willmott, J.V. The relation between spontaneous activity, metabolic rate and the 24 h cycle in mice at different environmental temperatures. J. Physiol. 1967, 190, 371–380. [Google Scholar] [CrossRef] [PubMed] [Green Version]
- Gordon, C.J. The mouse thermoregulatory system: Its impact on translating biomedical data to humans. Physiol. Behav. 2017, 179, 55–66. [Google Scholar] [CrossRef]
- Cordeira, J.; Monahan, D. Voluntary wheel running reduces weight gain in mice by decreasing high-fat food consumption. Physiol. Behav. 2019, 207, 1–6. [Google Scholar] [CrossRef]
- Swallow, J.G.; Koteja, P.; Carter, P.A.; Garland, T. Artificial selection for increased wheel-running activity in house mice results in decreased body mass at maturity. J. Exp. Biol. 1999, 202, 2513–2520. [Google Scholar] [CrossRef]
- Tokuyama, K.; Saito, M.; Okuda, H. Effects of wheel running on food intake and weight gain of male and female rats. Physiol. Behav. 1982, 28, 899–903. [Google Scholar] [CrossRef]
- Kappel, S.; Hawkins, P.; Mendl, M.T. To Group or Not to Group? Good Practice for Housing Male Laboratory Mice. Animals 2017, 7, 88. [Google Scholar] [CrossRef] [Green Version]
- Voikar, V.; Gaburro, S. Three Pillars of Automated Home-Cage Phenotyping of Mice: Novel Findings, Refinement, and Reproducibility Based on Literature and Experience. Front. Behav. Neurosci. 2020, 14, 575434. [Google Scholar] [CrossRef]
- Richter, S.H. Automated Home-Cage Testing as a Tool to Improve Reproducibility of Behavioral Research? Front. Neurosci. 2020, 14, 383. [Google Scholar] [CrossRef]


| Source of Data | Sex of Animals | RMR in mL min−1 kg−1 | CV in % |
|---|---|---|---|
| this article | f | 40.5 ± 3.3 | 8.1 |
| M. Konarzewski and J. Diamond, 1995 | f | 21.6 ± 1.7 | 7.9 |
| T. D. Williams et al., 2002 | f | 77.0 ± 6.3 | 15.4 |
| V. Schefer and M. I. Talan, 1996 | m | 87.0 ± 4 | 4.6 |
Publisher’s Note: MDPI stays neutral with regard to jurisdictional claims in published maps and institutional affiliations. |
© 2021 by the authors. Licensee MDPI, Basel, Switzerland. This article is an open access article distributed under the terms and conditions of the Creative Commons Attribution (CC BY) license (https://creativecommons.org/licenses/by/4.0/).
Share and Cite
Mieske, P.; Diederich, K.; Lewejohann, L. Roaming in a Land of Milk and Honey: Life Trajectories and Metabolic Rate of Female Inbred Mice Living in a Semi Naturalistic Environment. Animals 2021, 11, 3002. https://doi.org/10.3390/ani11103002
Mieske P, Diederich K, Lewejohann L. Roaming in a Land of Milk and Honey: Life Trajectories and Metabolic Rate of Female Inbred Mice Living in a Semi Naturalistic Environment. Animals. 2021; 11(10):3002. https://doi.org/10.3390/ani11103002
Chicago/Turabian StyleMieske, Paul, Kai Diederich, and Lars Lewejohann. 2021. "Roaming in a Land of Milk and Honey: Life Trajectories and Metabolic Rate of Female Inbred Mice Living in a Semi Naturalistic Environment" Animals 11, no. 10: 3002. https://doi.org/10.3390/ani11103002
APA StyleMieske, P., Diederich, K., & Lewejohann, L. (2021). Roaming in a Land of Milk and Honey: Life Trajectories and Metabolic Rate of Female Inbred Mice Living in a Semi Naturalistic Environment. Animals, 11(10), 3002. https://doi.org/10.3390/ani11103002