Article

Association between Single Nucleotide Polymorphisms in SIRT1 and SIRT2 Loci and Growth in Tibetan Sheep

1
State Key Laboratory of Plateau Ecology and Agriculture, Qinghai University, Xining 810016, Qinghai, China
2
National Beef Cattle Improvement Center, Northwest A&F University, Yangling 712100, Shaanxi, China
3
School of Animal Dairy and Veterinary Sciences, Utah State University, Logan, UT 84322, USA
4
Animal Husbandry and Animal Wealth Development Department, Faculty of Veterinary Medicine, Damanhour University, Damanhour 22511, Egypt
5
School of Agriculture, Ningxia University, Yinchuan 750021, China
*
Author to whom correspondence should be addressed.
These authors contributed equally to this work.
Animals 2020, 10(8), 1362; https://doi.org/10.3390/ani10081362
Submission received: 14 July 2020 / Accepted: 5 August 2020 / Published: 6 August 2020

Abstract

:

Simple Summary

In summary, three single nucleotide polymorphisms (SNPs) were observed including two SNPs (g.3148 C > T and g.3570 G > A) in SIRT1, and one SNP (g.8074 T > A) in SIRT2 through sequence analysis. Association analyses suggested that all three SNPs were associated growth-related traits in Tibetan sheep. These findings imply that both SIRT1 and SIRT2 may play an important role in growth traits and are potential biomarkers for Marker-assisted selection (MAS).

Abstract

Silent information regulator 1 and 2 (SIRT1, 2) were NAD+-dependent histone or non-histone deacetylase, which emerged as key metabolic sensors in several tissues of mammals. In the present study, the search for polymorphisms within the ovine SIRT1 and SIRT2 loci as well as association analyses between SNPs and growth-related traits were performed in Tibetan sheep. To determine the expression pattern of SIRT1 and SIRT2 genes in Tibetan sheep, the quantitative real-time polymerase chain reaction (qPCR) analysis revealed that those two genes were widely expressed in diverse tissues. Expression of SIRT1 was less in abomasum of lamb, whereas it was greater in duodenum within adult stage. In the case of SIRT2, the greatest expression was observed in reticulum (lamb) and in muscle (adult), whereas the least expression was in liver for lamb and in kidney for adult animals. The association analysis demonstrated that g.3148 C > T polymorphism of SIRT1 affected heart girth (p = 0.002). The g.8074 T > A SNP of SIRT2 had a significant correlation with body weight (p = 0.011) and body length (p = 0.008). These findings suggested that the SIRT1 and SIRT2 polymorphism was involved in growth-related traits in Tibetan sheep, which may be considered to be genetic markers for improving the growth traits of Tibetan sheep.

1. Introduction

The silent information regulators (SIRTs) family, belonging to the nicotinamide adenine dinucleotide (NAD)-dependent deacetylases, was divided into four classes in mammals [1]. Among these, SIRT1 and SIRT2 were known as class I in sirtuin family, which exerted diverse influence on lifespan, insulin resistance, and metabolism [2].
Mammalian SIRT1 localized in the nucleus was in agreement with its effect on histone deacetylase [3]. In the arcuate nucleus of mouse, overexpressing SIRT1 stimulated energy expenditure by improving leptin sensitivity in adipose tissue, and suppressed food intake, which prevented age-associated weight gain [4]. In response to high-fat diet, accelerated adiposity, exacerbated insulin resistance, and severe brown adipose tissue degeneration phenotype were displayed in SIRT1+/−mice. This was likely to occur via down-regulation of thermogenic genes expression (i.e., UCP 1 and PPAR γ) [5]. Compared with SIRT1, SIRT2 was localized mainly in the cytoplasm [6]. Inhibition of endogenous SIRT2 resulted in amelioration of insulin sensitivity in C2C12 cells [7]. By regulation of phosphoenolpyruvate carboxykinase 1 (GTP 1) and glutaminase (PAG), SIRT2 was involved in mitochondrial metabolism, leading to impairment of energy metabolism in hepatocellular carcinoma cells [8]. Knockdown of SIRT2 contributed to liver insulin resistance in mice, and increased food intake in response to high-fat diet [9]. Besides, SIRT2−/−mice showed mitochondrial depletion, which caused redox dyshomeostasis and energy failure, suggesting SIRT2 acted as a mediator of metabolic regulation [10]. Both SIRT1 and SIRT2 focused on their function of regulated energy homeostasis [11]. However, there were no reports on associations between those genes and growth traits in Tibetan sheep. This paper aimed to explore the role of SIRT1 and SIRT2 in Tibetan sheep by analyzing association between single nucleotide polymorphisms (SNPs) and growth traits.

2. Materials and Methods

Thirteen tissues of Tibetan sheep were collected from three adult individuals of 1-year-old and three 7-days-old lambs, respectively. All samples were purchased from the Institute of Animal Husbandry and Veterinary Medicine, Haibei state, Qinghai province, China. All animal procedures for experiments were approved by Committee of Experimental Animal Management (EAMC) at Qinghai University, in accordance with the code EAMC/20-556. Moreover, the use of experimental animals was carried out in accordance to the rules and guidelines of the organization and government.
Total RNA was extracted, and reverse transcribed by a Total RNA kit and PrimeScriptTM RT Reagent Kit (TaKaRa, Dalian, China), respectively. The relative expression level of SIRT1 (NC_040276.1) and SIRT2 (NC_040265.1) was calculated using Applied Biosystems 7500 Fast Real-Time PCR System (Applied Biosystems, Foster City, CA, USA) with the 2−△△Ct method. The results of qPCR were normalized by the expression of β-actin (NM_001009784.3) and GAPDH (NM_001190390.1). Relative mRNA expression level was presented as mean ± SD (n = 3).
The investigated ewe with a total of 402 ewes (12 months age, averagely) collected from the demonstration area of ecological animal husbandry (Haiyan county, Qinghai Province, China). Individuals were raised on a diet of corn and corn silage, according to nutrient requirements of growing sheep (NRC, 2012). All ewes were offered oat hay ad libitum in management process under the same ratio of roughage to concentrate (7:3) and similar rearing environment, such as similar temperature, altitude, humidity, etc.
Synchronously, body weight, withers height, heart girth, and body length were recorded. The Omgam Blood DNA Kit (Omgam Bio-Tek, Doraville, GA, USA) was utilized to isolate genomic DNA from whole blood samples. On the basis of the sequence of the ovine SIRT1 (NC_040276.1) and SIRT2 (NC_040265.1), PCR primers were designed via Primer Premier Software (Version 4.0). Detailed information of primers was depicted in Table 1. PCR amplification was performed according to the procedure of Sun et al. [12], and then sequenced using an ABI 3730 sequencer (ABI, Foster City, CA, USA).
Gene frequencies, Hardy-Weinberg equilibrium (HWE), and polymorphism information content (PIC) were computed using POPGENE software (Version 3.0). Linkage disequilibrium (LD) and haplotype construction were calculated using the web-based tool (http://analysis.bio-x.cn/).
Statistical analysis was conducted by SPSS 20.0 (IBM Company, New York, NY, USA). The general linear model (GLM) was used to analyze the association between SNPs and growth traits in Tibetan sheep. The basic linear model was: Yij = µ + Gi + Aj + eij, Gi was the fixed effect of genotype, Aj was the fixed effect of age, and eij was the random error.
For a more detailed review of the results, we corrected the p values by Bonferroni correction, which uses a modified criterion for significance (a/k, where a = 0.05, and k is the overall number of independent statistical tests conducted on the given data). For SIRT1, we analyzed four traits and two different SNPs, resulting in an adjusted p-value of 0.00625 for the 5% significance threshold. For SIRT2, we analyzed four traits and one SNP, resulting in an adjusted p-value of 0.0125 for the 5% significance threshold.

3. Results

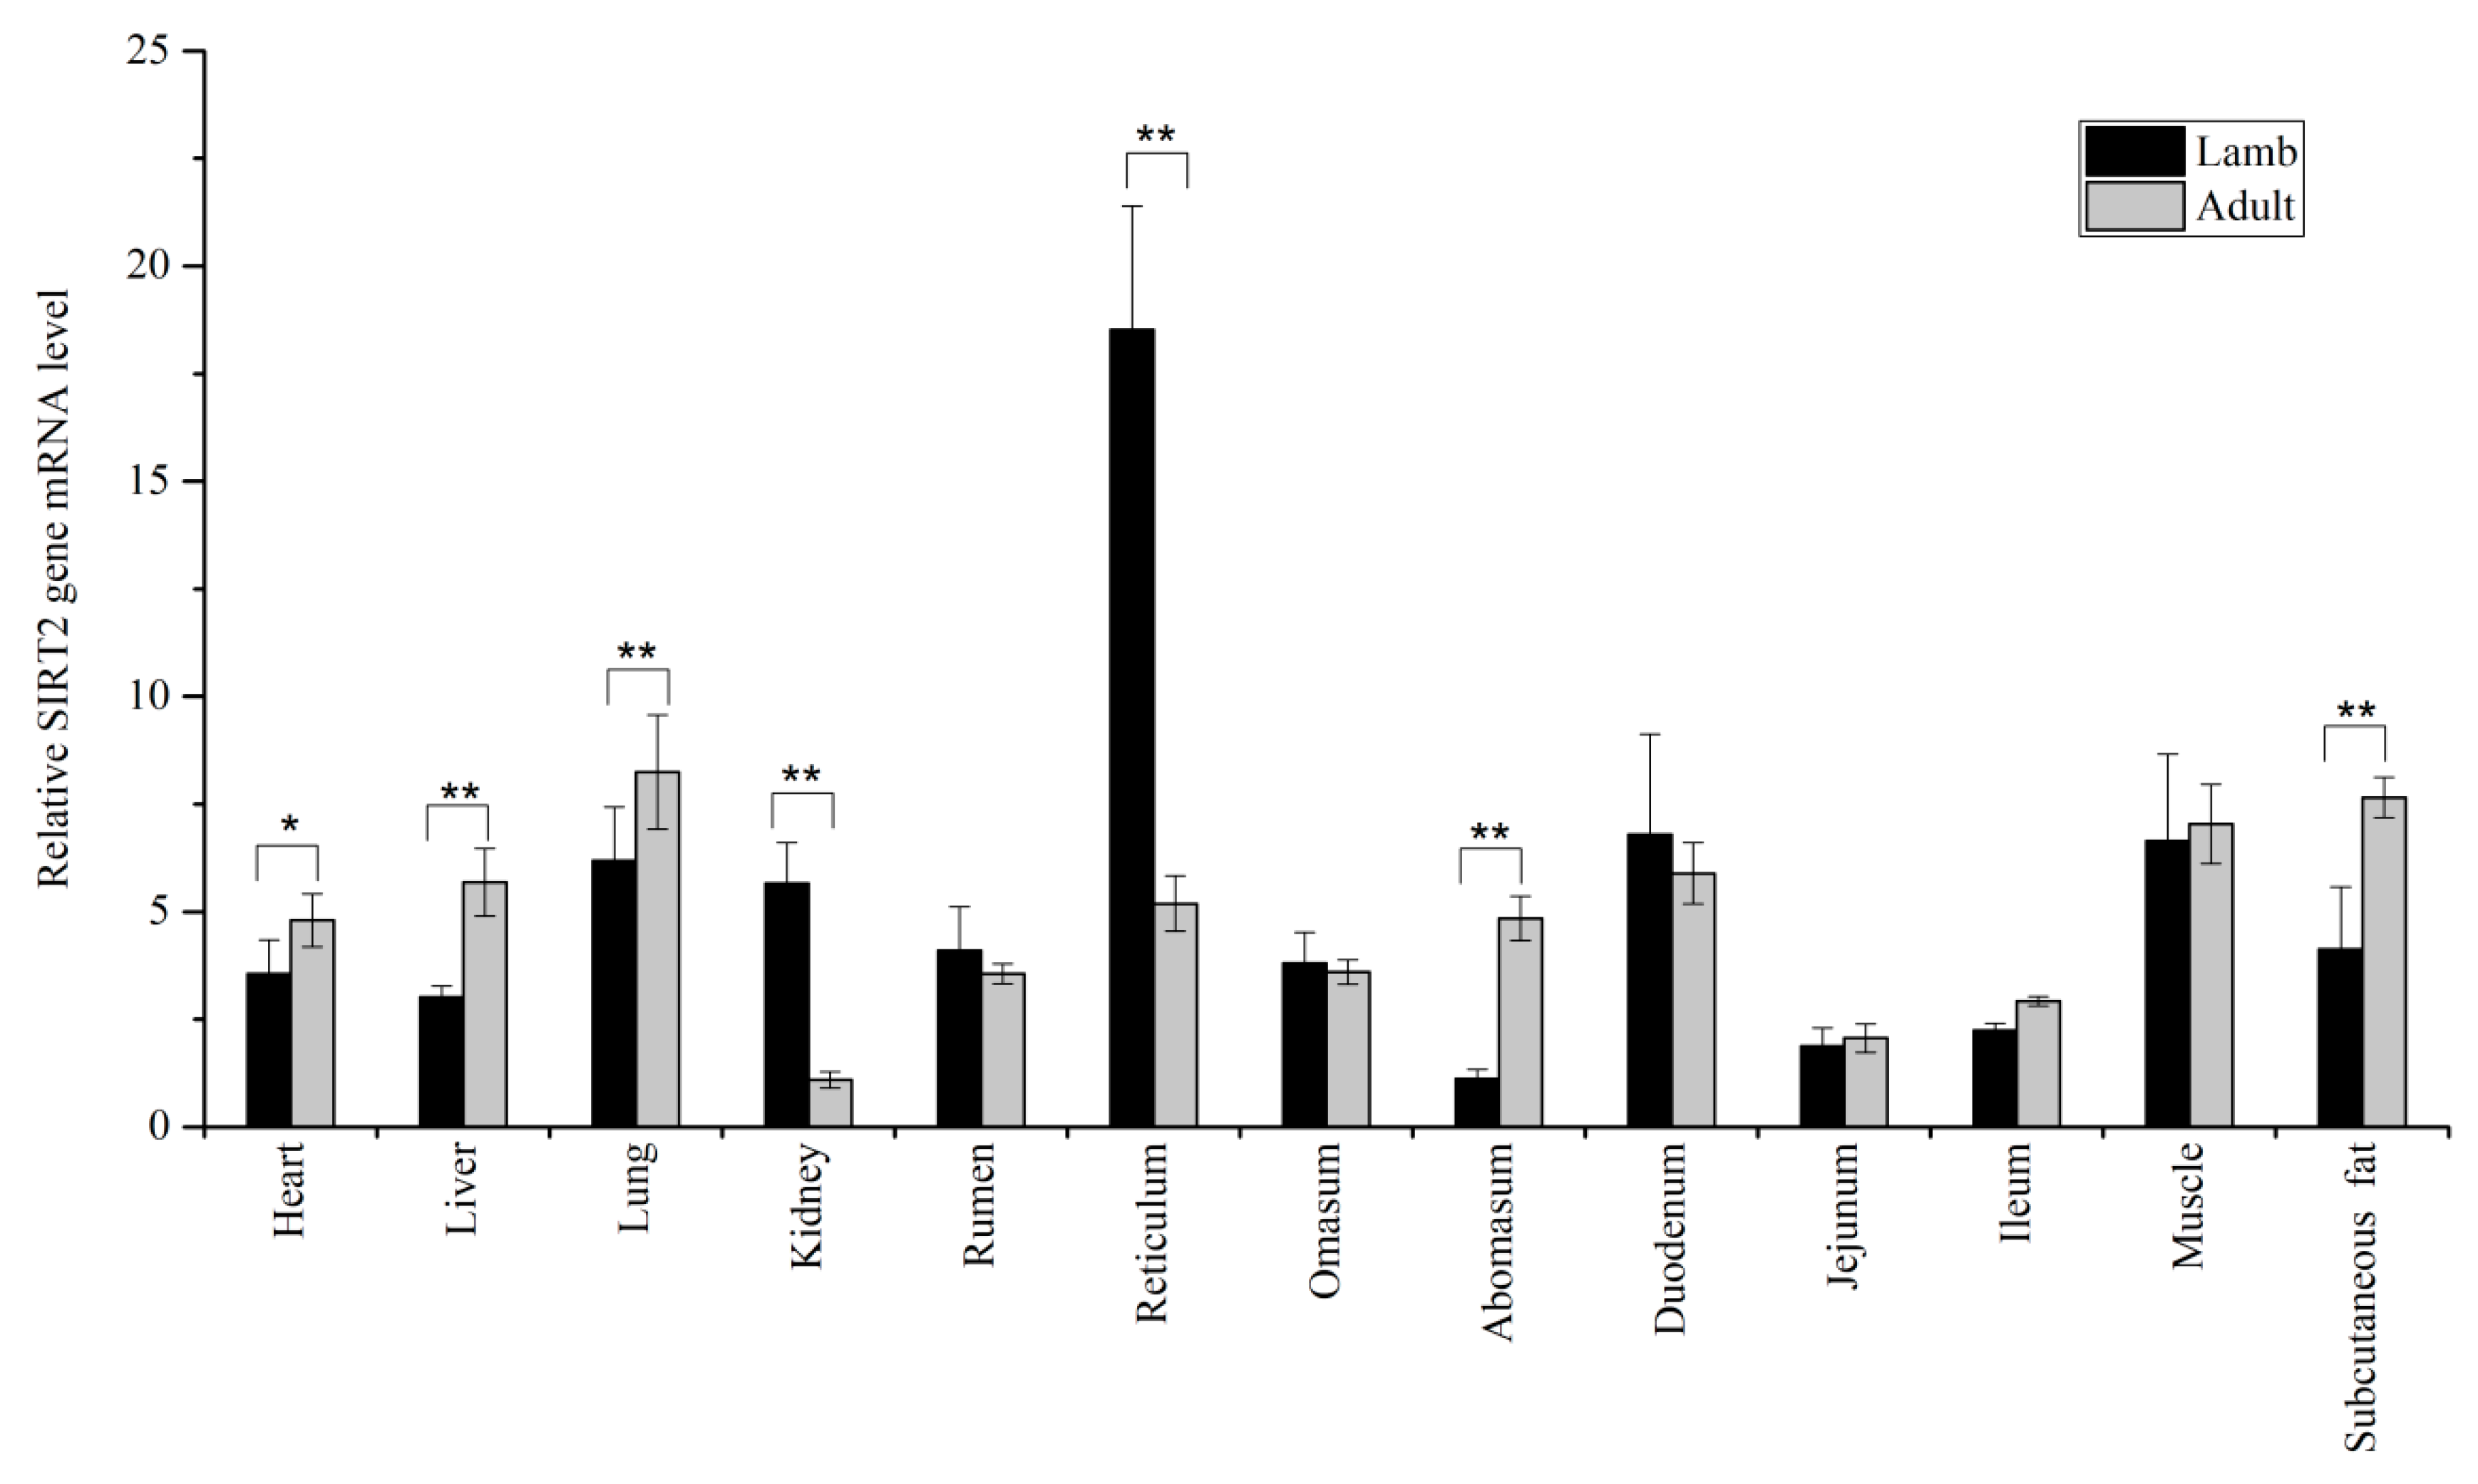
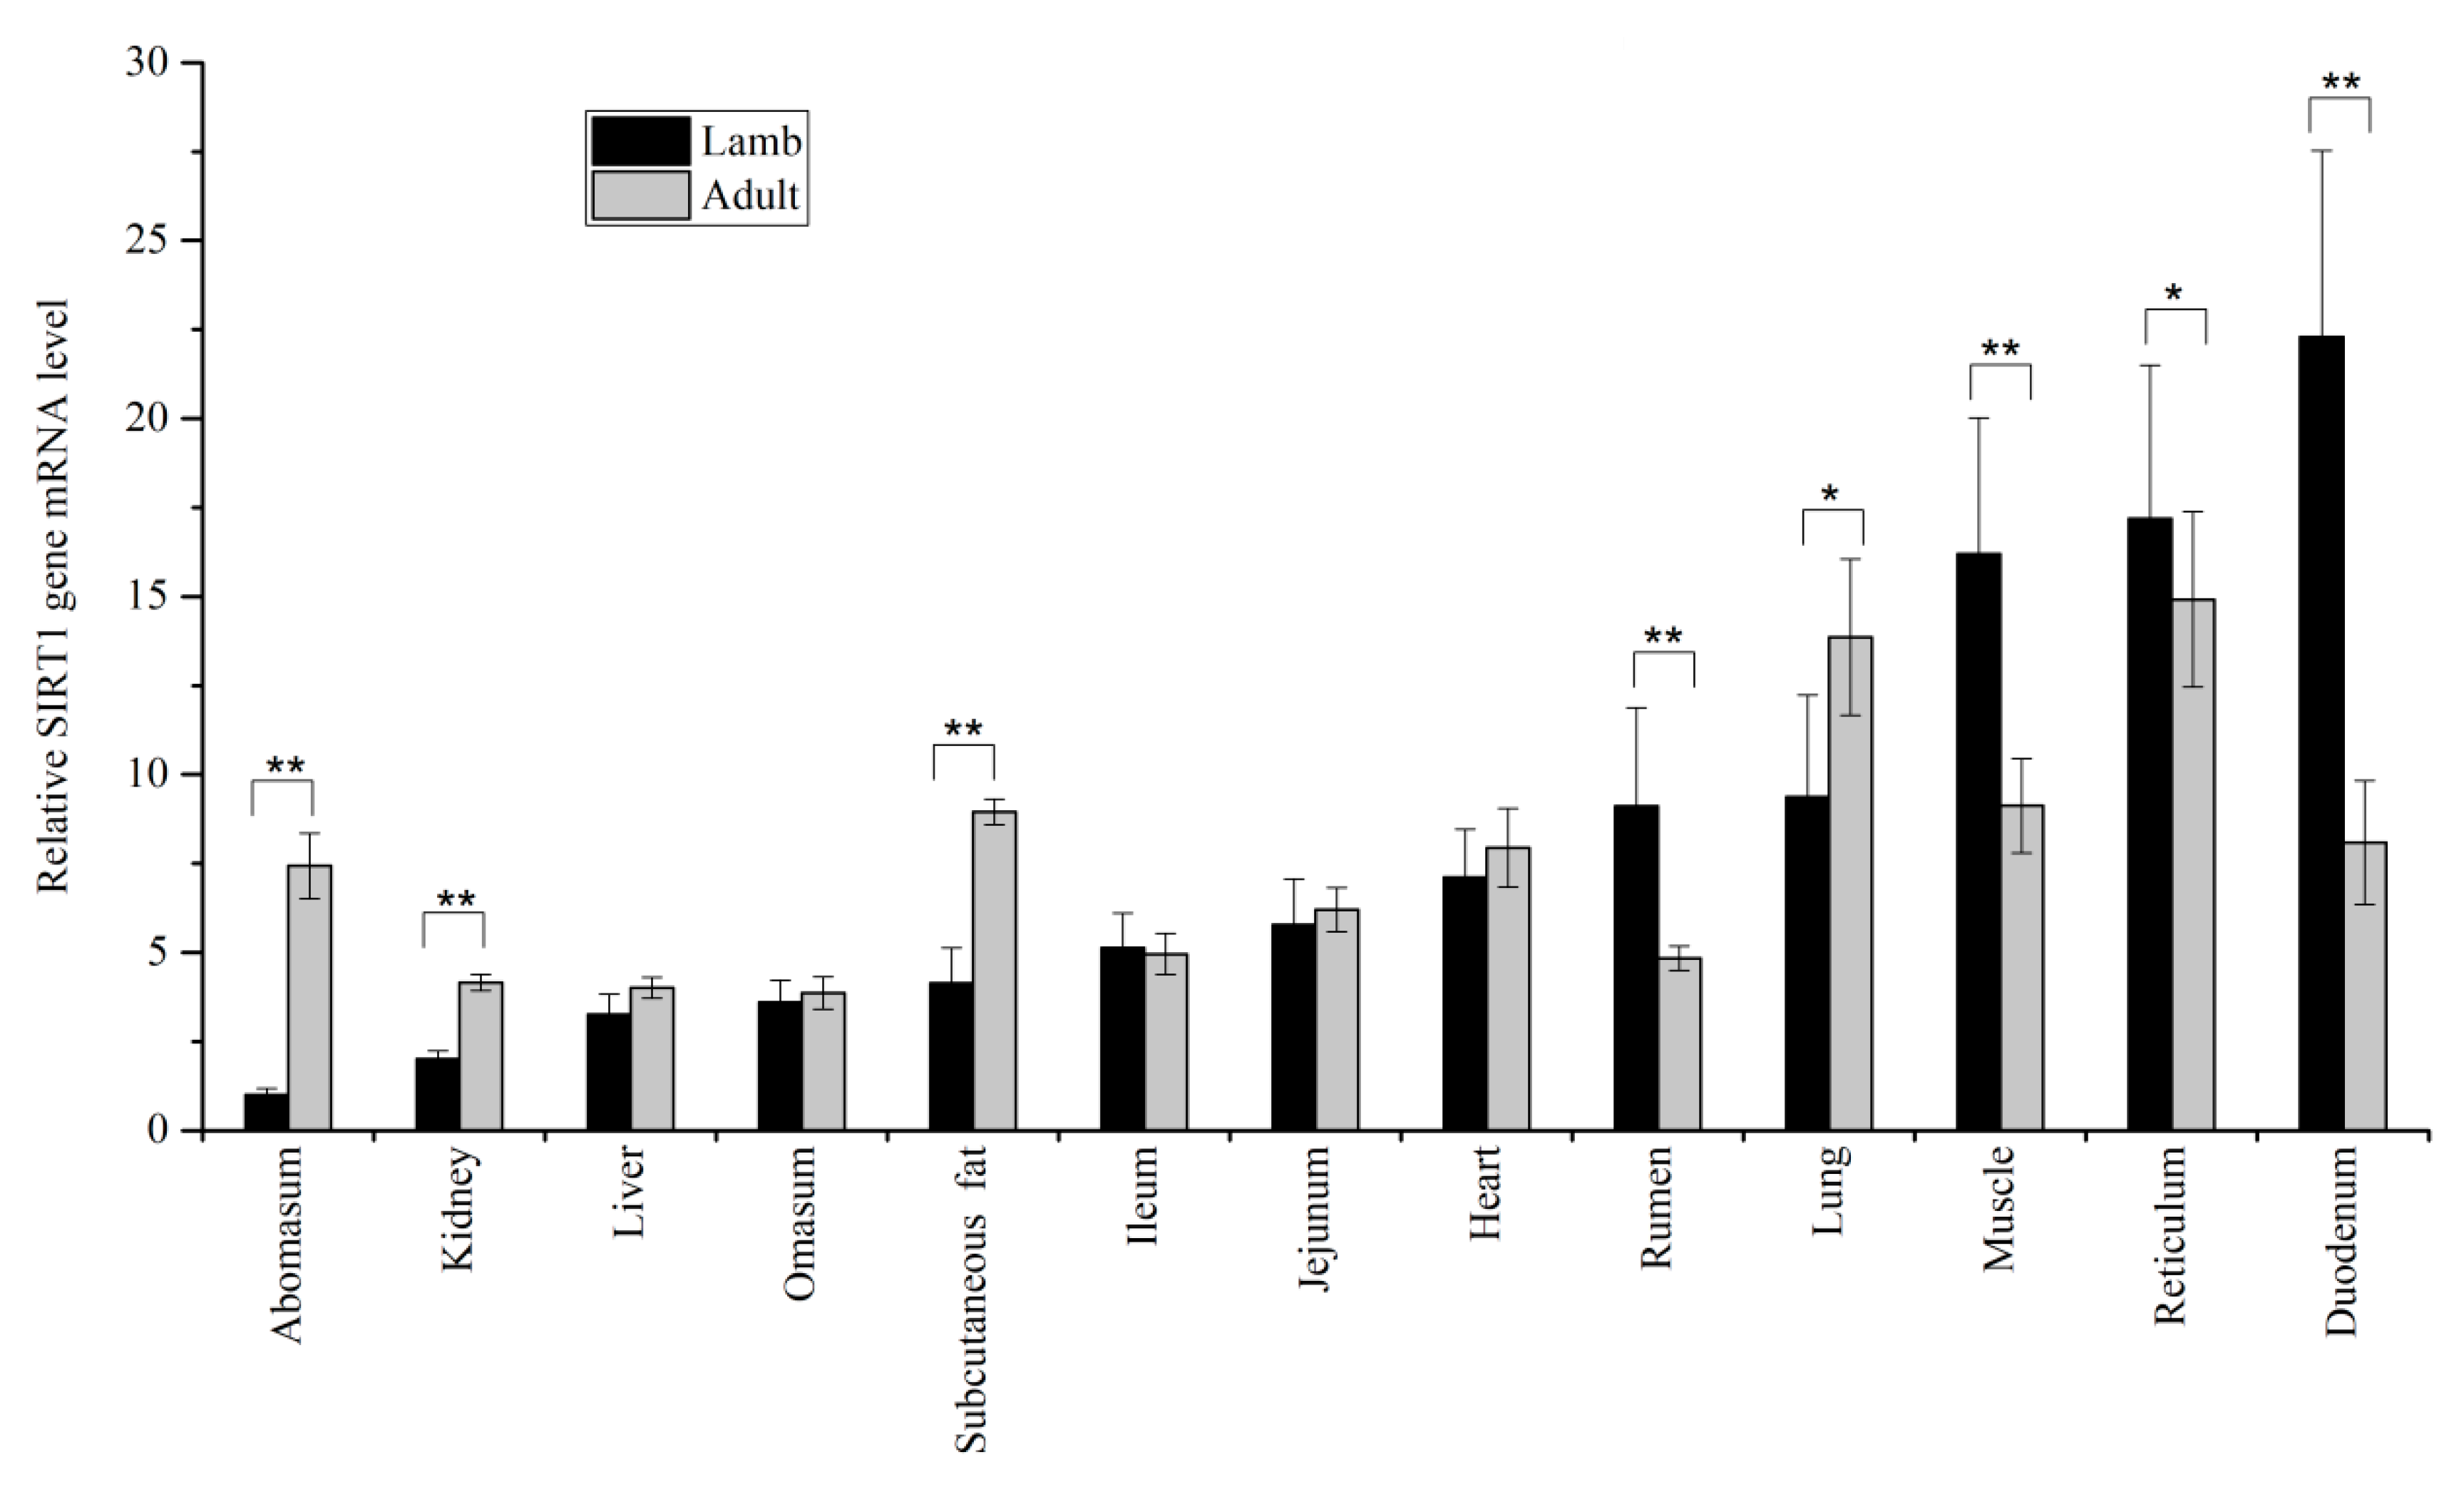
3.1. Expression Levels of SIRT1 and SIRT2 in Tissues

The result showed the mRNA level of SIRT1 and SIRT2 in thirteen different tissues with within two different age stages. The results presented in Figure 1 demonstrated ovine SIRT1 was primarily expressed in diverse tissues. Remarkably higher mRNA expression was detected in the abomasum (p < 0.01), kidney (p < 0.01), subcutaneous fat (p < 0.01), and lung (p < 0.05) as compared with adult ewes, whereas the opposite result was found in the rumen (p < 0.01), muscle (p < 0.01), reticulum (p < 0.05), and duodenum (p < 0.01). As showed in Figure 2, when comparing expression of SIRT2 of adult ewes against lamb, the expression of SIRT2 in kidney and reticulum was greater in lambs than in adult ewes (p < 0.01). In the heart (p < 0.05), liver (p < 0.05), lung (p < 0.01), subcutaneous fat (p < 0.01), and abomasum (p < 0.01), it was greater in adult ewes than in lambs.

3.2. Polymorphisms and Genetic Diversity

The PCR amplified fragments were directly sequenced. A total of three SNPs were revealed, including two polymorphic loci (g.3148C > T and g.3570 G > A) within SIRT1 intron 2 and 3, respectively, and one polymorphic locus (g.8074 T > A) was detected in the exon 7 of SIRT2.
As displayed in Table 2, the predominant frequencies of alleles were C of g.3148 C > T, G of g.3570 G > A, and T of g.8074 T > A. According to the results of χ2 test, the genotypes of three SNPs were consistent with HWE (p > 0.05). In addition, the PIC values of g.3148 C > T and g.3570 G > A were 0.30 and 0.26, respectively, indicating medium genetic diversity in SIRT1 loci. Whereas, g.8074 T > A locus in SIRT2 exhibited low genetic diversity.

3.3. LD Analysis

To analyze the linkage relationships between the g.3148 C > T and g.3570 G > A, LD value was estimated. The r2 value was 0.005 (<0.33), indicating weak linkage between the two loci in SIRT1. As was presented in Table 3, four estimated haplotypes were detected as the prominent haplotypes in the Tibetan sheep populations. The frequency of Hap2 haplotype (-CG-) was 62.20%, followed by Hap4 haplotype (-TG-), Hap1 haplotype (-CA-), and Hap3 haplotype (-TA-), with 18.6, 13.30, and 5.90%, respectively.

3.4. Association Analysis

Table 4 illustrated the association results between the identified SNPs in SIRT1/2 and growth traits. Compared with animals with genotype TT, the role of CC and CT genotype at g.3148 C > T locus caused the highest average for heart girth (p = 0.002). At g.8074 T > A locus, individuals with the AA genotype tended to have larger body weight (p = 0.011) and body length (p = 0.008) than individuals with the TA and TT genotype. Multiple effects of the 2 SNPs of SIRT1 were evaluated, and a total of nine haplotype combinations were identified (data not shown). Combinations with frequencies lower than 5.0% were neglected and the remaining combinations were selected for further analysis. As presented in Table 5, when the combination results were compared, no significant differences were detected between the combined haplotype of these two SNPs of SIRT1 and growth traits in Tibetan sheep (p > 0.003).

4. Discussion

Tibetan sheep (Ovis aries), providing hides, meat, and milk for indigenous Tibetans [13], possessed hypoxia-tolerant and cold-resistant ability in harsh Tibetan plateau [14]. According to the biological function in energy metabolism, ovine SIRT1 and SIRT2 may exert a critical influence on regulation of growth traits in Tibetan sheep.
The qPCR results revealed that SIRT1 was primarily expressed, consistent with the researches of other species [15,16]. Specifically, the predominant expression of SIRT1 gene existed in abomasum, kidney, subcutaneous fat, and lung at adult stage, whereas it was greater in rumen, muscle, reticulum, and duodenum of lambs. The expression pattern of ovine SIRT1 significantly differed with what was reported from cattle [17]. This was because that bovine SIRT1 was more predominant in muscular tissue than in adipose tissue [18]. The difference in expression may be a result of the metabolic diversity among species. Similarly, SIRT2 was extensively expressed in different tissues in Tibetan sheep. Previous observations indicated that gene expression levels might, at least in part, parallel well with its corresponding function in mammal [19]. When comparing expression of SIRT2 within two diverse age stages, the SIRT2 expression level in liver, lung, abomasum, and subcutaneous fat were significantly increased with advancing age, implying SIRT2 exhibited crucial molecular function of adult more than lamb in those tissues.
In this study, the g.3148 C > T and g.3570 G > A were identified in the intron of SIRT1, which contributed to the genetic breeding of Tibetan sheep. Although the structure of the encoded protein was never changed, intronic SNPs maybe effected on metabolism of mRNA or assembly of spliceosome components [20], thereby reducing genetic mutation and maintaining the genetic stability. Several introns contained enhancers or cis-acting elements that promoted the initiation and extension of transcription, thus affecting gene expression levels [21]. Additionally, introns promoted the frequency of recombination between genes via increasing length of gene sequence [22]. In the current study, it is tempting to speculate that intronic SNPs with ovine SIRT1 may impact the biological function, resulting in an alteration in phenotype of mammal.
Previously, the g.2694 C > T and g.3801 T > C mapping on intronic SNPs of max dimerization protein 3 (MXD3) influenced on several growth traits in two Chinese indigenous beef cattle [23]. The intronic g.18341 C > T of the lipoprotein lipase (LPL) was significantly correlated with withers height and chest depth in Nanyang cattle [24].
Accumulating observations indicated that the SIRT2 was an excellent candidate gene involved in economic characters of ruminant. In Chinese Nanyang cattle, the g.17333 C > T and g.17578 A > G in SIRT2 significantly affected 18-months-old body weight [25]. The g.19676 G > A in the 3’UTR of SIRT2 was associated with an alteration in growth traits of Qinchuan cattle [26]. Additionally, a novel 7-bp indel of SIRT2 was corrected with the body length in Chinese Jiaxian cattle [27]. In the present study, a SNP (g.8074 T > A) of SIRT2 significantly influenced the growth-related traits in Tibetan sheep, which corresponded with the function in energy metabolism of SIRT2.

5. Conclusions

In summary, three SNPs were observed including two SNPs (g.3148 C > T and g.3570 G > A) in SIRT1, and one SNP (g.8074 T > A) in SIRT2 using DNA direct sequencing. Both g.3148 C > T and g.8074 T > A were associated growth-related traits in Tibetan sheep. These findings demonstrated that SIRT1 and SIRT2 might exert a crucial influence on growth traits. Further research should be conducted in a large population and different population before applying those genea to molecular marker-assisted selection.

Author Contributions

Conceptualization, L.-s.G., S.H.A.R., and L.Z.; data curation, L.-s.G., S.H.A.R., and J.J.; formal analysis, L.-s.G., S.H.A.R., S.H., and J.J.; funding acquisition, Z.W.; investigation, L.Z. and Z.W.; project administration, Z.W.; resources, L.Z.; software, D.W. and S.H.; supervision, Z.W.; validation, J.J.; visualization, Z.W.; writing—original draft, L.-s.G. and S.H.A.R.; writing—review and editing, M.G., A.H.A.E.-A., D.W., and S.H. All authors have read and agreed to the published version of the manuscript.

Funding

The research was supported by the Efficient Breeding Base and Industrialization Project of Black Tibetan Sheep in Guinan County (2020GN118), National Natural Science Foundation (31960649), and the Open Project of State Key Laboratory of Plateau Ecology and Agriculture, Qinghai University (2018-ZZ-8).

Acknowledgments

We would like to thank Sayed Haidar Abbas Raza for critical reading of the manuscript.

Conflicts of Interest

The authors declare no conflict of interest.

References

  1. Houtkooper, R.H.; Pirinen, E.; Auwerx, J. Sirtuins as regulators of metabolism and healthspan. Nat. Rev. Mol. Cell Biol. 2012, 13, 225–238. [Google Scholar] [CrossRef] [PubMed] [Green Version]
  2. Zhu, S.Q.; Dong, Z.; Ke, X.X.; Hou, J.B.; Zhao, E.H.; Zhang, K.; Wang, F.; Yang, L.Q.; Xiang, Z.H.; Cui, H.J. The roles of sirtuins family in cell metabolism during tumor development. Semin. Cancer Biol. 2019, 57, 59–71. [Google Scholar] [CrossRef] [PubMed]
  3. Wilking, M.J.; Singh, C.; Nihal, M.; Zhong, W.X.; Ahmad, N. SIRT1 deacetylase is overexpressed in human melanoma and its small molecule inhibition imparts anti-proliferative response via p53 activation. Arch. Biochem. Biophys. 2014, 563, 94–100. [Google Scholar] [CrossRef] [PubMed] [Green Version]
  4. Sasaki, T.; Kikuchi, O.; Shimpuku, M.; Susanti, V.Y.; Yokota-Hashimoto, H.; Taguchi, R.; Shibusawa, N.; Sato, T.; Tang, L.J.; Amano, K.; et al. Hypothalamic SIRT1 prevents age-associated weight gain by improving leptin sensitivity in mice. Diabetologia 2014, 57, 819–831. [Google Scholar] [CrossRef] [Green Version]
  5. Xu, F.; Zheng, X.B.; Lin, B.S.; Liang, H.; Cai, M.Y.; Cao, H.Y.; Ye, J.P.; Weng, J.P. Diet-Induced Obesity and Insulin Resistance are Associated with Brown Fat Degeneration in SIRT1-Deficient Mice. Obesity 2016, 24, 634–642. [Google Scholar] [CrossRef] [Green Version]
  6. Erburu, M.; Munoz-Cobo, I.; Dominguez-Andres, J.; Beltran, E.; Suzuki, T.; Mai, A.; Valente, S.; Puerta, E.; Tordera, R.M. Chronic stress and antidepressant induced changes in Hdac5 and Sirt2 affect synaptic plasticity. Eur. Neuropsychopharmacol. 2015, 25, 2036–2048. [Google Scholar] [CrossRef] [PubMed]
  7. Arora, A.; Dey, C.S. SIRT2 negatively regulates insulin resistance in C2C12 skeletal muscle cells. Biochim. Biophys. Acta Mol. Basis Dis. 2014, 1842, 1372–1378. [Google Scholar] [CrossRef] [Green Version]
  8. Huang, S.; Zhao, Z.G.; Tang, D.H.; Zhou, Q.; Li, Y.; Zhou, L.X.; Yin, Y.Y.; Wang, Y.M.; Pan, Y.D.; Dorfman, R.G.; et al. Downregulation of SIRT2 Inhibits Invasion of Hepatocellular Carcinoma by Inhibiting Energy Metabolism. Transl. Oncol. 2017, 10, 917–927. [Google Scholar] [CrossRef]
  9. Lantier, L.; Williams, A.S.; Hughey, C.C.; Bracy, D.P.; James, F.D.; Ansari, M.A.; Gius, D.; Wasserman, D.H. SIRT2 knockout exacerbates insulin resistance in high fat-fed mice. PLoS ONE 2018, 13, e0208634. [Google Scholar] [CrossRef]
  10. Fourcade, S.; Morato, L.; Parameswaran, J.; Ruiz, M.; Ruiz-Cortes, T.; Jove, M.; Naudi, A.; Martinez-Redondo, P.; Dierssen, M.; Ferrer, I.; et al. Loss of SIRT2 leads to axonal degeneration and locomotor disability associated with redox and energy imbalance. Aging Cell 2017, 16, 1404–1413. [Google Scholar] [CrossRef]
  11. Ghinis-Hozumi, Y.; Antaramian, A.; Villarroya, F.; Pina, E.; Mora, O. Potential role of sirtuins in livestock production. Animal 2013, 7, 101–108. [Google Scholar] [CrossRef] [Green Version]
  12. Sun, Y.G.; Han, Y.C. Genetic Polymorphisms of Myogenin Gene and Their Associations with Growth Traits in the Chinese Tibetan Sheep. Kafkas Univ. Vet. Fak. Derg. 2017, 23, 253–258. [Google Scholar]
  13. Wang, L.; Zhang, K.; Zhang, C.G.; Feng, Y.Z.; Zhang, X.W.; Wang, X.L.; Wu, G.F. Dynamics and stabilization of the rumen microbiome in yearling Tibetan sheep. Sci. Rep. 2019, 9, 1–9. [Google Scholar] [CrossRef] [PubMed] [Green Version]
  14. Gui, L.S.; Jiang, Y.Y.; Liu, G.Y.; Jia, J.L.; Chu, M.D.; Hou, S.Z.; Wang, Z.Y. Polymorphism in GHRH Gene and Its Association with Growth Traits in Tibetan Sheep. Kafkas Universitesi Veteriner Fakultesi Dergisi 2020, 26, 151–155. [Google Scholar]
  15. Balestrieri, M.L.; Rienzo, M.; Felice, F.; Rossiello, R.; Grimaldi, V.; Milone, L.; Casamassimi, A.; Servillo, L.; Farzati, B.; Giovane, A.; et al. High glucose downregulates endothelial progenitor cell number via SIRT1. Biochim. Et Biophys. Acta-Proteins Proteom. 2008, 1784, 936–945. [Google Scholar] [CrossRef]
  16. Figarska, S.M.; Vonk, J.M.; Boezen, H.M. SIRT1 Polymorphism, Long-Term Survival and Glucose Tolerance in the General Population. PLoS ONE 2013, 8, e58636. [Google Scholar] [CrossRef] [PubMed] [Green Version]
  17. Gui, L.S.; Wang, H.B.; Wei, S.J.; Zhang, Y.R.; Zan, L.S. Molecular characterization, expression profiles, and analysis of Qinchuan cattle SIRT1 gene association with meat quality and body measurement traits (Bos taurus). Mol. Biol. Rep. 2014, 41, 5237–5246. [Google Scholar] [CrossRef]
  18. Ghinis-Hozumi, Y.; Gonzalez-Gallardo, A.; Gonzalez-Davalos, L.; Antaramian, A.; Villarroya, F.; Shimada, A.; Varela-Echavarria, A.; Mora, O. Bovine sirtuins: Initial characterization and expression of sirtuins 1 and 3 in liver, muscle, and adipose tissue. J. Anim. Sci. 2011, 89, 2529–2536. [Google Scholar] [CrossRef] [Green Version]
  19. Chen, N.B.; Ma, Y.; Yang, T.; Lin, F.; Fu, W.W.; Xu, Y.J. Tissue expression and predicted protein structures of the bovine ANGPTL3 and association of novel SNPs with growth and meat quality traits. Animal 2015, 9, 1285–1297. [Google Scholar] [CrossRef]
  20. Le Hir, H.; Nott, A.; Moore, M.J. How introns influence and enhance eukaryotic gene expression. Trends Biochem. Sci. 2003, 28, 215–220. [Google Scholar] [CrossRef]
  21. Chai, Y.R.; Sun, Y.; Guo, L.X.; Li, D.; Ding, Y. Investigating the role of introns in the regulation of regenerating gene 1 expression. Oncol. Lett. 2014, 9, 875–880. [Google Scholar] [CrossRef] [PubMed] [Green Version]
  22. Nakajima, T.; Sano, R.; Takahashi, Y.; Watanabe, K.; Kubo, R.; Kobayashi, M.; Takahashi, K.; Takeshita, H.; Kominato, Y. ABO alleles are linked with haplotypes of an erythroid cell-specific regulatory element in intron 1 with a few exceptions attributable to genetic recombination. Vox Sang. 2016, 110, 90–92. [Google Scholar] [CrossRef] [PubMed]
  23. Hao, D.; Thomsen, B.; Bai, J.; Peng, S.; Lan, X.; Huang, Y.; Wang, X.; Chen, H. Expression profiles of the MXD3 gene and association of sequence variants with growth traits in Xianan and Qinchuan cattle. Vet. Med. Sci. 2020, 6, 399–409. [Google Scholar] [CrossRef] [PubMed] [Green Version]
  24. Gui, L.S.; Huang, Y.M.; Hong, J.Y.; Zan, L.S. Polymorphisms in the LPL gene and their association with growth traits in Jiaxian cattle. Genet. Mol. Res. 2016, 15. [Google Scholar] [CrossRef]
  25. Sun, X.M.; Li, M.X.; Hao, D.; Hua, L.S.; Lan, X.Y.; Lei, C.Z.; Hu, S.R.; Qi, X.L.; Chen, H. Two novel polymorphisms of bovine SIRT2 gene are associated with higher body weight in Nanyang cattle. Mol. Biol. Rep. 2015, 42, 729–736. [Google Scholar] [CrossRef] [PubMed]
  26. Gui, L.S.; Hao, R.J.; Zhang, Y.R.; Zhao, X.L.; Zan, L.S. Haplotype distribution in the class I sirtuin genes and their associations with ultrasound carcass traits in Qinchuan cattle (Bos taurus). Mol. Cell. Probes 2015, 29, 167–171. [Google Scholar] [CrossRef] [PubMed]
  27. Jin, Y.Y.; Yang, Q.; Gao, J.Y.; Tang, Q.; Duan, B.; Yu, T.; Qi, X.L.; Liu, J.M.; Wang, R.M.; Dang, R.H.; et al. Detection of Insertions/Deletions Within SIRT1, SIRT2 and SIRT3 Genes and Their Associations with Body Measurement Traits in Cattle. Biochem. Genet. 2018, 56, 663–676. [Google Scholar] [CrossRef]
Figure 1. The relative mRNA expression of ovine SIRT1. * p < 0.05, ** p < 0.01.
Animals 10 01362 g001
Figure 2. The relative mRNA expression of ovine SIRT2. * p < 0.05, ** p < 0.01.
Animals 10 01362 g002
Table 1. Primers used in these experiments.
NamePrimer Sequence (5’ to 3’)Tm (°C)Product LocationProduct Length
SIRT1-SNPCCTTAGCTCTGAAGATGTTCT55.7Part of intron 2, exon 3, and part of intron 3629 bp
TACTGTGTCAATAAATAGAA
SIRT2-SNPTTTTGGAGGAATGTTTGATG57.0Part of exon 5, intron 5, exon 6, intron 6, exon 7, and part of intron 7764 bp
ACTATGCTTCAAGGCTTGCA
SIRT1-qPCRACTTCTACGACGACGACGACGAG61.0-182 bp
CCGAGGTCTTGGAGTCCAGTCAC
SIRT2-qPCRTGGCGGAGAAGCAGAGATGGAC61.0-116 bp
TGTAGCGGCTCACTCCTTCCAG
β-actin-qPCRCGTCCGTGACATCAAGGAGAAGC61.0-143 bp
GGAACCGCTCATTGCCGATGG
GAPD-qPCRCGGCACAGTCAAGGCAGAGAAC61.0-115 bp
CACGTACTCAGCACCAGCATCAC
Table 2. Population genetic analysis of SNPs in SIRT1 and SIRT2.
Loci (Gene)Genotypic Frequency (%)PICMaximum Allele Frequency (%)HWE
g.3148 C > T
(SIRT1)
CCCTTT
58.4634.087.460.3075.50 (C)p > 0.05
g.3570 G > A
(SIRT1)
GGGAAA
67.1627.365.480.2680.85 (G)p > 0.05
g.8074 T > A
(SIRT2)
TTTAAA
72.3923.883.730.2384.33 (T)p > 0.05
Polymorphism information content, PIC. Hardy-Weinberg equilibrium, HWE.
Table 3. Frequencies analysis of SIRT1 haplotypes.
Haplotypeg.3148 C > Tg.3570 G > AFrequency
Hap1CA13.30%
Hap2CG62.20%
Hap3TA5.90%
Hap4TG18.60%
Table 4. Association of genotypes of SNPs in SIRT1 and SIRT2 with growth traits in Tibetan sheep.
Loci (Gene)Genotypes (N)Body Weight (kg)Withers Height (cm)Body Length (cm)Heart Girth (cm)
g.3148 C > T (SIRT1)CC (235)58.63 ± 0.4671.60 ± 0.8275.00 ± 0.6596.08 ± 1.03 b
CT (137)56.24 ± 0.5970.54 ± 0.5773.83 ± 0.5496.73 ± 0.79 b
TT (30)54.48 ± 0.7970.78 ± 0.6872.51 ± 0.7788.38 ± 0.85 a
p1 0.0720.2530.1090.002
g.3570 G > A (SIRT1)GG (270)58.54 ± 0.6571.62 ± 0.7675.03 ± 0.8296.77 ± 0.88
GA (110)55.88 ± 0.4870.32 ± 0.5973.39 ± 0.6994.15 ± 0.72
AA (22)52.94 ± 0.7270.01 ± 0.6072.02 ± 0.6690.78 ± 0.99
p1 0.0380.1570.0700.019
g.8074 T>A (SIRT2)TT (291)57.53 ± 0.27 b71.17 ± 0.2074.44 ± 0.19 b96.03 ± 0.29
TA (96)56.09 ± 0.47 b70.41 ± 0.3573.23 ± 0.33 b94.43 ± 0.53
AA (15)66.07 ± 0.92 a76.22 ± 0.8981.63 ± 0.83 a98.00 ± 1.17
p2 0.0110.0310.0080.074
Values were showed as the least squares means ± standard error. a,b Means with different superscripts are significantly different (p1 < 0.00625 and p2 < 0.0125) after Bonferroni correction.
Table 5. Association of different genotypes of SNPs in SIRT1 with growth traits in Tibetan sheep.
Genotypes (N)Body Weight (kg)Withers Height (cm)Body Length (cm)Heart Girth (cm)
Hap2/1 (63)56.84 ± 0.4470.59 ± 0.6374.03 ± 0.4595.52 ± 0.73
Hap2/2 (159)59.72 ± 0.6772.08 ± 0.7075.59 ± 0.4396.63 ± 1.23
Hap2/3 (34)55.61 ± 0.4870.12 ± 0.7973.17 ± 0.5794.60 ± 0.88
Hap2/4 (99)56.50 ± 0.4070.64 ± 0.5374.03 ± 0.6197.67 ± 0.74
p10.0320.2250.4380.040
Values were showed as the least squares means ± standard error.

