Improvement of Cecal Commensal Microbiome Following the Insect Additive into Chicken Diet

 , ,
, ,  ,
,
Abstract
:Simple Summary
Abstract
1. Introduction
2. Materials and Methods
2.1. Birds and Housing
2.2. Diets and Feeding Program
2.3. Sampling
2.4. Bacterial DNA Extraction and Amplification
2.5. Cecal Digesta Microbiome 16SrRNA Sequencing
2.6. Metagenomic Analysis
2.7. Statistical Analysis
3. Results
3.1. Effect on Cecal Comensal Microbiome
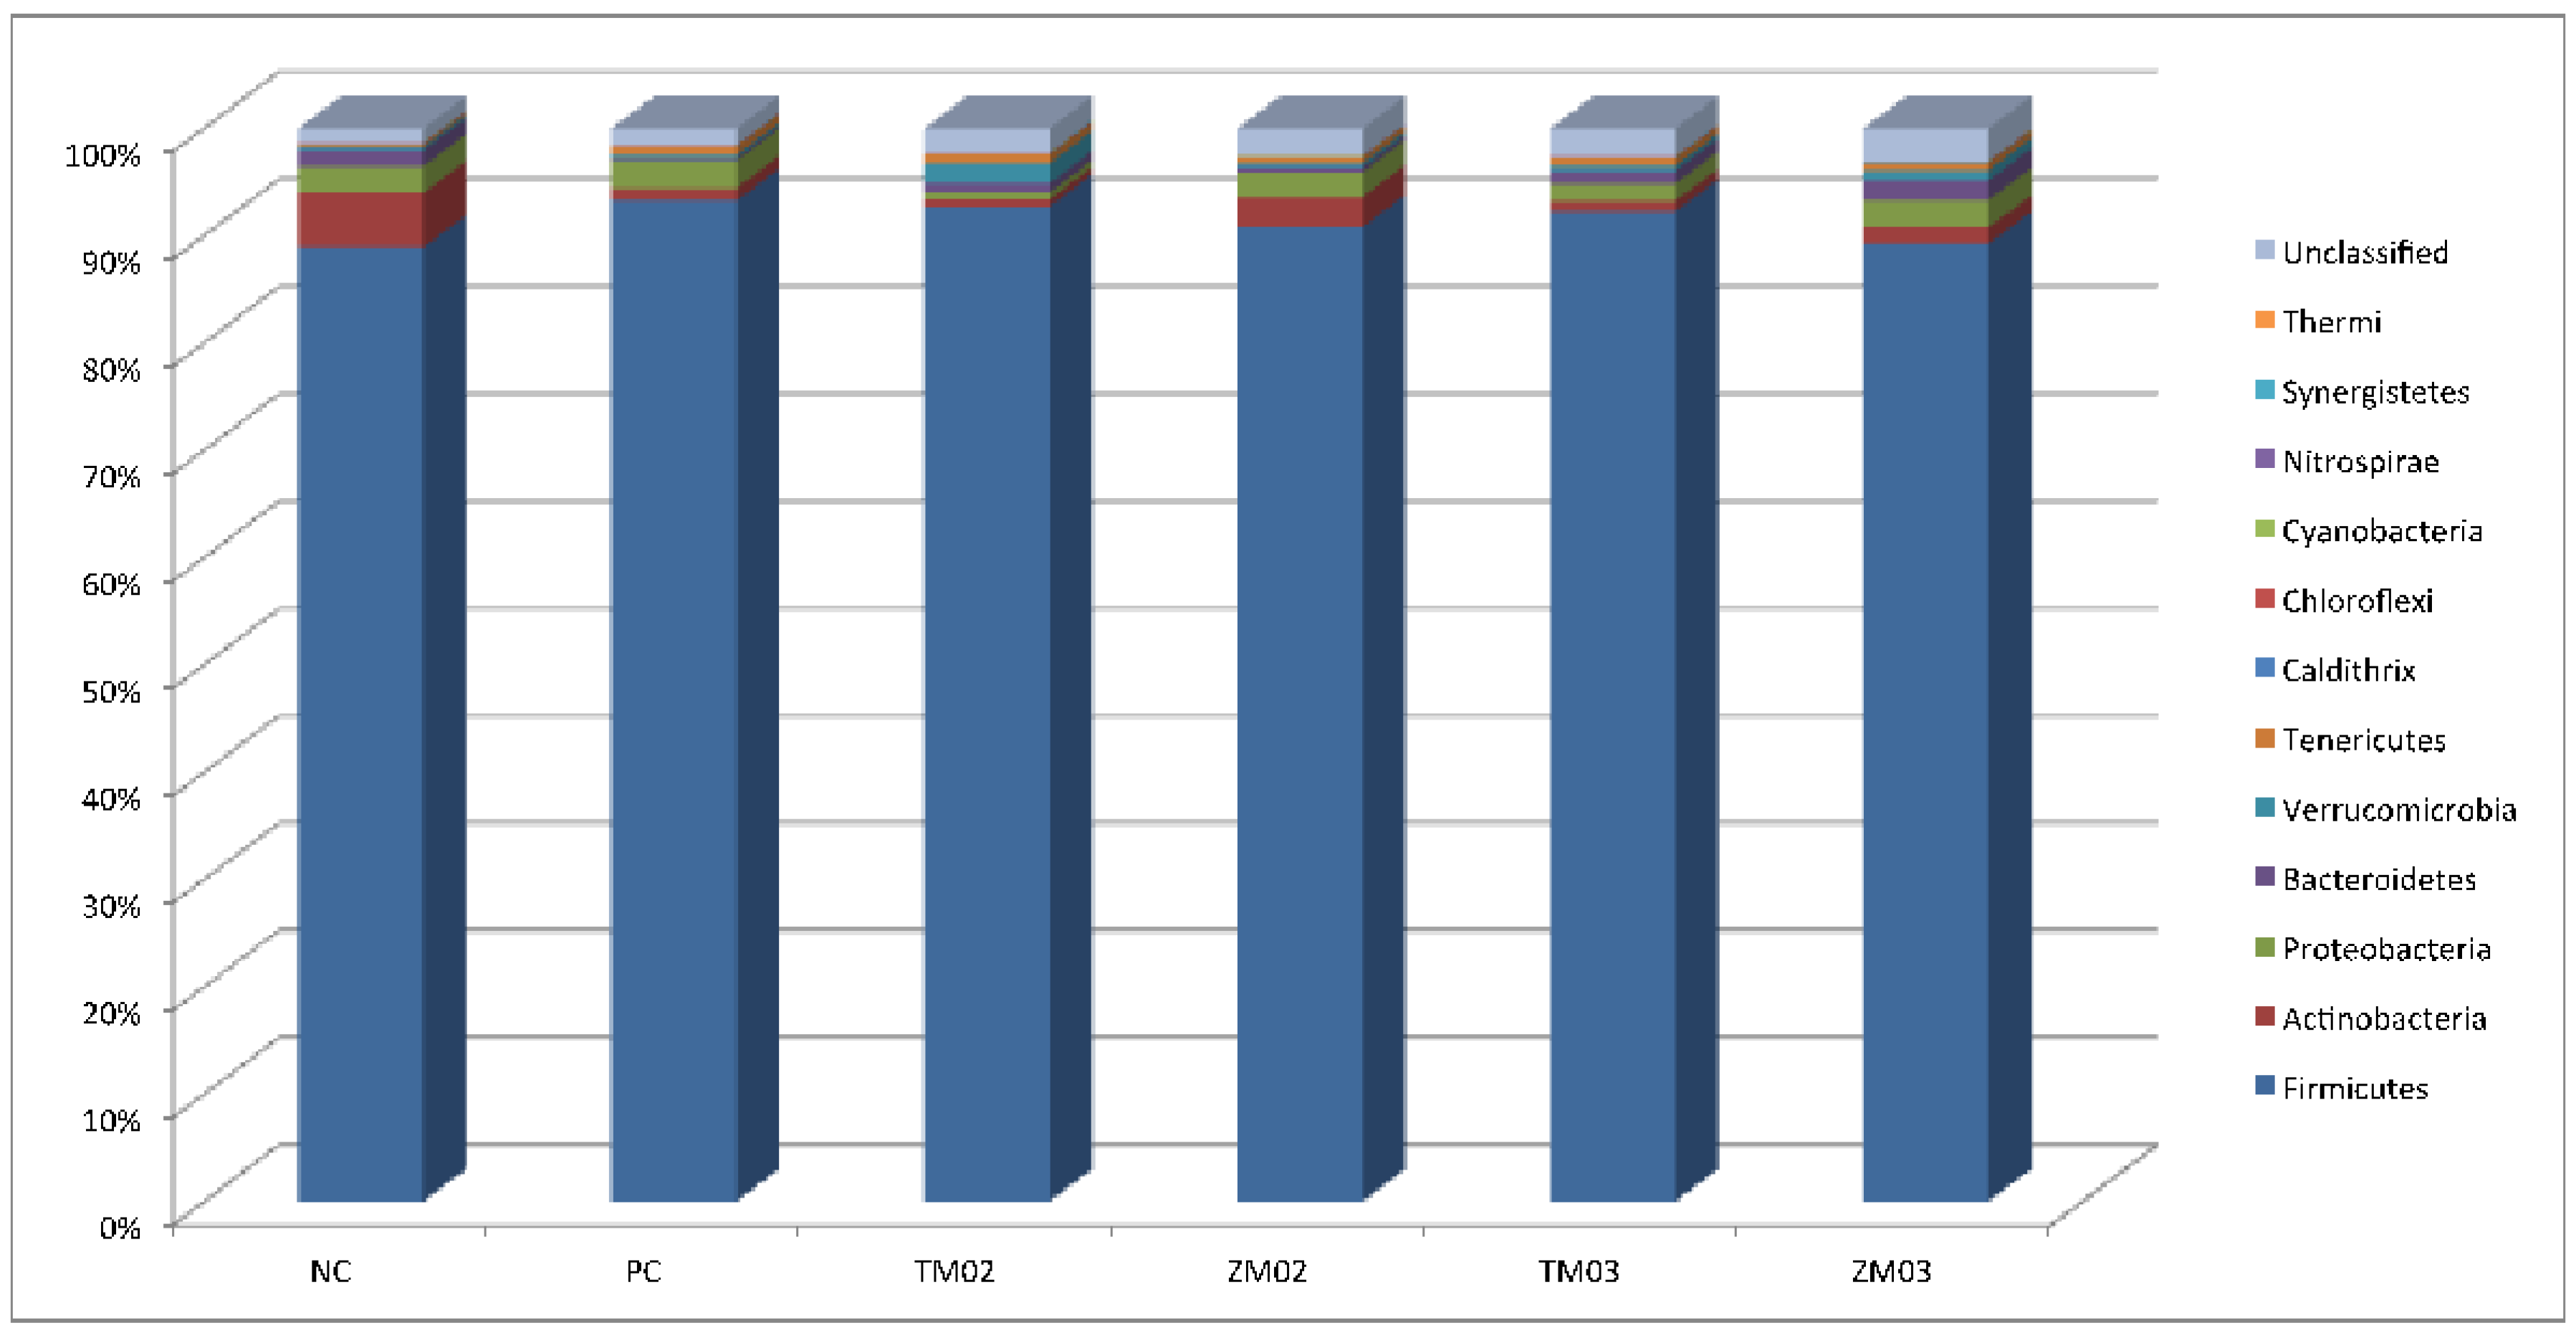
3.1.1. Phylum Level
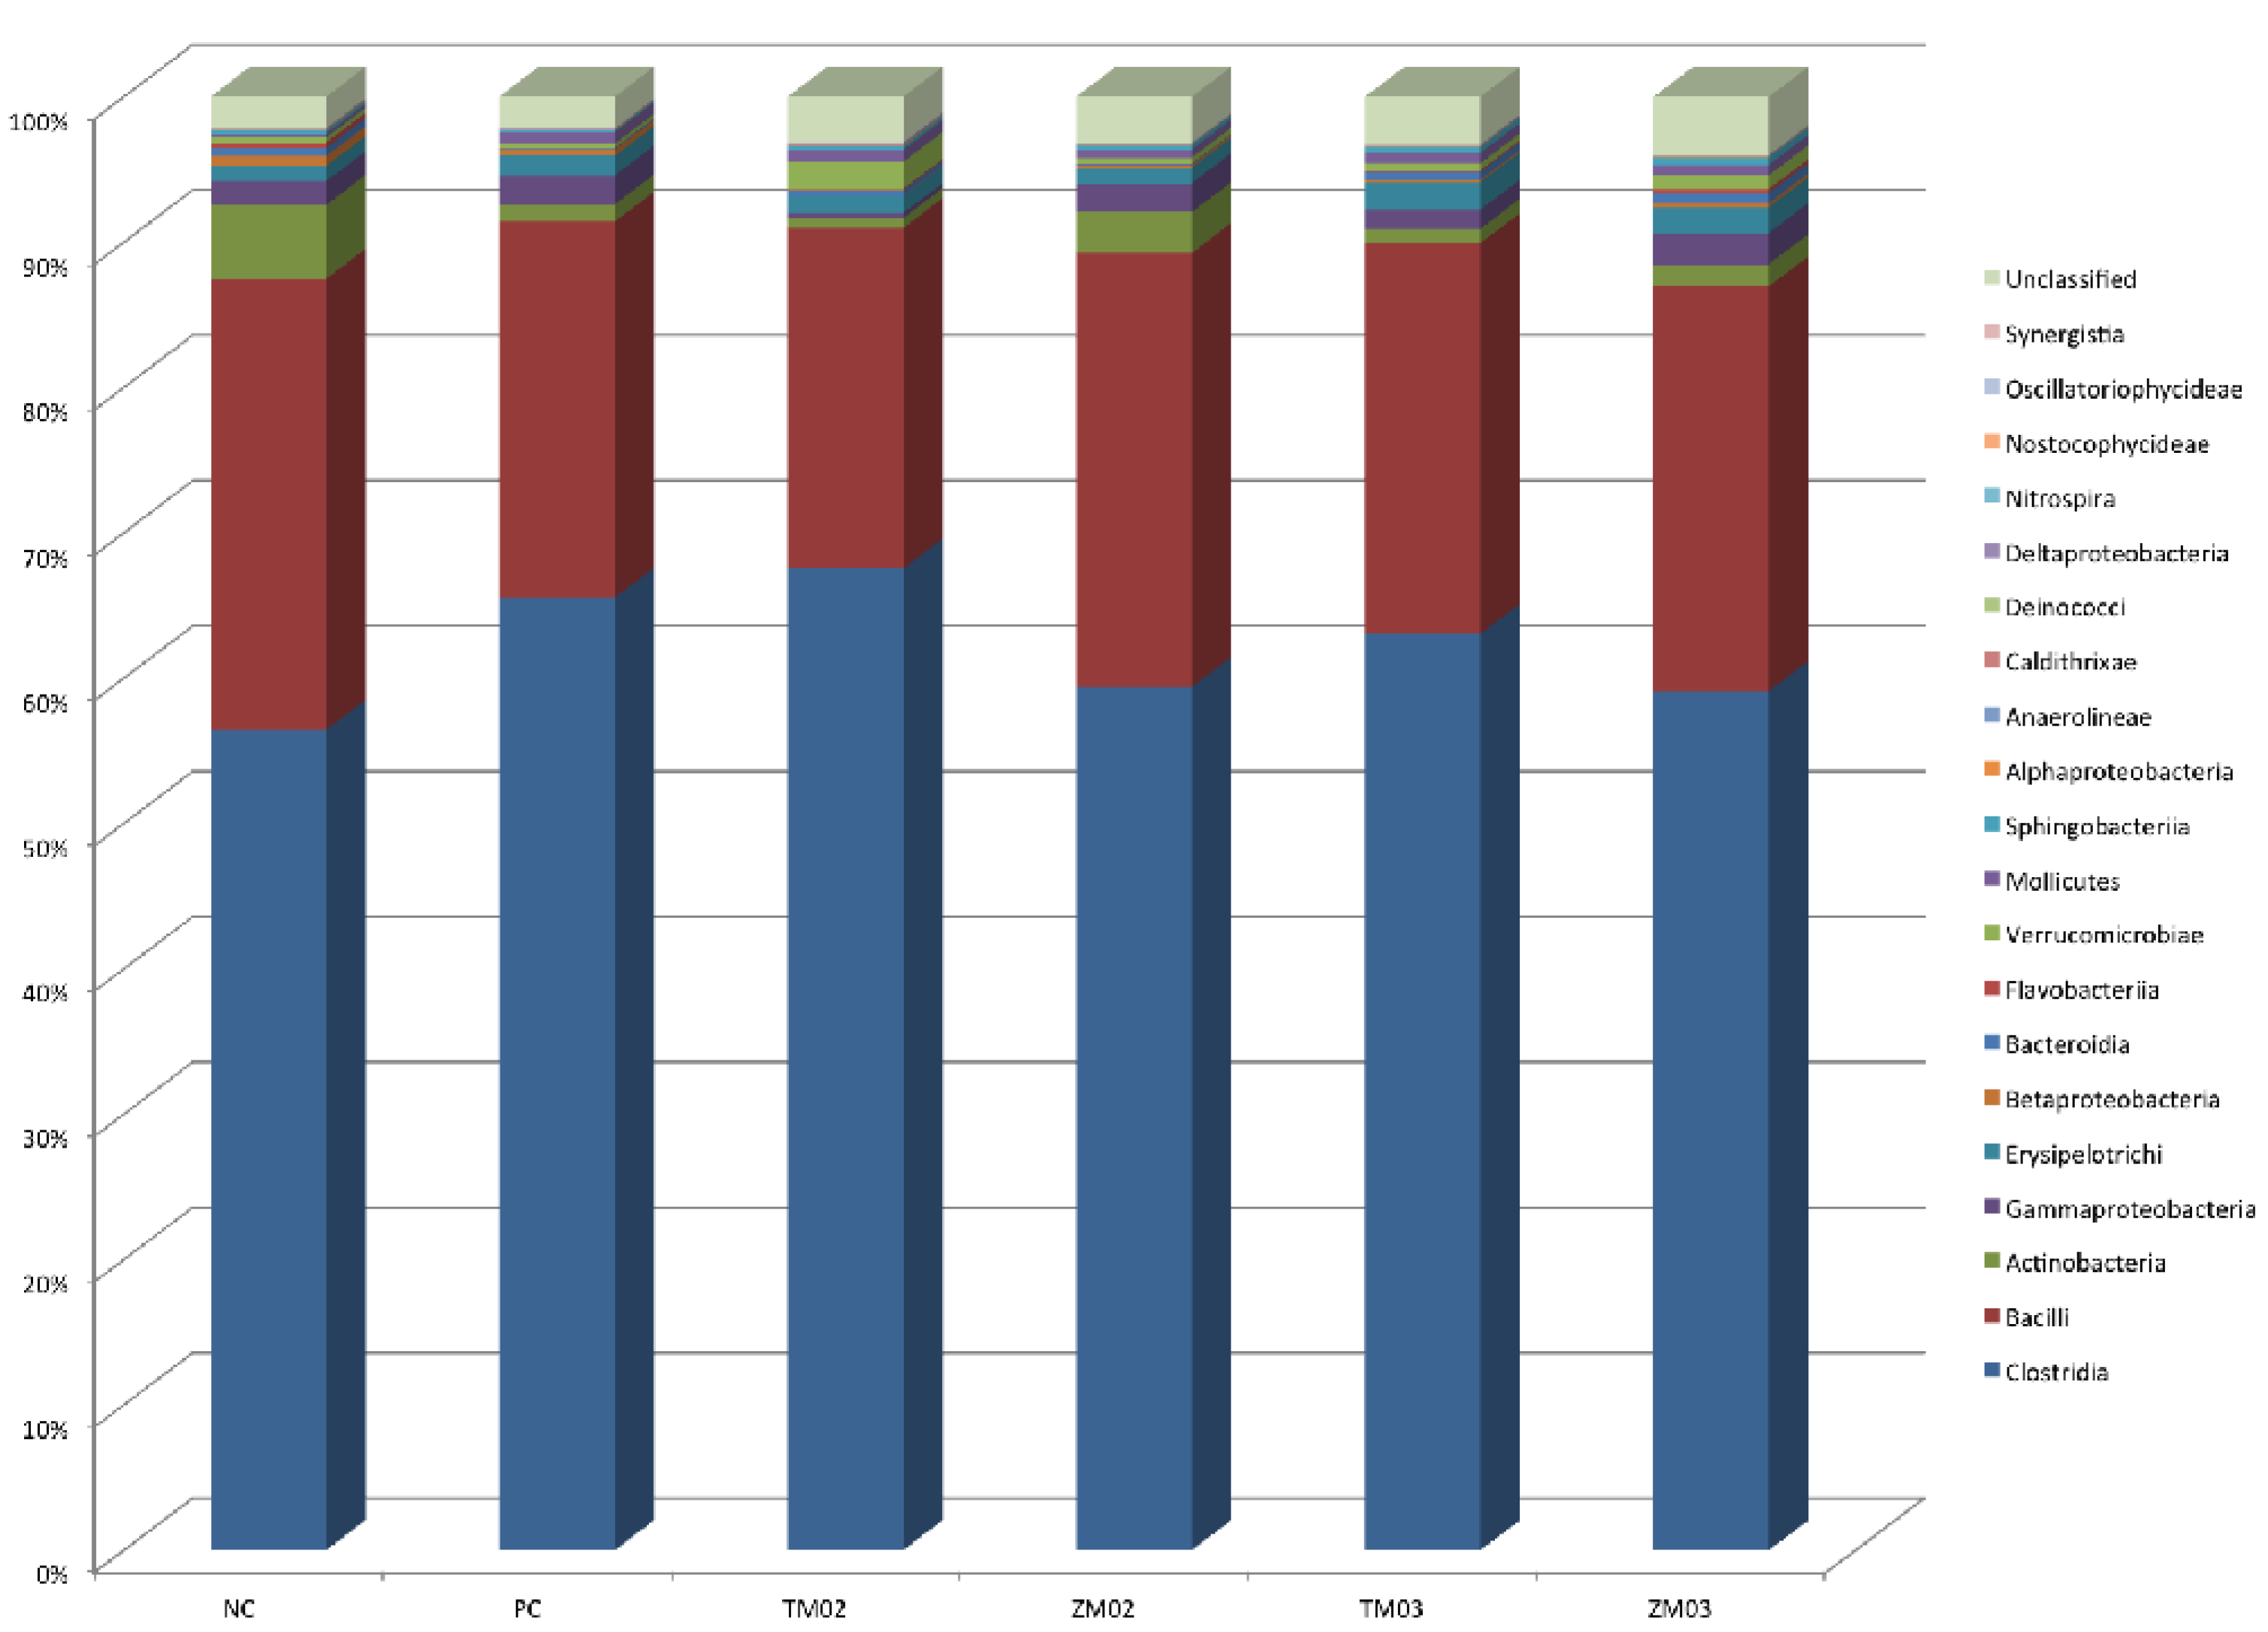
3.1.2. Class Level
3.1.3. Order Level
3.2. Family
3.3. Genus
3.4. Species
4. Discussion
5. Conclusions
Author Contributions
Funding
Conflicts of Interest
References
- Shang, Y.; Kumar, S.; Oakley, B.; Kim, W.K. Chicken gut microbiota: Importance and detection technology. Front. Vet. Sci. 2018, 5, 254. [Google Scholar] [CrossRef] [PubMed]
- Wilkinson, T.J.; Cowan, A.A.; Vallin, H.E.; Onime, L.A.; Oyama, L.B.; Cameron, S.J.; Gonot, C.; Moorby, J.M.; Waddams, K.; Theobald, V.J.; et al. Characterization of the microbiome along the gastrointestinal tract of growing turkeys. Front. Microbiol. 2017, 8, 1089. [Google Scholar] [CrossRef] [PubMed] [Green Version]
- Den Besten, G.; van Eunen, K.; Groen, A.K.; Venema, K.; Reijngoud, D.-J.; Bakker, B.M. The role of short-chain fatty acids in the interplay between diet, gut microbiota, and host energy metabolism. J. Lipid Res. 2013, 54, 2325–2340. [Google Scholar] [CrossRef] [PubMed] [Green Version]
- Benzertiha, A.; Kierończyk, B.; Rawski, M.; Kołodziejski, P.; Bryszak, M.; Józefiak, D. Insect oil as an alternative to palm oil and poultry fat in broiler chicken nutrition. Animals 2019, 9, 116. [Google Scholar] [CrossRef] [PubMed] [Green Version]
- Kierończyk, B.; Rawski, M.; Józefiak, A.; Mazurkiewicz, J.; Świątkiewicz, S.; Siwek, M.; Bednarczyk, M.; Szumacher-Strabel, M.; Cieślak, A.; Benzertiha, A.; et al. Effects of replacing soybean oil with selected insect fats on broilers. Anim. Feed Sci. Technol. 2018, 240, 170–183. [Google Scholar] [CrossRef]
- Benzertiha, A.; Kierończyk, B.; Rawski, M.; Józefiak, A.; Kozłowski, K.; Jankowski, J.; Józefiak, D. Tenebrio molitor and Zophobas morio full-fat meals in broiler chicken diets: Effects on nutrients digestibility, digestive enzyme activities, and cecal microbiome. Animals 2019, 9, 1128. [Google Scholar] [CrossRef] [Green Version]
- Diaz-Sanchez, S.; Hanning, I.; Pendleton, S.; D’Souza, D. Next-Generation sequencing: The future of molecular genetics in poultry production and food safety. Poult. Sci. 2013, 92, 562–572. [Google Scholar] [CrossRef]
- Sood, U.; Gupta, V.; Kumar, R.; Lal, S.; Fawcett, D.; Rattan, S.; Poinern, G.E.J.; Lal, R. Chicken gut microbiome and human health: Past scenarios, current perspectives, and futuristic applications. Indian J. Microbiol. 2019, 60, 2–11. [Google Scholar] [CrossRef]
- Zou, A.; Sharif, S.; Parkinson, J. Lactobacillus elicits a “Marmite effect” on the chicken cecal microbiome. NPJ Biofilms Microbiomes 2018, 4, 27. [Google Scholar] [CrossRef] [Green Version]
- Pourabedin, M.; Zhao, X. Prebiotics and gut microbiota in chickens. FEMS Microbiol. Lett. 2015, 362. [Google Scholar] [CrossRef] [Green Version]
- Waite, D.W.; Taylor, M.W. Characterizing the avian gut microbiota: Membership, driving influences, and potential function. Front. Microbiol. 2014, 5, 223. [Google Scholar] [CrossRef] [PubMed] [Green Version]
- Qu, A.; Brulc, J.M.; Wilson, M.K.; Law, B.F.; Theoret, J.R.; Joens, L.A.; Konkel, M.E.; Angly, F.; Dinsdale, E.A.; Edwards, R.A.; et al. Comparative metagenomics reveals host specific metavirulomes and horizontal gene transfer elements in the chicken cecum microbiome. PLoS ONE 2008, 3, e2945. [Google Scholar] [CrossRef] [PubMed] [Green Version]
- Oakley, B.B.; Lillehoj, H.S.; Kogut, M.H.; Kim, W.K.; Maurer, J.J.; Pedroso, A.; Lee, M.D.; Collett, S.R.; Johnson, T.J.; Cox, N.A. The chicken gastrointestinal microbiome. FEMS Microbiol. Lett. 2014, 360, 100–112. [Google Scholar] [CrossRef] [PubMed]
- Stanley, D.; Hughes, R.J.; Moore, R.J. Microbiota of the chicken gastrointestinal tract: Influence on health, productivity and disease. Appl. Microbiol. Biotechnol. 2014, 98, 4301–4310. [Google Scholar] [CrossRef] [PubMed]
- Rehman, H.U.; Vahjen, W.; Awad, W.A.; Zentek, J. Indigenous bacteria and bacterial metabolic products in the gastrointestinal tract of broiler chickens. Arch. Anim. Nutr. 2007, 61, 319–335. [Google Scholar] [CrossRef]
- Gong, J.; Si, W.; Forster, R.J.; Huang, R.; Yu, H.; Yin, Y.; Yang, C.; Han, Y. 16S rRNA gene-based analysis of mucosa-associated bacterial community and phylogeny in the chicken gastrointestinal tracts: From crops to ceca. FEMS Microbiol. Ecol. 2007, 59, 147–157. [Google Scholar] [CrossRef] [Green Version]
- Danzeisen, J.L.; Kim, H.B.; Isaacson, R.E.; Tu, Z.J.; Johnson, T.J. Modulations of the chicken cecal microbiome and metagenome in response to anticoccidial and growth promoter treatment. PLoS ONE 2011, 6, e27949. [Google Scholar] [CrossRef]
- Yin, Y.; Lei, F.; Zhu, L.; Li, S.; Wu, Z.; Zhang, R.; Gao, G.F.; Zhu, B.; Wang, X. Exposure of different bacterial inocula to newborn chicken affects gut microbiota development and ileum gene expression. ISME J. 2010, 4, 367–376. [Google Scholar] [CrossRef] [Green Version]
- Stanley, D.; Geier, M.S.; Chen, H.; Hughes, R.J.; Moore, R.J. Comparison of fecal and cecal microbiotas reveals qualitative similarities but quantitative differences. BMC Microbiol. 2015, 15, 51. [Google Scholar] [CrossRef] [Green Version]
- Nordentoft, S.; Mølbak, L.; Bjerrum, L.; De Vylder, J.; Van Immerseel, F.; Pedersen, K. The influence of the cage system and colonisation of Salmonella enteritidis on the microbial gut flora of laying hens studied by T-RFLP and 454 pyrosequencing. BMC Microbiol. 2011, 11, 187. [Google Scholar] [CrossRef] [Green Version]
- Józefiak, D.; Józefiak, A.; Kierończyk, B.; Rawski, M.; Świątkiewicz, S.; Długosz, J.; Engberg, R.M. Insects—A natural nutrient source for poultry—A review. Ann. Anim. Sci. 2016, 16. [Google Scholar] [CrossRef] [Green Version]
- Józefiak, A.; Nogales-Mérida, S.; Mikołajczak, Z.; Rawski, M.; Kierończyk, B.; Mazurkiewicz, J. The utilization of full-fat insect meal in rainbow trout (Oncorhynchus mykiss) nutrition: The effects on growth performance, intestinal microbiota and gastrointestinal tract histomorphology. Ann. Anim. Sci. 2019, 19, 747–765. [Google Scholar] [CrossRef] [Green Version]
- Józefiak, A.; Engberg, R.M. Insect proteins as a potential source of antimicrobial peptides in livestock production. A review. J. Anim. Feed Sci. 2017, 26. [Google Scholar] [CrossRef]
- Józefiak, A.; Nogales-Mérida, S.; Rawski, M.; Kierończyk, B.; Mazurkiewicz, J. Effects of insect diets on the gastrointestinal tract health and growth performance of Siberian sturgeon (Acipenser baerii Brandt, 1869). BMC Vet. Res. 2019, 15, 348. [Google Scholar] [CrossRef] [PubMed] [Green Version]
- Benzertiha, A.; Kierończyk, B.; Kołodziejski, P.; Pruszyńska–Oszmałek, E.; Rawski, M.; Józefiak, D.; Józefiak, A. Tenebrio molitor and Zophobas morio full-fat meals as functional feed additives affect broiler chickens’ growth performance and immune system traits. Poultry Sci. 2020, 99, 196–206. [Google Scholar] [CrossRef] [PubMed]
- Altschul, S.F.; Gish, W.; Miller, W.; Myers, E.W.; Lipman, D.J. Basic local alignment search tool. J. Mol. Biol. 1990, 215, 403–410. [Google Scholar] [CrossRef]
- Caporaso, J.G.; Kuczynski, J.; Stombaugh, J.; Bittinger, K.; Bushman, F.D.; Costello, E.K.; Fierer, N.; Peña, A.G.; Goodrich, J.K.; Gordon, J.I.; et al. QIIME allows analysis of high-throughput community sequencing data. Nat. Methods 2010, 7, 335–336. [Google Scholar] [CrossRef] [Green Version]
- DeSantis, T.Z.; Hugenholtz, P.; Larsen, N.; Rojas, M.; Brodie, E.L.; Keller, K.; Huber, T.; Dalevi, D.; Hu, P.; Andersen, G.L. Greengenes, a chimera-checked 16S rRNA gene database and workbench compatible with ARB. Appl. Environ. Microbiol. 2006, 72, 5069–5072. [Google Scholar] [CrossRef] [Green Version]
- Martin, M. Cutadapt removes adapter sequences from high-throughput sequencing reads. No 1: Next generation sequencing data analysis. EMBnet J. 2011, 17. [Google Scholar] [CrossRef]
- Edgar, R.C. Search and clustering orders of magnitude faster than BLAST. Bioinformatics 2010, 26, 2460–2461. [Google Scholar] [CrossRef] [Green Version]
- Haas, B.J.; Gevers, D.; Earl, A.M.; Feldgarden, M.; Ward, D.V.; Giannoukos, G.; Ciulla, D.; Tabbaa, D.; Highlander, S.K.; Sodergren, E.; et al. Chimeric 16S rRNA sequence formation and detection in Sanger and 454-pyrosequenced PCR amplicons. Genome Res. 2011, 21, 494–504. [Google Scholar] [CrossRef] [PubMed] [Green Version]
- McMurdie, P.J.; Holmes, S. Phyloseq: An R package for reproducible interactive analysis and graphics of microbiome census data. PLoS ONE 2013, 8, e61217. [Google Scholar] [CrossRef] [PubMed] [Green Version]
- Bray, J.R.; Curtis, J.T. An ordination of the upland forest communities of Southern Wisconsin. Ecol. Monogr. 1957, 27, 325–349. [Google Scholar] [CrossRef]
- Singh, K.M.; Shah, T.M.; Reddy, B.; Deshpande, S.; Rank, D.N.; Joshi, C.G. Taxonomic and gene-centric metagenomics of the fecal microbiome of low and high feed conversion ratio (FCR) broilers. J. Appl. Genet. 2014, 55, 145–154. [Google Scholar] [CrossRef] [PubMed]
- Pourabedin, M.; Guan, L.; Zhao, X. Xylo-Oligosaccharides and virginiamycin differentially modulate gut microbial composition in chickens. Microbiome 2015, 3, 15. [Google Scholar] [CrossRef] [PubMed] [Green Version]
- Jandhyala, S.M.; Talukdar, R.; Subramanyam, C.; Vuyyuru, H.; Sasikala, M.; Nageshwar Reddy, D. Role of the normal gut microbiota. World J. Gastroenterol. 2015, 21, 8787–8803. [Google Scholar] [CrossRef]
- Biasato, I.; Ferrocino, I.; Biasibetti, E.; Grego, E.; Dabbou, S.; Sereno, A.; Gai, F.; Gasco, L.; Schiavone, A.; Cocolin, L.; et al. Modulation of intestinal microbiota, morphology and mucin composition by dietary insect meal inclusion in free-range chickens. BMC Vet. Res. 2018, 14, 383. [Google Scholar] [CrossRef] [Green Version]
- Vasquez, N.; Suau, A.; Magne, F.; Pochart, P.; Pélissier, M.-A. Differential effects of Bifidobacterium pseudolongum strain Patronus and metronidazole in the rat gut. Appl. Environ. Microbiol. 2009, 75, 381–386. [Google Scholar] [CrossRef] [Green Version]
- Vazquez-Gutierrez, P.; de Wouters, T.; Werder, J.; Chassard, C.; Lacroix, C. High iron-sequestrating Bifidobacteria inhibit enteropathogen growth and adhesion to intestinal epithelial cells In Vitro. Front. Microbiol. 2016, 7, 1480. [Google Scholar] [CrossRef] [Green Version]
- Wei, S.; Morrison, M.; Yu, Z. Bacterial census of poultry intestinal microbiome. Poult. Sci. 2013, 92, 671–683. [Google Scholar] [CrossRef]


| Ingredients (g·kg−1) | 1–14 d | 15–35 d |
|---|---|---|
| Wheat | 487.4 | 513.4 |
| Rye | 100.0 | 100.0 |
| Soybean meal | 207.8 | 169.5 |
| Rapeseed meal | 100.0 | 100.0 |
| Fish meal | 20.0 | 20.0 |
| Soybean oil | 49.9 | 71.1 |
| Vitamin–mineral premix a | 3.0 | 3.0 |
| Monocalcium phosphate | 13.1 | 6.7 |
| Limestone | 8.0 | 6.8 |
| Salt (NaCl) | 1.1 | 1.3 |
| Sodium carbonate (Na2CO3) | 2.2 | 1.7 |
| L–Lysine HCl | 2.9 | 2.4 |
| Methionine 88% liquid | 3.1 | 2.5 |
| L–Threonine | 1.5 | 1.6 |
| Titanium dioxide (TiO2) b | - | 2.0 |
| Calculated nutritive value (g·kg−1) | ||
| Crude protein | 215.6 | 200.6 |
| Ether extract | 65.4 | 86.3 |
| Crude fiber | 33.1 | 32.2 |
| Total phosphorus (P) | 7.9 | 6.3 |
| Calcium (Ca) | 8.5 | 7.0 |
| Methionine | 6.1 | 5.3 |
| Lysine | 12.5 | 11.2 |
| Methionine + cysteine | 9.9 | 9.0 |
| Threonine | 9.1 | 8.6 |
| AMEN (MJ·kg−1) | 12.56 | 13.31 |
| PC | NC | TM02 | ZM02 | TM03 | ZM03 | Chi-Squared | df | p-Value | |
|---|---|---|---|---|---|---|---|---|---|
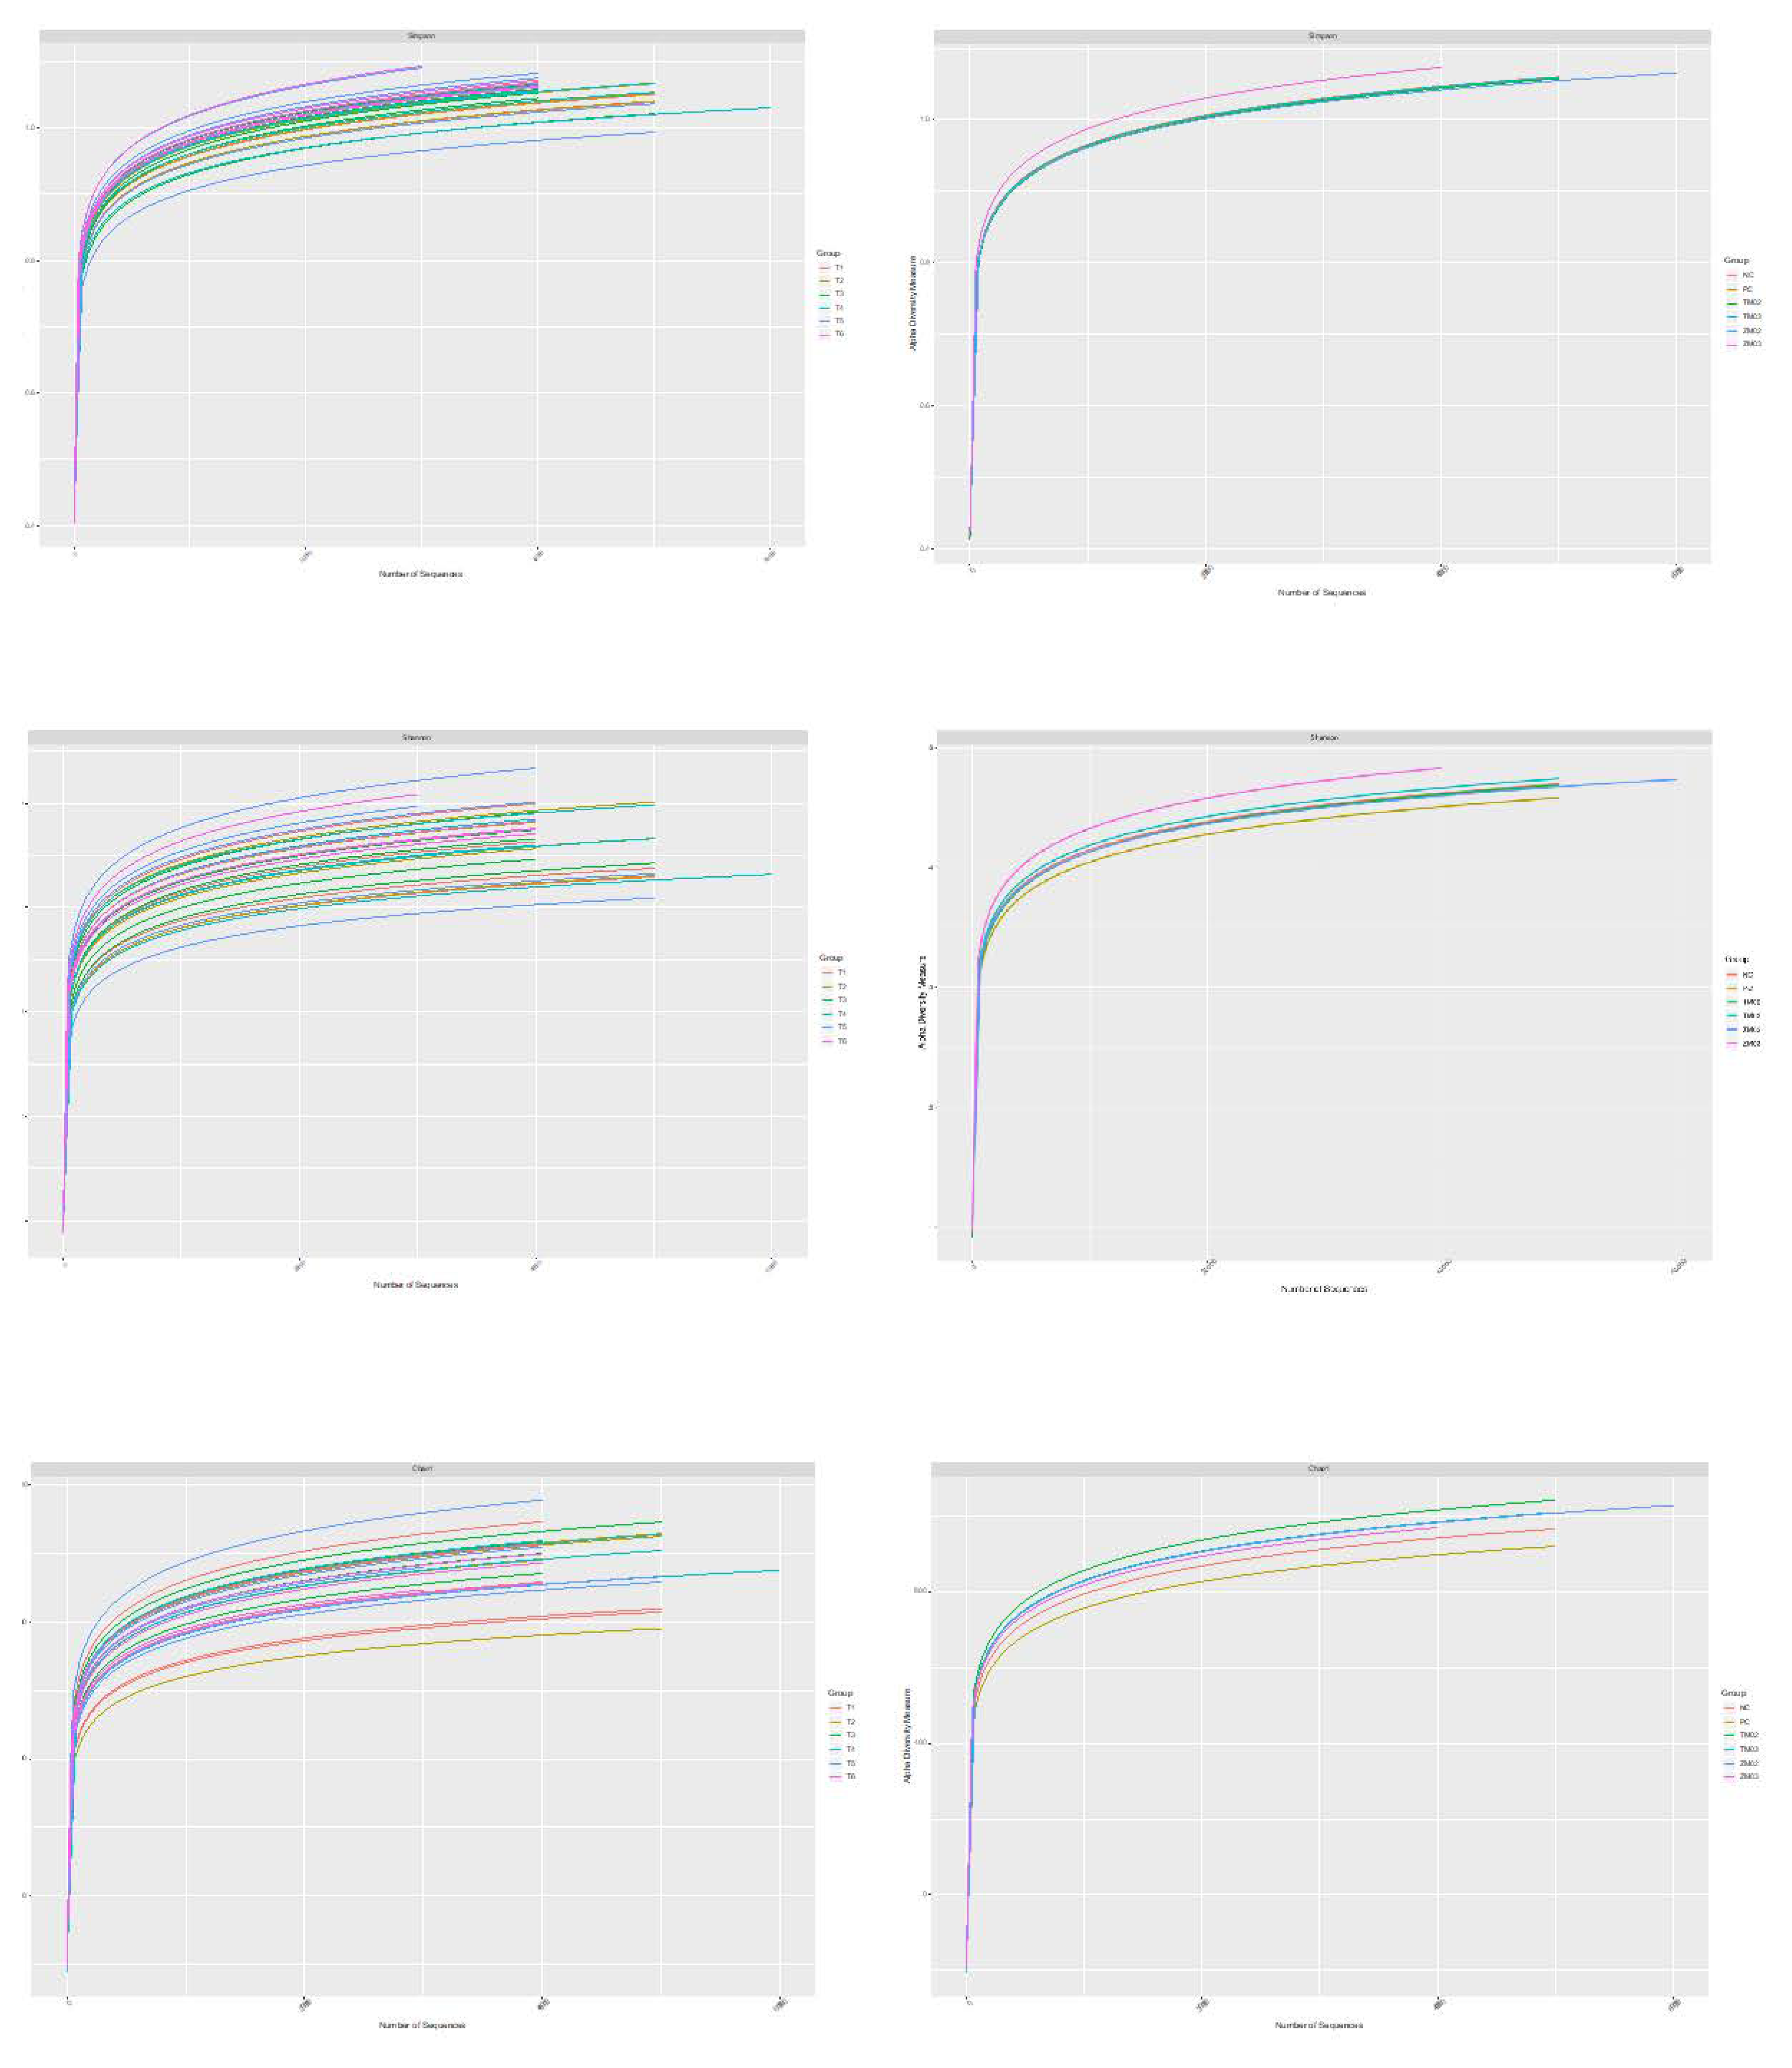
| Chao | 1353,433689 | 1403,584812 | 1460,172589 | 1482,72019 | 1473,615167 | 1440,336954 | 2.5531 | 5 | 0.7715 |
| inverse Simpson | 24,04508234 | 26,76290487 | 20,86621696 | 27,18980723 | 29,13428671 | 29,73953594 | 4.4531 | 5 | 0.4862 |
| OTU | 1002,75 | 1048,6 | 1113,8 | 1099,6 | 1098 | 1066,2 | 3.5919 | 5 | 0.6095 |
| Shannon | 4,188089975 | 4,282324207 | 4,251156956 | 4,298738827 | 4,338615676 | 4,403900425 | 2.7703 | 5 | 0.7353 |
| Simpson | 0,957585469 | 0,960598925 | 0,949845404 | 0,960809514 | 0,955005403 | 0,965599882 | 4.4531 | 5 | 0.4862 |
| Treatment | RMSE | p-Value | ||||||||||||
|---|---|---|---|---|---|---|---|---|---|---|---|---|---|---|
| PC | SD | NC | SD | TM02 | SD | ZM02 | SD | TM03 | SD | ZM03 | SD | |||
| Kingdom | ||||||||||||||
| Bacteria | 99.77 | 0.09 | 99.41 | 0.16 | 99.37 | 0.33 | 99.43 | 0.20 | 99.53 | 0.23 | 99.53 | 0.15 | 0.002 | 0.070 |
| Unclasified | 0.23 | 0.09 | 0.59 | 0.16 | 0.63 | 0.33 | 0.57 | 0.20 | 0.47 | 0.23 | 0.47 | 0.15 | 0.002 | 0.070 |
| Phylum | ||||||||||||||
| Firmicutes | 89.47 | 3.07 | 93.42 | 3.67 | 92.49 | 1.99 | 89.85 | 3.40 | 92.14 | 2.77 | 89.51 | 2.72 | 0.028 | 0.131 |
| Actinobacteria | 4.89a | 0.00 | 1.66b | 0.00 | 1.19b | 0.00 | 3.58ab | 0.00 | 1.37b | 0.00 | 1.52b | 0.00 | 0.020 | 0.039 |
| Bacteroidetes | 1.42 | 2.09 | 0.12 | 0.14 | 0.62 | 1.05 | 0.12 | 0.29 | 0.84 | 1.33 | 1.44 | 2.17 | 0.014 | 0.535 |
| Proteobacteria | 2.30 | 3.36 | 2.34 | 2.34 | 0.32 | 0.28 | 2.18 | 3.08 | 1.36 | 1.03 | 2.25 | 2.56 | 0.024 | 0.730 |
| Class | ||||||||||||||
| Actinobacteria | 4.33a | 0,00 | 0.87b | 0,00 | 0.25b | 0,00 | 2.05ab | 0,00 | 0.69b | 0,00 | 0.87b | 0,00 | 0.019 | 0.021 |
| Bacilli | 25.60 | 5.89 | 21.40 | 6.25 | 18.71 | 5.62 | 26.09 | 0.76 | 20.85 | 4.61 | 24.24 | 4.50 | 0.053 | 0.210 |
| Clostridia | 62.79b | 7.15 | 70.70ab | 6.24 | 72.66a | 7.19 | 62.69b | 3.76 | 69.42ab | 3.73 | 63.48b | 4.64 | 0.058 | 0.032 |
| Order | ||||||||||||||
| Bifidobacteriales | 4.32a | 3.89 | 0.86b | 166 | 0.24b | 0.34 | 2.04ab | 2.32 | 0.67b | 1.05 | 0.86b | 1.16 | 0.019 | 0.021 |
| Lactobacillales | 25.49 | 5.78 | 21.30 | 6.14 | 18.51 | 5.61 | 25.79 | 0.81 | 20.67 | 4.64 | 24.12 | 4.47 | 0.052 | 0.209 |
| Clostridiales | 62.79b | 7.03 | 70.70ab | 5.86 | 72.66a | 6.99 | 62.69b | 4.05 | 69.42ab | 3.18 | 63.48b | 4.86 | 0.058 | 0.032 |
| Family | ||||||||||||||
| Bifidobacteriaceae | 4.32a | 3.89 | 0.86b | 1.66 | 0.24b | 0.34 | 2.04ab | 2.32 | 0.67b | 1.05 | 0.86b | 1.16 | 0.019 | 0.021 |
| Lactobacillaceae | 24.57 | 6.84 | 20.56 | 5.68 | 18.12 | 5.70 | 24.64 | 1.37 | 20.26 | 4.89 | 23.84 | 4.45 | 0.054 | 0.314 |
| Lachnospiraceae | 25.85 | 5.26 | 23.13 | 1.88 | 17.16 | 2.55 | 17.51 | 5.57 | 20.91 | 5.08 | 20.95 | 6.95 | 0.054 | 0.136 |
| Ruminococcaceae | 21.90b | 5.39 | 30.54ab | 7.95 | 33.48a | 4.11 | 25.24ab | 6.15 | 29.53ab | 5.09 | 21.83b | 6.18 | 0.065 | 0.042 |
| Genus | ||||||||||||||
| Bifidobacterium | 4.32a | 3.89 | 0.86b | 1.66 | 0.24b | 0.34 | 2.04ab | 2.32 | 0.67b | 1.05 | 0.86b | 1.16 | 0.019 | 0.021 |
| Lactobacillus | 24.57 | 6.78 | 20.56 | 5.61 | 18.12 | 5.65 | 24.64 | 1.38 | 20.26 | 4.82 | 23.84 | 4.42 | 0.054 | 0.314 |
| Blautia | 4.10 | 4.48 | 4.65 | 1.70 | 4.14 | 3.14 | 4.39 | 4.98 | 4.97 | 4.27 | 3.54 | 5.38 | 0.027 | 0.973 |
| Ruminococcus | 14.49c | 1.90 | 20.73abc | 2.64 | 26.57a | 1.57 | 18.41bc | 1.41 | 22.85ab | 1.71 | 15.21c | 2.64 | 0.054 | 0.012 |
| Faecalibacterium | 5.39 | 6.27 | 7.97 | 8.52 | 5.22 | 4.36 | 4.81 | 5.03 | 4.59 | 4.91 | 4.95 | 6.49 | 0.034 | 0.640 |
| Species | ||||||||||||||
| Bifidobacterium pseudolongum | 4.32a | 3.82 | 0.86b | 1.56 | 0.24b | 0.29 | 2.04ab | 2.28 | 0.67b | 0.95 | 0.86b | 1.03 | 0.019 | 0.021 |
| Lactobacillus agilis | 1.99b | 1.51 | 1.63b | 2.47 | 0.99b | 1.17 | 10.62a | 3.15 | 1.29b | 1.13 | 1.14b | 0.68 | 0.019 | <0.001 |
| Lactobacillus reuteri | 10.14 | 4.11 | 8.26 | 5.13 | 10.97 | 3.61 | 8.35 | 2.66 | 8.75 | 4.66 | 7.29 | 2.14 | 0.038 | 0.669 |
| Faecalibacteriumprausnitzii | 5.39 | 3.67 | 7.97 | 4.20 | 5.22 | 2.50 | 4.81 | 3.44 | 4.59 | 2.70 | 4.95 | 3.89 | 0.034 | 0.640 |
© 2020 by the authors. Licensee MDPI, Basel, Switzerland. This article is an open access article distributed under the terms and conditions of the Creative Commons Attribution (CC BY) license (http://creativecommons.org/licenses/by/4.0/).
Share and Cite
Józefiak, A.; Benzertiha, A.; Kierończyk, B.; Łukomska, A.; Wesołowska, I.; Rawski, M. Improvement of Cecal Commensal Microbiome Following the Insect Additive into Chicken Diet. Animals 2020, 10, 577. https://doi.org/10.3390/ani10040577
Józefiak A, Benzertiha A, Kierończyk B, Łukomska A, Wesołowska I, Rawski M. Improvement of Cecal Commensal Microbiome Following the Insect Additive into Chicken Diet. Animals. 2020; 10(4):577. https://doi.org/10.3390/ani10040577
Chicago/Turabian StyleJózefiak, Agata, Abdelbasset Benzertiha, Bartosz Kierończyk, Anna Łukomska, Izabela Wesołowska, and Mateusz Rawski. 2020. "Improvement of Cecal Commensal Microbiome Following the Insect Additive into Chicken Diet" Animals 10, no. 4: 577. https://doi.org/10.3390/ani10040577
APA StyleJózefiak, A., Benzertiha, A., Kierończyk, B., Łukomska, A., Wesołowska, I., & Rawski, M. (2020). Improvement of Cecal Commensal Microbiome Following the Insect Additive into Chicken Diet. Animals, 10(4), 577. https://doi.org/10.3390/ani10040577