The Optimal Combination of Dietary Starch, Non-Starch Polysaccharides, and Mannan-Oligosaccharide Increases the Growth Performance and Improves Butyrate-Producing Bacteria of Weaned Pigs

 , , ,
, , ,  ,
, 
Simple Summary
Abstract
1. Introduction
2. Materials and Methods
2.1. Experimental Design, Animals, and Diet
2.2. Sampling and Measurements
2.3. Growth Performance
2.4. Digestibility Determination
2.5. Serum Sample Analysis
2.6. Histological Analysis
2.7. Determination of Bacterial Community and Data Analysis
2.8. Analysis of SCFA Concentrations
2.9. Statistical Analysis
3. Results
3.1. Growth Performance
3.2. Apparent Total Tract Digestibility
3.3. Serum Biochemical Parameters
3.4. Intestinal Morphology
3.5. SCFA Contents in Serum and Hindgut
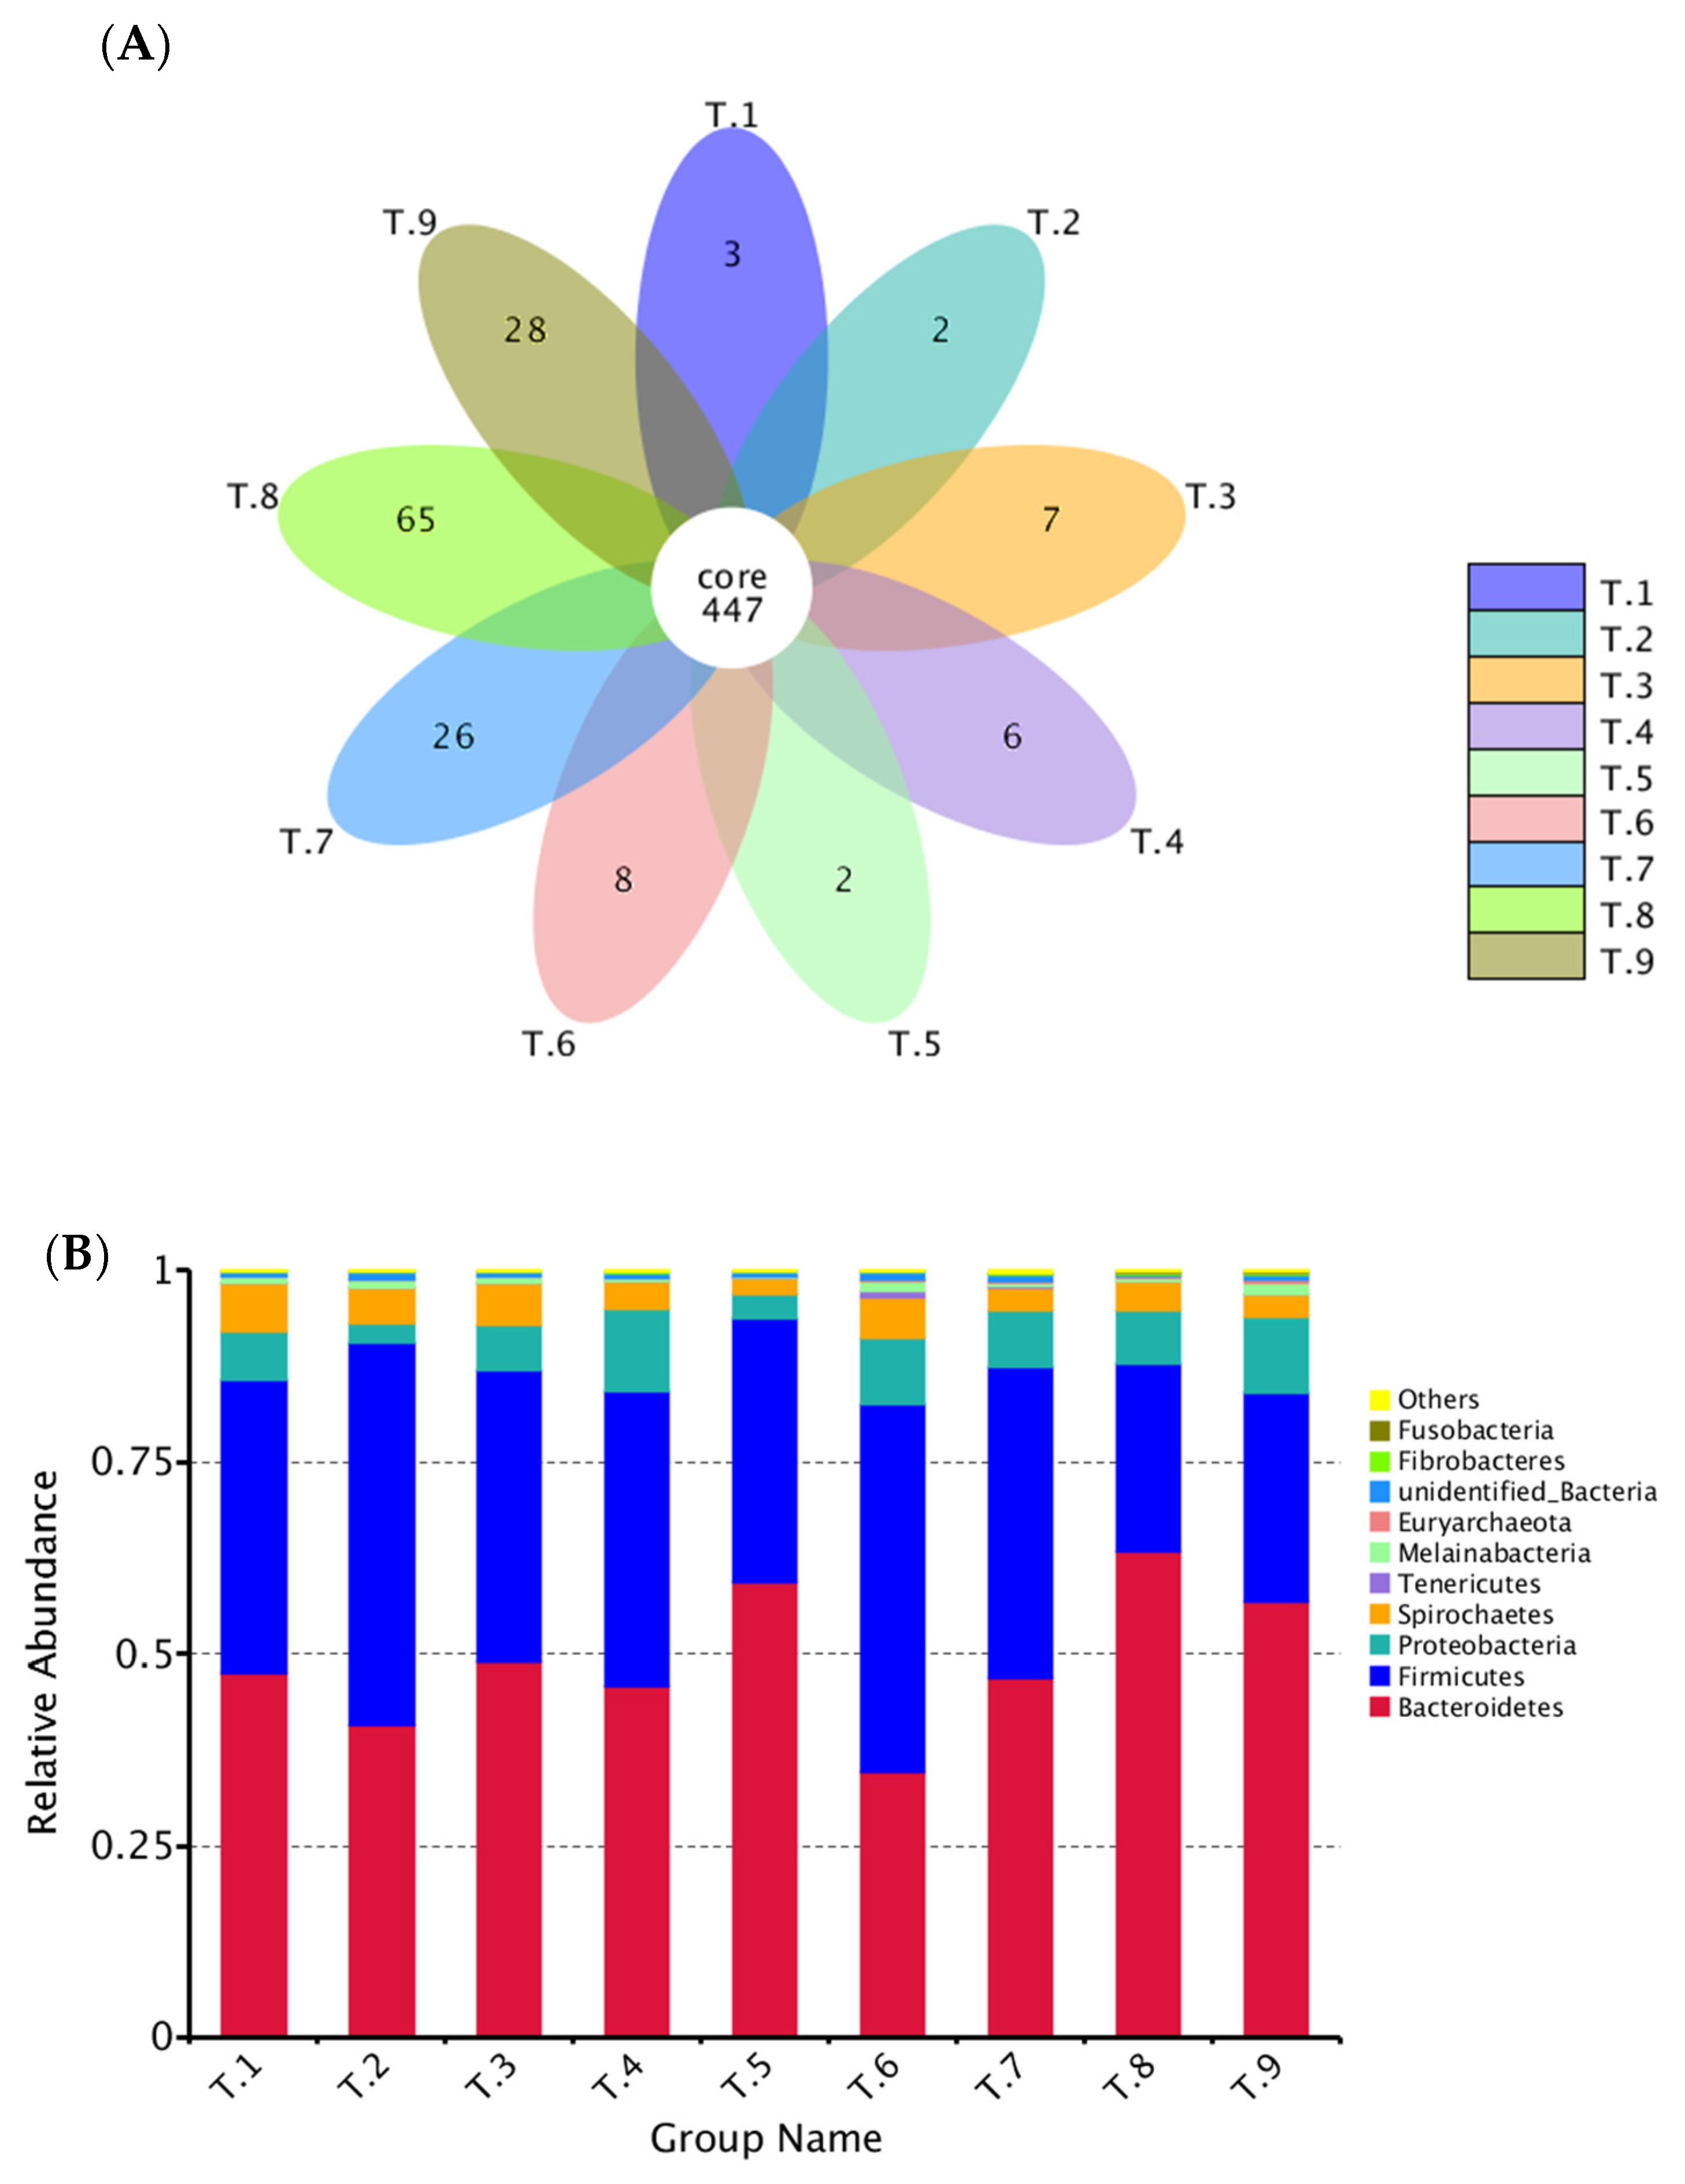
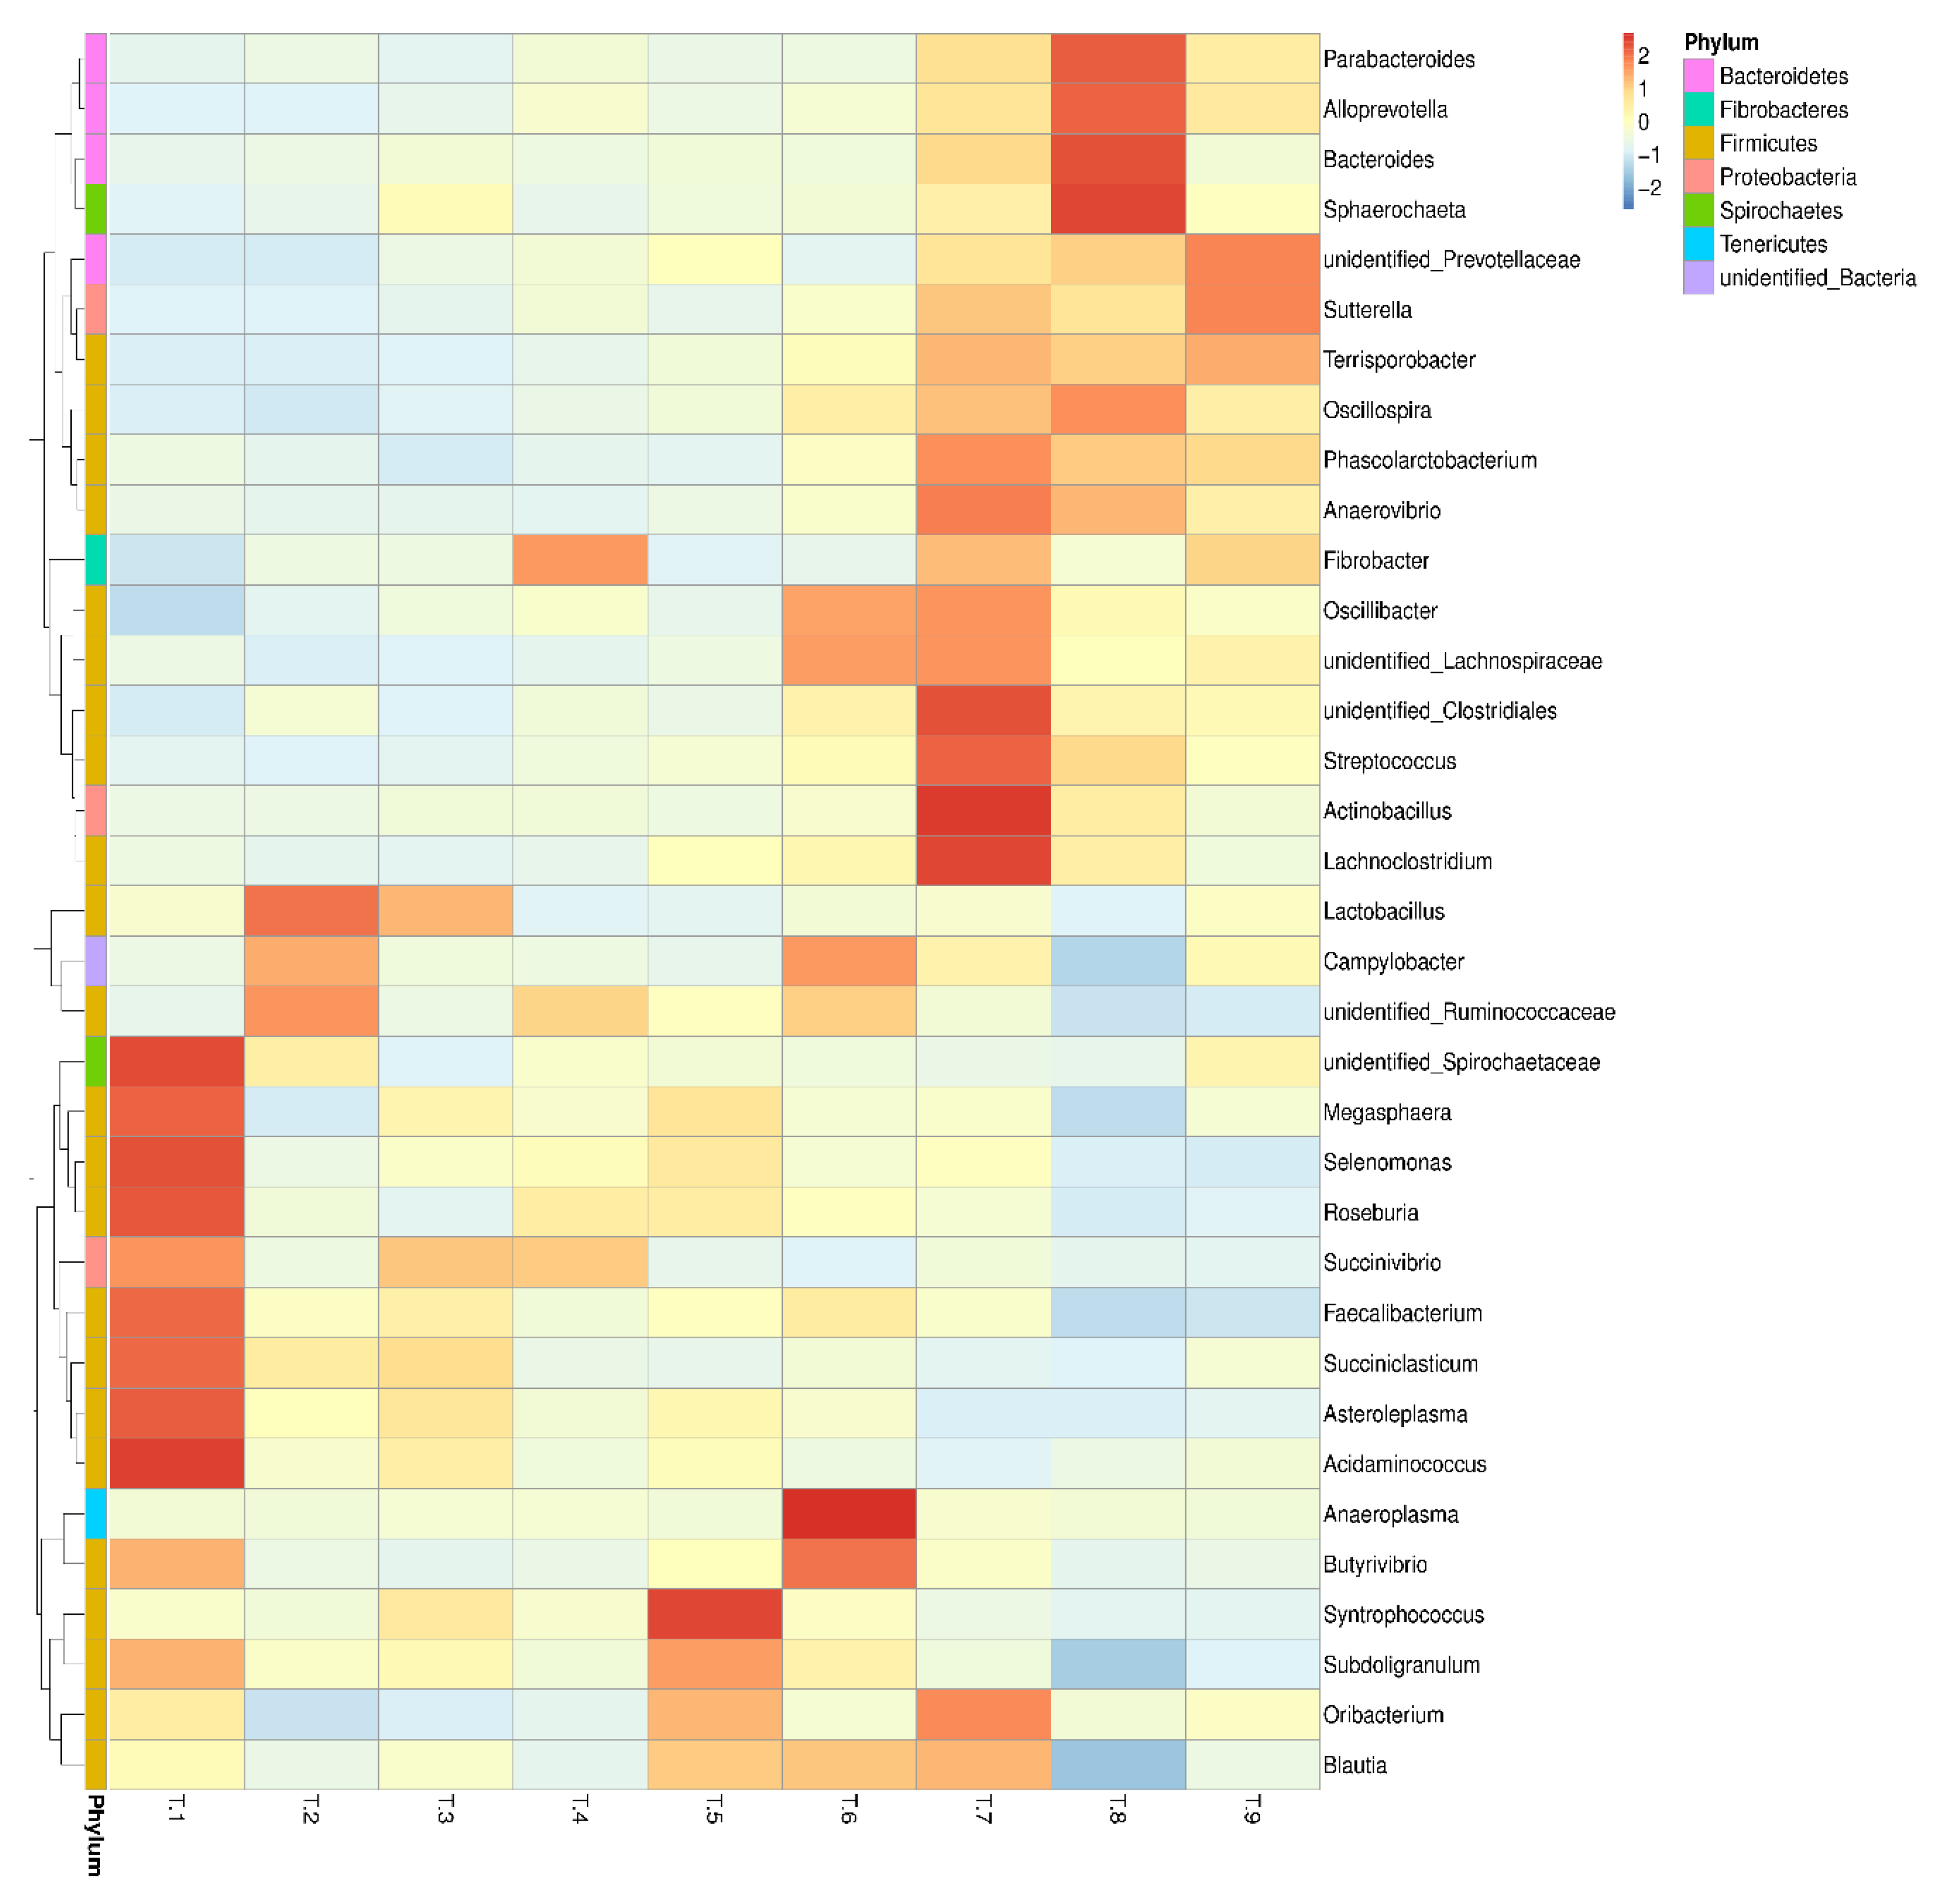
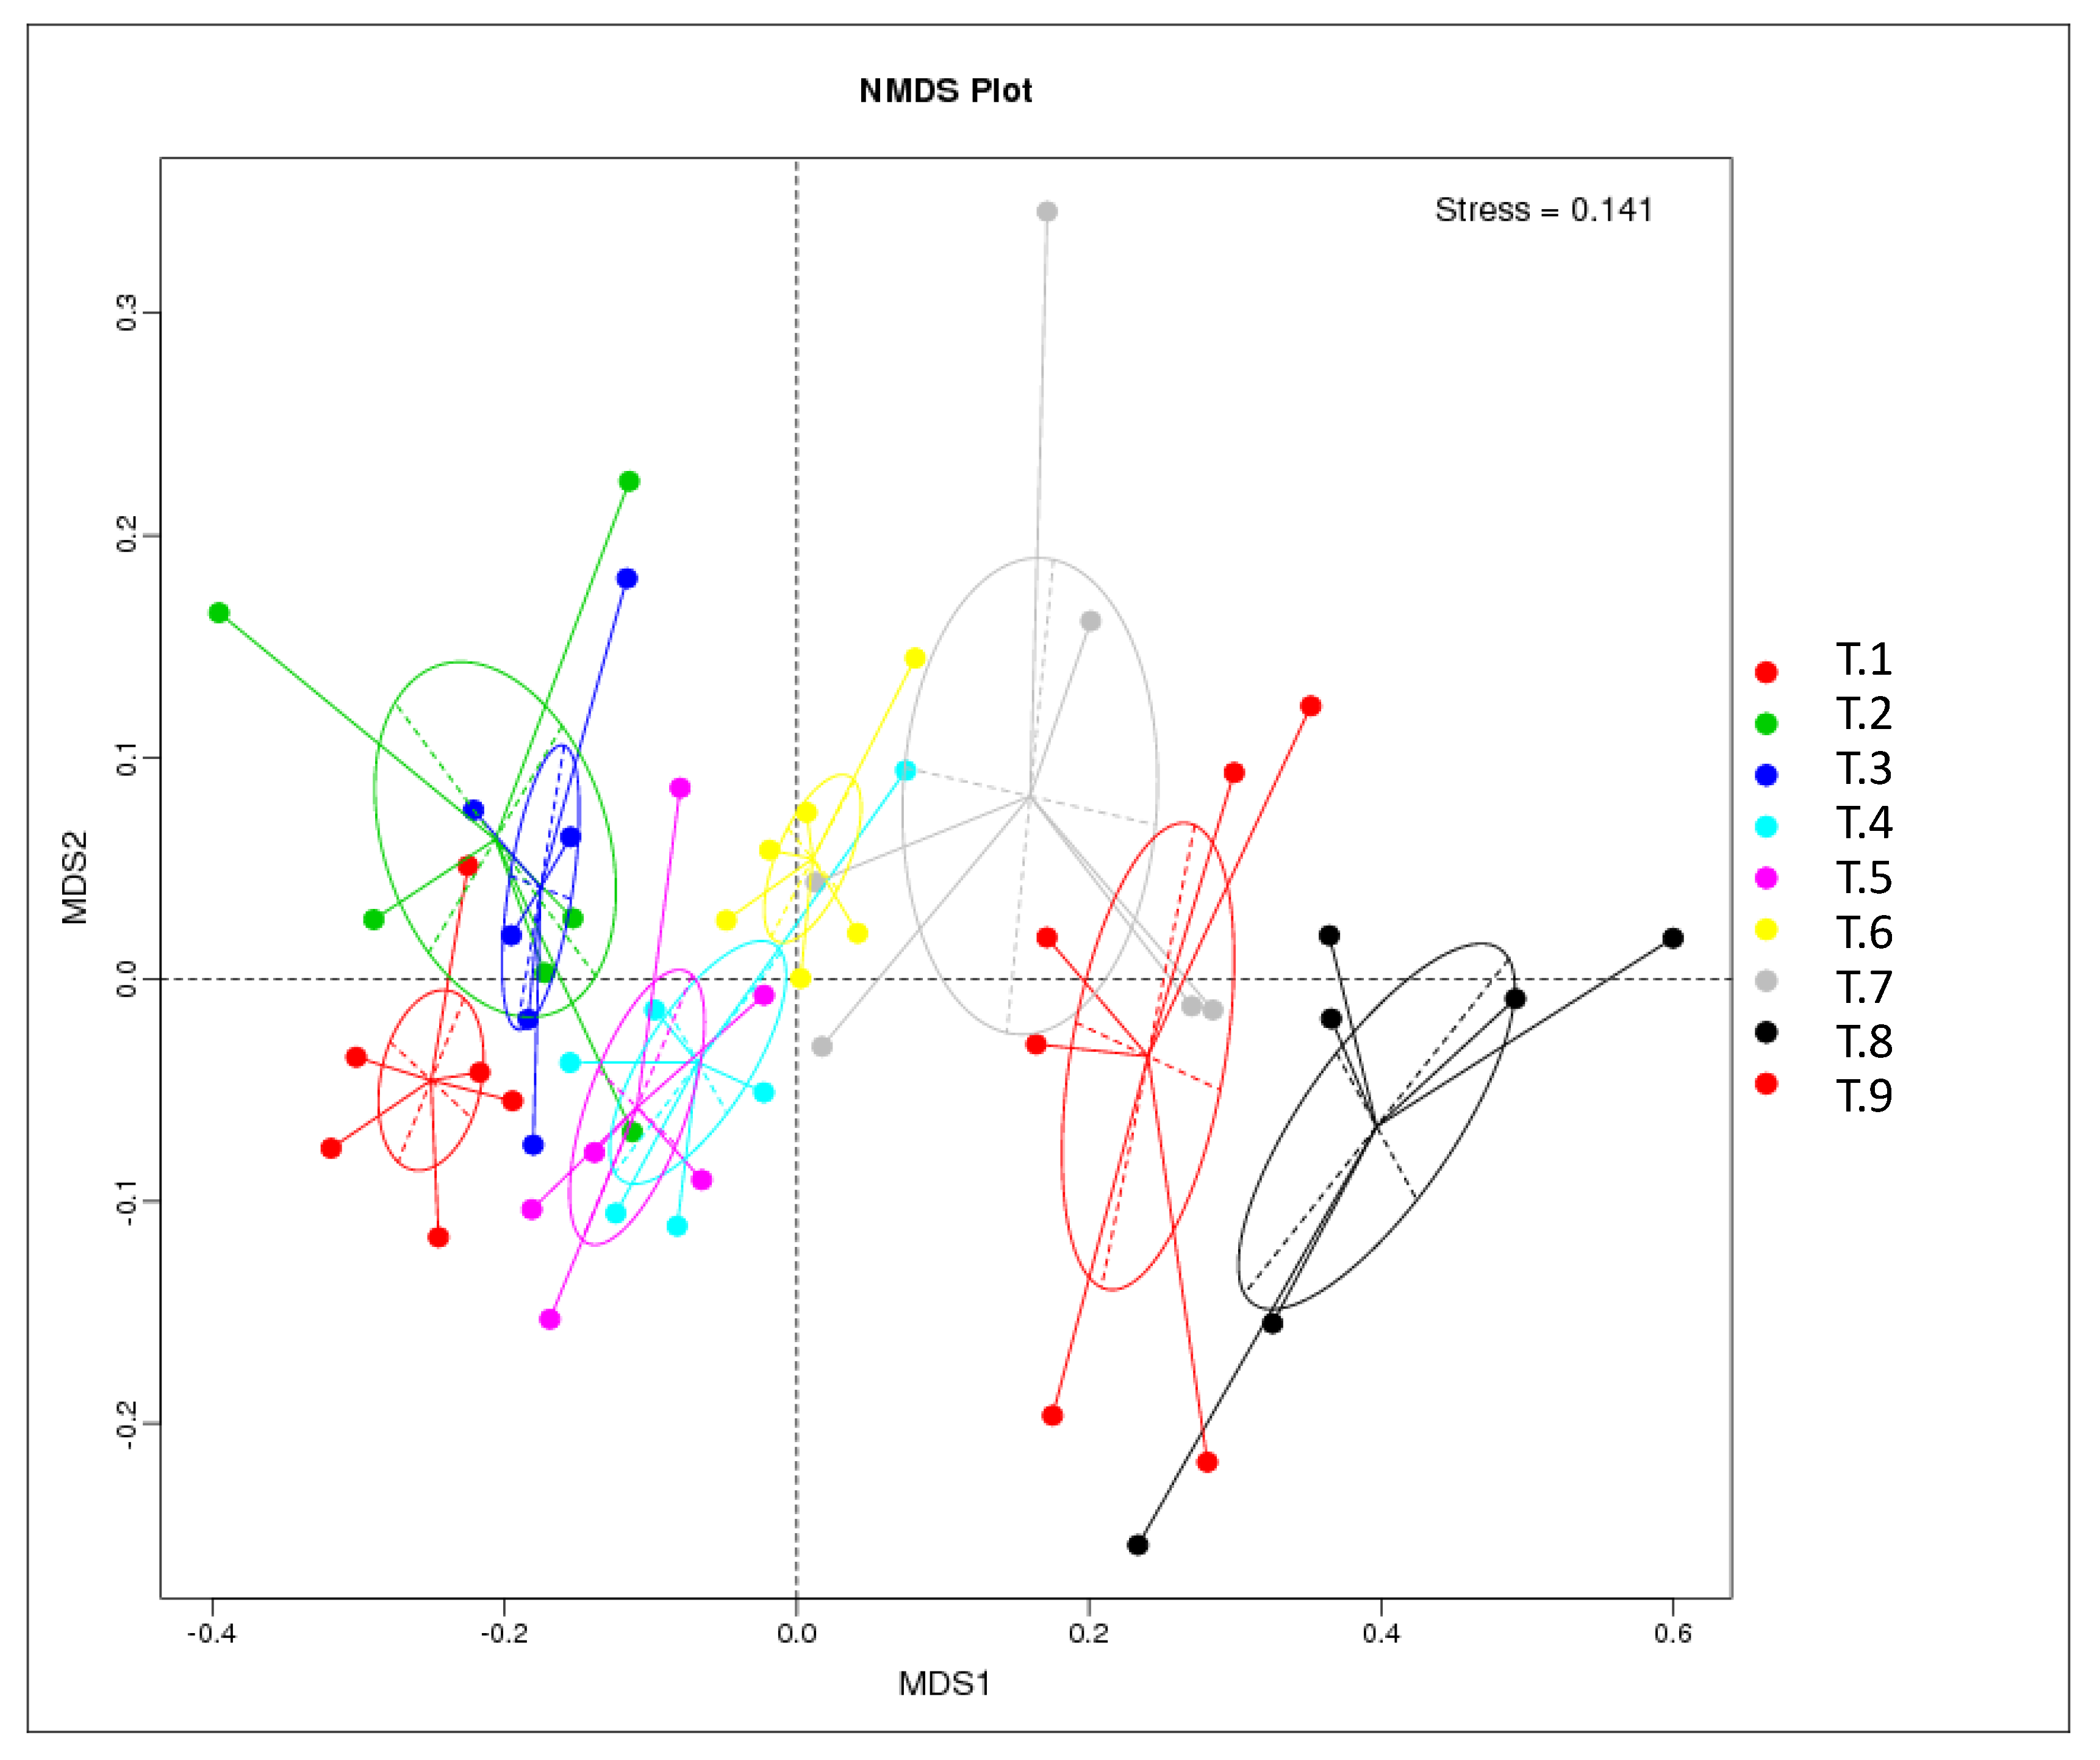
3.6. 16S rRNA Analysis of Bacterial Communities.
4. Discussion
5. Conclusions
Supplementary Materials
Author Contributions
Funding
Conflicts of Interest
References
- Bach Knudsen, K.E.; Hedemann, M.S.; Lærke, H.N. The role of carbohydrates in intestinal health of pigs. Anim. Feed Sci. Technol. 2012, 173, 41–53. [Google Scholar] [CrossRef]
- Doti, S.; Suárez-Belloch, J.; Latorre, M.A.; Guada, J.A.; Fondevila, M. Effect of dietary starch source on growth performances, digestibility and quality traits of growing pigs. Livest. Sci. 2014, 164, 119–127. [Google Scholar] [CrossRef]
- Vicente, B.; Valencia, D.G.; Perez-Serrano, M.; Lazaro, R.; Mateos, G.G. The effects of feeding rice in substitution of corn and the degree of starch gelatinization of rice on the digestibility of dietary components and productive performance of young pigs. Swine Prod. 2008, 86, 119–126. [Google Scholar] [CrossRef]
- Li, Y.J.; Li, J.R.; Zhang, L.; Gao, F. Effects of dietary starch types on growth performance, meat quality and myofibre type of finishing pigs. Meat Sci. 2017, 131, 60–67. [Google Scholar] [CrossRef] [PubMed]
- Wang, H.J.; Pu, J.N.; Chen, D.W.; Tian, G.; Mao, X.B. Effects of dietary amylose and amylopectin ratio on growth performance, meat quality, postmortem glycolysis and muscle fibre type transformation of finishing pigs. Arch. Anim. Nutr. 2019, 73, 194–207. [Google Scholar] [CrossRef] [PubMed]
- Xiang, Z.; Qi, H.; Han, G.; Liu, J.; Huang, Z.; Yu, B.; Chen, D.W. Real-time TaqMan polymerase chain reaction to quantify the effects of different sources of dietary starch on Bifidobacterium in the intestinal tract of piglets. Afr. J. Biotechnol. 2011, 10, 5059–5067. [Google Scholar] [CrossRef]
- Han, G.Q.; Xiang, Z.T.; Yu, B.; Chen, D.W.; Qi, H.W.; Mao, X.B.; Chen, H.; Mao, Q.; Huang, Z.Q. Effects of different starch sources on Bacillus spp. in intestinal tract and expression of intestinal development related genes of weanling piglets. Mol. Biol. Rep. 2012, 39, 1869–1876. [Google Scholar] [CrossRef]
- Luo, Y.H.; Yang, C.; Wright, A.D.; He, J.; Chen, D.W. Responses in ileal and cecal bacteria to low and high amylose/amylopectin ratio diets in growing pigs. Appl. Microbiol. Biotechnol. 2015, 99, 10627–10638. [Google Scholar] [CrossRef]
- Kumar, V.; Sinha, A.K.; Makkar, H.P.; De, B.G.; Becker, K. Dietary roles of non-starch polysaccharides in human nutrition: A review. Crit. Rev. Food Sci. Nutr. 2012, 52, 899–935. [Google Scholar] [CrossRef]
- Bosaeus, I. Fibre effects on intestinal functions (diarrhoea, constipation and irritable bowel syndrome). Clin. Nutr. Suppl. 2004, 1, 33–38. [Google Scholar] [CrossRef]
- Han, Y.K.; Lee, J.H. Effects of insoluble dietary fiber supplementation on performance and nutrient digestibility of weanling pigs. J. Anim. Sci. Technol. 2005, 47, 565–572. [Google Scholar] [CrossRef]
- Chen, H.; Mao, X.; Yin, J.; Yu, B.; He, J.; Che, L.; Yu, J.; Huang, Z.Q.; Zheng, P.; Michiels, J.; et al. Comparison of jejunal digestive enzyme activities, expression of nutrient transporter genes, and apparent fecal digestibility in weaned piglets fed diets with varied sources of fiber. J. Anim. Feed Sci. 2015, 24, 41–47. [Google Scholar] [CrossRef]
- Wu, X.; Chen, D.; Yu, B.; Li, Y.; Luo, Y.H.; Zheng, P.; Mao, X.B.; Yu, J.; He, J. Effect of different dietary non-starch fiber fractions on growth performance, nutrient digestibility, and intestinal development in weaned pigs. Nutrition 2018, 51–52, 20–28. [Google Scholar] [CrossRef] [PubMed]
- Lindberg, J.E. Fiber effects in nutrition and gut health in pigs. J. Anim. Sci. Biotechnol. 2014, 5, 273–279. [Google Scholar] [CrossRef] [PubMed]
- Chen, T.T.; Chen, D.W.; Tian, G.; Zheng, P.; Mao, X.B.; Yu, J.; He, J.; Huang, Z.Q.; Luo, Y.H.; Luo, J.Q.; et al. Effects of soluble and insoluble dietary fiber supplementation on growth performance, nutrient digestibility, intestinal microbe and barrier function in weaning piglet. Anim. Feed Sci. Technol. 2019, 260. [Google Scholar] [CrossRef]
- Desai, M.S.; Seekatz, A.M.; Koropatkin, N.M.; Kamada, N.; Hickey, C.A.; Wolter, M.; Pudlo, N.A.; Kitamoto, S.; Terrapon, N.; Muller, A.; et al. A dietary fiber-deprived gut microbiota degrades the colonic mucus barrier and enhances pathogen susceptibility. Cell 2016, 167, 1339–1353. [Google Scholar] [CrossRef] [PubMed]
- Mikkelsen, L.L.; Bach Knudsen, K.E.; Jensen, B.B. In vitro fermentation of fructo-oligosaccharides and transgalacto-oligosaccharides by adapted and unadapted bacterial populations from the gastrointestinal tract of piglets. Anim. Feed Sci. Technol. 2004, 116, 225–238. [Google Scholar] [CrossRef]
- Mølbak, L.; Thomsen, L.E.; Jensen, T.K.; Bach Knudsen, K.E.; Boye, M. Increased amount of Bifidobacterium thermacidophilum and Megasphaera elsdenii in the colonic microbiota of pigs fed a swine dysentery preventive diet containing chicory roots and sweet lupine. J. Appl. Microbiol. 2007, 103, 1853–1867. [Google Scholar] [CrossRef]
- Wellock, I.J.; Fortomaris, P.D.; Houdijk, J.G.; Wiseman, J.; Kyriazakis, I. The consequences of non-starch polysaccharide solubility and inclusion level on the health and performance of weaned pigs challenged with enterotoxigenic Escherichia coli. Br. J. Nutr. 2008, 99, 520–530. [Google Scholar] [CrossRef]
- Miguel, J. Efficacy of a mannan oligosacharide and antimicrobial on the gasrointestinal microbiota of young pigs. J. Anim. Sci. 2006, 84, 44. [Google Scholar]
- Che, T.M.; Johnson, R.W.; Kelley, K.W.; Van Alstine, W.G.; Dawson, K.A.; Moran, C.A.; Pettigrew, J.E. Mannan oligosaccharide improves immune responses and growth efficiency of nursery pigs experimentally infected with porcine reproductive and respiratory syndrome virus. J. Anim. Sci. 2013, 91, 5668–5679. [Google Scholar] [CrossRef]
- Wenner, B.A.; Zerby, H.N.; Boler, D.D.; Gebreyes, W.A.; Moeller, S.J. Effect of mannan oligosaccharides (Bio-Mos) and outdoor access housing on pig growth, feed efficiency and carcass composition. J. Anim. Sci. 2013, 91, 4936–14944. [Google Scholar] [CrossRef] [PubMed]
- Wang, R.L.; Hou, Z.P.; Wang, B.; Liu, Z.Q.; Fatufe, A.A. Effects of feeding galactomannan oligosaccharides on growth performance, serum antibody levels and intestinal microbiota in newly-weaned pigs. J. Food Agric. Environ. 2010, 8, 47–55. [Google Scholar]
- Xu, Z.R.; Hu, C.H.; Xia, M.S.; Zhan, X.A.; Wang, M.Q. Effects of dietary fructooligosaccharide on digestiveenzyme activities, intestinal microflora and morphology ofgrowing pigs. Asian-Australas J. Anim. Sci. 2002, 1784–1789. [Google Scholar] [CrossRef]
- Chen, H.; Mao, X.; He, J.; Yu, B.; Huang, Z.; Yu, J.; Zheng, P.; Chen, D.W. Dietary fibre affects intestinal mucosal barrier function and regulates intestinal bacteria in weaning piglets. Br. J. Nutr. 2013, 110, 1837–1848. [Google Scholar] [CrossRef] [PubMed]
- Zhang, Y.; Chen, D.W.; Yu, B.; He, J.; Yu, J.; Mao, X.B.; Wnag, J.X.; Luo, J.Q.; Huang, Z.Q.; Cheng, G.X.; et al. Spray-dried chicken plasma improves intestinal digestive function and regulates intestinal selected microflora in weaning piglets. J. Anim. Sci. 2015, 93, 2967–2976. [Google Scholar] [CrossRef]
- AOAC. Official Methods of Analysis, 16th ed.; AOAC International: Washington, DC, USA, 1995; Volume 1. [Google Scholar]
- Touchette, K.J.; Carroll, J.A.; Allee, G.L.; Matteri, R.L.; Dyer, C.J.; Beausang, L.A.; Zannelli, M.E. Effect of spray-dried plasma and lipopolysaccharide exposure on weaned pigs: I. Effects on the immune axis of weaned pigs. J. Anim. Sci. 2002, 80, 494–501. [Google Scholar] [CrossRef]
- Bruce-Keller, A.J.; Salbaum, J.M.; Luo, M.; Blanchard, E.; Taylor, C.M.; Welsh, D.A.; Berthoud, H. Obese-type gut microbiota induce neurobehavioral changes in the absence of obesity. Biol. Psychiatry 2015, 77, 607–615. [Google Scholar] [CrossRef]
- Luo, Y.; Zhang, L.; Li, H.; Smidt, H.; Wright, A.-D.G.; Zhang, K.; Ding, X.M.; Zeng, Q.F.; Bai, S.P.; Wang, J.P.; et al. Different types of dietary fibers trigger specific alterations in composition and predicted functions of colonic bacterial communities in BALB/c mice. Front. Microbiol. 2017, 8, 966. [Google Scholar] [CrossRef]
- Franklin, M.A.; Mathew, A.G.; Vickers, J.R.; Clift, R.A. Characterization of microbial populations and volatile fatty acid concentrations in the jejunum, ileum, and cecum of pigs weaned at 17 vs 24 days of age. J. Anim. Sci. 2002, 80, 2904–2910. [Google Scholar] [CrossRef]
- Bach Knudsen, K.E. Triennial growth symposium: Effects of polymeric carbohydrates on growth and development in pigs. J. Anim. Sci. 2011, 89, 1965–1980. [Google Scholar] [CrossRef] [PubMed]
- Sluijs, I.; van der Schouw, Y.T.; van der A., D.L.; Spijkerman, A.M.; Hu, F.B.; Grobbee, D.E.; Beulens, J.W. Carbohydrate quantity and quality and risk of type 2 diabetes in the European Prospective Investigation into Cancer and Nutrition-Netherlands (EPIC-NL) study. Am. J. Clin. Nutr. 2010, 92, 905–911. [Google Scholar] [CrossRef] [PubMed]
- Alessa, H.B.; Bhupathiraju, S.N.; Malik, V.S.; Wedick, N.M.; Hu, F.B. Carbohydrate quality and quantity and risk of type 2 diabetes in US women. Am. J. Clin. Nutr. 2015, 102, 1543–1553. [Google Scholar] [CrossRef] [PubMed]
- Singh, J.; Dartois, A.; Kaur, L. Starch digestibility in food matrix: A review. Trends Food Sci. Technol. 2010, 21, 170–180. [Google Scholar] [CrossRef]
- Deng, J.; Wu, X.; Bin, S.; Li, T.J.; Huang, R.; Liu, Y.; Ruan, Z.; Deng, Z.; Hou, Y.; Yin, Y.L. Dietary amylose and amylopectin ratio and resistant starch content affects plasma glucose, lactic acid, hormone levels and protein synthesis in splanchnic tissues. J. Anim. Physiol. Anim. Nutr. 2010, 94, 220–226. [Google Scholar] [CrossRef] [PubMed]
- Halas, V.; Nochta, I. Mannan oligosaccharides in nursery pig nutrition and their potential mode of action. Animals 2012, 2, 261–274. [Google Scholar] [CrossRef]
- Davis, M.E.; Maxwell, C.V.; Brown, D.C.; de Rodas, B.Z.; Johnson, Z.B.; Kegley, E.B.; Hellwig, D.H.; Dvorak, R.A. Effect of dietary mannan oligosaccharides and (or) pharmacological additions of copper sulfate on growth performance and immunocompetence of weanling and growing/finishing pigs. J. Anim. Sci. 2002, 80, 2887–2894. [Google Scholar] [CrossRef]
- Kim, J.D.; Hyun, Y.; Sohn, K.S.; Woo, H.J.; Han, I.K. Effects of immunostimulators on growth performance and immune response in pigs weaned at 21 days of age. J. Anim. Feed Sci. 2000, 9, 333–346. [Google Scholar] [CrossRef]
- Gao, X.; Yu, B.; Yu, J.; Mao, X.; Huang, Z.; Luo, Y.; Luo, J.; Zheng, P.; He, J.; Chen, D. Effects of dietary starch structure on growth performance, serum glucose–insulin response, and intestinal health in weaned piglets. Animals 2020, 10, 543. [Google Scholar] [CrossRef]
- Dibner, J.; Richards, J. The digestive system: Challenges and opportunities. J. Appl. Poult. Res. 2004, 13, 86–93. [Google Scholar] [CrossRef]
- Pluske, J.R.; Williams, I.H.; Aherne, F.X. Maintenance of villous height and crypt depth in piglets by providing continuous nutrition after weaning. Anim. Sci. 1996, 62, 131–144. [Google Scholar] [CrossRef]
- Turnbaugh, P.J.; Ley, R.E.; Mahowald, M.A.; Magrini, V.; Mardis, E.R.; Gordon, J.I. An obesity-associated gut microbiome with increased capacity for energy harvest. Nature 2006, 444, 1027–1031. [Google Scholar] [CrossRef] [PubMed]
- Han, M.; Liu, P.; Li, D.; Li, Y.; Ma, X. Dietary fiber gap and host gut microbiota. Protein Pept. Lett. 2017, 24, 388–396. [Google Scholar] [CrossRef]
- Morrison, D.J.; Preston, T. Formation of short chain fatty acids by the gut microbiota and their impact on human metabolism. Gut Microbes 2016, 7, 189–200. [Google Scholar] [CrossRef] [PubMed]
- Zeng, X.; Sunkara, L.T.; Jiang, W.; Bible, M.; Carter, S.; Ma, X.; Qiao, S.Y.; Zhang, G.L. Induction of porcine host defense peptide gene expression by short-chain fatty acids and their analogs. PLoS ONE 2013, 8, e72922. [Google Scholar] [CrossRef]
- Tian, L.; Bruggeman, G.; van den berg, M.; Borewicz, K.; Scheurink, A.W.; Bruininx, E.; de Vos, P.; Smidt, H.; Schols, H.A.; Gruppen, H. Effects of pectin on fermentation characteristics, carbohydrate utilization, and microbial community composition in the gastrointestinal tract of weaning pigs. Mol. Nutr. Food. Res. 2017, 61. [Google Scholar] [CrossRef] [PubMed]
- Louis, P.; Flint, H.J. Formation of propionate and butyrate by the human colonic microbiota. Environ. Microbiol. 2017, 19, 29–41. [Google Scholar] [CrossRef]
- Frost, G.; Sleeth, M.; Sahuri, M.; Lizarbe, B.; Cerdán, S.; Brody, L.; Anastasovska, J.; Ghourab, S.; Hankir, M.; Zhang, S.; et al. The short-chain fatty acid acetate reduces appetite via a central homeostatic mechanism. Nat. Commun. 2014, 5, 3611. [Google Scholar] [CrossRef]


| Groups | A | B | C |
|---|---|---|---|
| Different Ratio of Amylose to Amylopectin | Levels of NSP (Mixture of Inulin with Cellulose by 1:1) | Levels of MOS | |
| T1 | 2:1 (A1) | 1% (B1) | 400 mg/kg (C1) |
| T2 | 2:1 (A1) | 2% (B2) | 800 mg/kg (C2) |
| T3 | 2:1 (A1) | 3% (B3) | 1200 mg/kg (C3) |
| T4 | 1:1 (A2) | 1% (B1) | 800 mg/kg (C2) |
| T5 | 1:1 (A2) | 2% (B2) | 1200 mg/kg (C3) |
| T6 | 1:1 (A2) | 3% (B3) | 400 mg/kg (C1) |
| T7 | 1:2 (A3) | 1% (B1) | 1200 mg/kg (C3) |
| T8 | 1:2 (A3) | 2% (B2) | 400 mg/kg (C1) |
| T9 | 1:2 (A3) | 3% (B3) | 800 mg/kg (C2) |
| Ingredients, % | Different Combinations of Starch, NSP, and MOS | ||||||||
|---|---|---|---|---|---|---|---|---|---|
| T1 | T2 | T3 | T4 | T5 | T6 | T7 | T8 | T9 | |
| Maize | 16.71 | 15.82 | 14.93 | 17.62 | 15.68 | 14.06 | 17.11 | 15.33 | 13.47 |
| Puffed maize | 10.00 | 10.00 | 10.00 | 10.00 | 10.00 | 10.00 | 10.00 | 10.00 | 10.00 |
| Soybean meal | 13.20 | 13.35 | 13.50 | 13.05 | 13.36 | 13.65 | 13.12 | 13.43 | 13.74 |
| Puffing of soybean | 7.00 | 7.00 | 7.00 | 7.00 | 7.00 | 7.00 | 7.00 | 7.00 | 7.00 |
| Soy protein concentrate | 5.00 | 5.00 | 5.00 | 5.00 | 5.00 | 5.00 | 5.00 | 5.00 | 5.00 |
| Whey powder | 5.00 | 5.00 | 5.00 | 5.00 | 5.00 | 5.00 | 5.00 | 5.00 | 5.00 |
| Fish meal | 3.00 | 3.00 | 3.00 | 3.00 | 3.00 | 3.00 | 3.00 | 3.00 | 3.00 |
| Plasma protein powder | 3.00 | 3.00 | 3.00 | 3.00 | 3.00 | 3.00 | 3.00 | 3.00 | 3.00 |
| Glucose | 2.00 | 2.00 | 2.00 | 2.00 | 2.00 | 2.00 | 2.00 | 2.00 | 2.00 |
| Soybean oil | 0.20 | 0.85 | 1.50 | 0.30 | 0.84 | 1.40 | 0.25 | 0.80 | 1.35 |
| Conventional maize starch | 11.90 | 12.35 | 12.60 | ||||||
| High amylose maize starch | 30.70 | 29.75 | 28.80 | 17.90 | 17.50 | 17.10 | 3.80 | 3.80 | 3.78 |
| High amylopectin maize starch | 26.45 | 26.45 | 26.45 | ||||||
| Cellulose | 0.50 | 1.00 | 1.50 | 0.50 | 1.00 | 1.50 | 0.50 | 1.00 | 1.50 |
| Inulin | 0.50 | 1.00 | 1.50 | 0.50 | 1.00 | 1.50 | 0.50 | 1.00 | 1.50 |
| Mannan-oligosaccharide | 0.04 | 0.08 | 0.12 | 0.08 | 0.12 | 0.04 | 0.12 | 0.04 | 0.08 |
| Limestone | 0.45 | 0.45 | 0.45 | 0.45 | 0.45 | 0.45 | 0.45 | 0.45 | 0.45 |
| Dicalcium phosphate | 1.25 | 1.25 | 1.25 | 1.25 | 1.25 | 1.25 | 1.25 | 1.25 | 1.25 |
| L-Lysine-HCl | 0.29 | 0.29 | 0.29 | 0.29 | 0.29 | 0.29 | 0.29 | 0.29 | 0.29 |
| DL-Methionine | 0.12 | 0.12 | 0.12 | 0.12 | 0.12 | 0.12 | 0.12 | 0.12 | 0.12 |
| L-Threonine | 0.13 | 0.13 | 0.13 | 0.13 | 0.13 | 0.13 | 0.13 | 0.13 | 0.13 |
| L-Tryptophan | 0.01 | 0.01 | 0.01 | 0.01 | 0.01 | 0.01 | 0.01 | 0.01 | 0.01 |
| Vitamin premix ‡ | 0.05 | 0.05 | 0.05 | 0.05 | 0.05 | 0.05 | 0.05 | 0.05 | 0.05 |
| Mineral premix † | 0.45 | 0.45 | 0.45 | 0.45 | 0.45 | 0.45 | 0.45 | 0.45 | 0.45 |
| NaCl | 0.25 | 0.25 | 0.25 | 0.25 | 0.25 | 0.25 | 0.25 | 0.25 | 0.25 |
| Choline chloride | 0.15 | 0.15 | 0.15 | 0.15 | 0.15 | 0.15 | 0.15 | 0.15 | 0.15 |
| Total | 100 | 100 | 100 | 100 | 100 | 100 | 100 | 100 | 100 |
| Nutrient Concentrations | Different Combinations of Starch, NSP, and MOS | ||||||||
|---|---|---|---|---|---|---|---|---|---|
| T1 | T2 | T3 | T4 | T5 | T6 | T7 | T8 | T9 | |
| Calculated values ‡ | |||||||||
| CP, % | 19.00 | 19.00 | 19.00 | 19.00 | 19.00 | 19.00 | 19.00 | 19.00 | 19.00 |
| NE, MJ/kg | 11.07 | 11.07 | 11.07 | 11.07 | 11.07 | 11.07 | 11.07 | 11.07 | 11.07 |
| CF, % | 2.30 | 3.22 | 4.13 | 2.31 | 3.21 | 4.12 | 2.31 | 3.22 | 4.12 |
| SID-Lysine, % | 1.23 | 1.23 | 1.23 | 1.23 | 1.23 | 1.23 | 1.23 | 1.23 | 1.23 |
| SID-Methionine, % | 0.36 | 0.36 | 0.36 | 0.36 | 0.36 | 0.36 | 0.36 | 0.36 | 0.36 |
| SID-Threonine, % | 0.73 | 0.73 | 0.73 | 0.73 | 0.73 | 0.73 | 0.73 | 0.73 | 0.73 |
| SID-Tryptophan, % | 0.20 | 0.20 | 0.20 | 0.20 | 0.20 | 0.20 | 0.20 | 0.20 | 0.20 |
| Calcium, % | 0.70 | 0.70 | 0.70 | 0.70 | 0.70 | 0.70 | 0.70 | 0.70 | 0.70 |
| Available P, % | 0.45 | 0.45 | 0.45 | 0.45 | 0.45 | 0.45 | 0.45 | 0.45 | 0.45 |
| Analyzed values | |||||||||
| CP, % | 20.46 | 20.71 | 20.43 | 20.39 | 20.45 | 20.23 | 20.39 | 20.57 | 20.23 |
| CF, % | 1.76 | 2.34 | 2.98 | 1.73 | 2.45 | 3.05 | 1.62 | 2.19 | 2.86 |
| GE, MJ/kg | 16.41 | 16.49 | 16.70 | 16.37 | 16.47 | 16.65 | 316.29 | 16.39 | 16.57 |
| Amylose content †, % | 68.11 | 67.94 | 69.73 | 49.59 | 49.15 | 49.86 | 33.60 | 35.89 | 34.79 |
| Amylopectincontent †, % | 31.89 | 32.06 | 30.27 | 50.41 | 50.85 | 50.14 | 66.40 | 64.11 | 65.21 |
| Amylose/Amylopectin | 2.14 | 2.12 | 2.30 | 0.98 | 0.97 | 0.99 | 0.51 | 0.56 | 0.53 |
| Items | Different Combinations of Starch, NSP, and MOS | SEM | p Values | ||||||||
|---|---|---|---|---|---|---|---|---|---|---|---|
| T1 | T2 | T3 | T4 | T5 | T6 | T7 | T8 | T9 | |||
| d 0 BW, kg | 6.70 | 6.70 | 6.71 | 6.70 | 6.70 | 6.70 | 6.71 | 6.71 | 6.71 | 0.00 | 0.71 |
| d 28 BW, kg | 16.20 | 17.17 | 17.24 | 16.30 | 16.79 | 17.44 | 15.85 | 16.33 | 16.09 | 0.43 | 0.12 |
| ADFI, g | 487.53 | 533.82 | 527.41 | 506.23 | 527.34 | 537.27 | 488.19 | 489.58 | 497.73 | 20.85 | 0.45 |
| ADG, g | 339.29 | 373.77 | 376.27 | 342.94 | 360.32 | 383.29 | 326.43 | 343.61 | 335.32 | 15.57 | 0.12 |
| G:F | 0.695 a,b | 0.700 a,b | 0.714 a | 0.678 b | 0.683 a,b | 0.713 a | 0.668 b | 0.702 a,b | 0.673 b | 0.01 | 0.02 |
| Diarrhea incidence, % | 10.00 | 9.46 | 9.05 | 12.38 | 11.25 | 9.28 | 13.75 | 11.85 | 11.01 | 0.01 | 0.06 |
| Group | Factors and Their Level | Results | ||||||
| A | B | C | d 28 BW (kg) | ADFI (g) | ADG (g) | G:F | Diarrhea incidence (%) | |
| T1 | A1 | B1 | C1 | 16.20 | 487.53 | 339.29 | 0.695 | 10.00 |
| T2 | A1 | B2 | C2 | 17.17 | 533.82 | 373.77 | 0.700 | 9.46 |
| T3 | A1 | B3 | C3 | 17.24 | 527.41 | 376.27 | 0.714 | 9.05 |
| T4 | A2 | B1 | C2 | 16.30 | 506.23 | 342.94 | 0.678 | 12.38 |
| T5 | A2 | B2 | C3 | 16.79 | 527.34 | 360.32 | 0.683 | 11.25 |
| T6 | A2 | B3 | C1 | 17.44 | 537.27 | 383.29 | 0.713 | 9.28 |
| T7 | A3 | B1 | C3 | 15.85 | 488.19 | 326.43 | 0.668 | 13.75 |
| T8 | A3 | B2 | C1 | 16.33 | 489.58 | 343.61 | 0.702 | 11.85 |
| T9 | A3 | B3 | C2 | 16.09 | 497.73 | 335.32 | 0.673 | 11.01 |
| Indicator | Value name | Factors | ||||||
| A | B | C | ||||||
| d 28 BW (kg) | k1‡ | 16.87 | 16.12 | 16.66 | ||||
| k2 | 16.84 | 16.76 | 16.52 | |||||
| k3 | 16.09 | 16.92 | 16.63 | |||||
| Range R1 † | 0.78 | 0.81 | 0.13 | |||||
| Optimal combination | A1 | B3 | C1 | |||||
| ADFI (g) | k1 | 516.25 | 493.98 | 504.79 | ||||
| k2 | 523.61 | 516.91 | 512.59 | |||||
| k3 | 491.83 | 520.80 | 514.31 | |||||
| Range R2 | 31.78 | 26.82 | 9.52 | |||||
| Optimal combination | A2 | B3 | C3 | |||||
| ADG (g) | k1 | 363.11 | 336.22 | 355.40 | ||||
| k2 | 362.18 | 359.23 | 350.67 | |||||
| k3 | 335.12 | 364.96 | 354.34 | |||||
| Range R3 | 27.99 | 28.74 | 4.72 | |||||
| Optimal combination | A1 | B3 | C1 | |||||
| G:F | k1 | 0.703 | 0.680 | 0.703 | ||||
| k2 | 0.691 | 0.695 | 0.684 | |||||
| k3 | 0.681 | 0.700 | 0.688 | |||||
| Range R4 | 0.0218 | 0.0198 | 0.0196 | |||||
| Optimal combination | A1 | B3 | C1 | |||||
| Diarrhea incidence (%) | k1 | 9.23 | 12.04 | 10.58 | ||||
| k2 | 11.17 | 10.85 | 10.95 | |||||
| k3 | 12.20 | 9.70 | 11.07 | |||||
| Range R5 | 2.98 | 2.34 | 0.50 | |||||
| Optimal combination | A1 | B3 | C1 | |||||
| Group | Factors and Their Levels | Results | ||||||
| A | B | C | d 28 BW (kg) | ADFI (g) | ADG (g) | G:F | Diarrhea Incidence (%) | |
| T1 | A1 | B1 | C1 | 16.20 | 487.53 | 339.29 | 0.695 | 10.00 |
| T2 | A1 | B2 | C2 | 17.17 | 533.82 | 373.77 | 0.700 | 9.46 |
| T3 | A1 | B3 | C3 | 17.24 | 527.41 | 376.27 | 0.714 | 9.05 |
| T4 | A2 | B1 | C2 | 16.30 | 506.23 | 342.94 | 0.678 | 12.38 |
| T5 | A2 | B2 | C3 | 16.79 | 527.34 | 360.32 | 0.683 | 11.25 |
| T6 | A2 | B3 | C1 | 17.44 | 537.27 | 383.29 | 0.713 | 9.28 |
| T7 | A3 | B1 | C3 | 15.85 | 488.19 | 326.43 | 0.668 | 13.75 |
| T8 | A3 | B2 | C1 | 16.33 | 489.58 | 343.61 | 0.702 | 11.85 |
| T9 | A3 | B3 | C2 | 16.09 | 497.73 | 335.32 | 0.673 | 11.01 |
| Indicators | Sources of variation | Three-way ANOVA analysis | ||||||
| df | SS | MS | F | p-Value | ||||
| d 28 BW (kg) | A | 2 | 7.02 | 3.51 | 2.48 | 0.09 | ||
| B | 2 | 6.57 | 3.28 | 2.32 | 0.11 | |||
| C | 2 | 0.17 | 0.09 | 0.06 | 0.94 | |||
| ADFI (g) | A | 2 | 9963.42 | 4981.71 | 1.83 | 0.17 | ||
| B | 2 | 7562.62 | 3781.31 | 1.39 | 0.26 | |||
| C | 2 | 926.19 | 463.09 | 0.17 | 0.84 | |||
| ADG (g) | A | 2 | 9100.16 | 4550.08 | 2.87 | 0.07 | ||
| B | 2 | 8332.28 | 4166.14 | 2.62 | 0.08 | |||
| C | 2 | 221.05 | 110.53 | 0.07 | 0.93 | |||
| G:F | A | 2 | 0.0043 | 0.0022 | 3.39 | 0.04 | ||
| B | 2 | 0.0039 | 0.0020 | 3.09 | 0.06 | |||
| C | 2 | 0.0038 | 0.0019 | 3.01 | 0.06 | |||
| Diarrhea incidence (%) | A | 2 | 65.70 | 32.85 | 3.99 | 0.02 | ||
| B | 2 | 46.09 | 23.04 | 2.80 | 0.07 | |||
| C | 2 | 8.60 | 4.30 | 0.52 | 0.60 | |||
| Items | Different Combinations of Starch, NSP, and MOS | SEM | p Values | ||||||||
|---|---|---|---|---|---|---|---|---|---|---|---|
| T1 | T2 | T3 | T4 | T5 | T6 | T7 | T8 | T9 | |||
| DM, % | 79.67 e | 82.11 c,d,e | 80.29 e | 85.32 a,b,c | 86.38 a,b | 88.15a | 84.63 b,c | 83.81 b,c,d | 81.10 d,e | 0.73 | <0.01 |
| EE, % | 63.37 d | 72.00 b,c | 72.37 b,c | 70.85 b,c | 74.82 a,b | 81.16 a | 68.47 b,c,d | 66.61 c,d | 66.27 c,d | 1.40 | <0.01 |
| Ash, % | 45.19 d | 50.60 c,d | 50.33 c,d | 58.42 b,c | 61.29 a,b | 67.42 a | 50.40 c,d | 48.17 d | 44.91 d | 1.87 | <0.01 |
| GE, % | 78.84 e | 81.63 c,d,e | 79.58 e | 84.31 a,b,c | 85.61 a,b | 87.79 a | 84.03 b,c,d | 83.48 b,c,d | 80.62 d,e | 0.78 | <0.01 |
| CP, % | 75.07 d | 79.06 b,c,d | 77.60 c,d | 81.89 a,b,c | 83.12 a,b | 85.98 a | 82.17 a,b,c | 81.78 a,b,c | 78.35 b,c,d | 1.05 | <0.01 |
| Items mmol/L | Different Combinations of Starch, NSP, and MOS | SEM | p Values | ||||||||
|---|---|---|---|---|---|---|---|---|---|---|---|
| T1 | T2 | T3 | T4 | T5 | T6 | T7 | T8 | T9 | |||
| Glu | 5.30 | 5.29 | 4.93 | 5.39 | 5.80 | 6.01 | 4.96 | 5.01 | 5.94 | 0.53 | 0.75 |
| TC | 2.49 | 2.56 | 2.53 | 2.23 | 2.30 | 2.37 | 2.41 | 2.44 | 2.21 | 0.14 | 0.61 |
| TG | 0.36 | 0.31 | 0.33 | 0.35 | 0.36 | 0.42 | 0.39 | 0.38 | 0.35 | 0.05 | 0.90 |
| LDL-c | 1.07 a | 1.04 a | 0.89 a,b | 0.79 a,b | 0.90 a,b | 0.72 b | 0.88 a,b | 0.90 a,b | 0.65 b | 0.07 | 0.01 |
| HDL-c | 1.17 | 1.34 | 1.52 | 1.21 | 1.30 | 1.33 | 1.18 | 1.10 | 1.12 | 0.11 | 0.18 |
| Items | Different Combinations of Starch, NSP, and MOS | SEM | p Values | ||||||||
|---|---|---|---|---|---|---|---|---|---|---|---|
| T1 | T2 | T3 | T4 | T5 | T6 | T7 | T8 | T9 | |||
| Duodenum | |||||||||||
| villus height (um) | 232.61 | 250.11 | 245.30 | 207.35 | 214.58 | 245.05 | 216.00 | 203.31 | 204.97 | 13.58 | 0.08 |
| crypt depth (um) | 96.74 | 97.32 | 87.76 | 97.71 | 94.71 | 100.78 | 84.55 | 88.03 | 86.69 | 7.38 | 0.74 |
| VH:CD | 2.46 | 2.66 | 2.88 | 2.17 | 2.30 | 2.45 | 2.59 | 2.31 | 2.37 | 0.17 | 0.15 |
| Jejunum | |||||||||||
| villus height (um) | 195.41 | 224.92 | 200.20 | 181.07 | 217.98 | 224.47 | 211.49 | 201.04 | 216.31 | 13.14 | 0.29 |
| crypt depth (um) | 92.03 | 84.82 | 90.57 | 77.42 | 83.02 | 93.15 | 92.19 | 79.04 | 81.89 | 5.07 | 0.21 |
| VH:CD | 2.12 | 2.68 | 2.24 | 2.39 | 2.65 | 2.45 | 2.30 | 2.56 | 2.65 | 0.17 | 0.19 |
| Ileum | |||||||||||
| villus height (um) | 162.59 | 168.34 | 148.91 | 153.14 | 169.21 | 161.56 | 183.27 | 158.56 | 168.97 | 9.60 | 0.37 |
| crypt depth (um) | 79.33 | 72.76 | 82.22 | 71.71 | 74.14 | 80.12 | 79.44 | 76.04 | 76.30 | 3.50 | 0.23 |
| VH:CD | 2.07 | 2.32 | 1.82 | 2.15 | 2.29 | 2.03 | 2.33 | 2.09 | 2.21 | 0.13 | 0.15 |
| Items | Different Combinations of Starch, NSP, and MOS | SEM | p Values | ||||||||
|---|---|---|---|---|---|---|---|---|---|---|---|
| T1 | T2 | T3 | T4 | T5 | T6 | T7 | T8 | T9 | |||
| Serum, umol/L | |||||||||||
| Acetate | 71.68 | 63.92 | 71.44 | 66.87 | 63.12 | 77.07 | 64.70 | 65.21 | 61.90 | 5.39 | 0.55 |
| Propionate | 94.38 | 85.21 | 94.31 | 88.29 | 84.82 | 105.12 | 84.99 | 98.84 | 88.64 | 7.40 | 0.52 |
| Butyrate | 6.53 a,b | 6.67 a,b | 5.95 a,b | 4.03 b | 4.90 a,b | 9.84 a | 4.06 b | 3.30 b | 4.36 b | 1.16 | 0.01 |
| Cecum, umol/g | |||||||||||
| Acetate | 69.96 a,b | 79.45 a,b | 70.66 a,b | 68.31 a,b | 69.69 a,b | 57.39 b | 83.19 a | 77.69 a,b | 60.75 a,b | 4.66 | 0.02 |
| Propionate | 38.66 | 31.31 | 44.20 | 34.07 | 35.67 | 29.30 | 32.09 | 35.46 | 29.49 | 3.33 | 0.13 |
| Butyrate | 22.36 | 23.97 | 20.74 | 23.58 | 22.99 | 21.65 | 15.65 | 15.62 | 18.06 | 1.86 | 0.33 |
| Colon, umol/g | |||||||||||
| Acetate | 63.85 a,b | 68.09 a,b | 61.87 b | 70.89 a,b | 70.96 a,b | 61.84 b | 79.74 a | 72.98 a,b | 67.29 a,b | 3.34 | 0.03 |
| Propionate | 32.02 | 24.62 | 27.87 | 26.99 | 29.97 | 24.54 | 26.86 | 29.68 | 27.16 | 1.97 | 0.29 |
| Butyrate | 17.89 | 16.32 | 18.48 | 20.02 | 18.71 | 16.16 | 14.56 | 14.70 | 15.93 | 1.73 | 0.46 |
© 2020 by the authors. Licensee MDPI, Basel, Switzerland. This article is an open access article distributed under the terms and conditions of the Creative Commons Attribution (CC BY) license (http://creativecommons.org/licenses/by/4.0/).
Share and Cite
Zhou, H.; Yu, B.; He, J.; Mao, X.; Zheng, P.; Yu, J.; Luo, J.; Luo, Y.; Yan, H.; Chen, D. The Optimal Combination of Dietary Starch, Non-Starch Polysaccharides, and Mannan-Oligosaccharide Increases the Growth Performance and Improves Butyrate-Producing Bacteria of Weaned Pigs. Animals 2020, 10, 1745. https://doi.org/10.3390/ani10101745
Zhou H, Yu B, He J, Mao X, Zheng P, Yu J, Luo J, Luo Y, Yan H, Chen D. The Optimal Combination of Dietary Starch, Non-Starch Polysaccharides, and Mannan-Oligosaccharide Increases the Growth Performance and Improves Butyrate-Producing Bacteria of Weaned Pigs. Animals. 2020; 10(10):1745. https://doi.org/10.3390/ani10101745
Chicago/Turabian StyleZhou, Hua, Bing Yu, Jun He, Xiangbing Mao, Ping Zheng, Jie Yu, Junqiu Luo, Yuheng Luo, Hui Yan, and Daiwen Chen. 2020. "The Optimal Combination of Dietary Starch, Non-Starch Polysaccharides, and Mannan-Oligosaccharide Increases the Growth Performance and Improves Butyrate-Producing Bacteria of Weaned Pigs" Animals 10, no. 10: 1745. https://doi.org/10.3390/ani10101745
APA StyleZhou, H., Yu, B., He, J., Mao, X., Zheng, P., Yu, J., Luo, J., Luo, Y., Yan, H., & Chen, D. (2020). The Optimal Combination of Dietary Starch, Non-Starch Polysaccharides, and Mannan-Oligosaccharide Increases the Growth Performance and Improves Butyrate-Producing Bacteria of Weaned Pigs. Animals, 10(10), 1745. https://doi.org/10.3390/ani10101745