Mannanoligosaccharides as a Carbon Source in Biofloc Boost Dietary Plant Protein and Water Quality, Growth, Immunity and Aeromonas hydrophila Resistance in Nile Tilapia (Oreochromis niloticus)

 ,
,  , and
, and
Abstract
:Simple Summary
Abstract
1. Introduction
2. Material and Methods
2.1. Ethical Statement
2.2. Experimental Design and Biofolc Preparation
2.2.1. Experimental Design
2.2.2. Biofloc Preparation
2.3. Experimental Setup and Diets Formulation
2.4. Water Quality Analysis
2.5. Evaluation of Growth Performance
2.6. Digestibility
2.7. Blood Sample Collection
Immune Parameters Evaluation
2.8. Bacterial Counts in Water and Fish Intestine
2.9. Expression of Immune and Bacteria Related Genes
Immunity Genes Expression
2.10. Challenge Test with Aeromonas hydrophila
2.10.1. Bacterial Isolation
2.10.2. Real-Time PCR Assay
- Quantification of Aeromonas hydrophila strain by real-time PCR
- Quantification of Aeromonas hydrophila virulence gene (A-hyd Aerolysin) by real-time PCR
2.11. Statistical Analysis
3. Results
3.1. The Effect of Different Dietary Protein Sources and Carbon Sources on Water Quality Parameters of Nile Tilapia Rearing Water
3.2. The Effect of Different Dietary Protein Sources and Carbon Source Nile Tilapia Growth Performance
3.3. The Effect of Different Dietary Protein Sources and Carbon Source on Nile Tilapia Nutrient Digestibility
3.4. Effect of Different Dietary Protein Sources and Carbon Sources on Nile Tilapia Water Bacterial Count Every Two Weeks of 12-Week Experiment
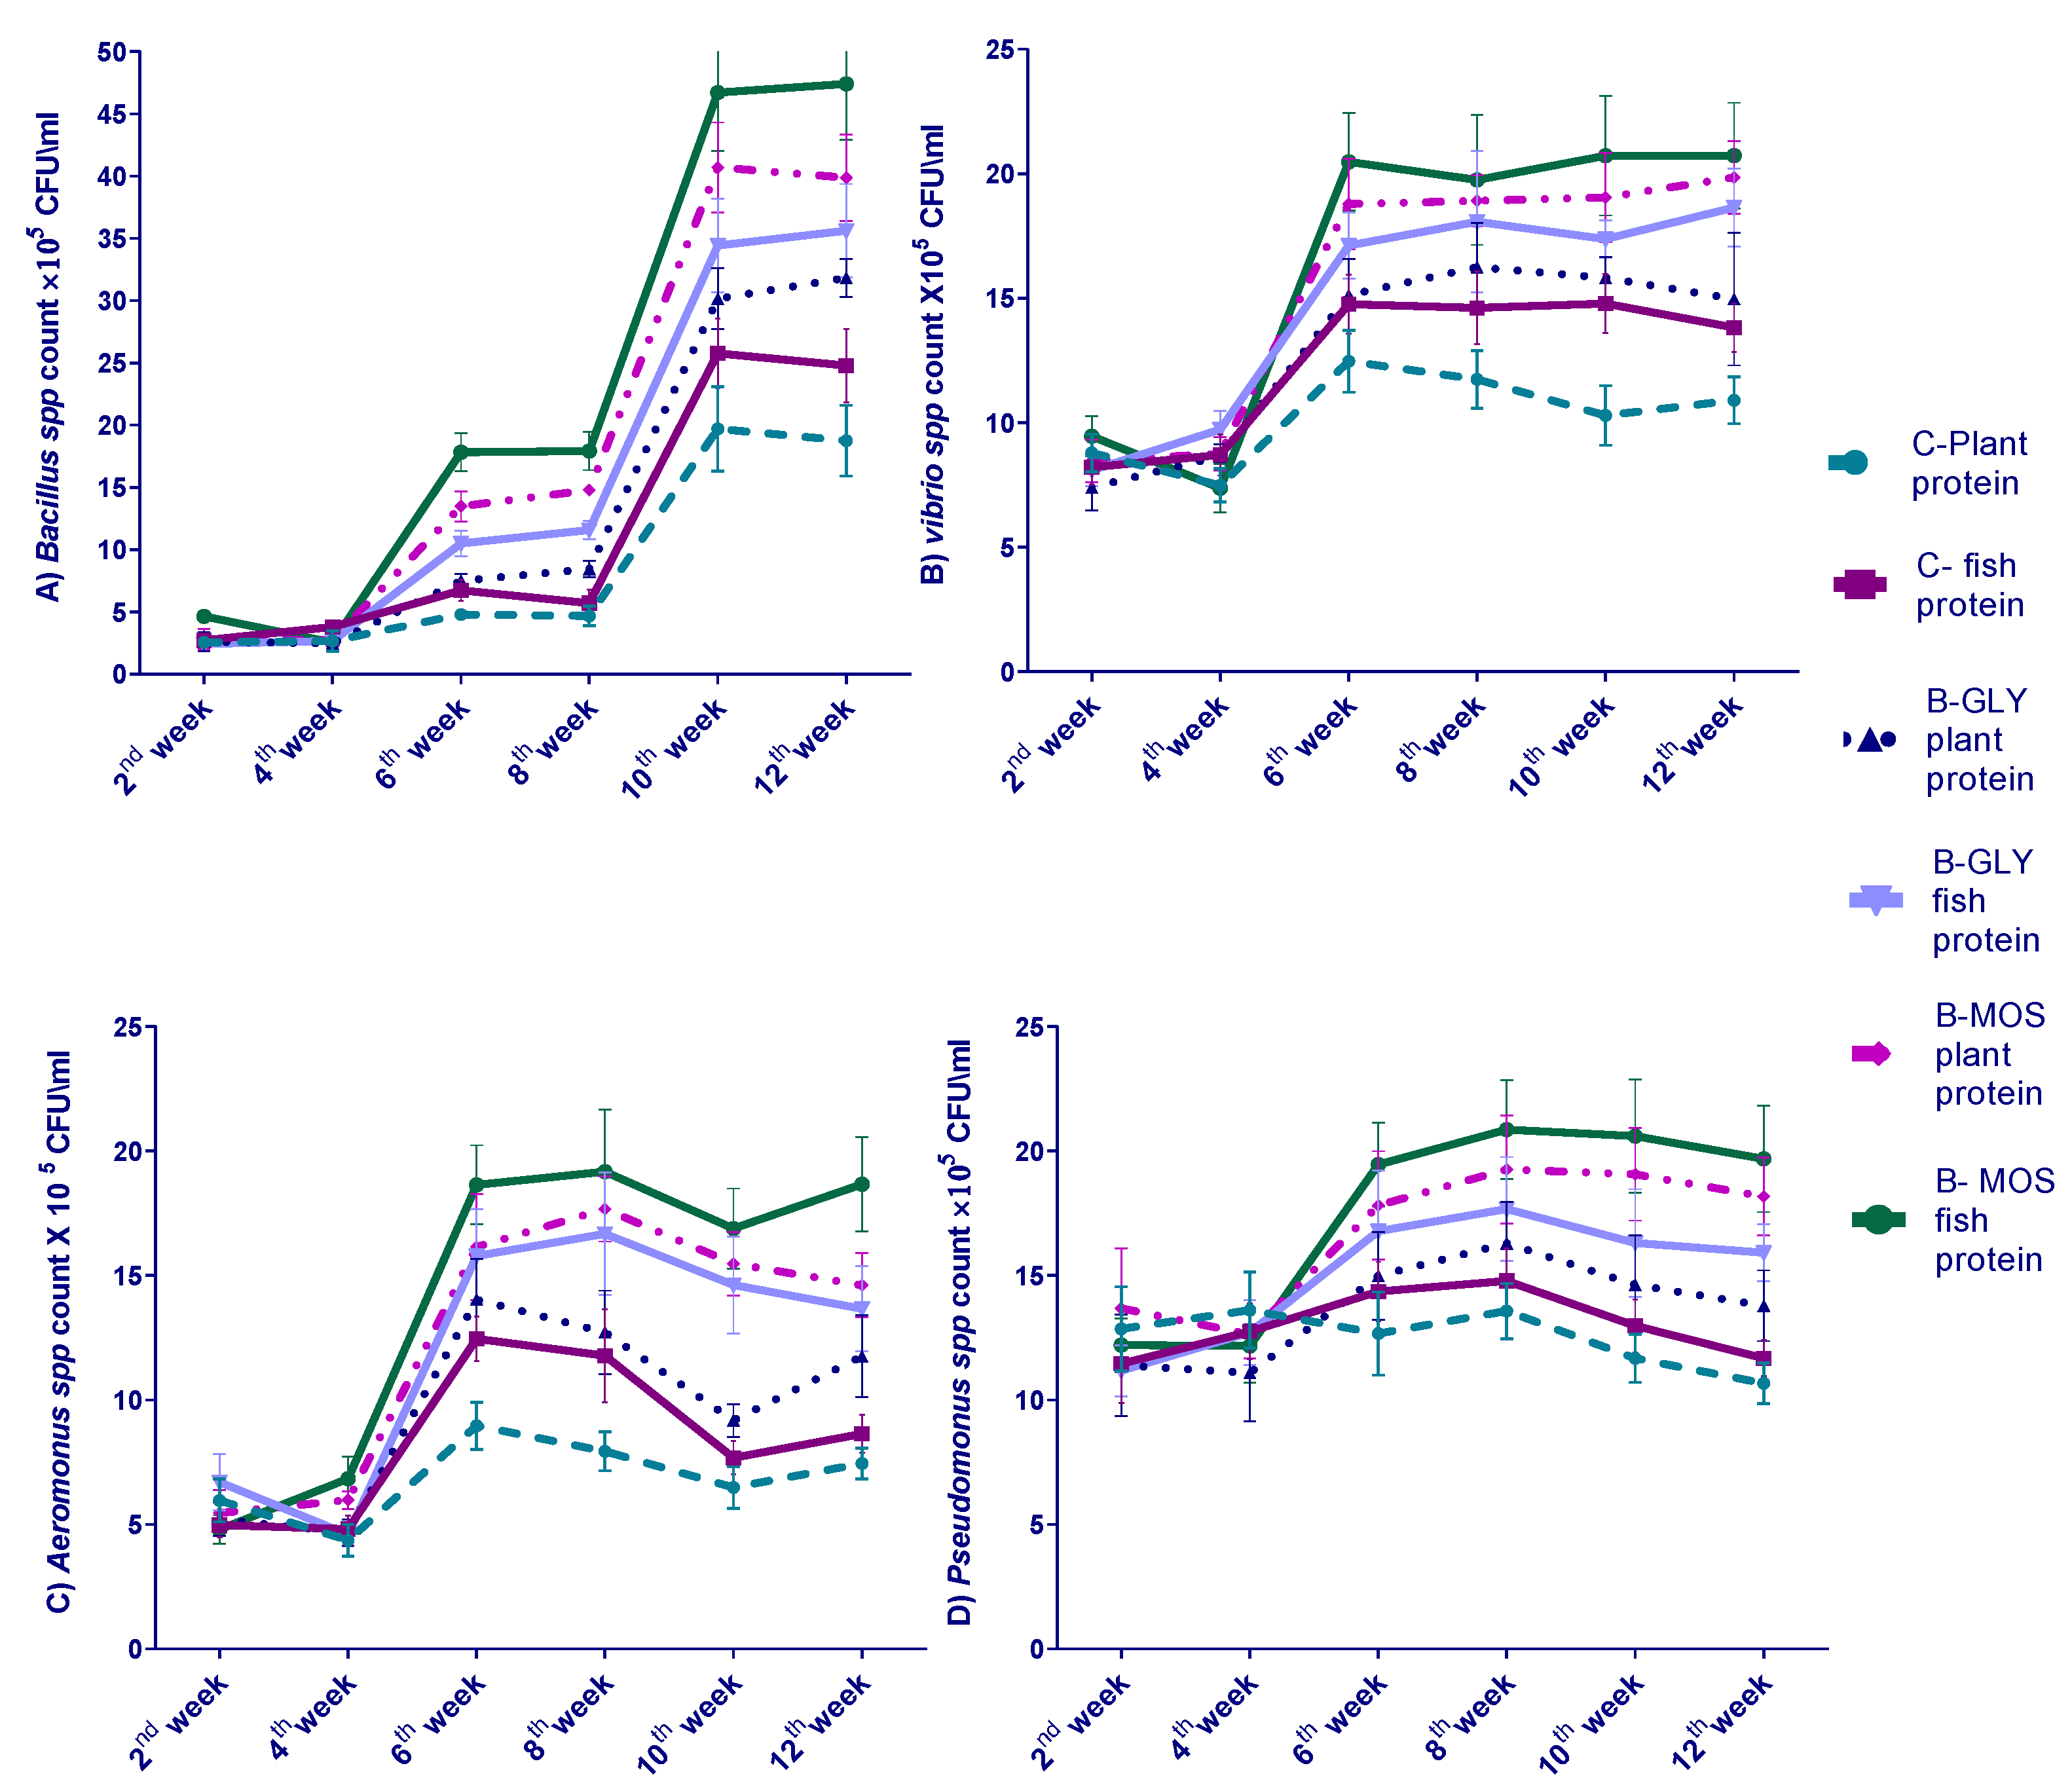
3.5. The Effect of Different Dietary Protein Sources and Carbon Sources on Nile Tilapia Intestinal Bacterial Count
3.6. The Effect of Different Dietary Protein Sources and Carbon Sources on Nile Tilapia Serum Immunity Parameters
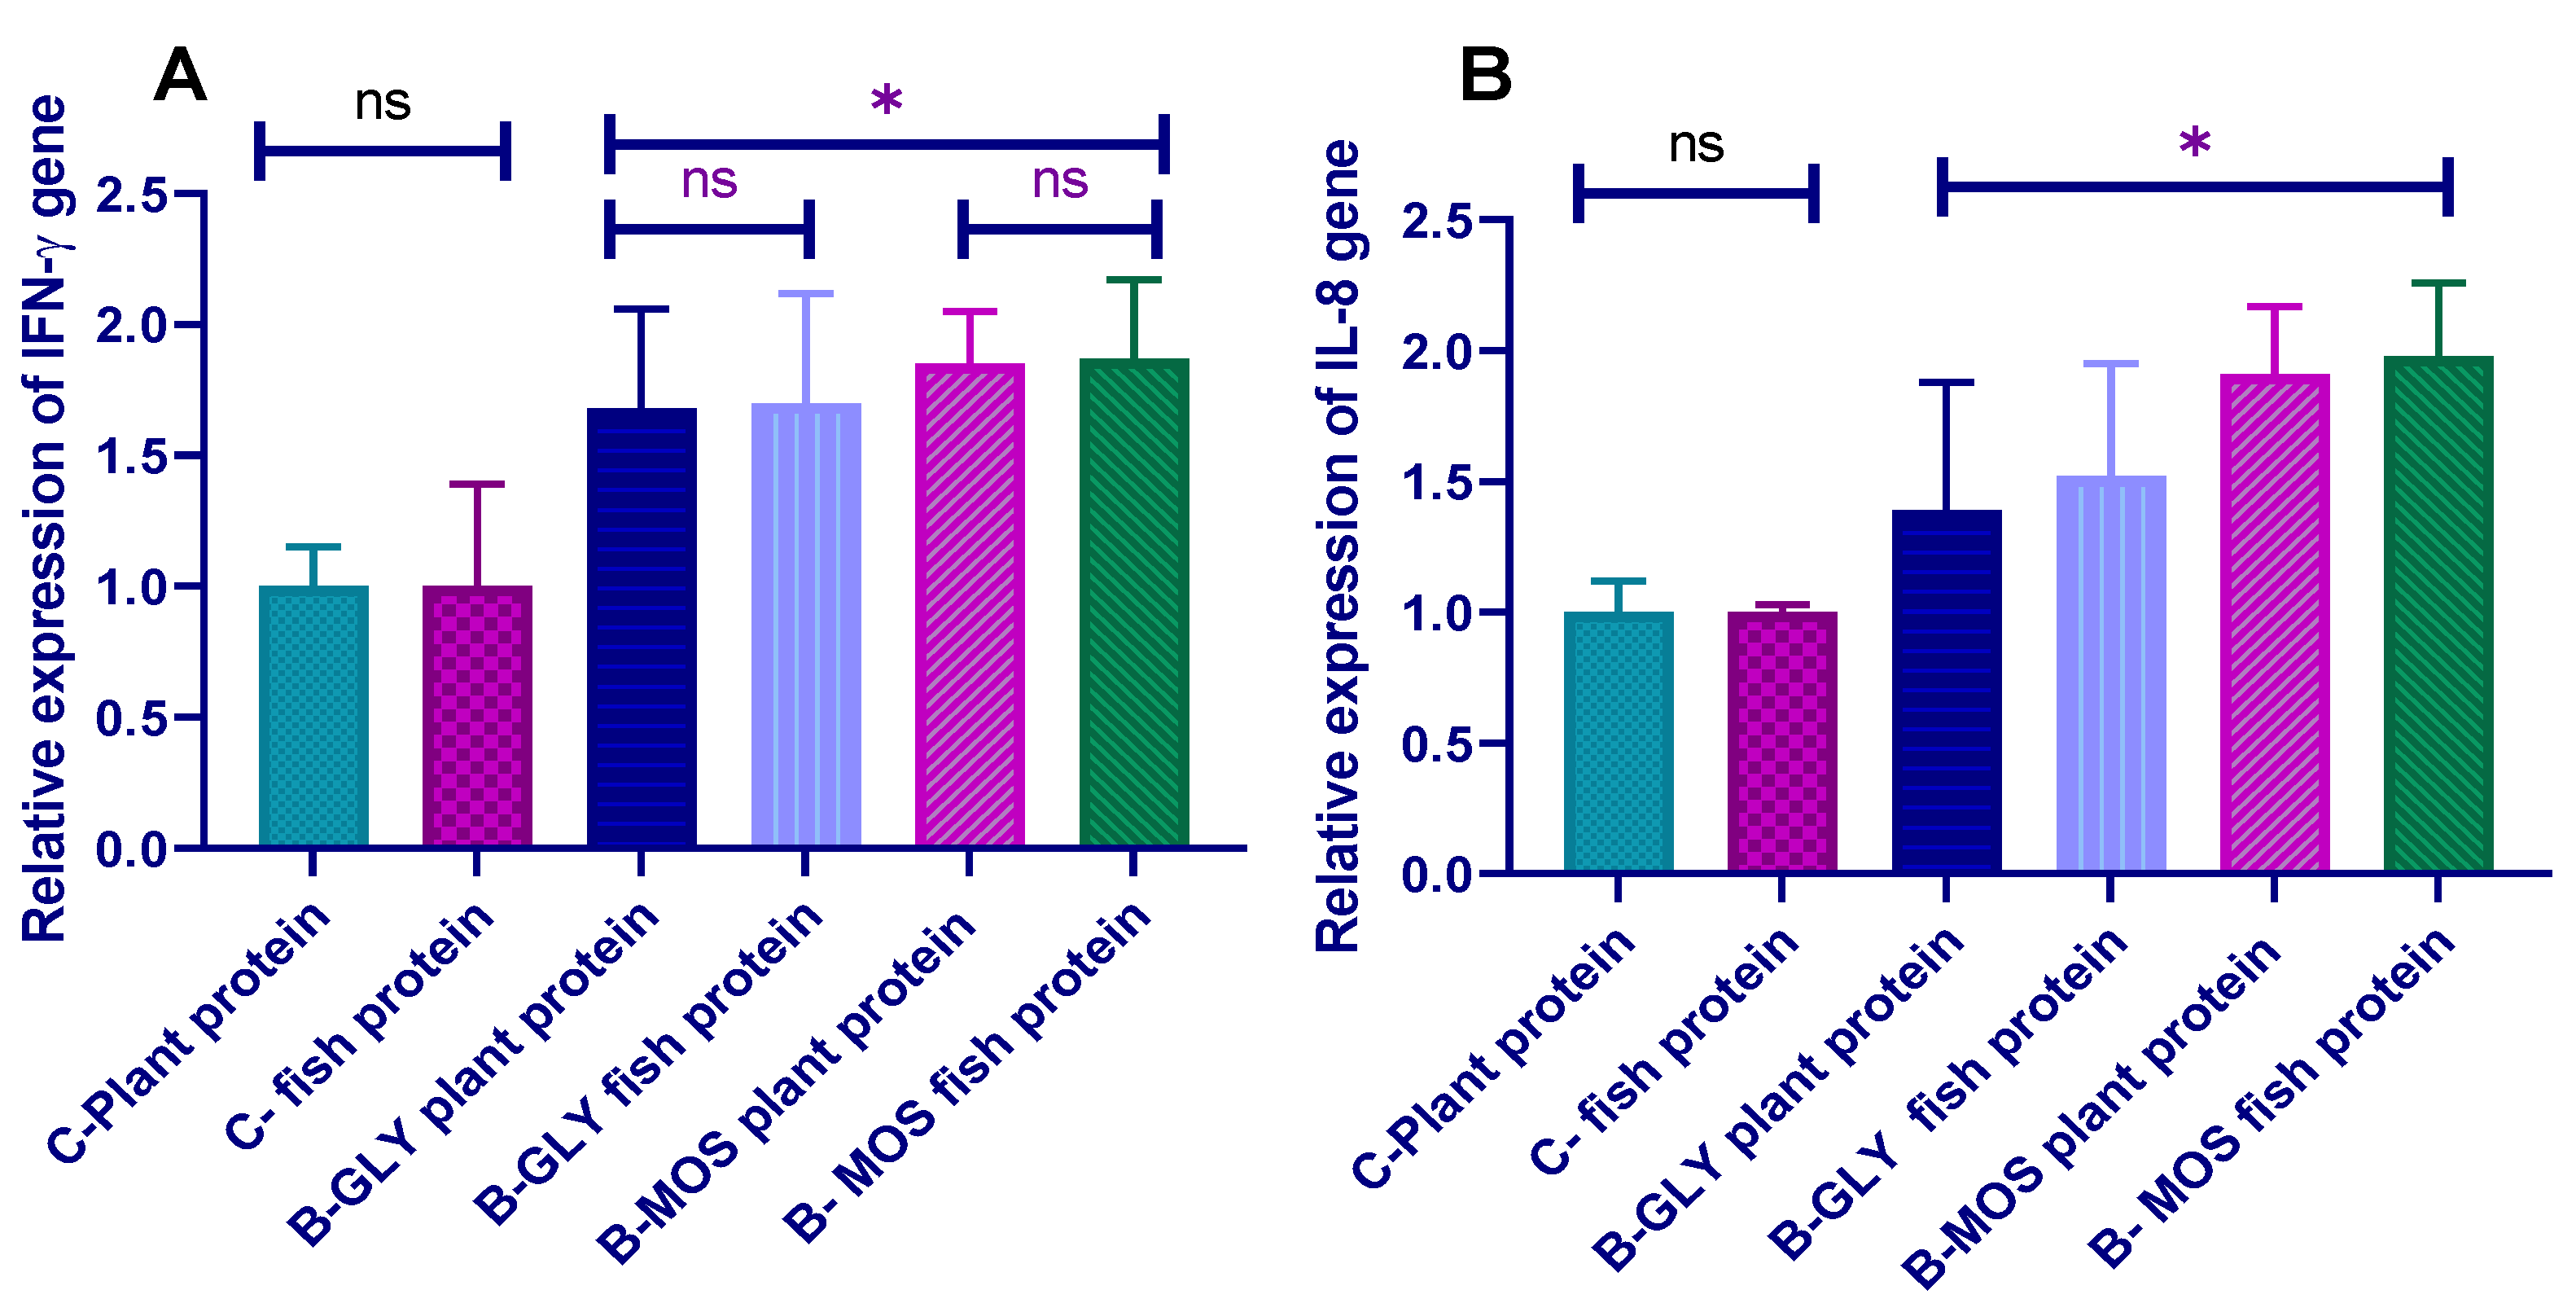
3.7. Effect of Different Dietary Protein Sources and Carbon Sources on Nile Tilapia Transcriptomic Profile of Proinflammatory Cytokines (IL-8 and IFN-γ) Prechallenge
3.8. Challenge Test with Aeromonas hydrophila and Survival Percent
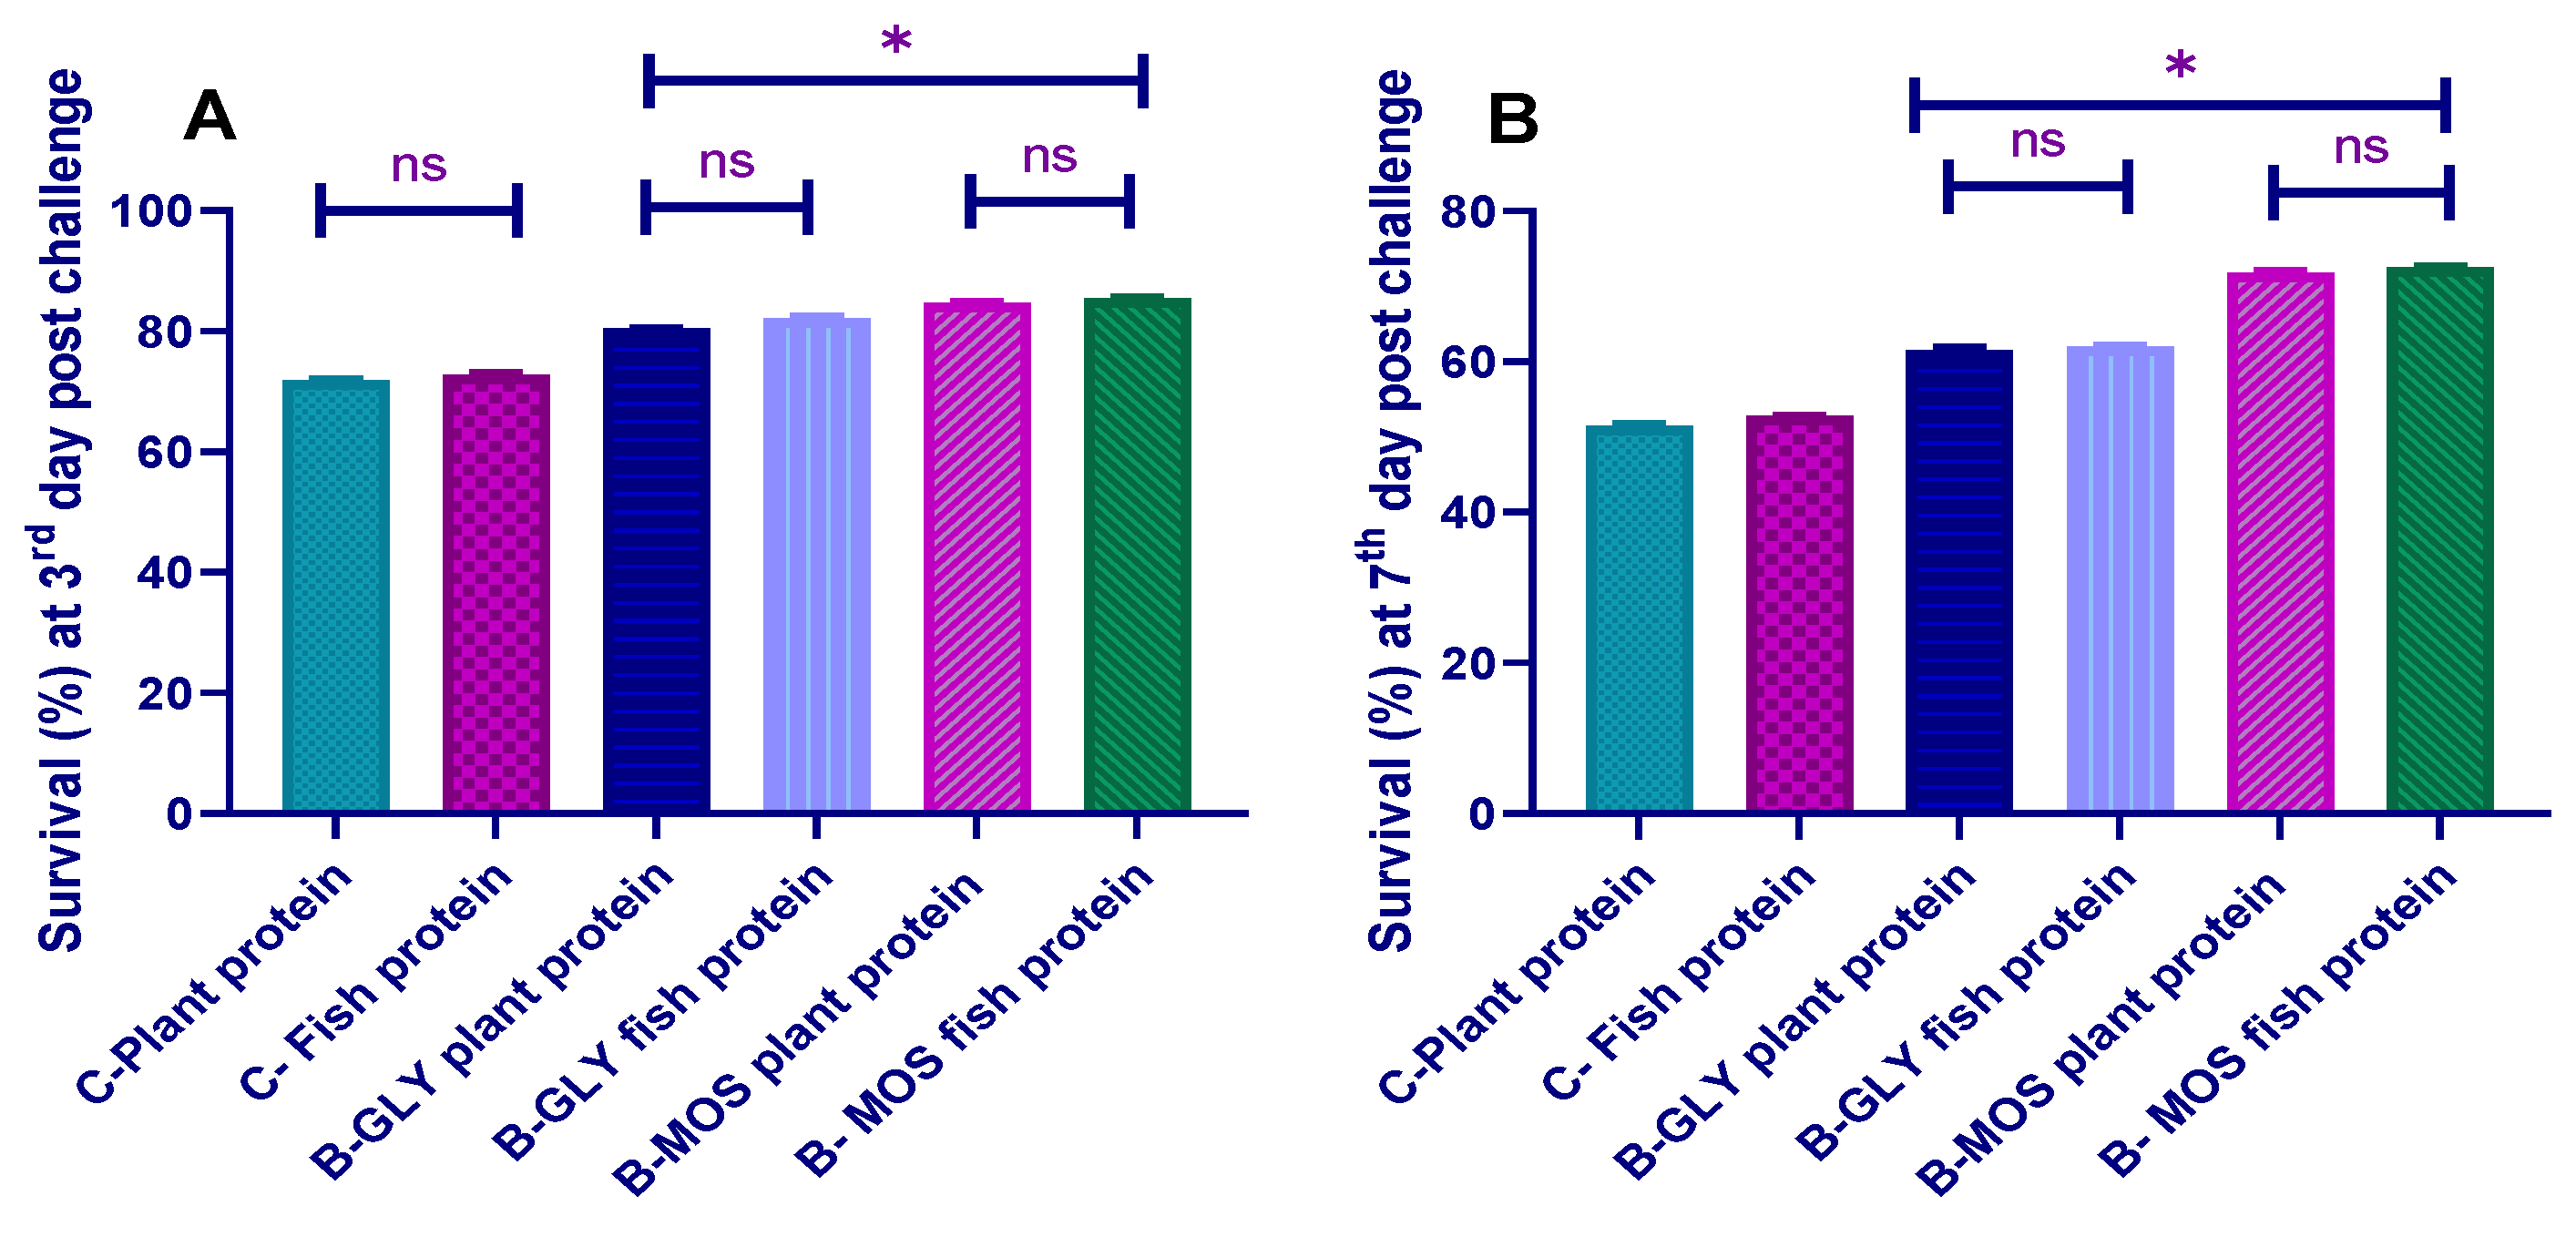
3.8.1. The Cumulative Survival Percent
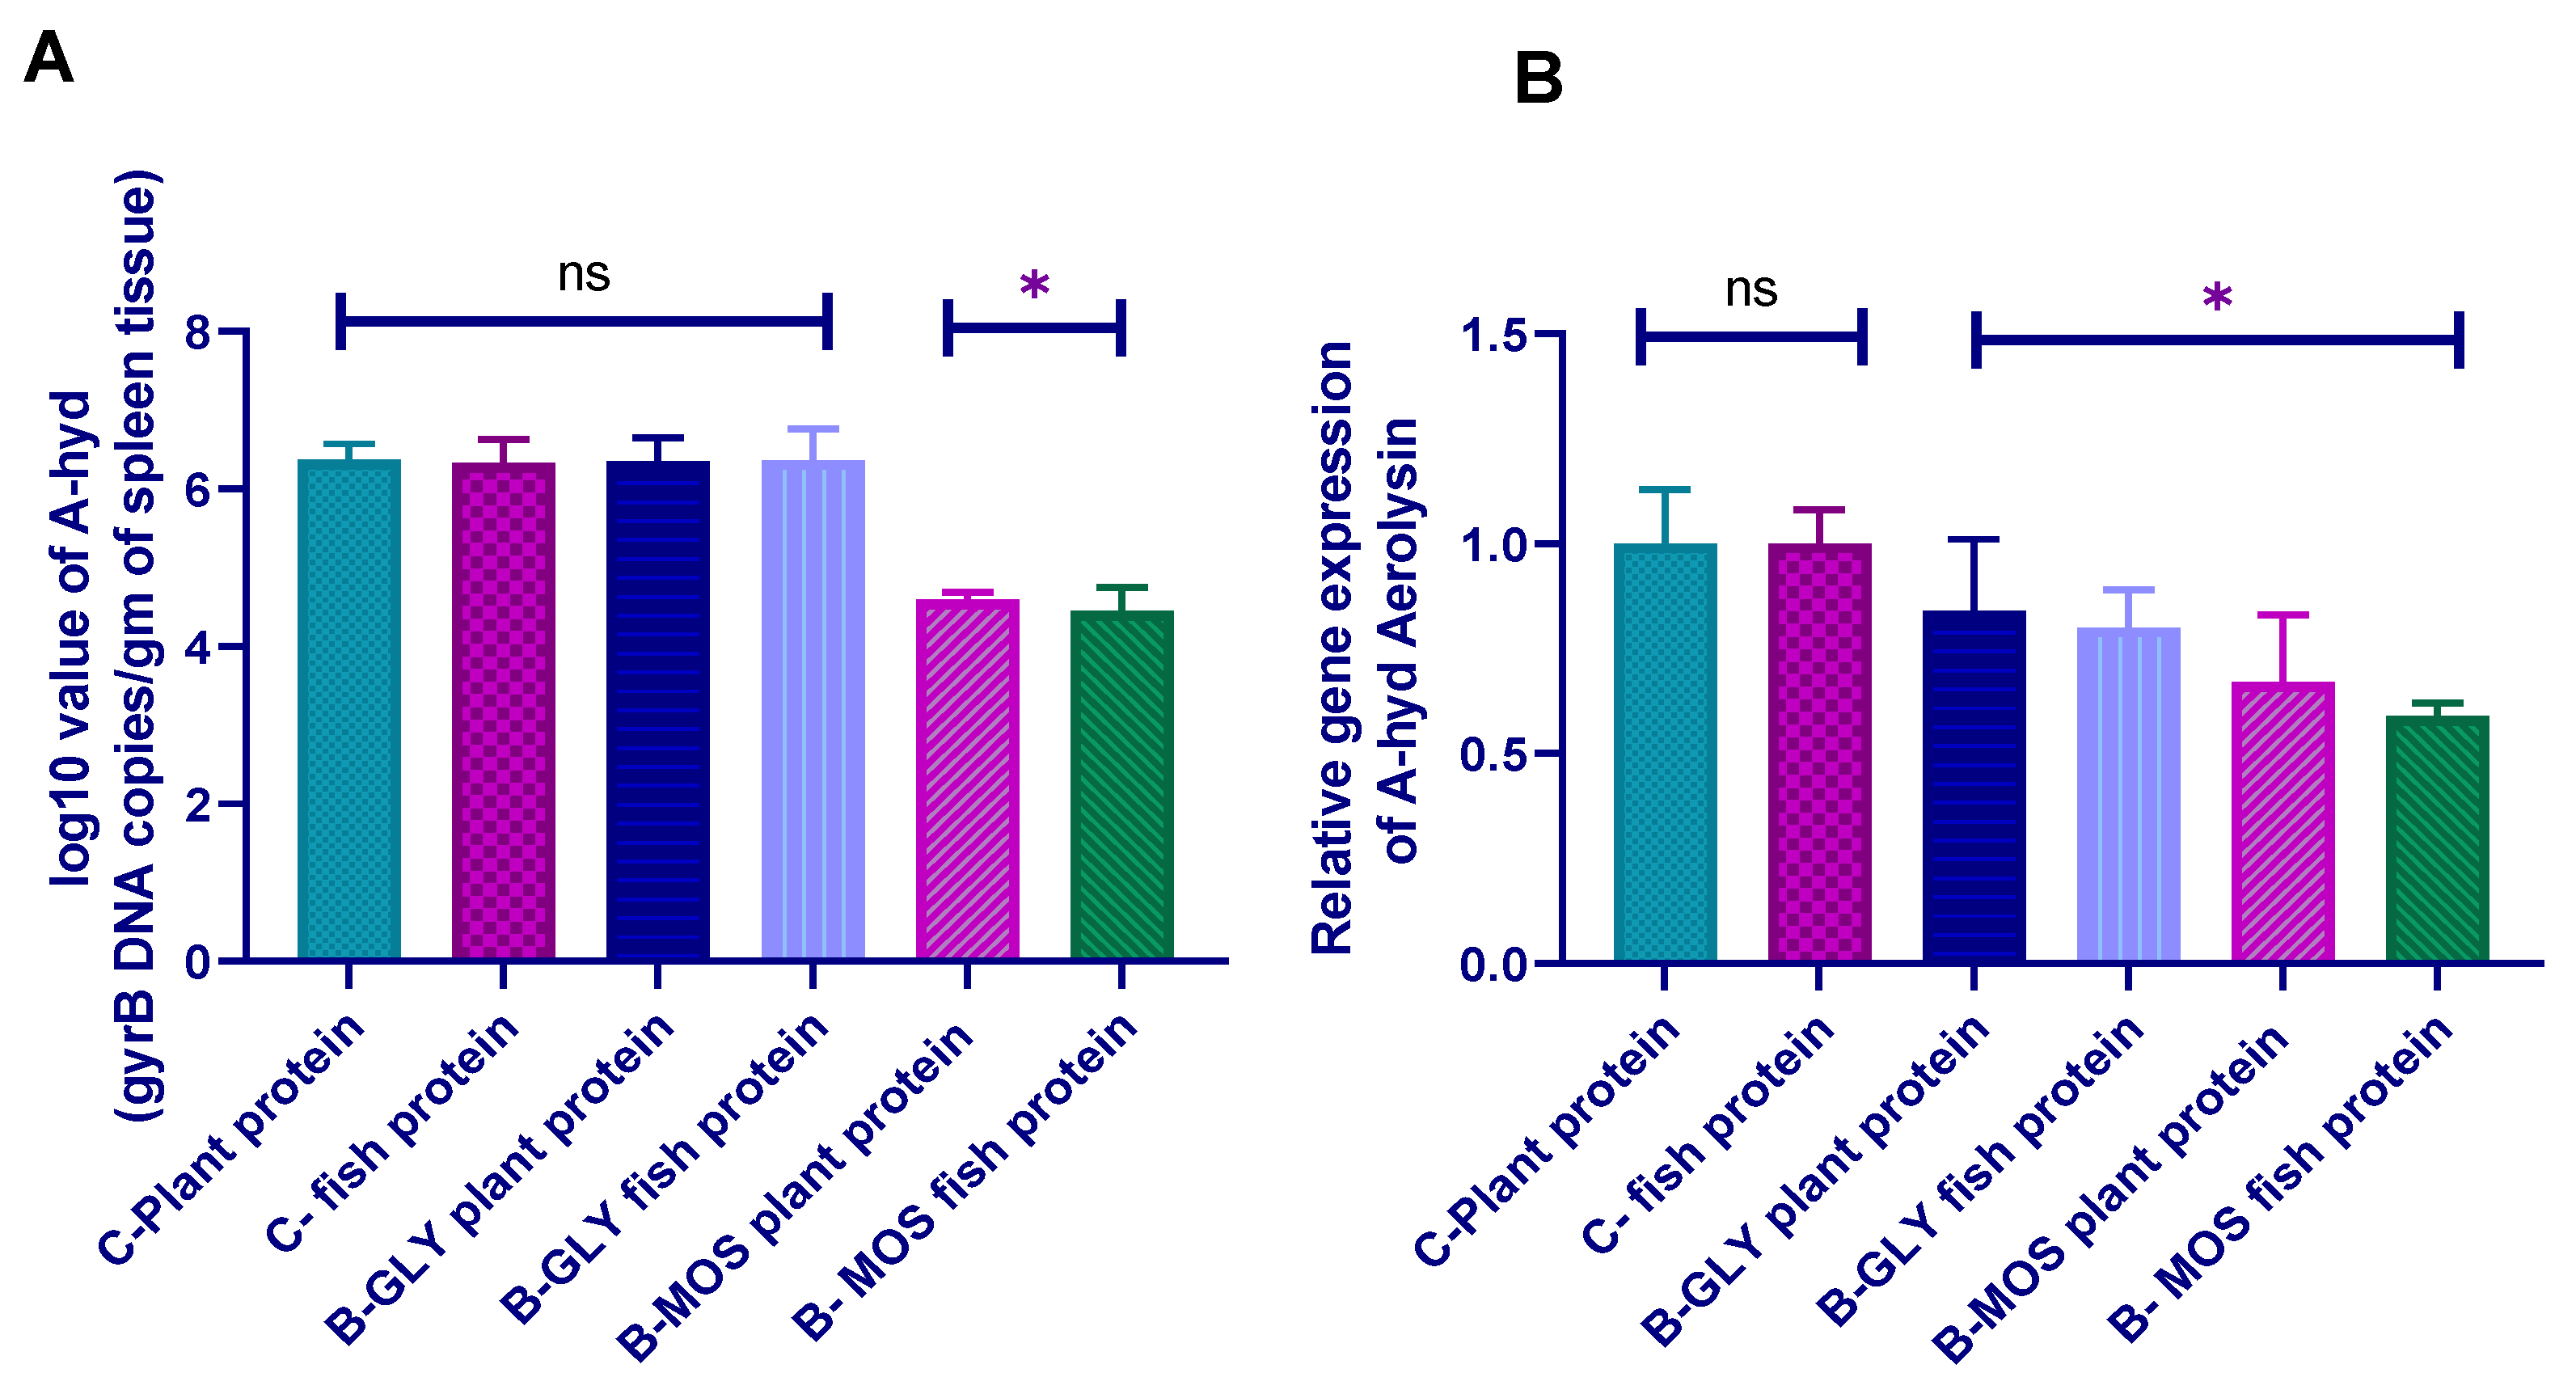
3.8.2. Aeromonas hydrophila Real-Time PCR Quantification and Aerolysin Virulence Gene
4. Discussion
5. Conclusions
Author Contributions
Funding
Conflicts of Interest
References
- Baluyut, E.A.; Balnyme, E. Aquaculture Systems and Practices: A Selected Review; Daya Books: Rome, Italy, 1995. [Google Scholar]
- Datta, S. Management of water quality in intensive aquaculture. Respiration 2012, 6, 602. [Google Scholar]
- Xu, W.J.; Pan, L.Q. Dietary protein level and C/N ratio manipulation in zero-exchange culture of Litopenaeus vannamei: Evaluation of inorganic nitrogen control, biofloc composition and shrimp performance. Aquac. Res. 2014, 45, 1842–1851. [Google Scholar]
- Emerenciano, M.G.C.; Martínez-Córdova, L.R.; Martínez-Porchas, M.; Miranda-Baeza, A. Biofloc technology (BFT): A tool for water quality management in aquaculture. Water Qual. 2017, 5, 91–109. [Google Scholar]
- Avnimelech, Y. Biofloc Technology: A Practical Guide Book; World Aquaculture Society; Israel Institute of Technology: Haifa, Israel, 2009. [Google Scholar]
- Zhao, P.; Huang, J.; Wang, X.-H.; Song, X.-L.; Yang, C.-H.; Zhang, X.-G.; Wang, G.-C. The application of bioflocs technology in high-intensive, zero exchange farming systems of Marsupenaeus japonicus. Aquaculture 2012, 354, 97–106. [Google Scholar] [CrossRef]
- Azim, M.E.; Little, D.C. The biofloc technology (BFT) in indoor tanks: Water quality, biofloc composition, and growth and welfare of Nile tilapia (Oreochromis niloticus). Aquaculture 2008, 283, 29–35. [Google Scholar] [CrossRef]
- Ballester, E.; Abreu, P.; Cavalli, R.; Emerenciano, M.; De Abreu, L.; Wasielesky, W., Jr. Effect of practical diets with different protein levels on the performance of Farfantepenaeus paulensis juveniles nursed in a zero exchange suspended microbial flocs intensive system. Aquac. Nutr. 2010, 16, 163–172. [Google Scholar] [CrossRef]
- Long, L.; Yang, J.; Li, Y.; Guan, C.; Wu, F. Effect of biofloc technology on growth, digestive enzyme activity, hematology, and immune response of genetically improved farmed tilapia (Oreochromis niloticus). Aquaculture 2015, 448, 135–141. [Google Scholar] [CrossRef]
- Panigrahi, A.; Sundram, M.; Jebha, J.; Otta, S.; Bhuvaneshwari, T.; Saraswathy, R.; Rajababu, D.; Saranya, C.; Gopal, C.; Ravichandran, P. Biofloc based nutrient dense culture system for nursery and grow-out farming of Pacific white shrimp Penaeus vannamei Boone, 1931. Indian J. Fish. 2017. [Google Scholar] [CrossRef]
- Kong, W.-B.; Yang, H.; Cao, Y.-T.; Song, H.; Hua, S.-F.; Xia, C.-G. Effect of Glycerol and Glucose on the Enhancement of Biomass, Lipid and Soluble Carbohydrate Production by Chlorella vulgaris in Mixotrophic Culture. Food Technol. Biotechnol. 2013, 51, 62. [Google Scholar]
- Dauda, A.; Romano, N.; Ebrahimi, M.; Jun Chin, T.; Ajadi, A.; Chong, C.M.; Karim, M.; Mohd Ikhsan, N.F.; Kamarudin, M.S. Influence of carbon/nitrogen ratios on biofloc production and biochemical composition and subsequent effects on the growth, physiological status and disease resistance of African catfish (Clarias gariepinus) cultured in glycerol-based biofloc systems. Aquaculture 2017, 483. [Google Scholar] [CrossRef]
- Ekasari, J.; Crab, R.; Willy, V. Primary Nutritional Content of Bio-Flocs Cultured with Different Organic Carbon Sources and Salinity. Hayati J. Biosci. 2010, 17. [Google Scholar] [CrossRef] [Green Version]
- Ringø, E.; Olsen, R.; Gifstad, T.; Dalmo, R.; Amlund, H.; Hemre, G.I.; Bakke, A. Prebiotics in aquaculture: A review. Aquac. Nutr. 2010, 16, 117–136. [Google Scholar] [CrossRef]
- Momeni-Moghaddam, P.; Keyvanshokooh, S.; Ziaei-Nejad, S.; Parviz Salati, A.; Pasha-Zanoosi, H. Effects of mannan oligosaccharide supplementation on growth, some immune responses and gut lactic acid bacteria of common carp (Cyprinus carpio) fingerlings. Vet. Res. Forum. 2015, 6, 239–244. [Google Scholar] [PubMed]
- Song, Y.; Fu, G.; Dong, H.; Li, J.; Du, Y.; Zhang, D. High-Efficiency Secretion of beta-Mannanase in Bacillus subtilis through Protein Synthesis and Secretion Optimization. J. Agric. Food Chem. 2017, 65, 2540–2548. [Google Scholar] [CrossRef]
- Cruz Ramos, H.; Hoffmann, T.; Marino, M.; Nedjari, H.; Presecan-Siedel, E.; Dreesen, O.; Glaser, P.; Jahn, D. Fermentative Metabolism of Bacillus subtilis: Physiology and Regulation of Gene Expression. J. Bacteriol. 2000, 182, 3072. [Google Scholar] [CrossRef] [Green Version]
- Rufchaie, R.; Hoseinifar, S.H. Effects of dietary commercial yeast glucan on innate immune response, hematological parameters, intestinal microbiota and growth performance of white fish (Rutilus frisii kutum) fry. Croat. J. Fish. 2014, 72, 156–163. [Google Scholar] [CrossRef] [Green Version]
- Hoseinifar, S.H.; Sharifian, M.; Vesaghi, M.J.; Khalili, M.; Esteban, M.Á. The effects of dietary xylooligosaccharide on mucosal parameters, intestinal microbiota and morphology and growth performance of Caspian white fish (Rutilus frisii kutum) fry. Fish Shellfish Immunol. 2014, 39, 231–236. [Google Scholar] [CrossRef]
- Brzóska, F.; Buluchevskij, S.; Stecka, K.; Sliwinski, B. The effects of lactic acid bacteria and mannan oligosaccharide, with or without fumaric acid, on chicken performance, slaughter yield and digestive tract microflora. J. Anim. Feed Sci. 2007, 16, 241. [Google Scholar] [CrossRef]
- Birmani, M.W. Mannan Oligosaccharide (MOS), its Potential Benefits in Animal Production. EC Vet. Sci. Rco 2019, 1, 20–22. [Google Scholar]
- Sontakke, R.; Haridas, H. Economic Viability of Biofloc Based System for the Nursery Rearing of Milkfish (Chanos chanos). Int. J. Curr. Microbiol. Appl. Sci. 2018, 7, 2960–2970. [Google Scholar] [CrossRef]
- Avnimelech, Y. Carbon/nitrogen ratio as a control element in aquaculture systems. Aquaculture 1999, 176, 227–235. [Google Scholar] [CrossRef]
- NRC. Nutrient Requirements of Fish. In Nutrient Requirements of Fish and Shrimp; National Academies Press: Washington, DC, USA, 1993. [Google Scholar]
- AOAC. Official Methods of Analysis of AOAC International, 13th ed.; AOAC: Washington, DC, USA, 2002. [Google Scholar]
- The Ministry of Water Resources and Irrigation. Arab Republic of Egypt Integrated Water Resources Management Plan; World Bank Group: Washington, DC, USA, 2005. [Google Scholar]
- American Water Works Association and Water Environment Federation. Standard Methods for the Examination of Water and Wastewater; American Public Health Association: Washington, DC, USA, 1998. [Google Scholar]
- Jauncey, K.; Ross, B. A Guide to Tilapia Feeds and Feeding; Scotland, G.B., Ed.; Institute of Aquaculture; University of Stirling: Stirling, UK, 1982. [Google Scholar]
- Lv, H.-Y.; Zhou, Z.-G.; Rudeaux, F.; Respondek, F. Effects of dietary short chain fructo-oligosaccharides on intestinal microflora, mortality and growth performance of Oreochromis aureus♂× O. niloticus♀. Chin. J. Anim. Nutr. 2007, 19, 691–697. [Google Scholar]
- Siddiqui, A.Q.; Howlader, M.S.; Adam, A.A. Effects of dietary protein levels on growth, feed conversion and protein utilization in fry and young Nile tilapia, Oreochromis niloticus. Aquaculture 1988, 70, 63–73. [Google Scholar] [CrossRef]
- Stuart, J.S.; Hung, S.S. Growth of juvenile white sturgeon (Acipenser transmontanus) fed different proteins. Aquaculture 1989, 76, 303–316. [Google Scholar] [CrossRef]
- Nathanailides, C.; Klaoudatos, D.; Perdikaris, C.; Klaoudatos, S.; Kolygas, M.; Athanassopoulou, F. Metabolic differentiation of diploid and triploid European sea bass juveniles. Int. Aquat. Res. 2019, 11, 199–206. [Google Scholar] [CrossRef] [Green Version]
- Htun-Han, M. The reproductive biology of the dab Limanda limanda (L.) in the North Sea: Seasonal changes in the ovary. J. Fish Biol. 1978, 13, 351–359. [Google Scholar] [CrossRef]
- Cho, C.Y.; Slinger, S.J. Apparent Digestibility Measurement in Feedstuffs for Rainbow Trout. In Proceedings of the World Symposium on Finfish Nutrition and Fishfeed Technology, Hamburg, Germany, 20–23 June 1978; Halver, J.E., Tiews, K., Eds.; pp. 239–247. [Google Scholar]
- McDonald, P. Animal Nutrition; Pearson Education: London, UK, 2002. [Google Scholar]
- Doumas, B.; Biggs, H.; Arends, R.; Pinto, P. Determination of serum albumin. Standard methods. Clin. Chem. 1972, 7, 175–177. [Google Scholar]
- Doumas, B.T.; Bayse, D.D.; Carter, R.J.; Peters, T.; Schaffer, R. A candidate reference method for determination of total protein in serum. I. Development and validation. Clin. Chem. 1981, 27, 1642–1650. [Google Scholar] [CrossRef]
- Schultz, L. Methods in Clinical Chemistry; C.V. Mosby Company: St. Louis, MO, USA, 1987; pp. 742–746. [Google Scholar] [CrossRef]
- Kathleen Hutchinson, M.S. C-Reactive Protein in Serum By Nephelometry; University of Washington Medical Center, NHANES (2001–2002): Washington, DC, USA, 2000. [Google Scholar]
- Talib, N.; Mohamad, N.E.; Yeap, S.K.; Hussin, Y.; Aziz, M.N.M.; Masarudin, M.J.; Sharifuddin, S.A.; Hui, Y.W.; Ho, C.L.; Alitheen, N.B. Isolation and Characterization of Lactobacillus spp. from Kefir Samples in Malaysia. Molecules 2019, 24, 2606. [Google Scholar] [CrossRef] [Green Version]
- Brown, V.; Lowbury, E. Use of an improved cetrimide agar medium and other culture methods for Pseudomonas aeruginosa. J. Clin. Pathol. 1965, 18, 752–756. [Google Scholar] [CrossRef] [Green Version]
- Arcos, M.L.; de Vicente, A.; Moriñigo, M.A.; Romero, P.; Borrego, J.J. Evaluation of several selective media for recovery of Aeromonas hydrophila from polluted waters. Appl. Env. Microbiol. 1988, 54, 2786–2792. [Google Scholar] [CrossRef] [PubMed] [Green Version]
- Pfeffer, C.; Oliver, J. A comparison of thiosulphate-citrate-bile salts-sucrose (TCBS) agar and thiosulphate-chloride-iodide (TCI) agar for the isolation of Vibrio species from estuarine environments. Lett. Appl. Microbiol. 2003, 36, 150–151. [Google Scholar] [CrossRef] [PubMed]
- Ming, C.; Rui, W.; Liping, L.; Huang, T.; Weiyi, H.; Jian, L.; Chao, L.; Aiying, L.; Honglin, L.; Wanwen, L. Sequence and evolution differences of Oreochromis niloticus CXC contribute to the diversification of cellular immune responses in tilapias with treatment of Streptococcus iniae. J. Anim. Vet. Adv. 2013, 12, 303–311. [Google Scholar]
- Abo-Al-Ela, H.G.; El-Nahas, A.F.; Mahmoud, S.; Ibrahim, E.M. The extent to which immunity, apoptosis and detoxification gene expression interact with 17 alpha-methyltestosterone. Fish Shellfish Immunol. 2017, 60, 289–298. [Google Scholar] [CrossRef] [PubMed]
- Pang, J.-C.; Gao, F.-Y.; Lu, M.-X.; Ye, X.; Zhu, H.-P.; Ke, X.-L. Major histocompatibility complex class IIA and IIB genes of Nile tilapia Oreochromis niloticus: Genomic structure, molecular polymorphism and expression patterns. Fish Shellfish Immunol. 2013, 34, 486–496. [Google Scholar] [CrossRef] [PubMed]
- Yuan, J.S.; Reed, A.; Chen, F.; Stewart, C.N. Statistical analysis of real-time PCR data. BMC Bioinform. 2006, 7, 85. [Google Scholar] [CrossRef] [Green Version]
- Amend, D.F. Potency testing of fish vaccines. Fish Biol. Serodiagn Vaccines 1981, 49, 447–454. [Google Scholar]
- Llobrera, A.T.; Gacutan, R.Q. Aeromonas hydrophila associated with ulcerative disease epizootic in Laguna de Bay, Philippines. Aquaculture 1987, 67, 273–278. [Google Scholar] [CrossRef]
- Persson, S.; Al-Shuweli, S.; Yapici, S.; Jensen, J.N.; Olsen, K.E. Identification of clinical aeromonas species by rpoB and gyrB sequencing and development of a multiplex PCR method for detection of Aeromonas hydrophila, A. caviae, A. veronii, and A. media. J. Clin. Microbiol. 2015, 53, 653–656. [Google Scholar] [CrossRef] [Green Version]
- Hirono, I.; Aoki, T.; Asao, T.; Kozaki, S. Nucleotide sequences and characterization of haemolysin genes from Aeromonas hydrophila and Aeromonas sobria. Microb. Pathog. 1992, 13, 433–446. [Google Scholar] [CrossRef]
- Livak, K.J.; Schmittgen, T.D. Analysis of relative gene expression data using real-time quantitative PCR and the 2−ΔΔCT method. Method 2001, 25, 402–408. [Google Scholar] [CrossRef] [PubMed]
- Wang, G.; Clark, C.G.; Liu, C.; Pucknell, C.; Munro, C.K.; Kruk, T.M.; Caldeira, R.; Woodward, D.L.; Rodgers, F.G. Detection and characterization of the hemolysin genes in Aeromonas hydrophila and Aeromonas sobria by multiplex PCR. J. Cinical. Microbiol. 2003, 41, 1048–1054. [Google Scholar] [CrossRef] [PubMed] [Green Version]
- Avnimelech, Y. Feeding with microbial flocs by tilapia in minimal discharge bio-flocs technology ponds. Aquaculture 2007, 264, 140–147. [Google Scholar] [CrossRef]
- Avnimelech, Y.; Kochba, M. Evaluation of nitrogen uptake and excretion by tilapia in bio floc tanks, using 15N tracing. Aquaculture 2009, 287, 163–168. [Google Scholar] [CrossRef]
- Ekasari, J.; Maryam, S. Evaluation of biofloc technology application on water quality and production performance of Red Tilapia Oreochromis sp. cultured at different stocking densities. Hayati J. Biosci. 2012, 19, 73–80. [Google Scholar] [CrossRef] [Green Version]
- Ebeling, J.M.; Timmons, M.B.; Bisogni, J. Engineering analysis of the stoichiometry of photoautotrophic, autotrophic, and heterotrophic removal of ammonia–nitrogen in aquaculture systems. Aquaculture 2006, 257, 346–358. [Google Scholar] [CrossRef] [Green Version]
- Yang, H.; Cheng, H. Controlling nitrite level in drinking water by chlorination and chloramination. Sep. Purif. Technol. 2007, 56, 392–396. [Google Scholar] [CrossRef]
- Mirzakhani, N.; Ebrahimi, E.; Jalali, S.A.H.; Ekasari, J. Growth performance, intestinal morphology and nonspecific immunity response of Nile tilapia (Oreochromis niloticus) fry cultured in biofloc systems with different carbon sources and input C: N ratios. Aquaculture 2019, 512, 734235. [Google Scholar] [CrossRef]
- Chen, S.; Ling, J.; Blancheton, J.-P. Nitrification kinetics of biofilm as affected by water quality factors. Aquac. Eng. 2006, 34, 179–197. [Google Scholar] [CrossRef]
- Sak-Ubol, S.; Namvijitr, P.; Pechsrichuang, P.; Haltrich, D.; Nguyen, T.-H.; Mathiesen, G.; Eijsink, V.G.H.; Yamabhai, M. Secretory production of a beta-mannanase and a chitosanase using a Lactobacillus plantarum expression system. Microb. Cell Fact 2016, 15, 81. [Google Scholar] [CrossRef] [Green Version]
- Genc, M.A.; Yilmaz, E.; Genc, E.; Aktas, M. Effects of dietary mannan oligosaccharides (MOS) on growth, body composition, and intestine and liver histology of the hybrid Tilapia. Oreochromis Niloticus × O. Aureus. Isr. J. Aquac. 2007, 59, 10–16. [Google Scholar]
- Thilakan, A.P.; Pandey, P.; Manju Lekshmi, N.; Shukla, S.; Sreekanth, G. Effect of biofloc on water quality and growth performance of Etroplus suratensis (Bloch, 1790). J. Entomol. Zool. Stud. 2019, 7, 1287–1291. [Google Scholar]
- Ekasari, J.; Rivandi, D.R.; Firdausi, A.P.; Surawidjaja, E.H.; Zairin, M., Jr.; Bossier, P.; De Schryver, P. Biofloc technology positively affects Nile tilapia (Oreochromis niloticus) larvae performance. Aquaculture 2015, 441, 72–77. [Google Scholar] [CrossRef]
- Crab, R.; Kochva, M.; Verstraete, W.; Avnimelech, Y. Bio-flocs technology application in over-wintering of tilapia. Aquac. Eng. 2009, 40, 105–112. [Google Scholar] [CrossRef]
- Emerenciano, M.; Cuzon, G.; Paredes, A.; Gaxiola, G. Evaluation of biofloc technology in pink shrimp Farfantepenaeus duorarum culture: Growth performance, water quality, microorganisms profile and proximate analysis of biofloc. Aquac. Int. 2013, 21, 1381–1394. [Google Scholar] [CrossRef]
- Megahed, M.E. The effect of microbial biofloc on water quality, survival and growth of the green tiger shrimp (Penaeus semisulcatus) fed with different crude protein levels. J. Arab. Aquac. Soc. 2010, 5, 119–142. [Google Scholar]
- Xu, W.-J.; Pan, L.-Q. Effects of bioflocs on growth performance, digestive enzyme activity and body composition of juvenile Litopenaeus vannamei in zero-water exchange tanks manipulating C/N ratio in feed. Aquaculture 2012, 356, 147–152. [Google Scholar] [CrossRef]
- Wasielesky, W., Jr.; Atwood, H.; Stokes, A.; Browdy, C.L. Effect of natural production in a zero exchange suspended microbial floc based super-intensive culture system for white shrimp Litopenaeus vannamei. Aquaculture 2006, 258, 396–403. [Google Scholar] [CrossRef]
- Ekasari, J.; Angela, D.; Waluyo, S.H.; Bachtiar, T.; Surawidjaja, E.H.; Bossier, P.; De Schryver, P. The size of biofloc determines the nutritional composition and the nitrogen recovery by aquaculture animals. Aquaculture 2014, 426, 105–111. [Google Scholar] [CrossRef]
- Torrecillas, S.; Montero, D.; Izquierdo, M. Improved health and growth of fish fed mannan oligosaccharides: Potential mode of action. Fish Shellfish Immunol. 2014, 36. [Google Scholar] [CrossRef]
- Munir, M.B.; Hashim, R.; Abdul Manaf, M.S.; Nor, S.A.M. Dietary prebiotics and probiotics influence the growth performance, feed utilisation, and body indices of snakehead (Channa striata) fingerlings. Trop. Life Sci. Res. 2016, 27, 111–125. [Google Scholar] [CrossRef] [PubMed]
- Lin, S.; Mai, K.; Tan, B. Effects of exogenous enzyme supplementation in diets on growth and feed utilization in tilapia, Oreochromis niloticus × O. aureus. Aquac. Res. 2007, 38, 1645–1653. [Google Scholar] [CrossRef]
- Arnold, S.J.; Sellars, M.J.; Crocos, P.J.; Coman, G.J. Intensive production of juvenile tiger shrimp Penaeus monodon: An evaluation of stocking density and artificial substrates. Aquaculture 2006, 261, 890–896. [Google Scholar] [CrossRef]
- De Schryver, P.; Verstraete, W. Nitrogen removal from aquaculture pond water by heterotrophic nitrogen assimilation in lab-scale sequencing batch reactors. Bioresour. Technol. 2009, 100, 1162–1167. [Google Scholar] [CrossRef] [PubMed]
- Anand, P.S.; Kohli, M.; Kumar, S.; Sundaray, J.; Roy, S.D.; Venkateshwarlu, G.; Sinha, A.; Pailan, G. Effect of dietary supplementation of biofloc on growth performance and digestive enzyme activities in Penaeus monodon. Aquaculture 2014, 418, 108–115. [Google Scholar] [CrossRef]
- Xu, W.-J.; Pan, L.-Q. Evaluation of dietary protein level on selected parameters of immune and antioxidant systems, and growth performance of juvenile Litopenaeus vannamei reared in zero-water exchange biofloc-based culture tanks. Aquaculture 2014, 426, 181–188. [Google Scholar] [CrossRef]
- Gelibolu, S.; Yanar, Y.; Genc, M.A.; Genc, E. The effect of mannan-oligosaccharide (MOS) as a feed supplement on growth and some blood parameters of Gilthead Sea Bream (Sparus aurata). Turk. J. Fish. Aquat. Sci. 2018, 18, 817–823. [Google Scholar] [CrossRef]
- Dimitroglou, A.; Reynolds, P.; Ravnoy, B.; Johnsen, F.; Sweetman, J.; Johansen, J.; Davies, S. The effect of mannan oligosaccharide supplementation on Atlantic salmon smolts (Salmo salar L.) fed diets with high levels of plant proteins. J. Aquacult. Res. Dev. S 2011, 1, 11. [Google Scholar] [CrossRef] [Green Version]
- Calik, A.; Ekim, B.; Bayraktaroğlu, A.G.; Ergün, A.; Saçakli, P. Effects of dietary probiotic and synbiotic supplementation on broiler growth performance and intestinal histomorphology. Ankara Üniv. Vet. Fak. Der. 2017, 64, 183–189. [Google Scholar]
- Awad, W.; Ghareeb, K.; Abdel-Raheem, S.; Böhm, J. Effects of dietary inclusion of probiotic and synbiotic on growth performance, organ weights, and intestinal histomorphology of broiler chickens. Poult. Sci. 2009, 88, 49–56. [Google Scholar] [CrossRef]
- Ferreira, L.M.; Lara, G.; Wasielesky, W., Jr.; Abreu, P.C. Biofilm versus biofloc: Are artificial substrates for biofilm production necessary in the BFT system? Aquac. Int. 2016, 24, 921–930. [Google Scholar] [CrossRef]
- Cardona, E.; Gueguen, Y.; Magré, K.; Lorgeoux, B.; Piquemal, D.; Pierrat, F.; Noguier, F.; Saulnier, D. Bacterial community characterization of water and intestine of the shrimp Litopenaeus stylirostris in a biofloc system. Bmc Microbiol. 2016, 16, 157. [Google Scholar] [CrossRef] [PubMed]
- Ferreira, G.S.; Bolívar, N.C.; Pereira, S.A.; Guertler, C.; do Nascimento Vieira, F.; Mouriño, J.L.P.; Seiffert, W.Q. Microbial biofloc as source of probiotic bacteria for the culture of Litopenaeus vannamei. Aquaculture 2015, 448, 273–279. [Google Scholar] [CrossRef]
- Gutiérrez, S.M.; Dosta, M.; Partida, A.H.; Mejía, J.C.; Rodríguez, G.A.; de Oca, M. Effect of two carbon sources in microbial abundance in a Biofloc culture system with Oreochromis niloticus (Linnaeus, 1758). Int. J. Fish. Aquat. Stud. 2016, 4, 421–427. [Google Scholar]
- Cadiz, R.E.; Traifalgar, R.F.M.; Sanares, R.C.; Andrino-Felarca, K.G.S.; Corre, V.L., Jr. Comparative efficacies of tilapia green water and biofloc technology (BFT) in suppressing population growth of green Vibrios and Vibrio parahaemolyticus in the intensive tank culture of Penaeus vannamei. Aquac. Aquar. Conserv. Legis. 2016, 9, 195–203. [Google Scholar]
- Pérez-Fuentes, J.A.; Pérez-Rostro, C.I.; Hernández-Vergara, M.P.; Monroy-Dosta, M.d.C. Variation of the bacterial composition of biofloc and the intestine of Nile tilapia Oreochromis niloticus, cultivated using biofloc technology, supplied different feed rations. Aquac. Res. 2018, 49, 3658–3668. [Google Scholar] [CrossRef]
- Li, Z.; Tran, N.T.; Ji, P.; Sun, Z.; Wen, X.; Li, S. Effects of prebiotic mixtures on growth performance, intestinal microbiota and immune response in juvenile chu’s croaker, Nibea coibor. Fish Shellfish Immunol. 2019, 89, 564–573. [Google Scholar] [CrossRef]
- Nedaei, S.; Noori, A.; Valipour, A.; Khanipour, A.A.; Hoseinifar, S.H. Effects of dietary galactooligosaccharide enriched commercial prebiotic on growth performance, innate immune response, stress resistance, intestinal microbiota and digestive enzyme activity in Narrow clawed crayfish (Astacus leptodactylus Eschscholtz, 1823). Aquaculture 2019, 499, 80–89. [Google Scholar]
- Verschuere, L.; Rombaut, G.; Sorgeloos, P.; Verstraete, W. Probiotic bacteria as biological control agents in aquaculture. Microbiol. Mol. Biol. Rev. 2000, 64, 655–671. [Google Scholar] [CrossRef] [Green Version]
- Król, E.; Douglas, A.; Tocher, D.R.; Crampton, V.O.; Speakman, J.R.; Secombes, C.J.; Martin, S.A. Differential responses of the gut transcriptome to plant protein diets in farmed Atlantic salmon. BMC Genom. 2016, 17, 156. [Google Scholar] [CrossRef] [Green Version]
- Lovell, T. Nutrition and Feeding of Fish; Springer: Berlin/Heidelberg, Germany, 1989; Volume 260. [Google Scholar]
- Promthale, P.; Pongtippatee, P.; Withyachumnarnkul, B.; Wongprasert, K. Bioflocs substituted fishmeal feed stimulates immune response and protects shrimp from Vibrio parahaemolyticus infection. Fish Shellfish Immunol. 2019, 93, 1067–1075. [Google Scholar] [CrossRef] [PubMed]
- Kim, S.K.; Pang, Z.; Seo, H.C.; Cho, Y.R.; Samocha, T.; Jang, I.K. Effect of bioflocs on growth and immune activity of Pacific white shrimp, Litopenaeus vannamei postlarvae. Aquac. Res. 2014, 45, 362–371. [Google Scholar] [CrossRef]
- Micallef, G.; Cash, P.; Fernandes, J.M.; Rajan, B.; Tinsley, J.W.; Bickerdike, R.; Martin, S.A.; Bowman, A.S. Dietary yeast cell wall extract alters the proteome of the skin mucous barrier in Atlantic Salmon (Salmo salar): Increased abundance and expression of a calreticulin-like protein. PLoS ONE 2017, 12, e0169075. [Google Scholar] [CrossRef]
- Kumar, P.; Jain, K.K.; Sardar, P. Effects of dietary synbiotic on innate immunity, antioxidant activity and disease resistance of Cirrhinus mrigala juveniles. Fish Shellfish Immunol. 2018, 80, 124–132. [Google Scholar] [CrossRef]
- Van der Marel, M.; Caspari, N.; Neuhaus, H.; Meyer, W.; Enss, M.L.; Steinhagen, D. Changes in skin mucus of common carp, Cyprinus carpio L., after exposure to water with a high bacterial load. J. Fish Dis. 2010, 33, 431–439. [Google Scholar] [CrossRef] [PubMed]
- Zhao, H.; Li, C.; Beck, B.H.; Zhang, R.; Thongda, W.; Davis, D.A.; Peatman, E. Impact of feed additives on surface mucosal health and columnaris susceptibility in channel catfish fingerlings, Ictalurus punctatus. Fish Shellfish Immunol. 2015, 46, 624–637. [Google Scholar] [CrossRef]
- Ekasari, J.; Azhar, M.H.; Surawidjaja, E.H.; Nuryati, S.; De Schryver, P.; Bossier, P. Immune response and disease resistance of shrimp fed biofloc grown on different carbon sources. Fish Shellfish Immunol. 2014, 41, 332–339. [Google Scholar] [CrossRef] [PubMed]
- Newman, K. Mannan-oligosaccharides: Natural polymers with significant impact on the gastrointestinal microflora and the immune system. Biotechnol. Feed Ind. 1994, 10, 167–174. [Google Scholar]
- Savage, T. The effects of feeding a mannan oligosaccharide on immunoglobulins, plasma IgG and bile IgA, of Wrolstad MW male turkeys. Poult. Sci. 1996, 75, 143–148. [Google Scholar]

| Ingredients % | Plant Protein Based Diet | Fish Protein Based Diet |
|---|---|---|
| corn | 17 | 31.8 |
| Soybean meal, (46.5% cp) | 41 | -- |
| Fish meal (65% cp) | -- | 29 |
| Wheat middling | 7 | 11.6 |
| Whole wheat flour (12.9% cp) | 3.1 | 3.4 |
| DDGs (28.7% cp) | 4 | 5 |
| Corn gluten meal (62% cp) | 4.6 | 3.5 |
| Rice bran | 14 | 9 |
| Fish oil | 6.7 | 5.7 |
| CaCo3 | 1.5 | 0.3 |
| Premix * | 0.5 | 0.5 |
| DL- Methionine, 98% | 0.4 | 0.2 |
| Lysine % | 0.2 | -- |
| Calculated chemical composition † | ||
| †DE, Kcal/Kg | 2901.06 | 2902.91 |
| DM % | 89.06 | 89.45 |
| CP, % | 28.12 | 28.09 |
| EE, % | 11.25 | 11.16 |
| CF, % | 3.32 | 1.49 |
| NFE % | 40.22 | 40.64 |
| Ash% | 4.01 | 7.14 |
| Ca, % | 0.72 | 0.86 |
| Available P, % | 0.56 | 1.15 |
| Lysine, % | 1.62 | 1.70 |
| Methionine, % | 0.84 | 0.91 |
| Methionine + cystine | 0.90 | 1.07 |
| Genes | Product Length (bp) | Primer Sequences (5′—>3′) | GenBank Number |
|---|---|---|---|
| Fish genes primer sequence | |||
| β-actin | 139 | F: TGGCATCACACCTTCTATAACGA | XM_003455949.2 |
| R: TGGCAGGAGTGTTGAAGGTCT | |||
| IL-8 | 126 | F: GCA CTG CCG CTG CAT TAA G | NM_001279704.1 |
| R: GCA GTG GGA GTT GGG AAG AA | |||
| IFN-γ | 632 | F: AGC ACA ACG TAG CTT TCC CT | XM_003460533.2 |
| R: TAA ACA GGG CAA ACA GGT CA | |||
| Bacterial Genes Primer Sequence | |||
| A. 16S | 356 | F: GGGAGTGCCTTCGGGAATCAGA | X74677.1 |
| R: TCACCGCAACATTCTGATTTG | |||
| A. hydrophila (gyrB) | 144 | F: AGTCTGCCGCCAGTGGC | KJ747144.1 |
| R: CRCCCATCGCCTGTTCG | |||
| AH-aerA | 309 | F: CAAGAACAAGTTCAAGTGGCCA | M16495.1 |
| R: ACGAAGGTGTGGTTCCAGT | |||
| Experimental Groups | Temperature °C | pH | D. O2 (mg/L) | Salinity (g/L) | TAN (mg/L) | Nitrite N. (mg/L) | Nitrate N. (mg/L) | Biofloc Volume (mL) |
|---|---|---|---|---|---|---|---|---|
| Protein source | ||||||||
| Plant protein. | 26.40 | 7.64 | 5.25 | 1.33 | 0.33 | 0.21 | 0.78 | 13.37 |
| Fish protein. | 26.40 | 7.62 | 5.27 | 1.33 | 0.32 | 0.22 | 0.77 | 13.48 |
| Carbon source | ||||||||
| Control (C) | 26.16 b | 8.05 a | 5.52 a | 1.32 | 0.47 a | 0.32 a | 1.26 a | 0.76 c |
| B-GLY | 26.51 a | 7.83 b | 5.19 b | 1.34 | 0.26 b | 0.17 b | 0.55 b | 18.57 b |
| B-MOS | 26.53 a | 7.01 c | 5.07 c | 1.35 | 0.25 b | 0.16 b | 0.52 b | 20.95 a |
| Interaction protein source × carbon source | ||||||||
| C-plant protein | 26.16 b | 8.07 a | 5.50 a | 1.32 | 0.48 a | 0.32 a | 1.27 a | 0.76 c |
| C-fish protein | 26.16 b | 8.02 a | 5.54 a | 1.31 | 0.46 a | 0.32 a | 1.24 a | 0.76 c |
| B-GLY plant protein | 26.52 a | 7.82 b | 5.18 b | 1.34 | 0.27 b | 0.17 b | 0.56 b | 18.62 b |
| B-GLY fish protein | 26.50 a | 7.83 b | 5.20 b | 1.34 | 0.25 b | 0.17 b | 0.53 b | 18.52 b |
| B-MOS plant protein | 26.52 a | 7.02 c | 5.07 c | 1.34 | 0.25 b | 0.16 b | 0.51 b | 20.72 a |
| B-MOS fish protein | 26.54 a | 6.99 c | 5.07 c | 1.35 | 0.24 b | 0.17 b | 0.52 b | 21.18 a |
| p-value | ||||||||
| Protein source | 1.00 | 0.344 | 0.464 | 1.00 | 0.242 | 0.469 | 0.229 | 0.514 |
| Carbon source | <0.001 | <0.001 | <0.001 | 0.055 | <0.001 | <0.001 | <0.001 | <0.001 |
| Interaction | <0.001 | <0.001 | <0.001 | 0.255 | <0.001 | <0.001 | <0.001 | <0.001 |
| RSD | 0.10 | 0.07 | 0.08 | 0.03 | 0.03 | 0.03 | 0.03 | 0.50 |
| Experimental Groups | Initial BW, g/fish | Final BW, g/fish | WG, g/fish | WG, % | SGR | FI, g/fish | FCR | PER | K-factor |
|---|---|---|---|---|---|---|---|---|---|
| Protein source | |||||||||
| Plant protein. | 7.93 | 49.28 b | 41.35 | 533.19 | 2.18 | 36.79 | 0.899 | 3.98 | 1.35 |
| Fish protein. | 8.41 | 50.59 a | 42.18 | 516.83 | 2.15 | 37.89 | 0.907 | 3.94 | 1.35 |
| Carbon source | |||||||||
| Control (C) | 8.63 | 45.56 c | 36.93 c | 436.68 b | 1.99 b | 36.99 | 1.01 a | 3.54 b | 1.15 c |
| B-GLY | 7.88 | 49.13 b | 41.26 b | 532.69 a,b | 2.19 a | 36.19 | 0.88 b | 4.03 a | 1.37 b |
| B-MOS | 7.99 | 55.10 a | 47.11 a | 605.66 a | 2.31 a | 38.83 | 0.82 b | 4.31 a | 1.53 a |
| Interaction protein source × carbon source | |||||||||
| C-plant protein | 8.27 | 44.24 d | 35.97 c | 438.58 c | 2.00 a,b | 36.36 | 1.01 a | 3.51 b | 1.11 c |
| C-fish protein | 8.98 | 46.88 c | 37.90 c | 434.79 c | 1.98 b | 37.62 | 1.00 a,b | 3.57 a,b | 1.19 b,c |
| B-GLY plant protein | 7.59 | 48.61 b,c | 41.01 b | 550.78 b | 2.22 a,b | 35.39 | 0.87 a,b | 4.11 a,b | 1.38 a,b |
| B-GLY fish protein | 8.16 | 49.66 b | 41.50 b | 514.59 b | 2.16 a,b | 37.00 | 0.89 a,b | 3.96 ab, | 1.36 a,b |
| B-MOS plant protein | 7.91 | 54.98 a | 47.07 a | 610.21 a | 2.32 a | 38.61 | 0.82 b | 4.33 a | 1.55 a |
| B-MOS fish protein | 8.08 | 55.22 a | 47.15 a | 601.12 a | 2.31 a,b | 39.05 | 0.83 b | 4.28 a | 1.51 a |
| p-value | |||||||||
| Protein source | 0.296 | 0.01 | 0.144 | 0.635 | 0.606 | 0.322 | 0.826 | 0.757 | 0.814 |
| Carbon source | 0.358 | <0.001 | <0.001 | <0.002 | <0.001 | 0.151 | <0.001 | <0.001 | <0.001 |
| Interaction | 0.621 | <0.001 | <0.001 | 0.019 | 0.015 | 0.405 | 0.009 | <0.001 | <0.001 |
| RSD | 1.23 | 1.28 | 1.50 | 93.22 | 0.18 | 2.99 | 0.09 | 0.39 | 0.10 |
| Experimental Groups | DM% | CP% | EE% | NFE% | Ash% |
|---|---|---|---|---|---|
| Protein source | |||||
| Plant protein. | 80.19 b | 88.44 b | 93.10 | 72.54 | 35.85 b |
| Fish protein. | 81.00 a | 91.93 a | 93.19 | 72.54 | 41.99 a |
| Carbon source | |||||
| Control (C) | 78.48 c | 87.98 c | 92.35 b | 72.47 | 37.67 b |
| B-GLY | 81.05 b | 90.98 b | 93.56 a | 72.47 | 39.65 a |
| B-MOS | 82.26 a | 91.59 a | 93.52 a | 72.71 | 39.44 a |
| Interaction protein source × carbon source | |||||
| C-plant protein | 77.46 d | 85.45 e | 92.51 c | 72.40 | 34.50 e |
| C-fish protein | 79.51 c | 90.52 c | 92.20 c | 72.53 | 40.83 c |
| B-GLY plant protein | 81.01 b | 89.51 d | 93.46 a,b | 72.56 | 36.54 d |
| B-GLY fish protein | 81.09 b | 92.45 b | 93.65 a,b | 72.56 | 42.77 a |
| B-MOS plant protein | 82.11 a | 90.36 c | 93.32 b | 72.66 | 36.52 d |
| B-MOS fish protein | 82.40 a | 92.81 a | 93.72 a | 72.74 | 42.36 b |
| p-value | |||||
| Protein source | <0.001 | <0.001 | 0.354 | 0.973 | <0.001 |
| Carbon source | <0.001 | <0.001 | <0.001 | 0.355 | <0.001 |
| Interaction | <0.001 | <0.001 | <0.001 | 0.705 | <0.001 |
| RSD | 0.44 | 0.26 | 0.27 | 0.42 | 0.28 |
| Experimental Groups | Bacillus spp. (cfu*105/mL) | Vibrio spp. (cfu*101/mL) | Pseudomonas spp. (cfu*103/mL) | Aeromonus spp. (cfu*103/mL) |
|---|---|---|---|---|
| Protein source | ||||
| Plant protein. | 10.32 | 6.62 | 6.27 | 11.53 |
| Fish protein. | 10.33 | 6.46 | 6.20 | 11.20 |
| Carbon source | ||||
| Control (C) | 5.15 c | 8.49 a | 7.70 a | 13.10 b |
| B-GLY | 6.04 b | 8.14 a | 6.5 b | 14.00 a |
| B-MOS | 19.78 a | 3.00 b | 4.5 c | 7.00 c |
| Interaction protein source x carbon source | ||||
| C- plant protein | 5.17 c | 8.78 a | 7.60 a | 13.20 a |
| C- fish protein | 5.13 c | 8.79 a | 7.80 a | 13.00 a |
| B-GLY plant protein | 5.98 b | 8.15 a | 6.60 b | 14.20 a |
| B-GLY fish protein | 6.11 b | 8.15 a | 6.40 b | 13.80 a |
| B-MOS plant protein | 19.81 a | 2.93 b | 4.60 c | 7.20 b |
| B-MOS fish protein | 19.76 a | 3.06 b | 4.40 c | 6.80 b |
| p-value | ||||
| Protein source | 0.96 | 0.56 | 0.77 | 0.35 |
| Carbon source | <0.001 | <0.001 | <0.001 | <0.001 |
| Interaction | <0.001 | <0.001 | <0.001 | <0.001 |
| RSD | 0.62 | 0.73 | 0.61 | 0.96 |
| Experimental Groups | C-Reactive Protein (mg/L) | IgM (mg/dL) | Lysozymes (U/mL) | Albumin (g/L) | Total Protein (g/L) | Globulin (g/L) |
|---|---|---|---|---|---|---|
| Protein source | ||||||
| Plant protein. | 2.98 | 34.78 b | 1.50 b | 1.68 | 3.40 | 1.72 a |
| Fish protein. | 3.00 | 35.76 a | 1.57 a | 1.92 | 3.61 | 1.69 b |
| Carbon source | ||||||
| Control (C) | 3.21 a | 32.24 c | 1.11 c | 1.44 c | 2.79 c | 1.36 c |
| B-GLY | 3.07 a | 33.95 b | 1.65 b | 1.91 b | 3.67 b | 1.76 b |
| B-MOS | 2.71 b | 39.61 a | 1.85 a | 2.06 a | 4.05 a | 1.99 a |
| Interaction protein source x carbon source | ||||||
| C-plant protein | 3.22 a | 31.02 d | 1.03 f | 1.27c | 2.57 e | 1.30 c |
| C-fish protein | 3.20 a | 33.46 c | 1.19 e | 1.60 b | 3.02 d | 1.42 c |
| B-GLY plant protein | 3.06 a | 34.06 c | 1.63 d | 1.73 b | 3.63 c | 1.90 a,b |
| B-GLY fish protein | 3.07 a | 33.85 c | 1.66 c | 2.10 a | 3.71 b,c | 1.61 b,c |
| B-MOS plant protein | 2.67 b | 39.25 b | 1.83 b | 2.04 a | 3.99 a,b | 1.95 a |
| B-MOS fish protein | 2.74 b | 39.67 a | 1.87 a | 2.07 a | 4.12 a | 2.04 a |
| p-value | ||||||
| Protein source | 0.83 | <0.001 | <0.001 | 0.028 | 0.770 | <0.001 |
| Carbon source | <0.001 | <0.001 | <0.001 | <0.001 | <0.001 | <0.001 |
| Interaction | 0.003 | <0.001 | <0.001 | <0.001 | <0.001 | <0.001 |
| RSD | 0.23 | 0.54 | 0.15 | 0.25 | 0.24 | 0.001 |
© 2020 by the authors. Licensee MDPI, Basel, Switzerland. This article is an open access article distributed under the terms and conditions of the Creative Commons Attribution (CC BY) license (http://creativecommons.org/licenses/by/4.0/).
Share and Cite
Kishawy, A.T.Y.; Sewid, A.H.; Nada, H.S.; Kamel, M.A.; El-Mandrawy, S.A.M.; Abdelhakim, T.M.N.; El-Murr, A.E.I.; Nahhas, N.E.; Hozzein, W.N.; Ibrahim, D. Mannanoligosaccharides as a Carbon Source in Biofloc Boost Dietary Plant Protein and Water Quality, Growth, Immunity and Aeromonas hydrophila Resistance in Nile Tilapia (Oreochromis niloticus). Animals 2020, 10, 1724. https://doi.org/10.3390/ani10101724
Kishawy ATY, Sewid AH, Nada HS, Kamel MA, El-Mandrawy SAM, Abdelhakim TMN, El-Murr AEI, Nahhas NE, Hozzein WN, Ibrahim D. Mannanoligosaccharides as a Carbon Source in Biofloc Boost Dietary Plant Protein and Water Quality, Growth, Immunity and Aeromonas hydrophila Resistance in Nile Tilapia (Oreochromis niloticus). Animals. 2020; 10(10):1724. https://doi.org/10.3390/ani10101724
Chicago/Turabian StyleKishawy, Asmaa T.Y., Alaa H. Sewid, Hend S. Nada, Mohamed A. Kamel, Shefaa A.M. El-Mandrawy, Taghrid M.N. Abdelhakim, Abd Elhakeem I. El-Murr, Nihal El Nahhas, Wael N. Hozzein, and Doaa Ibrahim. 2020. "Mannanoligosaccharides as a Carbon Source in Biofloc Boost Dietary Plant Protein and Water Quality, Growth, Immunity and Aeromonas hydrophila Resistance in Nile Tilapia (Oreochromis niloticus)" Animals 10, no. 10: 1724. https://doi.org/10.3390/ani10101724
APA StyleKishawy, A. T. Y., Sewid, A. H., Nada, H. S., Kamel, M. A., El-Mandrawy, S. A. M., Abdelhakim, T. M. N., El-Murr, A. E. I., Nahhas, N. E., Hozzein, W. N., & Ibrahim, D. (2020). Mannanoligosaccharides as a Carbon Source in Biofloc Boost Dietary Plant Protein and Water Quality, Growth, Immunity and Aeromonas hydrophila Resistance in Nile Tilapia (Oreochromis niloticus). Animals, 10(10), 1724. https://doi.org/10.3390/ani10101724