Article

Verification and Analysis of Sheep Tail Type-Associated PDGF-D Gene Polymorphisms

1
Key Laboratory of Animal Genetics and Breeding and Reproduction of Ministry of Agriculture, Institute of Animal Science, Chinese Academy of Agricultural Sciences, Beijing 100193, China
2
Lanzhou Institute of Husbandry and Pharmaceutical Sciences, Chinese Academy of Agricultural Sciences, Lanzhou 730050, China
3
College of Animal Science and Technology, Henan University of Animal Husbandry and Economy, Zhengzhou 450046, China
4
Inner Mongolia Academy of Animal Husbandry Science, Hohhot 010031, China
*
Authors to whom correspondence should be addressed.
These authors contributed equally to this work.
Animals 2020, 10(1), 89; https://doi.org/10.3390/ani10010089
Submission received: 11 November 2019 / Revised: 25 December 2019 / Accepted: 29 December 2019 / Published: 6 January 2020
(This article belongs to the Section Small Ruminants)

Abstract

:

Simple Summary

PDGF-D can be considered a candidate gene for selection for sheep tail type. This study investigated genetic variation of the PDGF-D gene in sheep with different tail types verified at a cellular level and revealed the molecular mechanism of PDGF-D in sheep tail fat deposition. We detected a total of two SNPs among 533 sheep. g.4122606 C > G site was significantly correlated with tail length, and g.3852134 C > T site was significantly correlated with tail width. In addition, overexpression of PDGF-D in sheep preadipocytes can promote adipogenic differentiation. The PDGF-D gene may participate in sheep tail fat deposition and could be used for molecular marker-assisted selection of sheep tail type.

Abstract

The aim of this study was to examine the correlation between the platelet-derived growth factor-D (PDGF-D) gene and sheep tail type character and explore the potential underlying mechanism. A total of 533 sheep were included in this study. Polymorphic sites were examined by Pool-seq, and individual genotype identification and correlation analysis between tail type data were conducted using the matrix-assisted laser desorption/ionization time-of-flight mass spectrometer (MALDI-TOF-MS) method. JASPART website was used to predict transcription factor binding sites in the promoter region with and without PDGF-D gene mutation. The effect of PDGF-D on adipogenic differentiation of sheep preadipocytes was investigated. Two single nucleotide polymorphism sites were identified: g.4122606 C > G site was significantly correlated with tail length, and g.3852134 C > T site was significantly correlated with tail width. g.3852134 C > T was located in the promoter region. Six transcription factor binding sites were eliminated after promoter mutation, and three new transcription factor binding sites appeared. Expression levels of peroxisome proliferator-activated receptor gamma (PPARγ) and lipoproteinlipase (LPL) were significantly up-regulated upon PDGF-D overexpression. Oil red O staining showed increased small and large oil drops in the PDGF-D overexpression group. Together these results indicate the PDGF-D gene is an important gene controlling sheep tail shape and regulating sheep tail fat deposition to a certain degree.

1. Introduction

Current studies have indicated that fat-tailed sheep developed from thin-tailed sheep [1]. The fat tail was believed to serve as an important energy reserve to adapt to harsh conditions, such as dry seasons, extreme cold winters, and food shortage [2,3,4,5]. After long-term artificial and natural selective breeding for different morphologies of ovine tails, sheep tails can be classified into five types: short-fat tail, long-fat tail, short-thin tail, long-thin tail, and fat-rumped breeds [6]. However, with the improvement of human living standards, the feeding conditions improved and dietary habits changed, thereby reducing the dependency on the fat tail as an energy reserve [3]. Furthermore, fat-tailed sheep started to show low rates of reproduction and increased feed cost. Identifying the key genes that control lipid metabolism in sheep tail could not only increase economic benefit in livestock but also provide useful information for research into fat deposition and energy storage in obesity.
Platelet-derived growth factor-D (PDGF-D), a novel member of the PDGF family, regulates many biological processes, including angiogenesis, tissue fibrosis, tumorigenesis, and lipid metabolism [7,8,9,10]. In previous studies, we examined the selection signals of different tail type sheep and found that PDGF-D is strongly selected, indicating PDGF-D may be involved in fat deposition in sheep tail or related to sheep tail type [11,12,13]. Other scientists have similarly found that PDGF-D has the strongest selection signal in different tailed sheep [14,15,16]. However, no studies have been conducted to reveal the molecular mechanism of PDGF-D in the formation of sheep tails.
In this study, we examined a group of sheep comprising 208 Hu sheep, 171 Tibetan sheep, and 154 hybrid sheep (Dorper × Hu) as the research objects. Flight mass spectrometry genotyping technology was used to detect the polymorphic site of the PDGF-D gene and associated analysis with sheep tail length, tail width, and tail circumference. Changes of transcription factor binding sites in the promoter region of PDGF-D gene with and without mutations were analyzed. The function of PDGF-D gene in fat deposition of the sheep tail was also examined. This study will improve our understanding about PDGF-D gene contribution in the marker-assisted selection for tail type characteristics of sheep.

2. Materials and Methods

2.1. Animals and Sample Collection

All the experimental procedures mentioned in the present study were approved by the Science Research Department (in charge of animal welfare issue) of the Institute of Animal Sciences, Chinese Academy of Agricultural Sciences (IAS-CAAS) (Beijing, China). Ethical approval on animal survival was given by the animal ethics committee of IAS-CAAS (No. IASCAAS-AE-03, 12 December 2016). A total of 533 sheep (24 months old), consisting of 208 Hu sheep (short-fat-tailed sheep, Wuwei, Gansu, China), 171 Tibetan sheep (short-thin-tailed sheep, Tianzhu, Gansu, China), and 154 Dorper-Hu hybrid sheep (intermediate type, Luoyang, Henan, China) were used as the experimental population for the association analysis. Animals from the same breed originated from the same farm. Blood samples were collected from all sheep. The length, width, and circumference of tail from each sheep were measured and recorded.

2.2. PCR Amplification and Mass Array Genotyping

DNA was extracted from whole blood samples using the TIANamp Genomic DNA Kit (TIANGEN Biotech, Beijing, China) according to the manufacturer’s instructions. The quantity and quality of the extracted DNA were measured using a NanoDrop 2000 spectrophotometer (Thermo, Waltham, MA, USA) and by gel electrophoresis, respectively. We constructed two DNA pools (50 ng/μL/sheep) to identify potential single nucleotide polymorphisms (SNPs). One pool was composed of 30 Tibetan sheep samples that were selected randomly. The other consisted of 30 Hu sheep samples that were selected randomly. Fifteen pairs of primers were designed using Primer 3.0 to amplify all exons of the PDGF-D gene and 1000 bp of flanking sequences based on the reference sequence. The primer pairs are listed in Table S1.
The PCR reaction mixture (25 μL) consisted of 12.5 µL 2× Taq PCR Master Mix, 1 µL Primer-F, 1 µL Primer-R, 2 μL pooled DNA, and 8.5 μL ddH2O. The PCR reaction was as follows: 94 °C for 5 min; 95 °C 30 s, Tm 30 s, 72 °C 30 s, for 35 cycles; and 72 °C for 10 min. PCR products were examined on a 2% agarose gel. PCR products were then sequenced by BoMiao Biological Technology Co., Ltd. (Beijing, China), and the sequences were compared using DNAMAN 6.0 software (https://www.lynnon.com) and Chromas 2 software (http://technelysium.com.au/wp/chromas) to detect potential SNPs.
The identified SNPs were genotyped in the experimental population using matrix-assisted laser desorption/ionization time-of-flight mass spectrometer (MALDI-TOF-MS, Thermo, Waltham, MA, USA). First, based on SNP locus information, single-base amplification and extension primers of the site to be tested were designed using Sequenom’s Assay Design 3.1 (iPlex assay, Sequenom, San Diego, CA, USA). Subsequently, the remaining dNTPs in PCR products were removed using shrimp alkaline phosphatase enzyme (SAP, Agena, San Diego, CA, USA). Third, a single base extension reaction was performed. Finally, after the sample was purified by clean resin (Sequenom), the purified product was spotted using a Mass ARRAY Nano dispenser (Sequenom), transferred to a Spectro CHIP (Sequenom), and analyzed by MALDI-TOF-MS (Sequenom).

2.3. Population Genetic Analysis of Polymorphisms in the PDGF-D Gene

Microsoft Excel 2013 (Microsoft Inc., Redmond, WA, USA) was used to calculate the allele frequencies, polymorphic information content (PIC), heterozygosity (He), and effective number of allele (Ne). The Hardy–Weinberg equilibrium was tested for each site through the chi-square test. Association analysis between SNP genotypes and/or haplotypes and three tail traits were conducted by SAS 9.2 software, based on the following animal model: yi = μ + Gi + bi + ei, in which yi was the trait measured in individual, μ was the overall mean, Gi was a fixed effect corresponding to the genotype of polymorphisms, bi was the breed effect, and ei was a random residual effect.

2.4. Bioinformatics Analysis

The promoter and coding sequences of the PDGF-D gene were obtained from NCBI (https://www.ncbi.nlm.nih.gov/). The structures of transcriptional factor (TF) binding sites before and after mutations in promoter regions were also evaluated using JASPAR (http://jaspar.binf.ku.dk/cgi-bin/jaspar_db.pl).

2.5. Cell Culture and Transfection

Sheep preadipocytes were isolated from the tail fat of a 70-day-old fetus in Hu sheep as described by Cai et al. [17]. The cells were seeded in 6-well plates overnight and cultured in DEME/F12 (Gibco, Grand Island, NY, USA) supplemented with 10% fetal bovine serum (FBS, Hyclone, Logan, UT, USA) and 2% penicillin/streptomycin at 37 °C in a humidified 5% CO2 incubator. The following day, cells were cultured in a new fresh medium containing the PDGF-D-overexpression lentiviral vector (Genechem, Shanghai, China) for 12 h. Preadipocytes were then cultured in new differentiation medium containing 10% FBS, 1 μM dexamethasone (Macklin, Shanghai, China), 0.5 mM isobutylmethylxanthine (Macklin), and 10 mg/mL insulin (Macklin) for 2 days, followed by 10 mg/mL insulin alone for 2 days. Virus without PDGF-D overexpression served as negative control. The date that cells were cultured with differentiation medium was set as the first day (1 d).

2.6. Quantitative Real-Time PCR Analysis

Cells were collected from the PDGF-D group and negative control group at various times (0, 1, 3, 5, and 7 d). Total RNA was extracted from cells using the TRIzol (Invitrogen, Carlsbad, CA, USA) method, and cDNA was synthesized from total RNA. qRT-PCR was performed using the TransStart Green qPCR SuperMix (TransStart Green, Beijing, China) and 480 II LightCycler instrument (Roche, Basel, Switzerland), and samples were analyzed in triplicate. The 2−ΔΔCt method was used to calculate the relative expression of target genes, and ACTB (beta-actin) served as the reference gene. qRT-PCR primer information is listed in Table S2.

2.7. Oil Red O Staining

Oil red O dye was produced by combining saturated oil red O original solution (Biotopped, Beijing, China) and distilled water in a ratio of 3:2 and filtering the mixture. Cells differentiated for 7 days were washed twice with PBS, fixed with 4% paraformaldehyde for 20 min, and then rinsed with distilled water. Oil red O dye was added, and cells were incubated for 10 min. Stained cells were then rinsed with distilled water 2–3 times and observed and photographed under a microscope.

2.8. Statistical Analysis

All data reported are expressed as mean ± SE. Student’s t-test was carried out using SPSS software (SPSS 17.0, Chicago, IL, USA) for statistical analysis of the data. A p value of < 0.05 was considered to be statistically significant.

3. Results

3.1. SNP Detection and Genotyping

The sequencing results revealed two SNPs in the PDGF-D gene (Figure 1): g.4122606 C > G and g.3852134 C > T. Both SNPs were genotyped and classified into three genotypes in the experimental population consisting of 208 Hu sheep, 171 Tibetan sheep, and 154 Dorper-Hu hybrid sheep (Figure 1).

3.2. Genetic Parameters Calculation

The genetic parameters calculation results are shown in Table 1. All sites were in Hardy–Weinberg status (p > 0.05). g.4122606 C > G was in moderate PIC status (0.25 < PIC < 0.5). The He and Ne of g.4122606 C > G were 0.47–0.5 and 1.88–2.0, respectively. The g.4122606 C > G site was highly variable. In addition, the alleles of g.4122606 C > G were evenly distributed. However, g.3852134 C > T showed low PIC status (PIC < 0.25), and the He and Ne were lower than those of g.4122606 C > G. These data showed that g.3852134 C > T was in a less variable status, and the alleles were unevenly distributed.

3.3. Correlation Analysis between PDGF-D Gene Polymorphism and Tail Type in Sheep

The association analysis results revealed that g.4122606 C > G was significantly related with tail length (p < 0.05, Table 2). The tail length of sheep with the GG genotype was significantly shorter than CC and CG genotype carriers. No differences were observed with tail width and circumference. However, g.3852134 C > T was significantly related with the tail width (p < 0.05, Table 2). Regarding g.4122606 C > G, the CC genotype carriers had the smallest tail length, width, and circumference. Particularly, the tail width of sheep with CC genotype was significantly narrower than TT genotypes (p < 0.05). However, the tail length and circumference showed no differences between genotypes.

3.4. Transcriptional Factor Binding Sites Prediction

The mutation g.3852134 C > T occurred in the promoter region of PDGF-D. The promoter sequence obtained from NCBI was used for predicting TF binding sites. Multiple TF binding sites were present in the promoter region, such as those for insulinoma-associated protein 1 (INSM1), homebox (HOXA5), and double homeobox 4 (DUX4) (Table 3). In addition, several TF binding sites were absent after mutation, such as those for hepatocyte nuclear factor 4γ (HNF4G) and human intestinal trefoil factor (HItf) (Table 3). Some new TF binding sites also appeared as a result of mutation, such as those for CCAAT/enhancer binding protein A (CEBPA) and Jun (Table 3).

3.5. Lentiviral Overexpression Efficiency Assay

We next used a lentivirus overexpressing PDGF-D. At 72 h after transfection, approximately 70% of cells expressed the GFP reporter gene (Figure S1A,B), indicating that PDGF-D had been successfully integrated into chromosomes. qRT-PCR results showed that the PDGF-D gene was expressed at significantly higher levels in infected cells than levels in the negative controls at every time point (Figure S1C).

3.6. Influence of Overexpressed PDGF-D on the Expression of Adipose Differentiation-Related Marker Genes

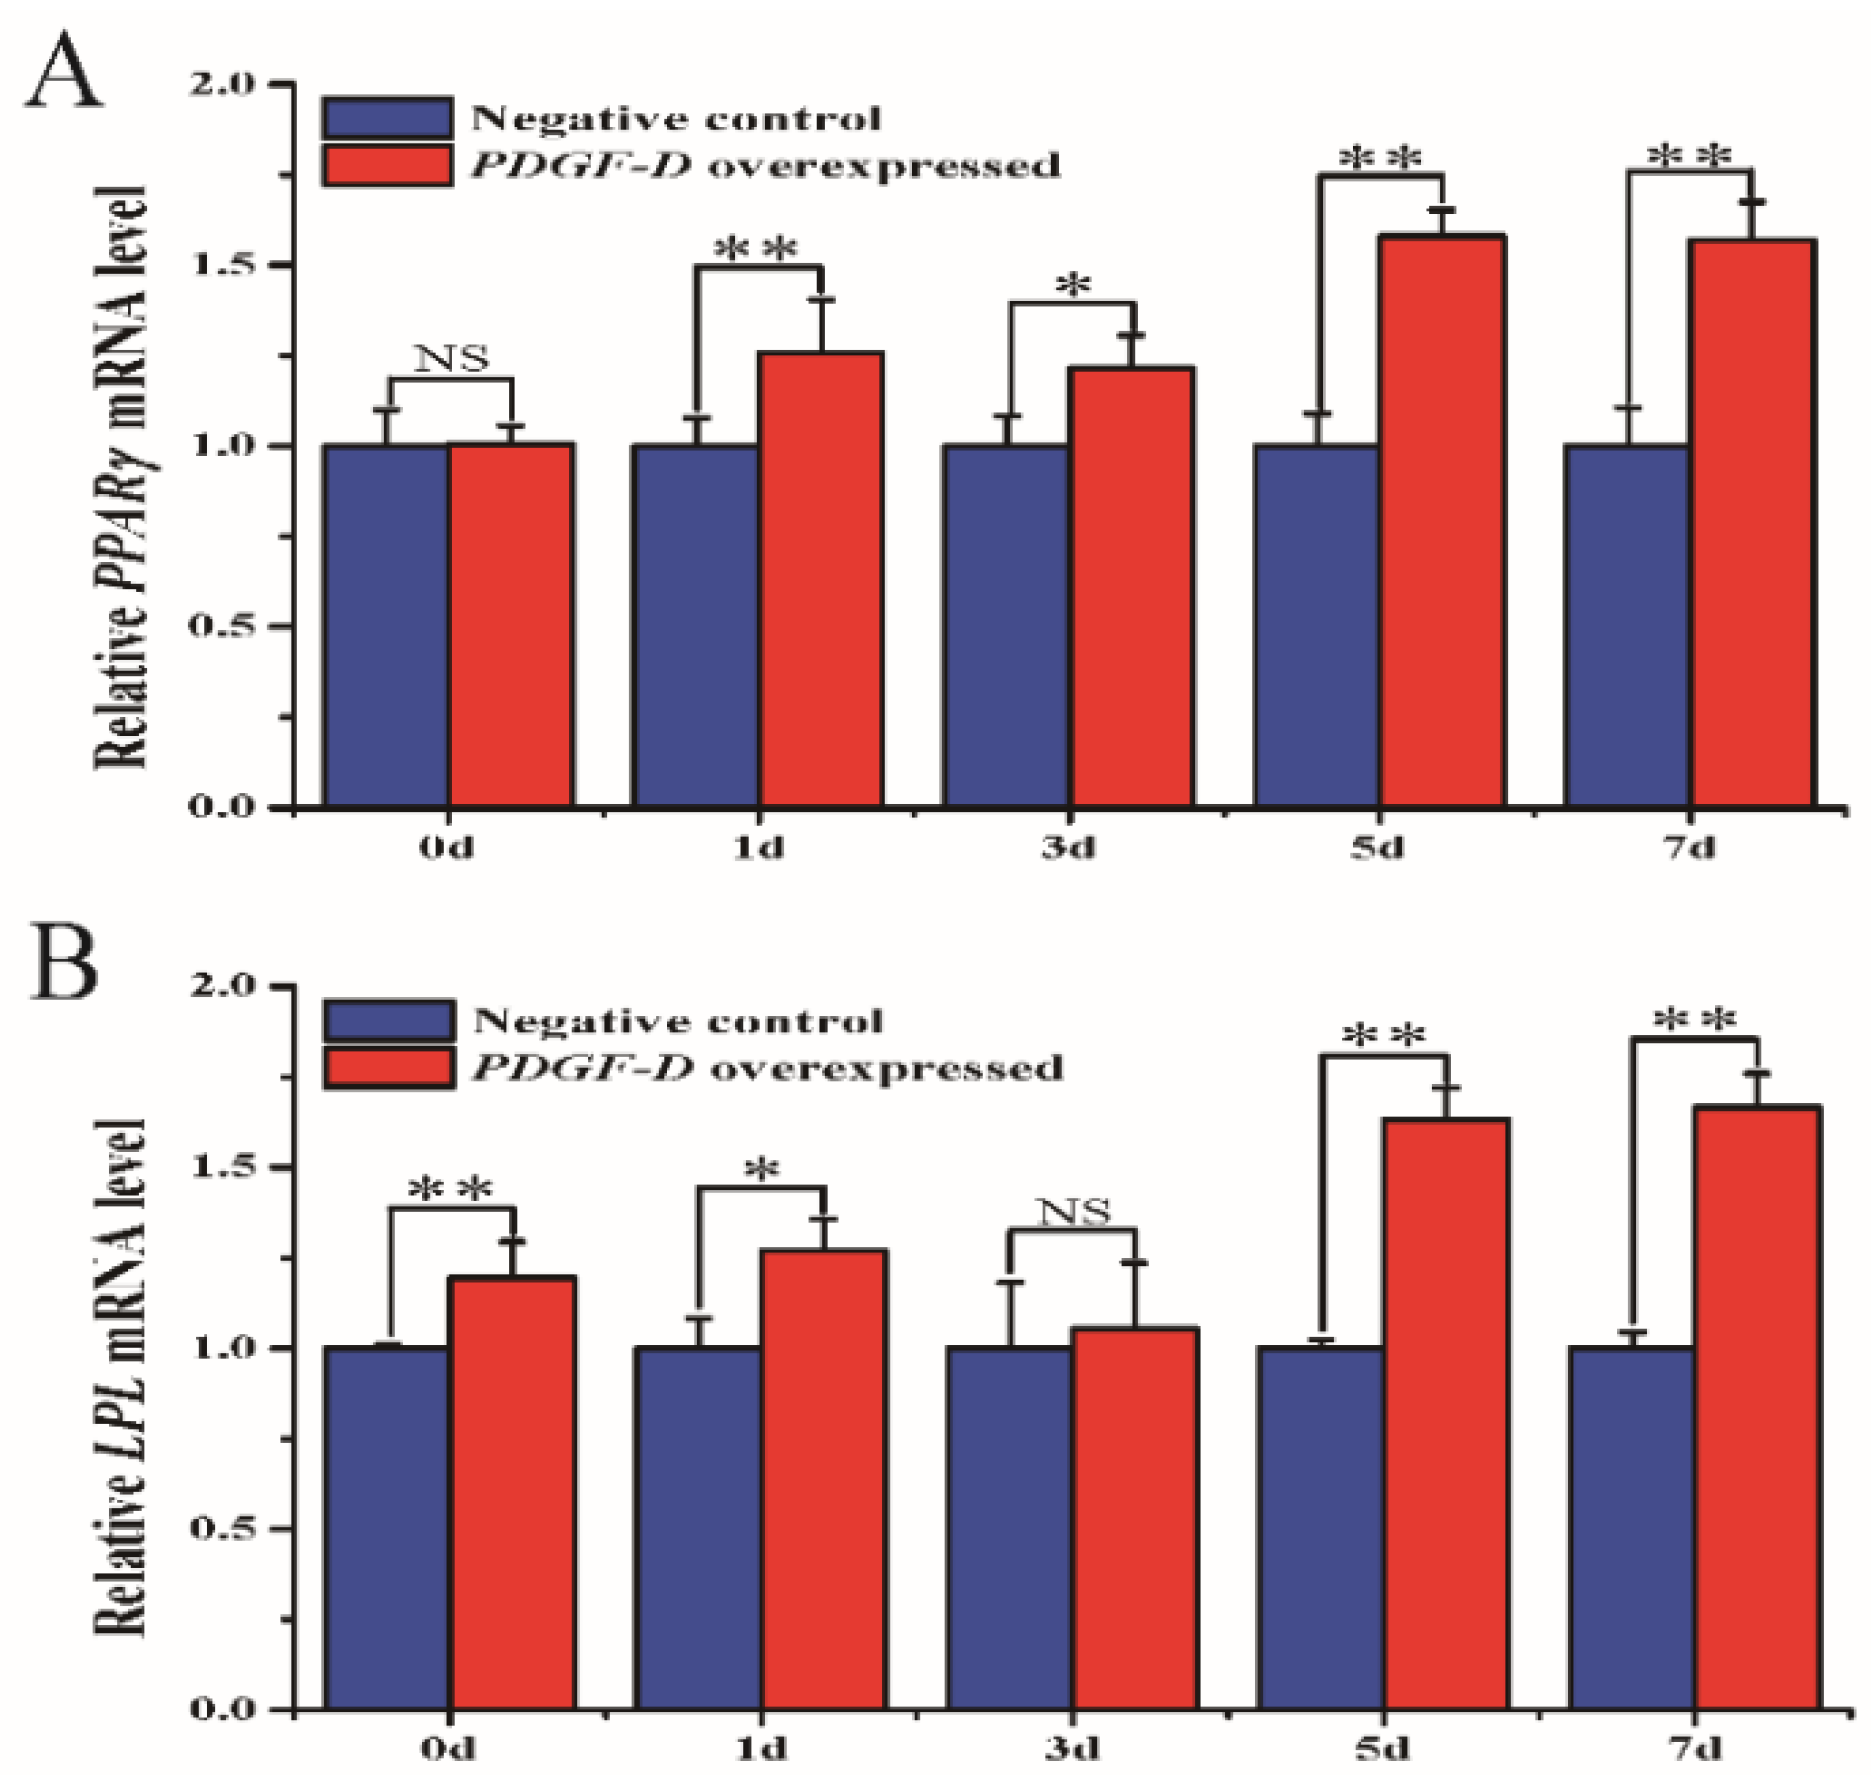
We next detected the expression level of PPARγ (peroxisome proliferator-activated receptor gamma) and LPL (lipoproteinlipase) genes, which are marker genes in adipogenesis (Figure 2). Overexpression of PDGF-D resulted in up-regulated expression level of these marker genes. The relative mRNA expression level of PPARγ was significantly higher than that of the negative control at 1, 5, and 7 d (p < 0.01), as well as at 3 d (p < 0.05). The relative mRNA expression level of LPL was significantly higher than that of the negative control at 0, 5, and 7 d (p < 0.01), as well as 1 d (p < 0.05). No significant difference was observed in the expression level of LPL at 3 d.

3.7. Oil Red O Staining

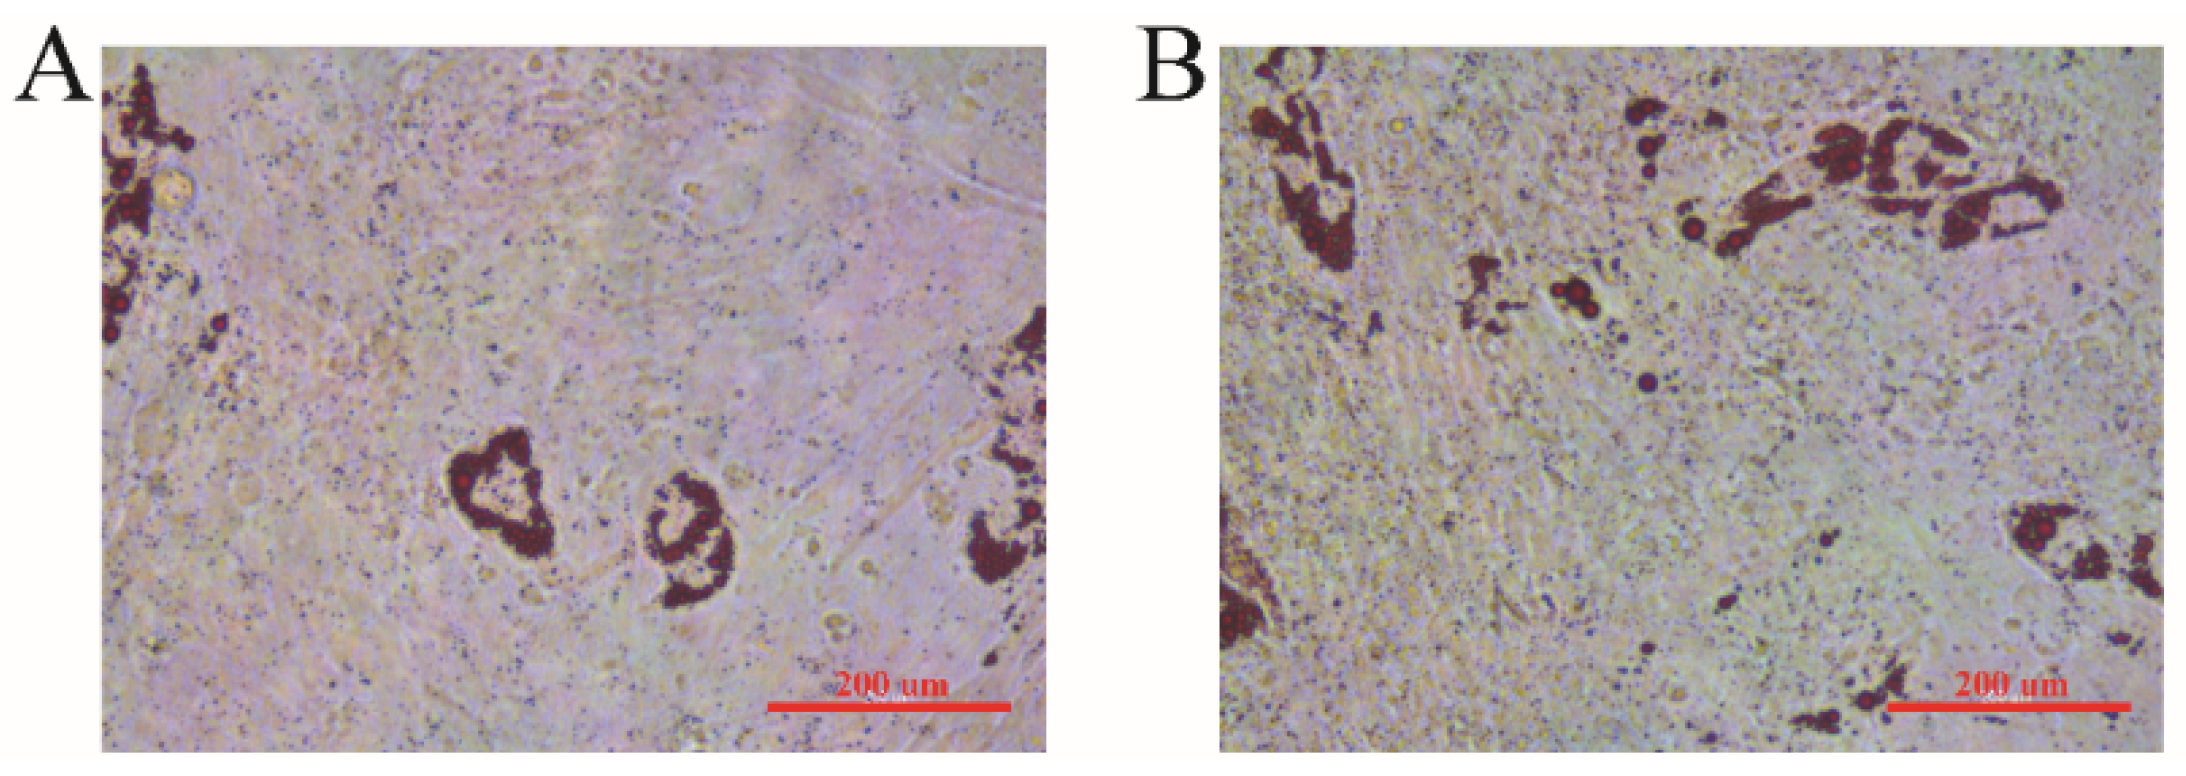
We performed oil red O staining on sheep preadipocytes on day 7 after induction of differentiation. As shown in Figure 3, many little lipid drops were stained in red, and the lipid ring was observed. The number of lipid drops in the PDGF-D overexpression group was higher than that in the negative control. These results suggested that PDGF-D could promote the formation of lipid drops in adipocytes in vitro.

4. Discussion

Many studies have suggested that PDGF-D may be associated with tail type [11,12,13,14,15,16]. However, few studies have conducted functional verification of PDGF-D in controlling the formation of sheep tails. In our research, we identified two SNPs in the PDGF-D gene that were related to tail traits. The g.4122606 C > G mutation was associated with tail length, and this mutation occurs in an intron region. While introns are not expressed as protein, they play a crucial role in transcriptional regulation [18], such as by encoding microRNA to regulate target genes [19], performing as promoters or enhancers, and participating in alternative splicing [20,21,22,23,24]. The g.4122606 C > G locus showed moderate polymorphism, relatively high heterozygosity, and a large degree of genetic variation, which could bring more selection effects. The g.3852134 C > T locus has lower polymorphism, lower heterozygosity, and less genetic variation, which may be related to the highly selective breeding of the experimental population during breeding. Compared with the g.4122606 C > G locus, the number of effective alleles at the g.3852134 C > T locus is smaller, indicating the uneven distribution of the g.3852134 C > T locus in the test population may be related to the selection and matching system of the test population.
TFs play significant roles in regulating gene expression. The mutation g.3852134 C > T located in the promoter region was associated with tail width. Previous studies showed that mutations in promoter regions may change TF binding sites [25,26,27]. Our results showed that some new TF binding sites appeared in the promoter harboring mutations, such as sites for C/EBPα and Jun. C/EBPα functions to trigger differentiation of preadipocytes into mature adipocytes [28,29]. Some studies showed the slight increase in C/EBPα expression after the decrease of C/EBPβ and C/EBPδ before the expression of adipocyte-specific genes [30,31]. C/EBP families participate in the early stage in adipogenesis. As a pleiotropic transcriptional activator, C/EBPα transactivates promoters from numerous adipocyte genes [4]. In addition, some reports showed that forced expression of C/EBPα in 3T3-L1 preadipocytes stimulated adipogenesis without any hormonal induction [2,3,5]. In contrast, blocking expression of C/EBPα inhibited adipogenesis [32]. Furthermore, some studies showed that C/EBPα is a key regulator related with insulin sensitivity. These observations demonstrated that C/EBPα is required for preadipocyte differentiation. Jun and Fos form a dipolymer named AP-1 (activator protein-1), which is an important positive regulator in adipogenesis.
Previous studies indicated that the PDGF family can promote preadipocyte proliferation and inhibit preadipocyte differentiation [33,34]. Another study showed that PDGF-BB can promote the adipogenic differentiation of fibroblasts [35]. These results indicate that the PDGF family participates in fat metabolism. In addition, the expression levels of adipose differentiation marker genes (PPARγ and LPL) significantly increased after the overexpression of PDGF-D in sheep preadipocytes, indicating PDGF-D plays a certain role in the tail fat deposition process of the sheep. Oil red O revealed increased accumulation of big and small lipid droplets after the overexpression of PDGF-D compared with the control group, which further proved the important role of PDGF-D in the tail fat deposition process of t sheep.
PDGF-D promotes mitosis, proliferation and division of vascular smooth muscle cells, and formation of new blood vessels [36]. The sheep tail is rich in blood capillaries. Angiogenesis and organofaction are two closely related processes in that the former is the premise of the latter. Oxygen and nutriments can be delivered to tissue after angiopoiesis. Whether PDGF-D participates in angiopoiesis and then adipogenesis or if it directly controls fat development should be examined in further studies. In addition, studies have shown that PDGF-D is related to sheep body size in various environments, and PDGF-D may also directly regulate sheep tail size [37].

5. Conclusions

The PDGF-D gene shows polymorphisms in sheep. g.4122606 C > G was significantly correlated with tail length and g.3852134 C > T was significantly correlated with tail width. In addition, overexpressed PDGF-D in sheep preadipocytes can promote adipogenic differentiation. This result can be applied to molecular marker-assisted selection of sheep tail type.

Supplementary Materials

The following are available online at https://www.mdpi.com/2076-2615/10/1/89/s1, Table S1: Primers used in this study for PCR, Table S2: Primers used in this study for qRT-PCR, Table S3: The breed effect, Figure S1: Detection of overexpression efficiency of the PDGF-D gene. (A) Positive cells observed using a light microscope (20×). (B) Positive cells observed using a fluorescence microscope (20×). (C) Relative mRNA expression levels of the PDGF-D gene.

Author Contributions

Conceptualization, C.W. and Q.L.; formal analysis, Q.L. and Z.L.; investigation, M.J. and X.F.; resources, K.Q., Y.L. and L.M.; writing—original draft preparation, Q.L.; writing—review and editing, Q.L.; project administration, M.C., H.W. and C.W. All authors have read and agreed to the published version of the manuscript.

Funding

This research was supported by the National Natural Science Foundation of China (No. 31672380) and the National Modern Agricultural Industry Technology Fund for Scientists in Sheep Industry System (No. CARS-38).

Conflicts of Interest

The authors declare no conflict of interest.

Abbreviations

The following abbreviations are used in this manuscript:
ACTBβ-actin
Heheterozygosity
LPLlipoproteinlipase
MALDI-TOF-MSmatrix-assisted laser desorption/ionization time-of-flight mass spectrometer
Neeffective allele number
PDGF-Dplatelet-derived growth factor-D
PICpolymorphic information content
PPARγperoxisome proliferator-activated receptor gamma
qRT-PCRquantitative real-time PCR
SNPsingle nucleotide polymorphism
TFtranscriptional factor

References

  1. Moradi, M.H.; Nejati-Javaremi, A.; Moradi-Shahrbabak, M.; Dodds, K.G.; McEwan, J.C. Genomic scan of selective sweeps in thin and fat tail sheep breeds for identifying of candidate regions associated with fat deposition. BMC Genet. 2012, 13, 10. [Google Scholar] [CrossRef] [PubMed] [Green Version]
  2. Ma, Y.H.; Rao, S.Q.; Lu, S.J.; Hou, G.Y.; Guan, W.J.; Li, H.B.; Li, X.; Zhao, Q.J.; Guo, J. Phylogeography and origin of sheep breeds in northern China. Conserv. Genet. 2006, 7, 117–127. [Google Scholar] [CrossRef]
  3. Nejati-Javaremi, A.R.; Izadi, F.A.; Rahmati, G.H.; Moradi, M.O.; Izadi, F. Selection in fat-tailed sheep based on two traits of fat-tail and body weight versus single-trait total body weight. Int. J. Agric. Biol. 2007, 9, 645–648. [Google Scholar]
  4. Lv, F.H.; Peng, W.F.; Yang, J.; Zhao, Y.X.; Li, W.R.; Liu, M.J.; Ma, Y.H.; Zhao, Q.J.; Yang, G.L.; Wang, F.; et al. Mitogenomic meta-analysis identifies two phases of migration in the history of eastern Eurasian sheep. Mol. Biol. Evol. 2015, 32, 2515–2533. [Google Scholar] [CrossRef] [PubMed] [Green Version]
  5. Moioli, B.; Pilla, F.; Ciani, E. Signatures of selection identify loci associated with fat tail in sheep. J. Anim. Sci. 2015, 93, 4660–4669. [Google Scholar] [CrossRef] [PubMed]
  6. Mastrangelo, S.; Bahbahani, H.; Moioli, B.; Ahbara, A.; Al Abri, M.; Almathen, F.; da Silva, A.; Belabdi, I.; Portolano, B.; Mwacharo, J.M.; et al. Novel and known signals of selection for fat deposition in domestic sheep breeds from Africa and Eurasia. PLoS ONE 2019, 14, e0209632. [Google Scholar] [CrossRef] [Green Version]
  7. Wang, Y.; Qiu, H.F.; Hu, W.X.; Li, S.R.; Yu, J.J. Over-expression of platelet-derived growth factor-D promotes tumor growth and invasion in endometrial cancer. Int. J. Mol. Sci. 2014, 15, 4780–4794. [Google Scholar] [CrossRef] [Green Version]
  8. Hye Kim, J.; Gyu Park, S.; Kim, W.K.; Song, S.U.; Sung, J.H. Functional regulation of adipose-derived stem cells by PDGF-D. Stem Cells 2015, 33, 542–556. [Google Scholar] [CrossRef]
  9. Aguilar, A. Renal fibrosis: PDGF-D in renal fibrosis. Nat. Rev. Nephrol. 2016, 12, 257. [Google Scholar] [CrossRef]
  10. Gladh, H.; Folestad, E.B.; Muhl, L.; Ehnman, M.; Tannenberg, P.; Lawrence, A.L.; Betsholtz, C.; Eriksson, U. Mice lacking platelet-derived growth factor D display a mild vascular phenotype. PLoS ONE 2016, 11, e0152276. [Google Scholar] [CrossRef]
  11. Wei, C.H.; Wang, H.H.; Liu, G.; Wu, M.M.; Cao, J.X.; Liu, Z.; Liu, R.Z.; Zhao, F.P.; Zhang, L.; Lu, J.; et al. Genome-wide analysis reveals population structure and selection in Chinese indigenous sheep breeds. BMC Genet. 2015, 16, 194. [Google Scholar] [CrossRef] [PubMed] [Green Version]
  12. Zhu, C.Y.; Fan, H.Y.; Yuan, Z.H.; Hu, S.J.; Ma, X.M.; Xuan, J.L.; Wang, H.W.; Zhang, L.; Wei, C.H.; Zhang, Q.; et al. Genome-wide detection of CNVs in Chinese indigenous sheep with different types of tails using ovine high-density 600K SNP arrays. Sci. Rep. 2016, 6, 27822. [Google Scholar] [CrossRef] [PubMed] [Green Version]
  13. Yuan, Z.H.; Liu, E.M.; Liu, Z.; Kijas, J.W.; Zhu, C.Y.; Hu, S.J.; Ma, X.M.; Zhang, L.; Du, L.X.; Wang, H.H.; et al. Selection signature analysis reveals genes associated with tail type in Chinese indigenous sheep. Anim. Genet. 2017, 48, 55–66. [Google Scholar] [CrossRef] [PubMed]
  14. Yang, J.; Li, W.R.; Lv, F.H.; He, S.G.; Tian, S.L.; Peng, W.F.; Sun, Y.W.; Zhao, Y.X.; Tu, X.L.; Zhang, M.; et al. Whole-genome sequencing of native sheep provides insights into rapid adaptations to extreme environments. Mol. Biol. Evol. 2016, 33, 2576–2592. [Google Scholar] [CrossRef] [Green Version]
  15. Zhao, Y.X.; Yang, J.; Lv, F.H.; Hu, X.J.; Xie, X.L.; Zhang, M.; Li, W.R.; Liu, M.J.; Wang, Y.T.; Li, J.Q.; et al. Genomic reconstruction of the history of native sheep reveals the peopling patterns of nomads and the expansion of early pastoralism in East Asia. Mol. Biol. Evol. 2017, 34, 2380–2395. [Google Scholar] [CrossRef]
  16. Mastrangelo, S.; Moioli, B.; Ahbara, A.; Latairish, S.; Portolano, B.; Pilla, F.; Ciani, E. Genome-wide scan of fat-tail sheep identifies signals of selection for fat deposition and adaptation. Anim. Prod. Sci. 2019, 59, 835–848. [Google Scholar] [CrossRef]
  17. Cai, Y.; Yang, J.T.; Ma, Z.R.; Lu, J.X.; Zang, R.X.; Wu, J.P. Primary culture and differentiation of ovine preadipocytes. Chin. J. Anim. Nutr. 2010, 22, 1768–1774. [Google Scholar]
  18. Bhattacharyya, N.; Banerjee, D. Transcriptional regulatory sequences within the first intron of the chicken apolipoproteinAI (apoAI) gene. Gene 1999, 234, 371–380. [Google Scholar] [CrossRef]
  19. Horie, T.; Ono, K.; Horiguchi, M.; Nishi, H.; Nakamura, T.; Nagao, K.; Kinoshita, M.; Kuwabara, Y.; Marusawa, H.; Iwanaga, Y.; et al. MicroRNA-33 encoded by an intron of sterol regulatory element-binding protein 2 (Srebp2) regulates HDL in vivo. Proc. Natl. Acad. Sci. USA 2010, 107, 17321–17326. [Google Scholar] [CrossRef] [Green Version]
  20. Slater, E.P.; Rabenau, O.; Karin, M.; Baxter, J.D.; Beato, M. Glucocorticoid receptor binding and activation of a heterologous promoter by dexamethasone by the first intron of the human growth hormone gene. Mol. Cell. Biol. 1985, 5, 2984–2992. [Google Scholar] [CrossRef] [Green Version]
  21. Mack, C.P.; Owens, G.K. Regulation of smooth muscle alpha-actin expression in vivo is dependent on CArG elements within the 5’ and first intron promoter regions. Circ. Res. 1999, 84, 852–861. [Google Scholar] [CrossRef] [PubMed] [Green Version]
  22. Dietrich, R.C.; Shukla, G.C.; Fuller, J.D.; Padgett, R.A. Alternative splicing of U12-dependent introns in vivo responds to purine-rich enhancers. RNA 2001, 7, 1378–1388. [Google Scholar] [PubMed]
  23. Schjerven, H.; Brandtzaeg, P.; Johansen, F.E. A novel NF-kappa B/Rel site in intron 1 cooperates with proximal promoter elements to mediate TNF-alpha-induced transcription of the human polymeric Ig receptor. J. Immunol. 2001, 167, 6412–6420. [Google Scholar] [CrossRef] [PubMed] [Green Version]
  24. Hube, F.; Guo, J.; Chooniedass-Kothari, S.; Cooper, C.; Hamedani, M.K.; Dibrov, A.A.; Blanchard, A.A.; Wang, X.M.; Deng, G.; Myal, Y.; et al. Alternative splicing of the first intron of the steroid receptor RNA activator (SRA) participates in the generation of coding and noncoding RNA isoforms in breast cancer cell lines. DNA Cell Biol. 2006, 25, 418–428. [Google Scholar] [CrossRef] [PubMed]
  25. Wang, X.B.; Pirskanen, R.; Giscombe, R.; Lefvert, A.K. Two SNPs in the promoter region of the CTLA-4 gene affect binding of transcription factors and are associated with human myasthenia gravis. J. Intern. Med. 2008, 263, 61–69. [Google Scholar] [CrossRef]
  26. Knappskog, S.; Lonning, P.E. Effects of the MDM2 promoter SNP285 and SNP309 on Sp1 transcription factor binding and cancer risk. Transcription 2011, 2, 207–210. [Google Scholar] [CrossRef] [Green Version]
  27. Knappskog, S.; Bjornslett, M.; Myklebust, L.M.; Huijts, P.E.; Vreeswijk, M.P.; Edvardsen, H.; Guo, Y.; Zhang, X.; Yang, M.; Ylisaukko-Oja, S.K.; et al. The MDM2 promoter SNP285C/309G haplotype diminishes Sp1 transcription factor binding and reduces risk for breast and ovarian cancer in Caucasians. Cancer Cell 2011, 19, 273–282. [Google Scholar] [CrossRef]
  28. Yeh, W.C.; Cao, Z.D.; Classon, M.; McKnight, S.L. Cascade regulation of terminal adipocyte differentiation by three members of the C/EBP family of leucine zipper proteins. Genes Dev. 1995, 9, 168–181. [Google Scholar] [CrossRef] [Green Version]
  29. Ohlsson, E.; Hasemann, M.S.; Willer, A.; Lauridsen, F.K.; Rapin, N.; Jendholm, J.; Porse, B.T. Initiation of MLL-rearranged AML is dependent on C/EBPalpha. J. Exp. Med. 2014, 211, 5–13. [Google Scholar] [CrossRef] [Green Version]
  30. Hausman, G.J. The influence of dexamethasone and insulin on expression of CCAAT/enhancer binding protein isoforms during preadipocyte differentiation in porcine stromal-vascular cell cultures: Evidence for very early expression of C/EBPalpha. J. Anim. Sci. 2000, 78, 1227–1235. [Google Scholar] [CrossRef]
  31. Sakakura, Y.; Shimano, H.; Sone, H.; Takahashi, A.; Inoue, N.; Toyoshima, H.; Suzuki, S.; Yamada, N. Sterol regulatory element-binding proteins induce an entire pathway of cholesterol synthesis. Biochem. Biophys. Res. Commun. 2001, 286, 176–183. [Google Scholar] [CrossRef] [PubMed]
  32. Safdarian, M.; Zamiri, M.J.; Hashemi, M.; Noorolahi, H. Relationships of fat-tail dimensions with fat-tail weight and carcass characteristics at different slaughter weights of Torki-Ghashghaii sheep. Meat Sci. 2008, 80, 686–689. [Google Scholar] [CrossRef] [PubMed]
  33. Artemenko, Y.; Gagnon, A.; Aubin, D.; Sorisky, A. Anti-adipogenic effect of PDGF is reversed by PKC inhibition. J. Cell. Physiol. 2005, 204, 646–653. [Google Scholar] [CrossRef] [PubMed]
  34. Holmstrom, T.E.; Mattsson, C.L.; Falting, J.M.; Nedergaard, J. Differential signalling pathways for EGF versus PDGF activation of Erk1/2 MAP kinase and cell proliferation in brown pre-adipocytes. Exp. Cell Res. 2008, 314, 3581–3592. [Google Scholar] [CrossRef]
  35. Virakul, S.; Dalm, V.A.; Paridaens, D.; van den Bosch, W.A.; Mulder, M.T.; Hirankarn, N.; van Hagen, P.M.; Dik, W.A. Platelet-derived growth factor-BB enhances adipogenesis in orbital fibroblasts. Investig. Ophthalmol. Vis. Sci. 2015, 56, 5457–5464. [Google Scholar] [CrossRef] [PubMed]
  36. Kurasawa, K.; Arai, S.; Owada, T.; Maezawa, R.; Kumano, K.; Fukuda, T. Autoantibodies against platelet-derived growth factor receptor alpha in patients with systemic lupus erythematosus. Mod. Rheumatol. 2010, 20, 458–465. [Google Scholar] [CrossRef]
  37. Xu, S.S.; Li, M.H. Recent advances in understanding genetic variants associated with economically important traits in sheep (Ovis aries) revealed by high-throughput screening technologies. Front. Agric. Sci. Eng. 2017, 4, 279–288. [Google Scholar] [CrossRef] [Green Version]
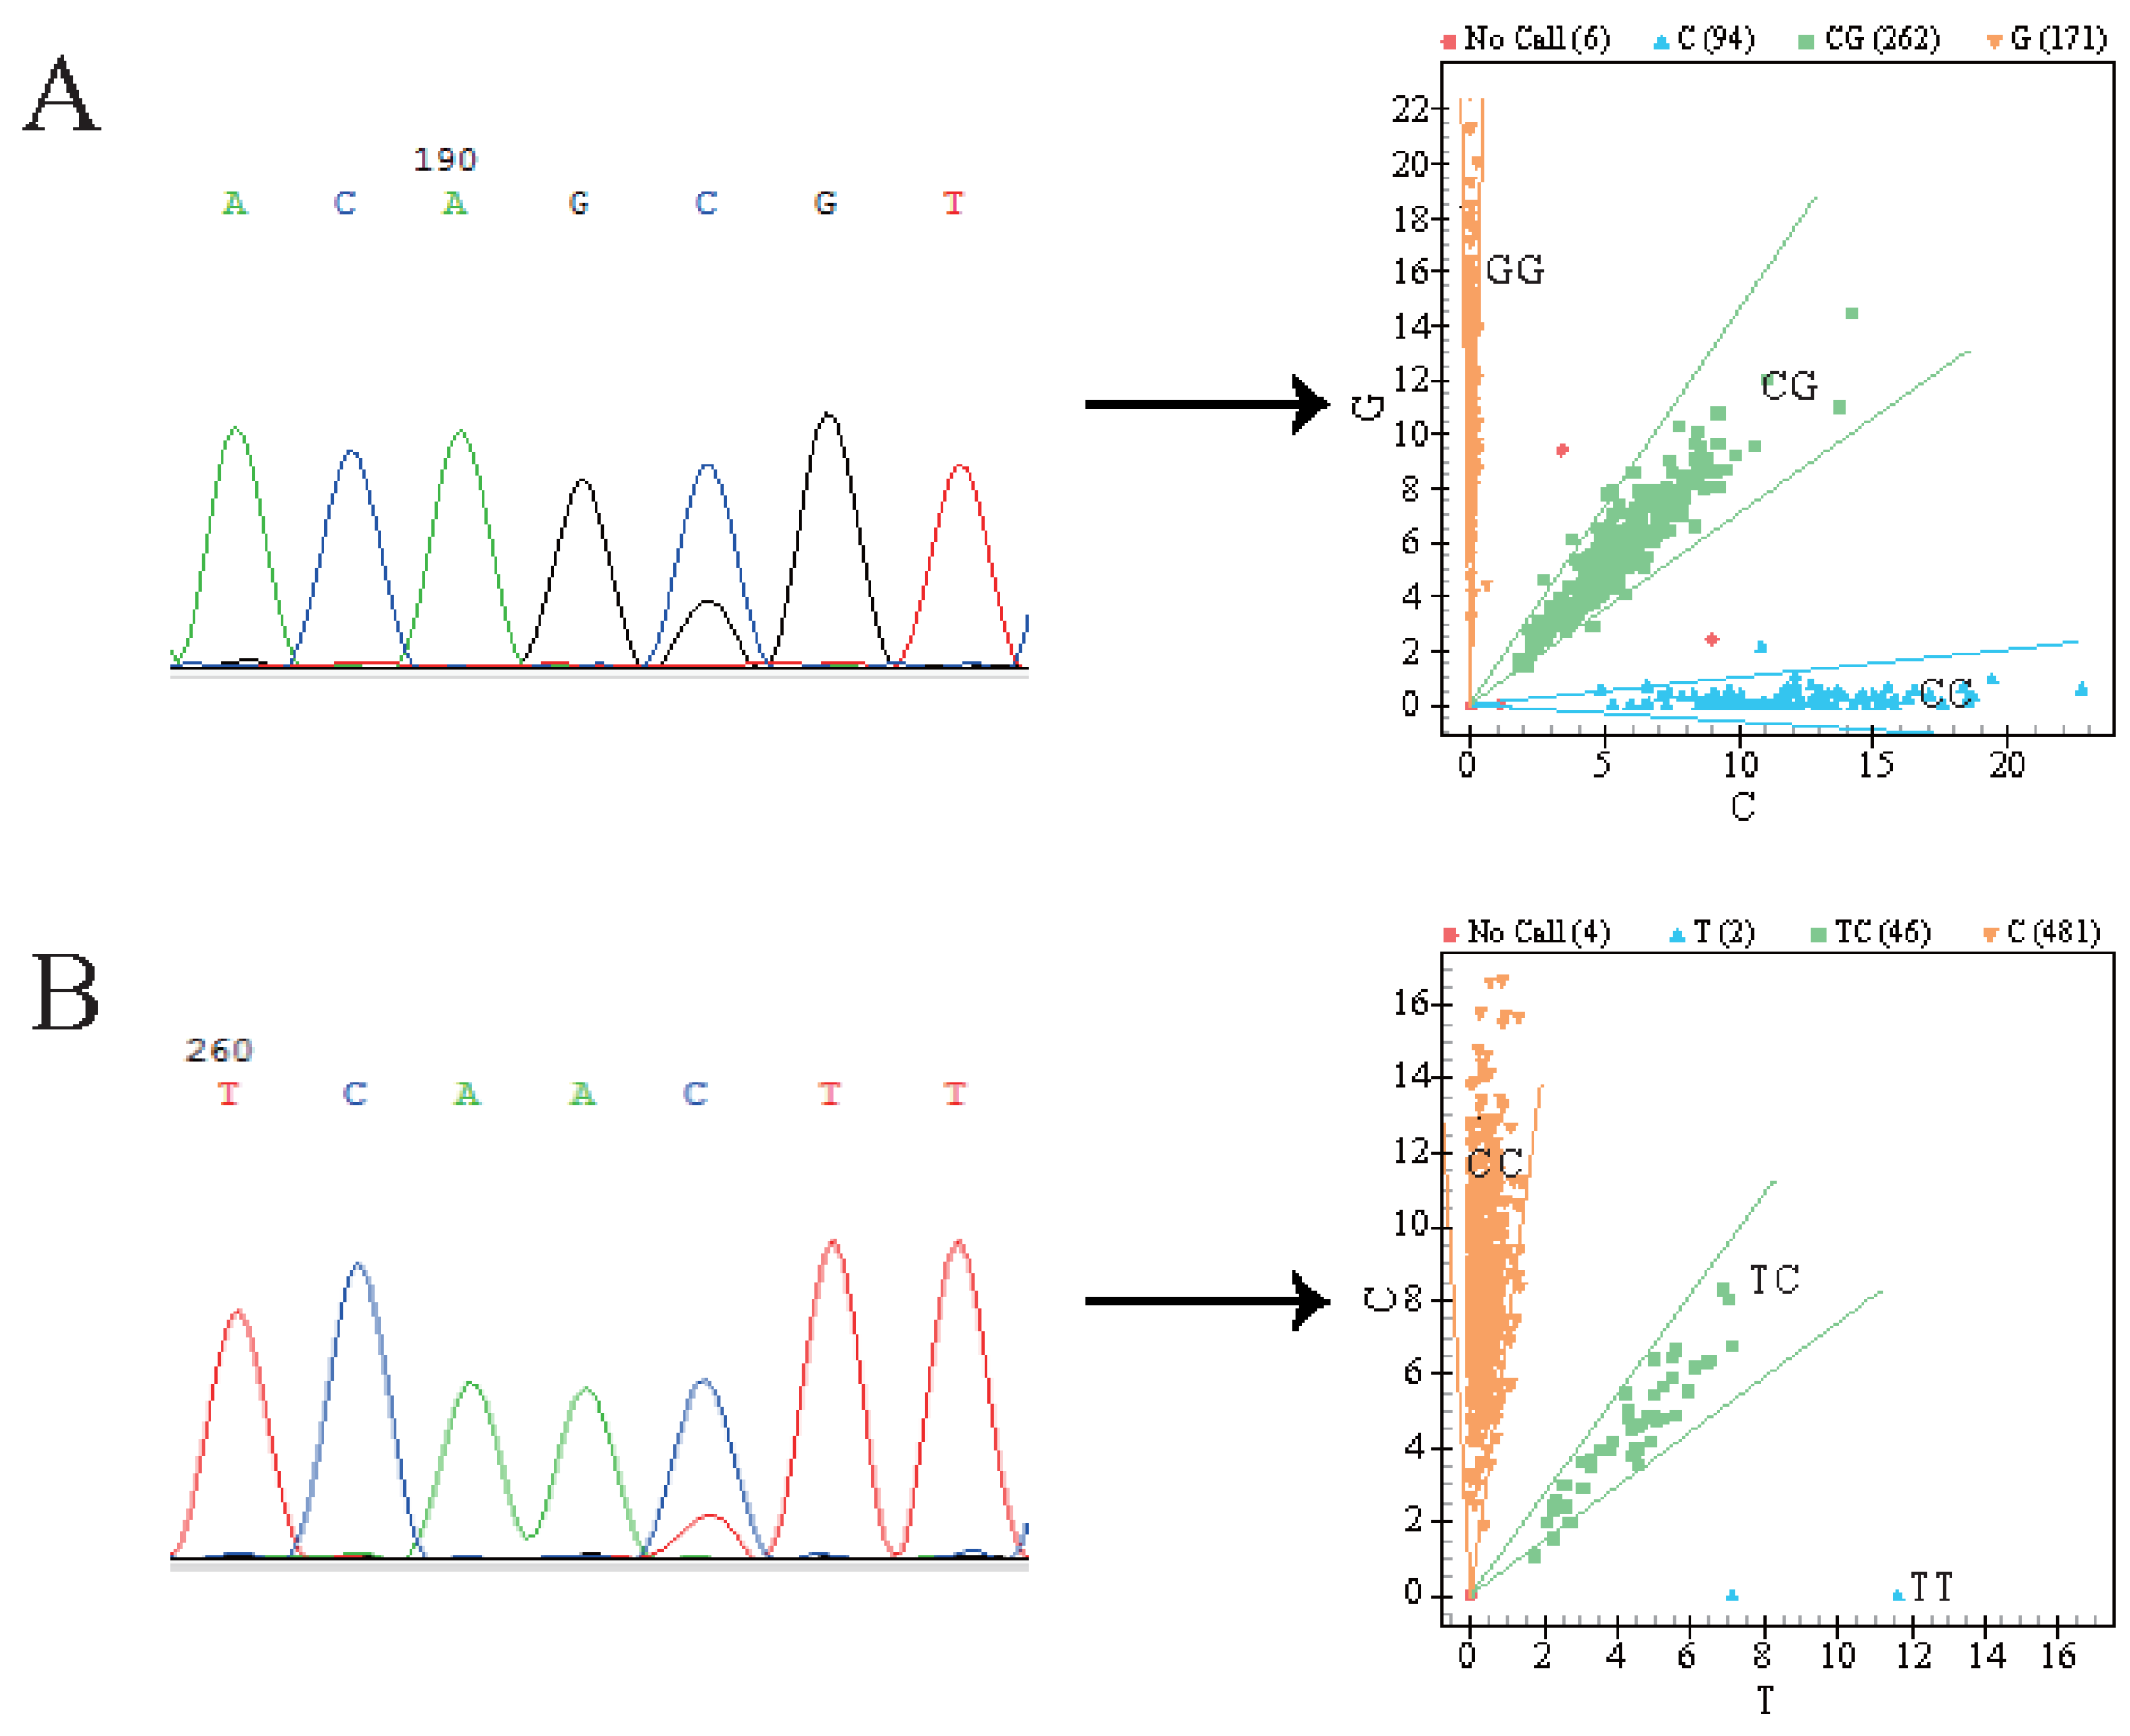
Figure 1. PDGF-D gene pool sequencing and genotyping results. (A) Site of g.4122606 C > G. (B) Site of g.3852134 C > T. Yellow region, blue region, and green region represent different genotypes. Numbers in brackets indicate number of individuals of the three genotypes.
Animals 10 00089 g001
Figure 2. mRNA expression of the PPARγ and LPL genes. (A) mRNA expression of the PPARγ gene. (B) mRNA expression of the LPL gene. * p < 0.05, ** p < 0.01, NS: no significant difference.
Animals 10 00089 g002
Figure 3. Oil red O staining when overexpressing the PDGF-D gene in sheep preadipocytes after 7 days of induced differentiation. (A) Control group. (B) PDGF-D overexpressed group.
Animals 10 00089 g003
Table 1. Genetic parameter calculation of g.4122606 C > G and g.3852134 C > T.
LocusBreedGenotypeGenotype FrequencyAllele FrequencyHeNePICHardy–Weinberg Test (p-Value)
g.4122606 C > GHu sheepCC (23)0.110577C (0.38)
G (0.63)
0.471.880.360.064457718
CG (110)0.528846
GG (75)0.360577
Tibetan sheepCC (49)0.286550C (0.52)
G (0.48)
0.52.00.370.50856548
CG (81)0.473684
GG (41)0.239766
Hybrid sheepCC (24)0.155844C (0.39)
G (0.61)
0.481.910.360.832708982
CG (72)0.467532
GG (58)0.376623
g.3852134 C > THu sheepCC (187)0.899038C (0.94)
T (0.06)
0.101.120.100.070148151
CT (19)0.091346
TT (2)0.009615
Tibetan sheepCC (157)0.918129C (0.96)
T (0.04)
0.081.090.080.576740804
CT (14)0.081871
TT (0)0.000000
Hybrid sheepCC (141)0.915584C (0.96)
T (0.04)
0.081.090.080.584470126
CT (13)0.084416
TT (0)0.000000
Table 2. Association analysis of PDGF-D gene with tail traits.
LocusGenotypeTail Length
(cm)
Tail Width
(cm)
Tail Circumference
(cm)
g.4122606 C > GCC19.940 ± 0.276 a9.897 ± 0.20220.424 ± 0.414
CG19.733 ± 0.166 a,b9.751 ± 0.12120.230 ± 0.249
GG19.168 ± 0.204 b9.480 ± 0.14919.611 ± 0.306
g.3852134 C > TCC19.543 ± 0.1239.657 ± 0.089 a20.026 ± 0.183
CT20.060 ± 0.3969.912 ± 0.288 a,b20.257 ± 0.590
TT19.581 ± 1.90312.996 ± 1.382 b25.756 ± 2.837
Note: The size of the sheep’s tail in adulthood (tail length, tail width, and tail circumference) is basically determined, and the difference within the same variety is small. Therefore, we finally merged the three breeds of sheep into one large group for correlation analysis. In the same column, values with different lower-case letters are significantly different (p < 0.05).
Table 3. Transcriptional factor binding prediction in the PDGF-D promoter region with mutation at g.3852134 C > T.
GroupModel IDMelel NameScoreRelative ScoreStartEndStrandPredicted Site Sequence
Transcriptional factor binding sites before mutationMA0484.1HNF4G5.1730.81593069560891884898−1GAAGTTGAGGGGGCA
MA0155.1INSM19.0350.833563663883174884895−1GTTGAGGGGGCA
MA0504.1NR2C210.4470.852923410523265884898−1GAAGTTGAGGGGGCA
MA0528.1ZNF2637.6650.818705635466418884904−1GGTGAAGAAGTTGAGGGGGCA
MA0503.1Nkx2-54.6720.826755938995108885895−1GCCCCCTCAAC
MA0528.1ZNF2638.6840.827686489190624885905−1AGGTGAAGAAGTTGAGGGGGC
MA0027.1En14.6600.810707218857438887897−1AAGTTGAGGGG
MA0158.1HOXA54.7490.82019043611391890897−1CTCAACTT
MA0130.1ZNF354C4.6360.812679270758179890895−1CTCAAC
MA0468.1DUX40.4910.811042995629078892902−1CAACTTCTTCA
MA0109.1Hltf5.1620.86314820468518892901−1CAACTTCTTC
MA0080.3Spi18.6050.859723524619004892906−1AAGGTGAAGAAGTTG
MA0466.1CEBPB−1.5890.8032832327232088939031AACTTCTTCAC
MA0158.1HOXA54.3770.807088931935232893900−1AAGAAGTT
MA0598.1EHF6.5100.8694379144770328949011ACTTCTTC
Transcriptional factor binding sites after mutationMA0155.1INSM17.8030.807735310463782884895−1ATTGAGGGGGCA
MA0528.1ZNF2637.2110.814704352256615884904−1GGTGAAGAAATTGAGGGGGCA
MA0528.1ZNF2637.0800.813549796969205885905−1AGGTGAAGAAATTGAGGGGGC
MA0158.1HOXA54.7490.820190436113918908971CTCAATTT
MA0063.1Nkx2-56.2600.8769148647718098918971TCAATTT
MA0468.1DUX41.2150.8189240660229538929021CAATTTCTTCA
MA0075.1Prrx24.7660.819222411057098892896−1AATTG
MA0080.3Spi14.7620.817634453369339892906−1AAGGTGAAGAAATTG
MA0466.1CEBPB8.7140.9112807282655318939031AATTTCTTCAC
MA0158.1HOXA56.7000.888902894857458893900−1AAGAAATT
MA0102.3CEBPA8.3250.8977236699896968949041ATTTCTTCACC
MA0488.1JUN3.7460.828518034950643894906−1AAGGTGAAGAAAT