Proteomic Analysis of Beef Tenderloin and Flank Assessed Using an Isobaric Tag for Relative and Absolute Quantitation (iTRAQ)

 ,
,
Simple Summary
Abstract
1. Introduction
2. Materials and Methods
2.1. Ethics Statement
2.2. Animals and Sample Collection
2.3. Determination of Amino Acids
2.4. Extraction of Proteins
2.5. Protein Digestion and iTRAQ Labelling
2.6. Strong Cation Exchange (SCX) Separation and Liquid Chromatography-Tandem Mass Spectrometry (LC-MS/MS) Analyses
2.7. qRT-PCR
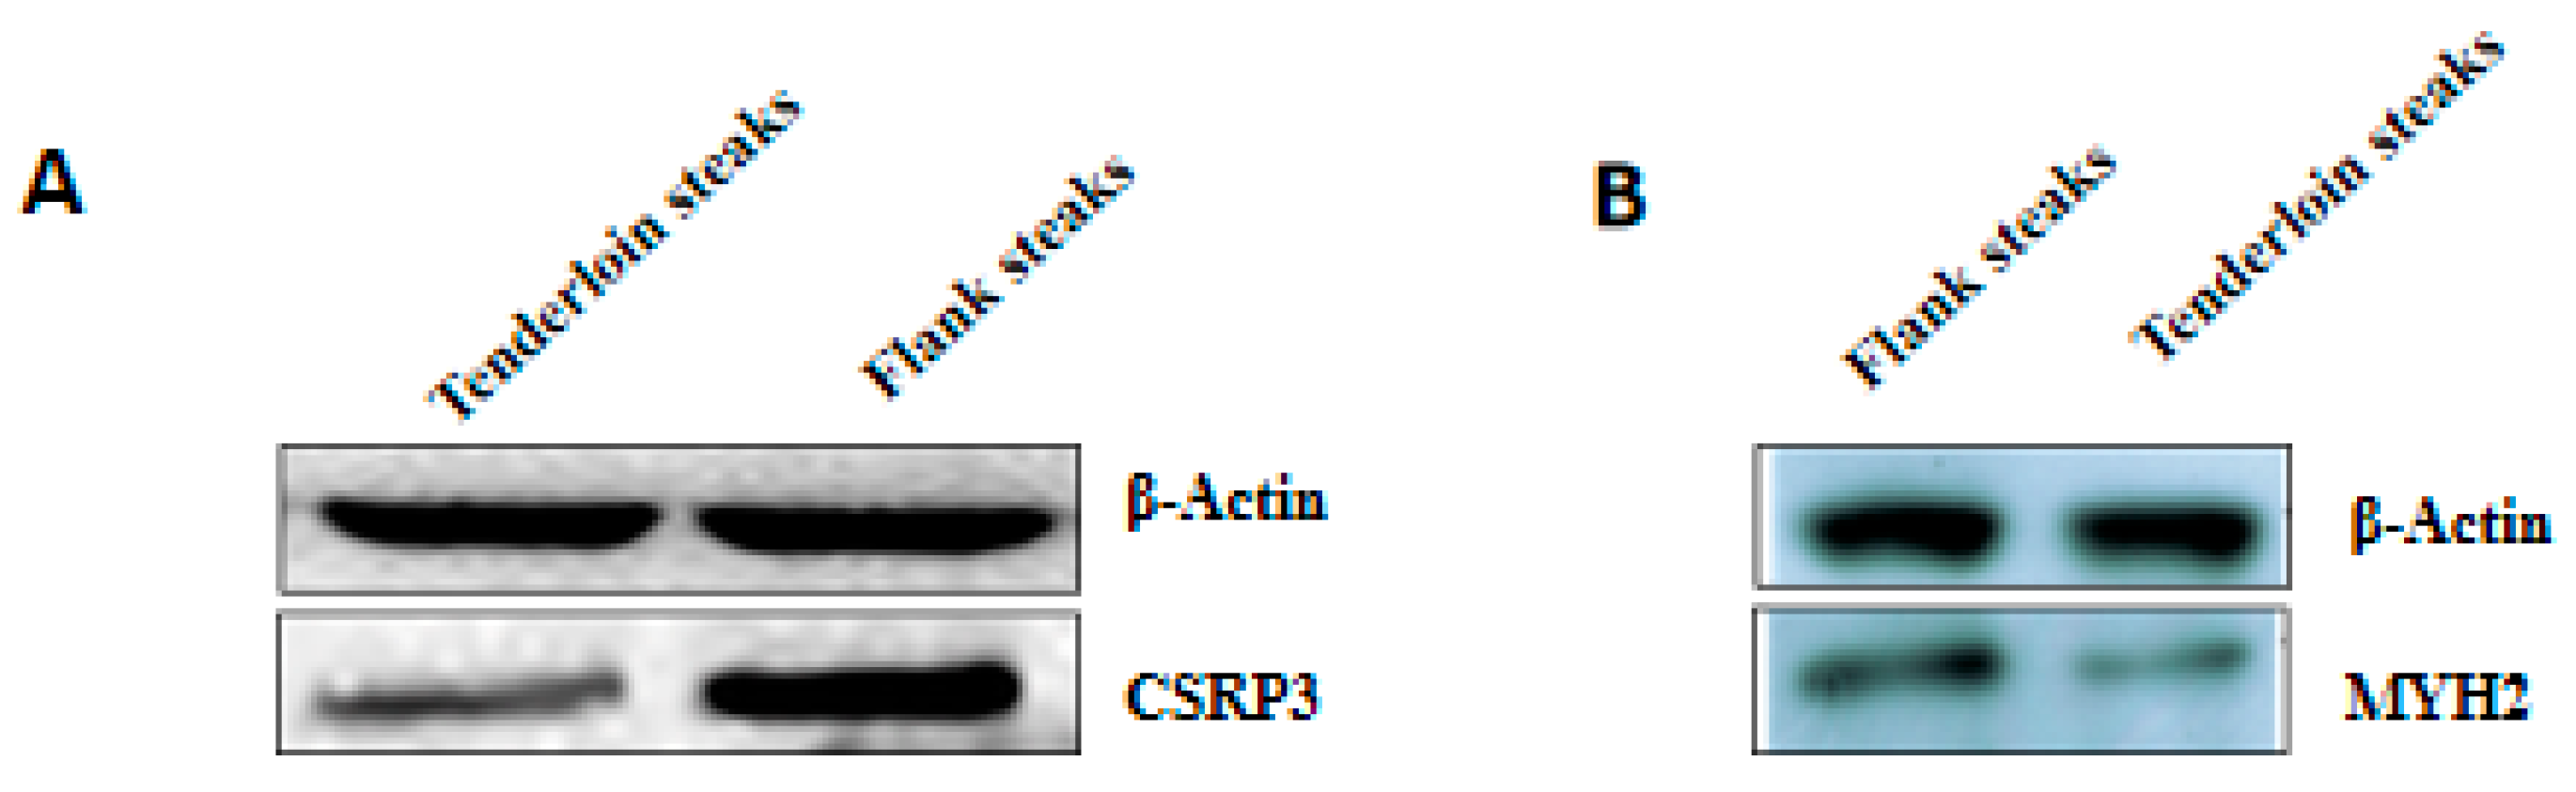
2.8. Western Blot
2.9. Data Analysis
3. Results
3.1. Amino Acid Abundance
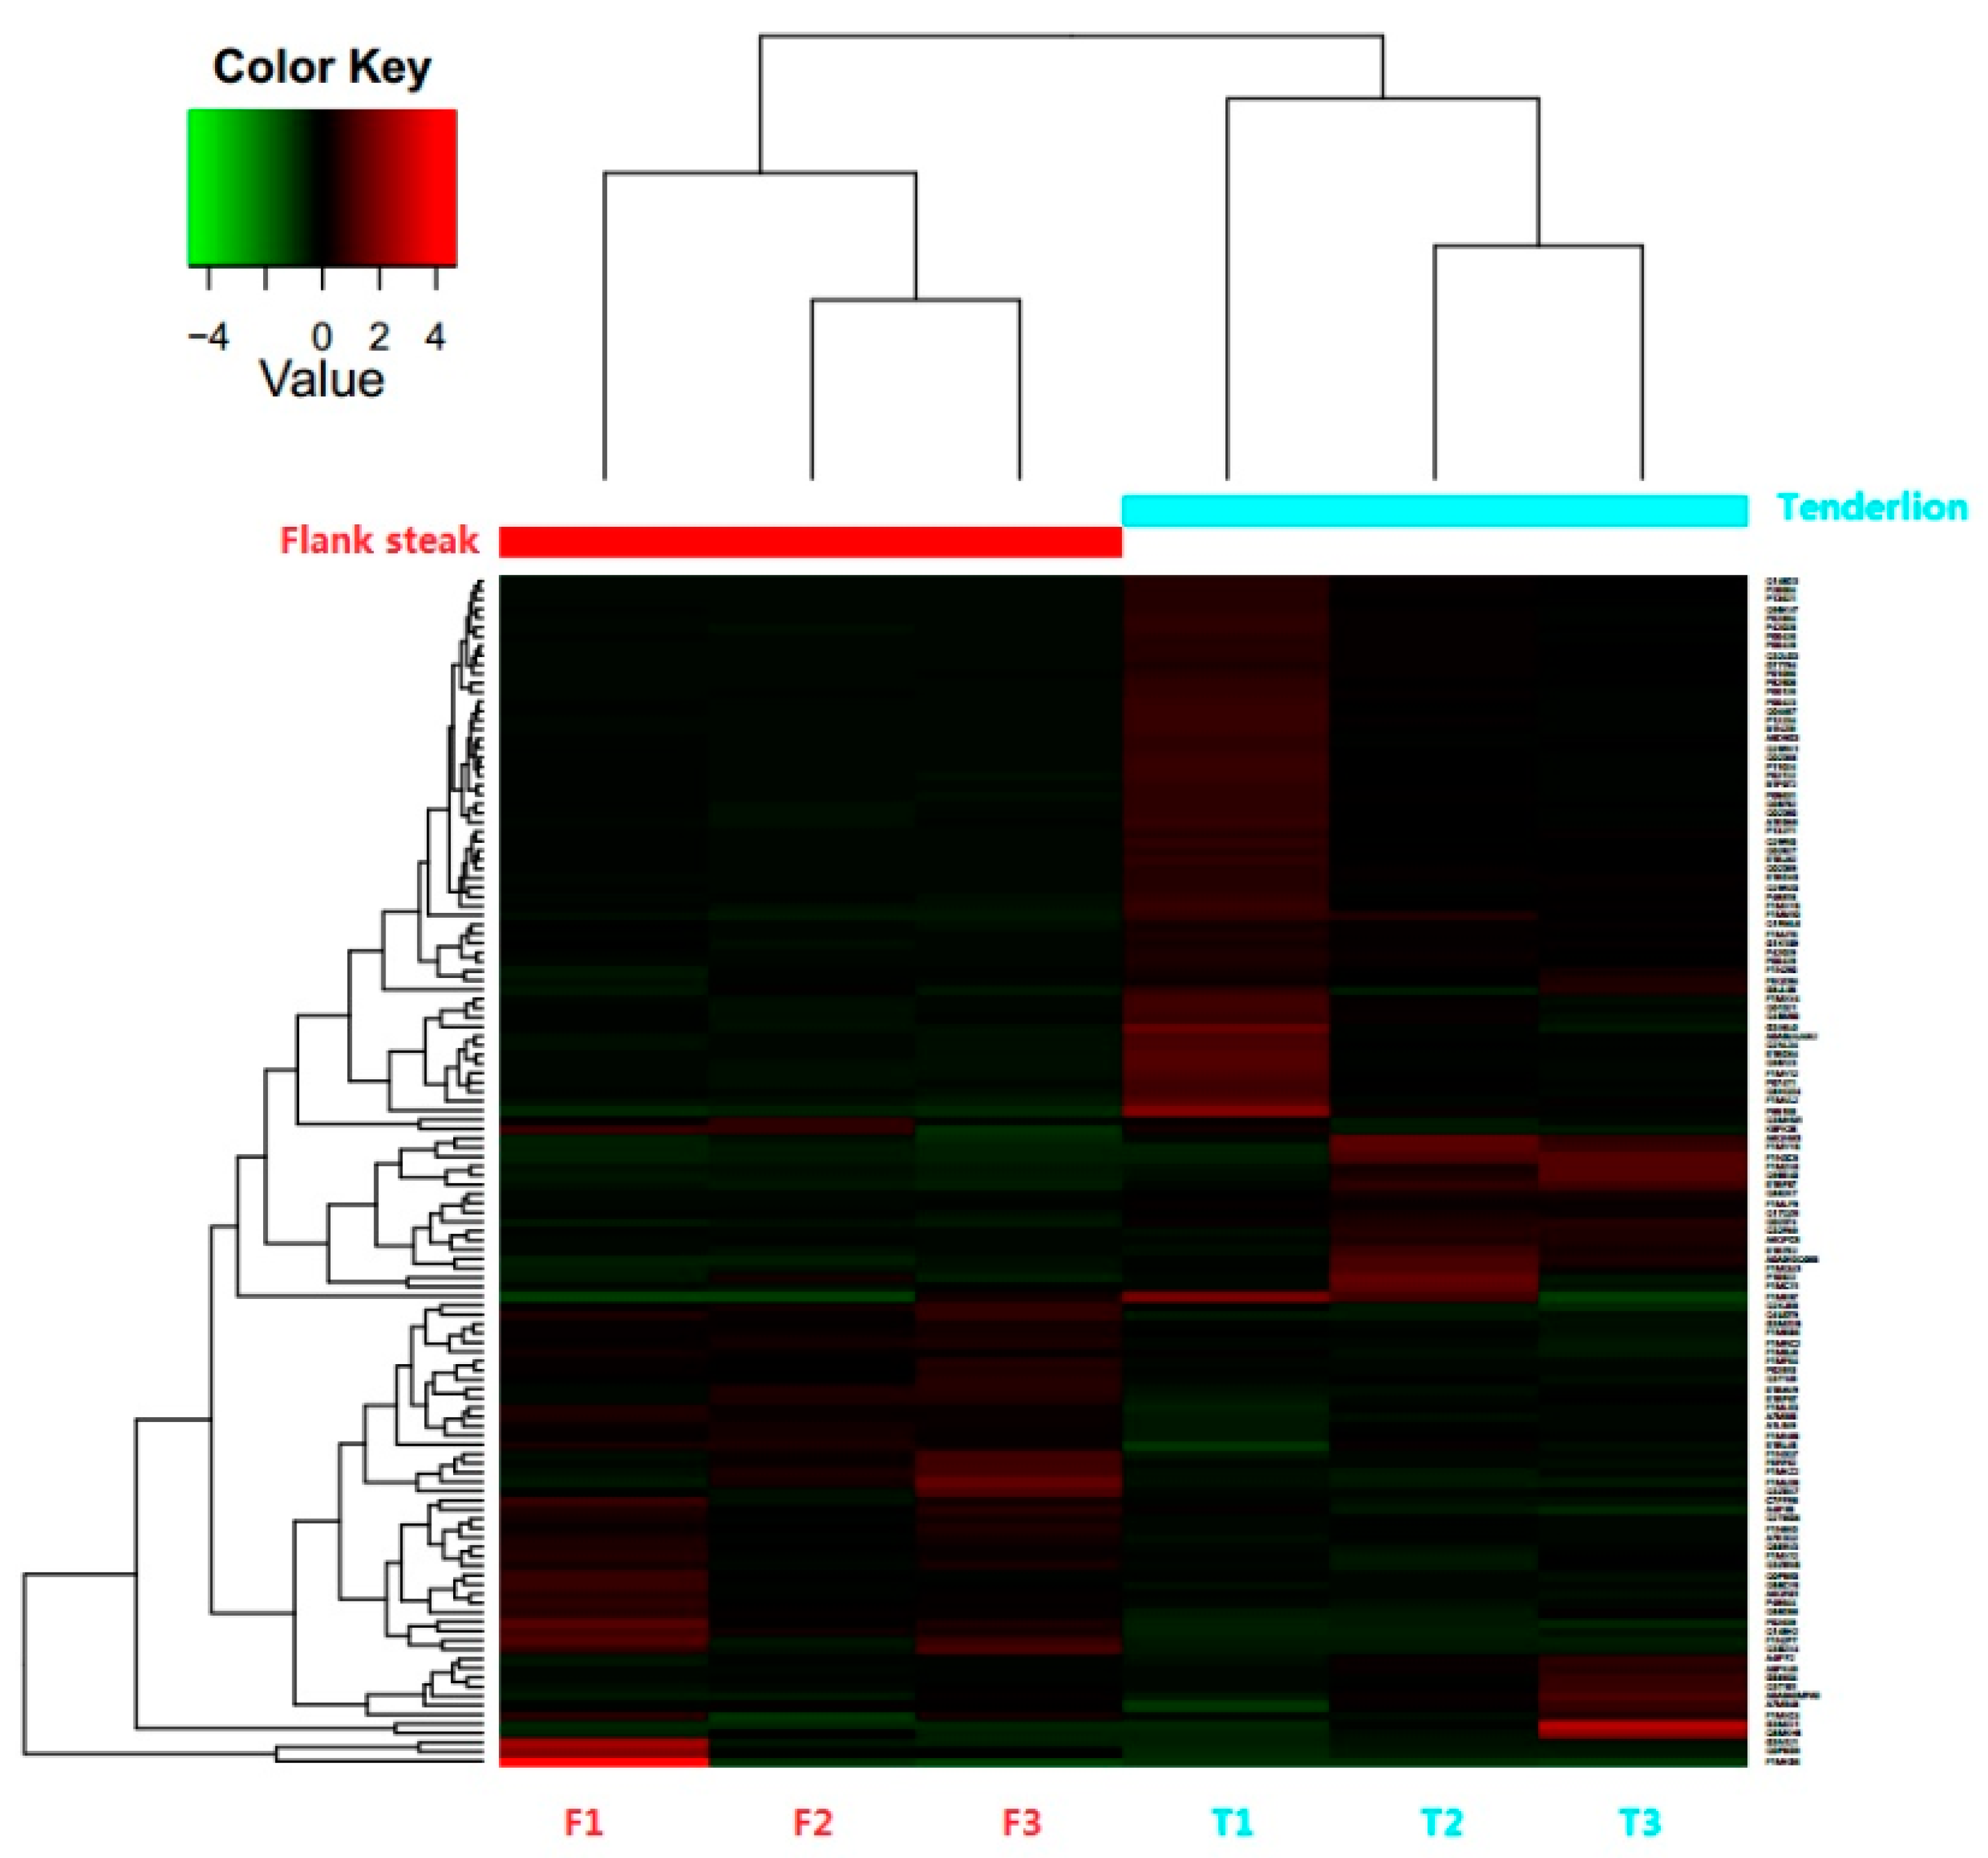
3.2. Identification and Differential Expression of Proteins
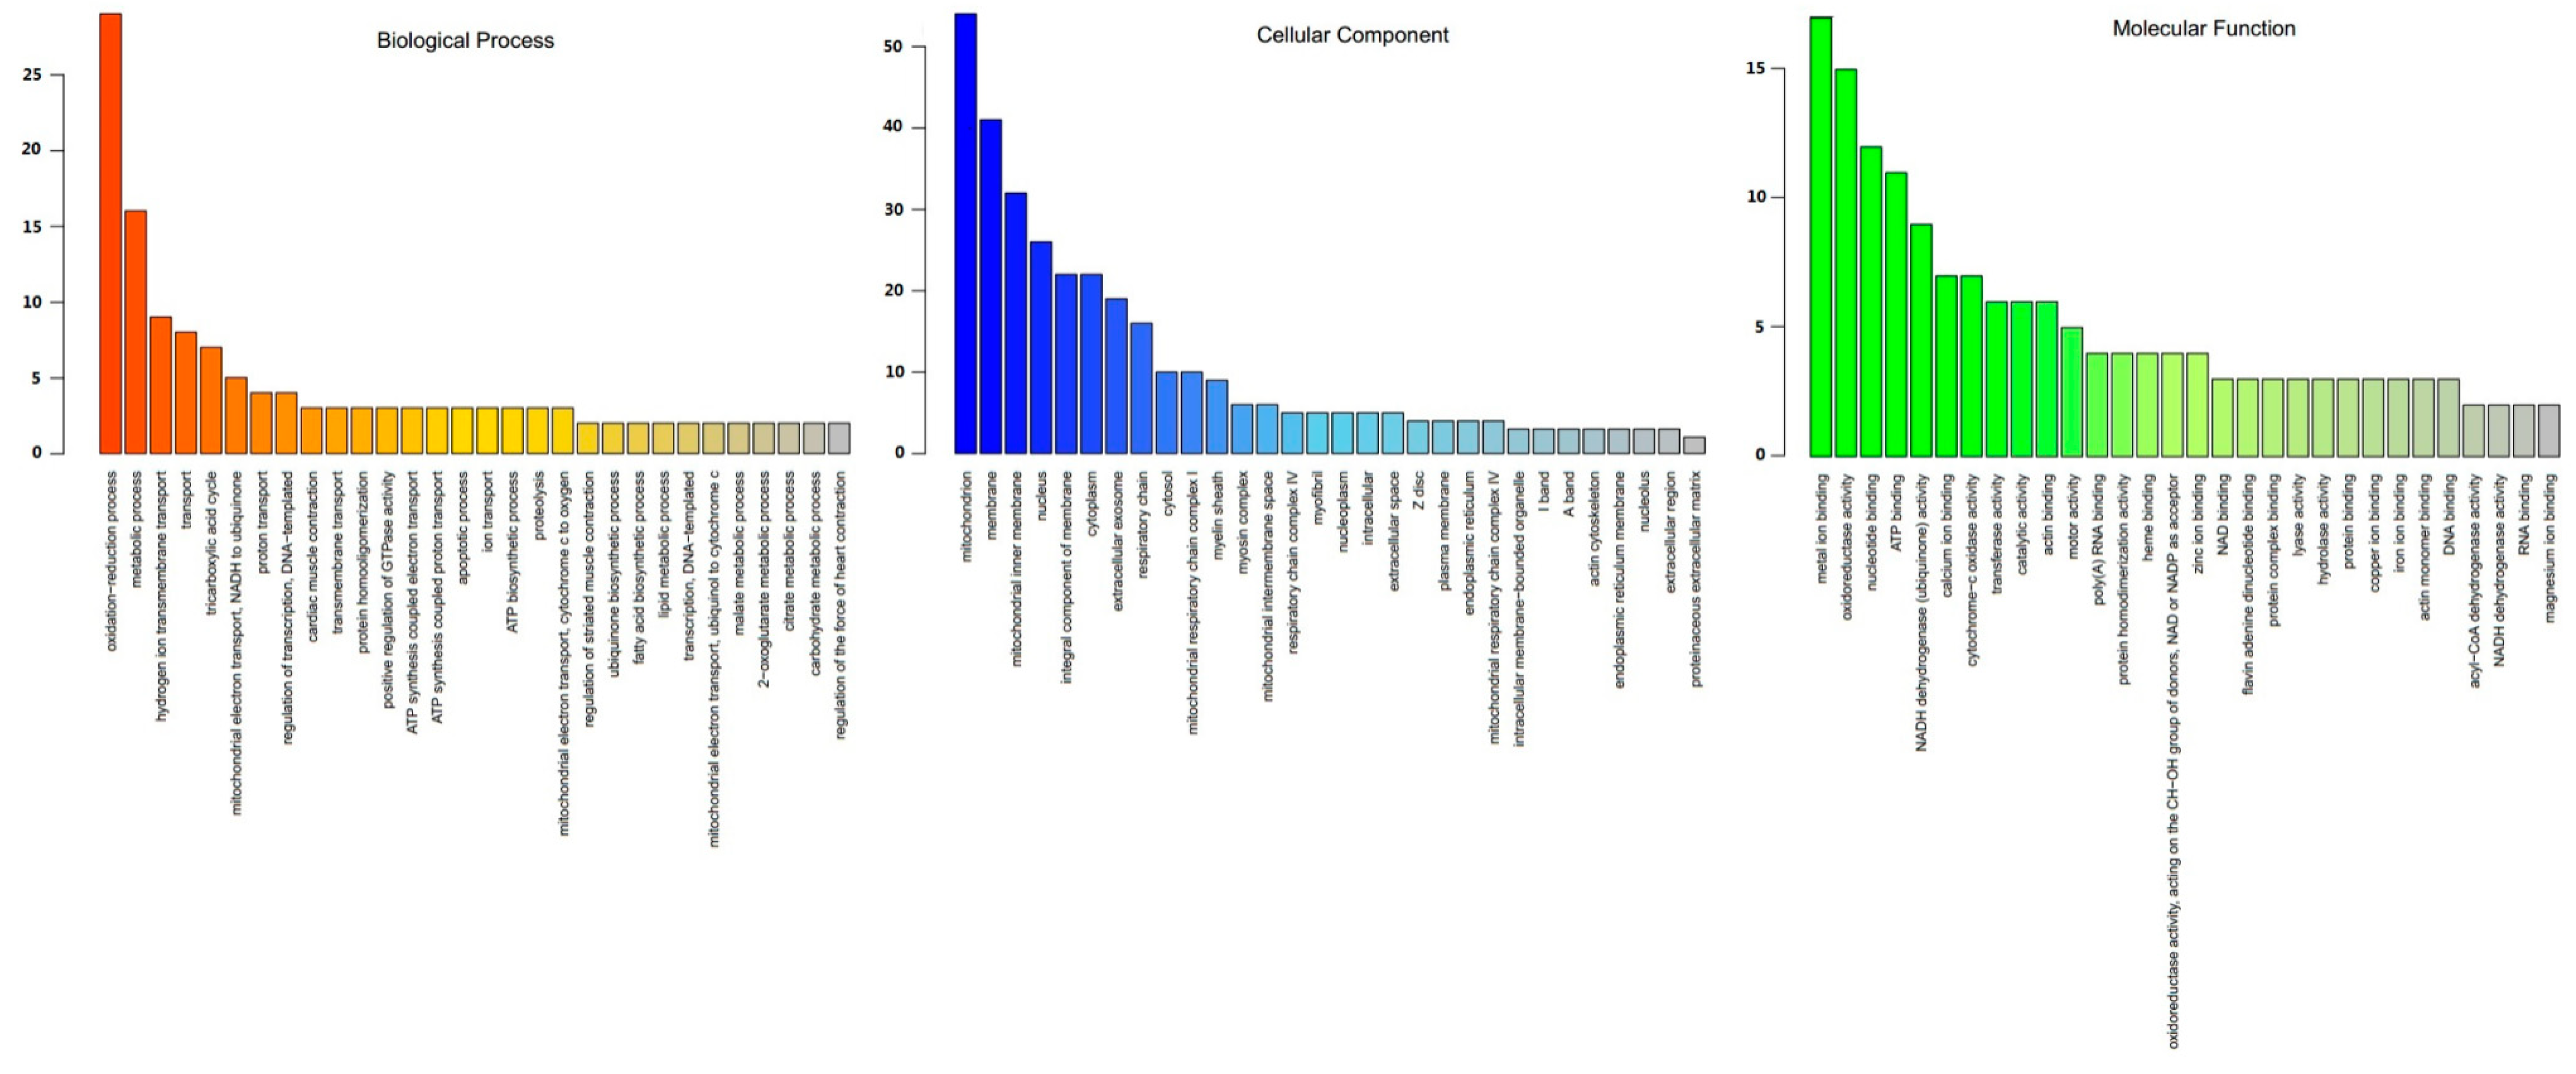
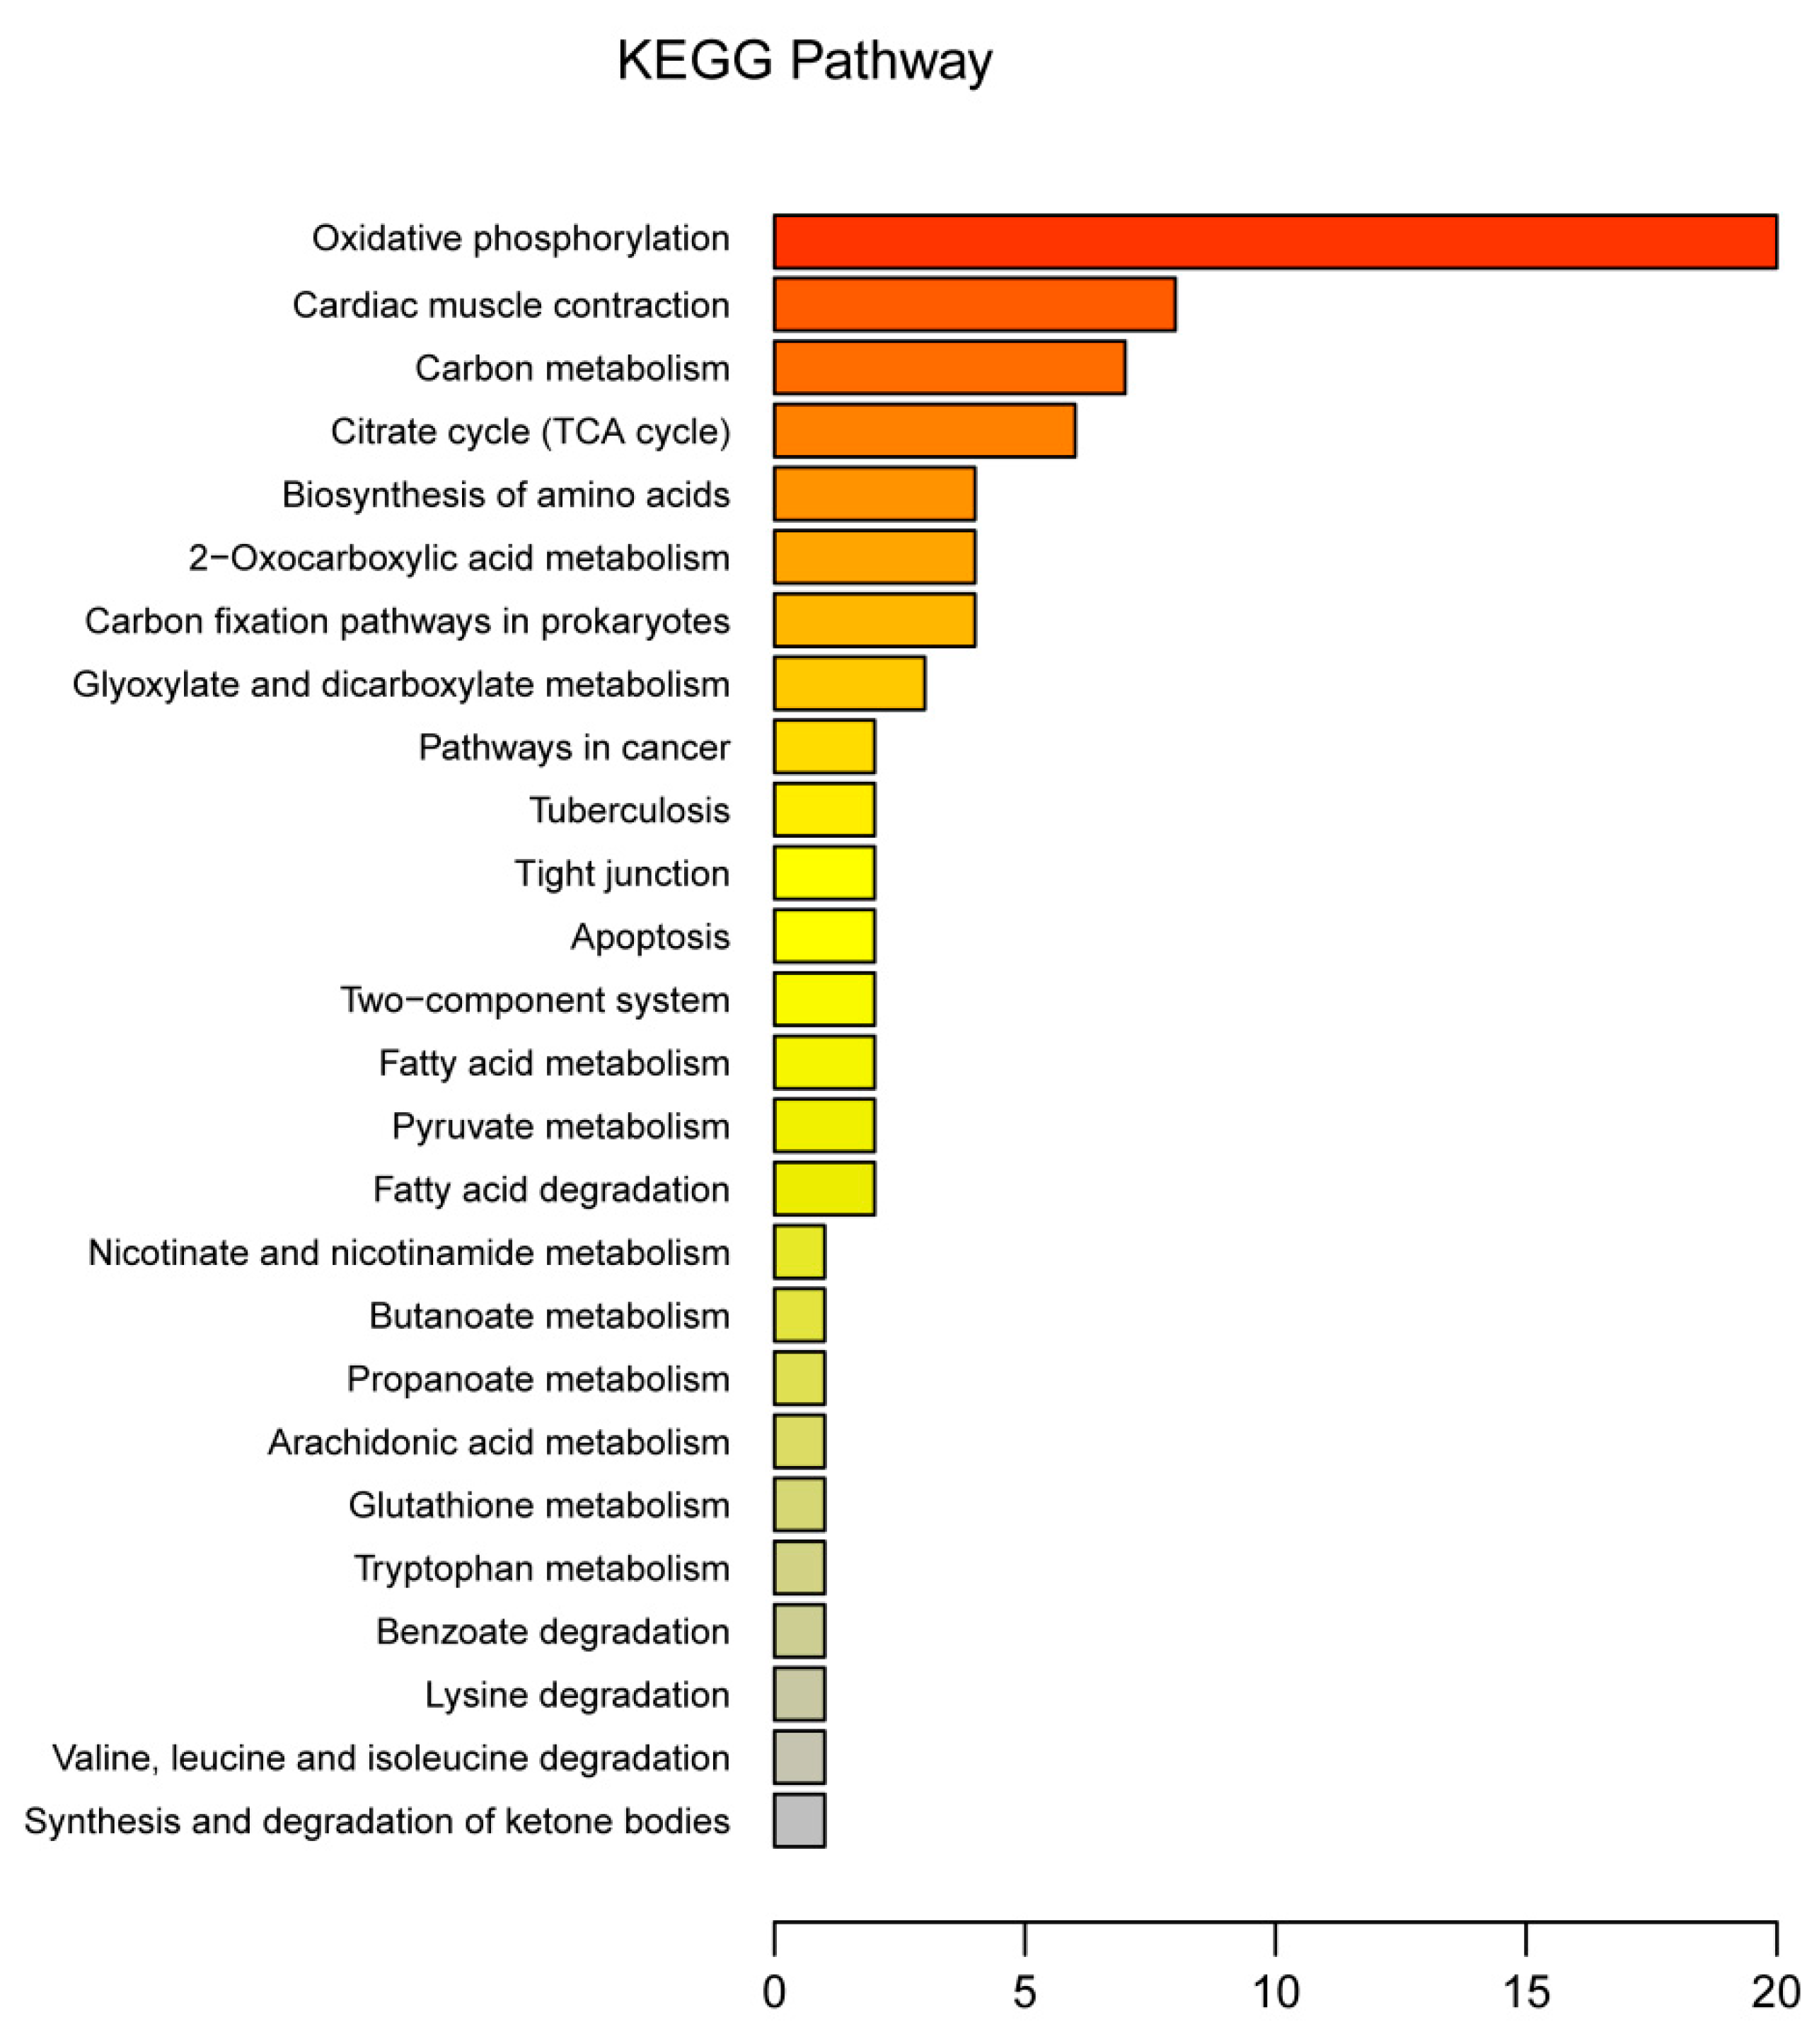
3.3. Functional Annotation of DEPs
4. Discussion
5. Conclusions
Supplementary Materials
Author Contributions
Funding
Conflicts of Interest
References
- Savell, J.W.; Branson, R.E.; Cross, H.R.; Stiffler, D.M.; Wise, J.W.; Griffin, D.B.; Smith, G.C. National consumer retail beef study: Palatability evaluations of beef loin steaks that differed in marbling. J. Food Sci. 2010, 52, 517–519. [Google Scholar] [CrossRef]
- Savell, J.W.; Cross, H.R.; Francis, J.J.; Wise, J.W.; Hale, D.S.; Wilkes, D.L.; Smith, G.C. National consumer retail beef study: Interaction of trim level, price and grade on consumer acceptance of beef steaks and roasts. J. Food Qual. 1989, 12, 251–274. [Google Scholar] [CrossRef]
- Hollung, K.; Veiseth, E.; Jia, X.; Færgestad, E.M.; Hildrum, K.I. Application of proteomics to understand the molecular mechanisms behind meat quality. Packag. Food Mach. 2007, 77, 97–10453. [Google Scholar] [CrossRef] [PubMed]
- Bendixen, E. The use of proteomics in meat science. Meat Sci. 2005, 71, 138–149. [Google Scholar] [CrossRef] [PubMed]
- Lefaucheur, L. A second look into fibre typing–relation to meat quality. Meat Sci. 2010, 84, 257–270. [Google Scholar] [CrossRef] [PubMed]
- Lana, A.; Zolla, L. Proteolysis in meat tenderization from the point of view of each single protein: A proteomic perspective. J. Proteom. 2016, 147, 85–97. [Google Scholar] [CrossRef]
- D’Alessandro, A.; Zolla, L. Meat science: From proteomics to integrated omics towards system biology. J. Proteom. 2013, 78, 558–577. [Google Scholar] [CrossRef]
- Karp, N.A.; Huber, W.; Sadowski, P.G.; Charles, P.D.; Hester, S.V.; Lilley, K.S. Addressing accuracy and precision issues in itraq quantitation. Mol. Cell. Proteom. MCP 2010, 9, 1885–1897. [Google Scholar] [CrossRef]
- He, H.; Chen, S.; Liang, W.; Liu, X. Genome-wide proteomics analysis on longissimus muscles in qinchuan beef cattle. Anim. Genet. 2016, 48, 131–140. [Google Scholar] [CrossRef]
- Bjarnadóttir, S.G.; Hollung, K.; Hã, Y.M.; Bendixen, E.; Codrea, M.C.; Veiseth-Kent, E. Changes in protein abundance between tender and tough meat from bovine longissimus thoracis muscle assessed by isobaric tag for relative and absolute quantitation (itraq) and 2-dimensional gel electrophoresis analysis. J. Anim. Sci. 2012, 90, 2035–2043. [Google Scholar] [CrossRef]
- Wang, Z.; Shang, P.; Li, Q.; Wang, L.; Chamba, Y.; Zhang, B.; Zhang, H.; Wu, C. Itraq-based proteomic analysis reveals key proteins affecting muscle growth and lipid deposition in pigs. Sci. Rep. 2017, 7. [Google Scholar] [CrossRef] [PubMed]
- Deutsch, D.R.; Thomas, F.H.; Otte, K.A.; Andrea, B.; Habermann, F.A.; Eckhard, W.; Arnold, G.J. Stage-specific proteome signatures in early bovine embryo development. J. Proteome Res. 2014, 13, 4363–4376. [Google Scholar] [CrossRef]
- Liu, J.; Fu, R.; Liu, R.; Zhao, G.; Zheng, M.; Cui, H.; Li, Q.; Song, J.; Wang, J.; Wen, J. Protein profiles for muscle development and intramuscular fat accumulation at different post-hatching ages in chickens. PLoS ONE 2016, 11, e0159722. [Google Scholar] [CrossRef] [PubMed]
- Fan, Q.; Long, B.; Yan, G.; Wang, Z.; Shi, M.; Bao, X.; Hu, J.; Li, X.; Chen, C.; Zheng, Z. Dietary leucine supplementation alters energy metabolism and induces slow-to-fast transitions in longissimus dorsi muscle of weanling piglets. Br. J. Nutr. 2017, 117, 1222. [Google Scholar] [CrossRef] [PubMed]
- Goichon, A.; Chan, P.; Lecleire, S.; Coquard, A.; Cailleux, A.F.; Walrand, S.; Lerebours, E.; Vaudry, D.; Déchelotte, P.; Coëffier, M. An enteral leucine supply modulates human duodenal mucosal proteome and decreases the expression of enzymes involved in fatty acid beta-oxidation. J. Proteom. 2013, 78, 535–544. [Google Scholar] [CrossRef]
- Arakawa, M.; Masaki, T.; Nishimura, J.; Seike, M.; Yoshimatsu, H. The effects of branched-chain amino acid granules on the accumulation of tissue triglycerides and uncoupling proteins in diet-induced obese mice. Endocr. J. 2011, 58, 161–170. [Google Scholar] [CrossRef] [PubMed]
- Azzi, A.; Müller, M.; Labonia, N. The Mitochondrial Respiratory Chain. In Organelles in Eukaryotic Cells; Springer: Boston, MA, USA, 1989; pp. 1–8. [Google Scholar]
- Karlsson, A.H.; Klont, R.E.; Fernandez, X. Skeletal muscle fibres as factors for pork quality. Livest. Prod. Sci. 1999, 60, 255–269. [Google Scholar] [CrossRef]
- Ertbjerg, P.; Puolanne, E. Muscle structure, sarcomere length and influences on meat quality: A review. Meat Sci. 2017, 132, 139–152. [Google Scholar] [CrossRef]
- Brooke, M.H.; Kaiser, K.K. Muscle fiber types: How many and what kind? Arch Neurol. 1970, 23, 369. [Google Scholar] [CrossRef]
- Bär, A.; Pette, D. Three fast myosin heavy chains in adult rat skeletal muscle. FEBS Lett. 1988, 235, 153–155. [Google Scholar] [CrossRef]
- Schiaffino, S.; Gorza, L.; Sartore, S.; Saggin, L.; Ausoni, S.; Vianello, M.; Gundersen, K.; Lømo, T. Three myosin heavy chain isoforms in type 2 skeletal muscle fibres. J. Muscle Res. Cell Motil. 1989, 10, 197–205. [Google Scholar] [CrossRef] [PubMed]
- Schiaffino, S.C.R. Molecular diversity of myofibrillar proteins: Gene regulation and functional significance. Physiol. Rev. 1996, 76, 371–423. [Google Scholar] [CrossRef] [PubMed]
- Francisco, C.L.; Jorge, A.M.; Dal-Pai-Silva, M.; Carani, F.R.; Cabeço, L.C.; Silva, S.R. Muscle fiber type characterization and myosin heavy chain (myhc) isoform expression in mediterranean buffaloes. Meat Sci. 2011, 88, 535–541. [Google Scholar] [CrossRef] [PubMed]
- Lingyang, X.; Fuping, Z.; Hangxing, R.; Li, L.; Jian, L.; Jiasen, L.; Shifang, Z.; Liu, G.E.; Jiuzhou, S.; Li, Z. Co-expression analysis of fetal weight-related genes in ovine skeletal muscle during mid and late fetal development stages. Int. J. Biol. Sci. 2014, 10, 1039–1050. [Google Scholar]
- Arber, S.; Halder, G.; Caroni, P. Muscle lim protein, a novel essential regulator of myogenesis, promotes myogenic differentiation. Cell 1994, 79, 221–231. [Google Scholar] [CrossRef]
- Arber, S.; Caroni, P. Specificity of single lim motifs in targeting and lim/lim interactions in situ. Genes Dev. 1996, 10, 289. [Google Scholar] [CrossRef]
- Barash, I.A.; Mathew, L.; Lahey, M.; Greaser, M.L.; Lieber, R.L. Muscle lim protein plays both structural and functional roles in skeletal muscle. Am. J. Physiol. Cell Physiol. 2005, 289, C1312. [Google Scholar] [CrossRef]
- Newgard, C. Interplay between lipids and branched-chain amino acids in development of insulin resistance. Cell Metab. 2012, 15, 606–614. [Google Scholar] [CrossRef]


| Items | Flank | Tenderloin | p-Value |
|---|---|---|---|
| Gly | 4.73 ± 0.15 | 3.30 ± 0.15 | 0.002 |
| Cys | 1.00 ± 0.06 | 0.73 ± 0.03 | 0.016 |
| Ile | 4.93 ± 0.15 | 3.47 ± 0.15 | 0.002 |
| Lys | 6.90 ± 0.15 | 5.63 ± 0.23 | 0.010 |
| Pro | 3.70 ± 0.10 | 2.57 ± 0.15 | 0.003 |
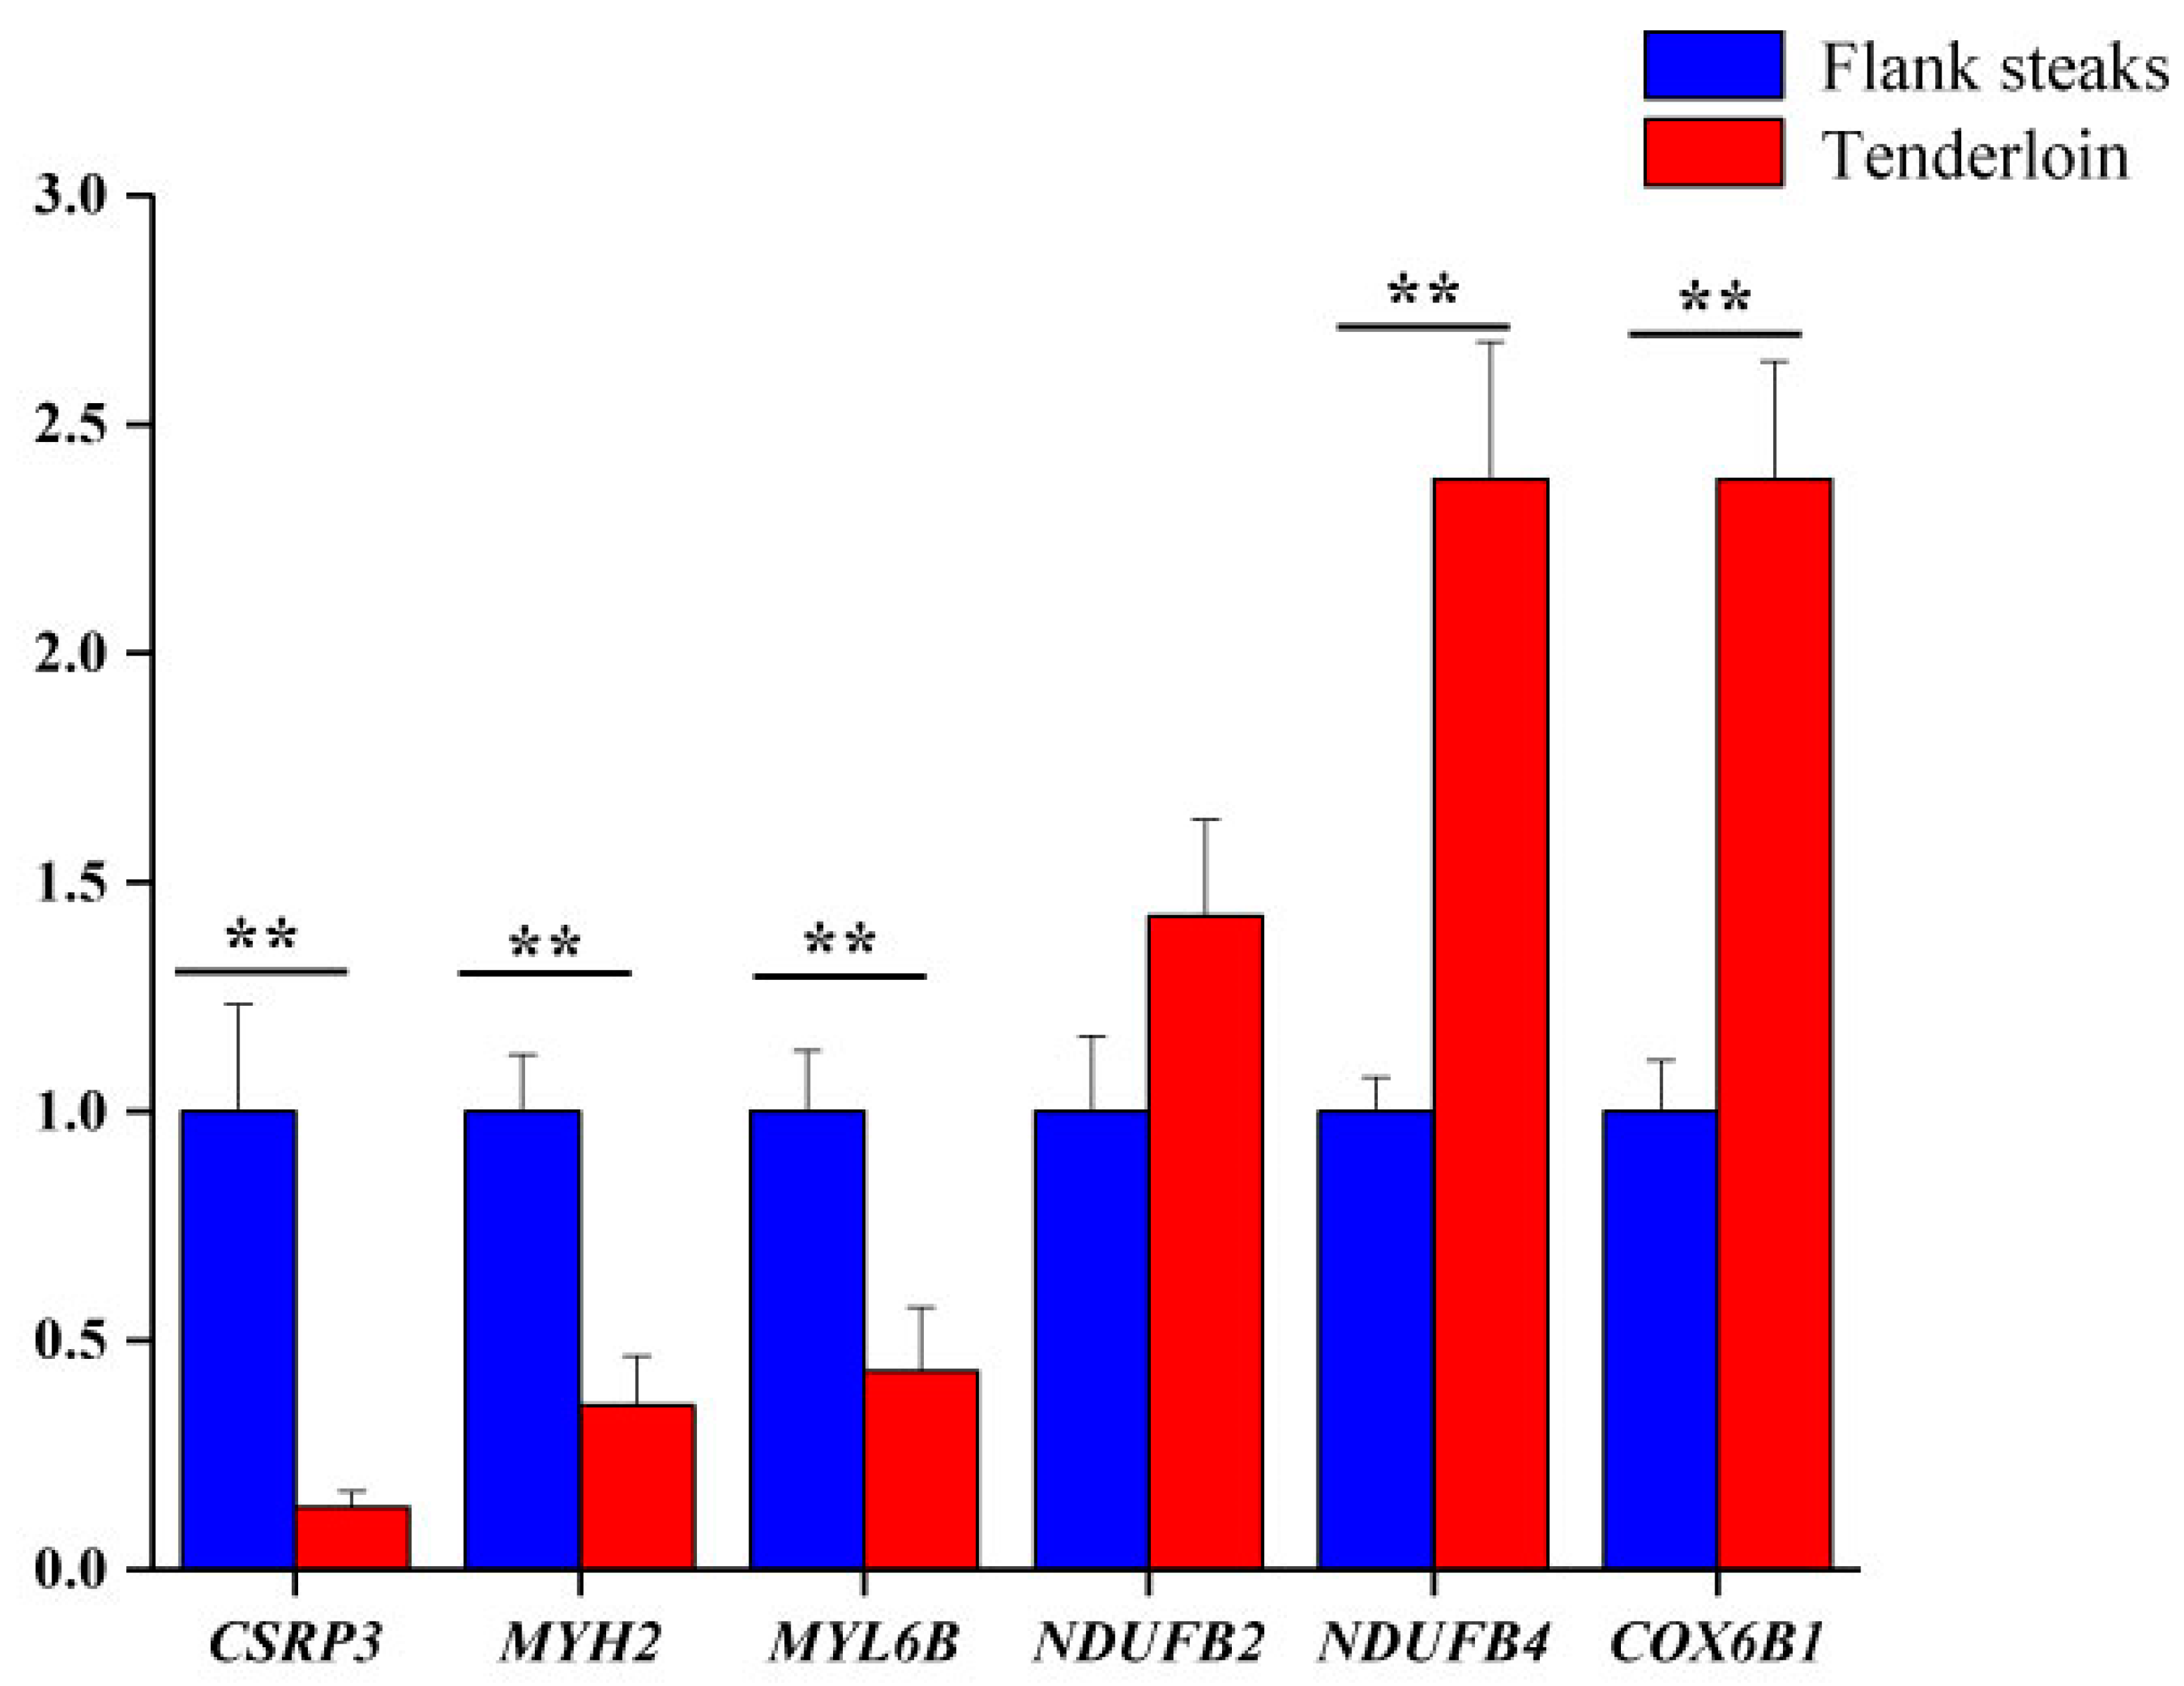
| Gene Name | Protein Name | Fold Change | p-Value |
|---|---|---|---|
| Group F/Group T | |||
| S100A1 | Protein S100-A1 | 3.92 | 0.036 |
| MYL6B | Myosin, light chain 6B, alkali, smooth muscle and non-muscle | 3.31 | 0.012 |
| CSRP3 | Cysteine and glycine-rich protein 3 | 2.70 | 0.006 |
| SCHIP1 | Schwannomin-interacting protein 1 | 2.57 | 0.021 |
| DPYSL3 | DPYSL3 protein | 1.93 | 0.004 |
| MYH2 | Myosin-2 | 1.92 | 0.006 |
| COG6 | Conserved oligomeric Golgi complex subunit 6 | 1.88 | 0.015 |
| MVP | Major vault protein | 1.76 | 0.005 |
| HSPA2 | Heat shock 70kDa protein 1A | 1.65 | 0.043 |
| CRYAB | Alpha-crystallin B chain | 1.61 | 0.039 |
| CCDC178 | Uncharacterised protein (Fragment) | 1.55 | 0.010 |
| UCHL3 | Ubiquitin carboxyl-terminal hydrolase isozyme L3 | 1.54 | 0.047 |
| HSPB7 | Uncharacterised protein (Fragment) | 1.53 | 0.042 |
| SENP5 | Uncharacterised protein | 1.51 | 0.026 |
| SDPR | SDPR protein (Fragment) | 0.66 | 0.016 |
| TRNT1 | Uncharacterised protein | 0.65 | 0.033 |
| UBE2E3 | Ubiquitin-conjugating enzyme E2 E3 | 0.64 | 0.003 |
| CKMT2 | Creatine kinase S-type, mitochondrial | 0.64 | 0.034 |
| NDUFA8 | NADH dehydrogenase [ubiquinone] 1 alpha subcomplex subunit 8 | 0.64 | 0.037 |
| NDUFB4 | NADH dehydrogenase [ubiquinone] 1 beta subcomplex subunit 4 | 0.64 | 0.021 |
| IDH3B | Isocitrate dehydrogenase [NAD] subunit beta, mitochondrial | 0.63 | 0.041 |
| COX6B1 | Cytochrome c oxidase subunit 6B1 | 0.62 | 0.023 |
| COX17 | Uncharacterised protein | 0.61 | 0.037 |
| PCDHGB5 | Uncharacterised protein | 0.58 | 0.030 |
| CYP1A1 | Cytochrome P450 (Fragment) | 0.42 | 0.016 |
| NDUFB2 | NADH dehydrogenase [ubiquinone] 1 beta subcomplex subunit 2 | 0.40 | 0.002 |
| ARRDC4 | Arrestin domain-containing protein 4 | 0.30 | 0.042 |
© 2020 by the authors. Licensee MDPI, Basel, Switzerland. This article is an open access article distributed under the terms and conditions of the Creative Commons Attribution (CC BY) license (http://creativecommons.org/licenses/by/4.0/).
Share and Cite
Lei, Z.; Wu, J.; Zhang, D.; Liu, T.; Zhao, S.; Wang, J.; Zhang, X. Proteomic Analysis of Beef Tenderloin and Flank Assessed Using an Isobaric Tag for Relative and Absolute Quantitation (iTRAQ). Animals 2020, 10, 150. https://doi.org/10.3390/ani10010150
Lei Z, Wu J, Zhang D, Liu T, Zhao S, Wang J, Zhang X. Proteomic Analysis of Beef Tenderloin and Flank Assessed Using an Isobaric Tag for Relative and Absolute Quantitation (iTRAQ). Animals. 2020; 10(1):150. https://doi.org/10.3390/ani10010150
Chicago/Turabian StyleLei, Zhaomin, Jianping Wu, Deyin Zhang, Ting Liu, Shengguo Zhao, Jianfu Wang, and Xiaoxue Zhang. 2020. "Proteomic Analysis of Beef Tenderloin and Flank Assessed Using an Isobaric Tag for Relative and Absolute Quantitation (iTRAQ)" Animals 10, no. 1: 150. https://doi.org/10.3390/ani10010150
APA StyleLei, Z., Wu, J., Zhang, D., Liu, T., Zhao, S., Wang, J., & Zhang, X. (2020). Proteomic Analysis of Beef Tenderloin and Flank Assessed Using an Isobaric Tag for Relative and Absolute Quantitation (iTRAQ). Animals, 10(1), 150. https://doi.org/10.3390/ani10010150