Article

Analysis of Human Gut Microbiota Composition Associated to the Presence of Commensal and Pathogen Microorganisms in Côte d’Ivoire

by
Veronica Di Cristanziano
1,*,†,
Fedja Farowski
2,3,†,
Federica Berrilli
4,†,
Maristella Santoro
4,
David Di Cave
4,
Christophe Glé
5,
Martin Daeumer
6,
Alexander Thielen
6,
Maike Wirtz
1,
Rolf Kaiser
1,
Kirsten Alexandra Eberhardt
7,8,
Maria J. G. T. Vehreschild
2,3,9 and
Rossella D’Alfonso
5,10
1
Institute of Virology, Faculty of Medicine and University Hospital of Cologne, University of Cologne, 50935 Cologne, Germany
2
Department I of Internal Medicine, Faculty of Medicine and University Hospital of Cologne, University of Cologne, 50937 Cologne, Germany
3
Department of Internal Medicine, Infectious Diseases, University Hospital Frankfurt, Goethe University Frankfurt, 60590 Frankfurt am Main, Germany
4
Department of Clinical Sciences and Translational Medicine, University of Rome Tor Vergata, 00133 Rome, Italy
5
Centre Don Orione Pour Handicapés Physiques, Bonoua BP 21, Côte d’Ivoire
6
Seq-IT GmbH & Co KG, 67655 Kaiserslautern, Germany
7
Department of Tropical Medicine, Bernhard Nocht Institute for Tropical Medicine & I. Department of Medicine, University Medical Center Hamburg-Eppendorf, 20359 Hamburg, Germany
8
Institute for Transfusion Medicine, University Medical Center Hamburg-Eppendorf, 20251 Hamburg, Germany
9
German Center for Infection Research (DZIF), Partner Site Bonn, 50937 Cologne, Germany
10
Department of Systems Medicine, University of Rome Tor Vergata, 00133 Rome, Italy
*
Author to whom correspondence should be addressed.
These authors contributed equally to this work.
Microorganisms 2021, 9(8), 1763; https://doi.org/10.3390/microorganisms9081763
Submission received: 22 July 2021 / Revised: 12 August 2021 / Accepted: 14 August 2021 / Published: 18 August 2021
(This article belongs to the Special Issue Gut Microbioma Structure and Functions in Human Health and Disease)

Abstract

:
Background: The human gut microbiota is a microbial ecosystem contributing to the maintenance of host health with functions related to immune and metabolic aspects. Relations between microbiota and enteric pathogens in sub-Saharan Africa are scarcely investigated. The present study explored gut microbiota composition associated to the presence of common enteric pathogens and commensal microorganisms, e.g., Blastocystis and Entamoeba species, in children and adults from semi-urban and non-urban localities in Côte d’Ivoire. Methods: Seventy-six stool samples were analyzed for microbiota composition by 16S rRDNA sequencing. The presence of adeno-, entero-, parechoviruses, bacterial and protozoal pathogens, Blastocystis, and commensal Entamoeba species, was analyzed by different molecular assays. Results: Twelve individuals resulted negative for any tested microorganisms, 64 subjects were positive for one or more microorganisms. Adenovirus, enterovirus, enterotoxigenic Escherichia coli (ETEC), and Blastocystis were frequently detected. Conclusions: The bacterial composition driven by Prevotellaceae and Ruminococcaceae confirmed the biotype related to the traditional dietary and cooking practices in low-income countries. Clear separation in UniFrac distance in subjects co-harboring Entamoeba hartmanni and Blastocystis was evidenced. Alpha diversity variation in negative control group versus only Blastocystis positive suggested its possible regulatory contribution on intestinal microbiota. Pathogenic bacteria and virus did not affect the positive outcome of co-harbored Blastocystis.

1. Introduction

The intestinal microbiota consists of a complex microbial community, which exhibits a mutualistic relationship with the host and a crucial impact on human health [1]. About 60% of its bacterial composition persists stably for decades (e.g., the phyla Firmicutes, Bacteroidetes and Actinobacteria), while the remaining proportion is involved in transient modifications induced by different environmental conditions.
The high diversity and the relative abundance of beneficial bacterial strains, compared to those potentially harmful, promote the homeostasis of intestinal functions and host-protective immunity [2], and the combinations of redundant microbial species, differing among the human populations and geographical areas, insure fundamental metabolic functions [3]. However, several factors, e.g., antibiotic therapies, may lead to the loss of microbial diversity and imbalances between commensal versus pathogenic bacterial strains, weakening the recovery of intestinal microbiota [4].
The development of advanced sequencing techniques has allowed a more comprehensive understanding of the relationships between intestinal bacteria and the human host than a culture-based analysis alone [1]. Increasing evidence suggests a distinction between a state of balanced homeostasis, typical of healthy subjects, and different dynamic associations of microbial communities that seem to predispose to non-communicable diseases [5], as supported by studies on animal models [6].
Pioneering microbiota studies were performed in Europe, China, and the United States, evidencing a lower microbial diversity compared to pre-industrial populations [7,8]. Further comparisons have been carried out between different ethnic groups living in America [9,10] and a growing number of data relating to African populations are now available [11,12,13,14].
The characterization of human intestinal microbiota, especially in endemic environments for enteropathy, cannot neglect the potential presence of common intestinal pathogens, including bacteria, viruses, and parasites, and their influence on microbiota balance [15,16]. However, the dynamics of relationships between pathogens and commensals, both prokaryotes and eukaryotes, are often underestimated [17,18] or focused on single microorganisms [19,20,21]. Poor water, sanitation, and hygiene conditions in low and middle-income countries sustain the susceptibility to multiple and asymptomatic infections [22].
The link between natural systems, human health, and infections remains an interesting challenge. In line with these aspects, the present study investigated the gut microbiota in children and adults living in Côte d’Ivoire. A particular, focus was on the changes in microbiota composition related to the presence of Blastocystis, commensal Entamoeba species, and different common enteric pathogens.

2. Materials and Methods

2.1. Study Area and Sample Collection

Human fecal samples were collected at four sites in the department of Grand-Bassam, in the south of Côte d’Ivoire. Bonoua (5°16′17″ N, 3°35′40″ W) was the only semi-urban locality while Assouindé (5°09′57.1″ N 3°28′10.9″ W), Kimoukro, and Yaou (5°14′25.0″ N 3°37′37.9″ W) were rural/semi-rural villages 6 to 20 km away from Bonoua. Sampling was performed during three distinct seasons characterizing the study area: the heavy rainy season (HRS), the low rainy season (LRS), and the heavy dry season (HDS).

2.2. Sample Management and Fecal Nucleic Acids Extraction

From each patient, one fecal sample was collected using an appropriate sterile container. Recent or ongoing antibiotic therapy constituted an exclusion principle. After allocation of an anonymous code, two aliquots (ca. 400 mg each) were prepared from the sample. The first aliquot was preserved for parasitological and NGS analysis by adding 0.5 mL of Qiagen Allprotect Tissue Reagent (QIAGEN, Hilden, Germany) in a sterile Nalgene® cryogenic vial size 2.0 mL, frozen at −20 °C until transported to the University of Rome Tor Vergata (Italy). DNA from this aliquot was extracted by QIAmp Stool Mini Kit (QIAGEN, Hilden, Germany) [16]. The second aliquot for the xTAG GPP assay analysis and real-time PCR was frozen at −20 °C, transported to the University of Rome Tor Vergata, preserved at −80 °C until shipment to the Institute of Virology of the University of Cologne (Germany). In this case, sample preparation was performed using the automated platform VERSANT kPCR Molecular System (Siemens Healthcare Diagnostics, Erlangen, Germany), according to the manufacturer’s instructions, as described in [23].

2.3. xTAG GPP Assay

Stool samples were investigated for 15 human enteric pathogens by the xTAG Gastrointestinal Pathogen Panel (xTAG GPP) (Luminex Molecular Diagnostics, Toronto, ON, Canada), as already described [23]. The assay concurrently identified adenovirus subtypes 40/41, norovirus genogroup I and II (GI/GII), group A rotavirus, Campylobacter spp., Clostridium difficile toxin A/B, Escherichia coli O157, enterotoxigenic Escherichia coli (ETEC) LT/ST, Salmonella spp., Shiga-like toxin producing E. coli (STEC) stx1/stx2, Shigella spp., Vibrio cholerae, Yersinia enterocolitica, Cryptosporidium hominis, Cryptosporidium parvum, Entamoeba histolytica, Giardia duodenalis.

2.4. Detection of Adeno-, Entero-, and Parechoviruses by Real-Time PCR

The molecular detection of enteroviruses (EV) and parechoviruses (PeV) was performed as already described [24]. Adenoviruses (AdV) were detected by RealStar® Adenovirus PCR Kit 1.0 (Altona Diagnostics, Hamburg, Germany).

2.5. Blastocystis and Commensal Entamoeba spp. Detection and Identification

End-point PCR and sequence analysis of the SSU rDNA region were carried out for the molecular identification of Blastocystis and Entamoeba species. The detection of Blastocystis was performed by amplification of a 600 bp fragment by nested PCR using the primers RD5-BhRDr and Blasto2F-Blasto2R [25] as described in D’Alfonso et al. [26]. The amplification of the specific fragment of Entamoeba spp., including the pathogenic E. histolytica, was obtained using the primers JVC and DSPR2 [27]. The amplicons were from 622 to 667 bp long depending on the species.
All amplicons were purified using a QIAquick Gel Extraction Kit (QIAGEN, Valencia, CA, USA) and sequencing was performed in the Bio-Fab Research Laboratory in Rome (Italy). The identities of the obtained sequences were verified using the Basic Local Alignment Search Tool (BLAST).

2.6. 16S rRNA Gene Amplicon Sequencing

PCR reactions for amplification of the V3 and V4 regions of bacterial 16S rDNA genes contained 25 μL reaction volume per sample: 2.5 µL microbial genomic DNA (12.5 ng), 1 µL of each primer (10 µM): 16S Amplicon PCR Forward Primer
(5′-TCGTCGGCAGCGTCAGATGTGTATAAGAGACAGCCTACGGGNGGCWGCAG-3〲) and 16S Amplicon PCR Reverse Primer
(5′-GTCTCGTGGGCTCGGAGATGTGTATAAGAGACAGGACTACHVGGGTATCTAATCC-3〲), 4 µL HF buffer, 2 µL dNTPs (10 mM each; Axon lab, Germany), 0.4 µL BSA (20 mg/mL, ThermoFisher Scientific, Waltham, MA, USA), 4 µL Betaine (5M, Sigma-Aldrich), and 0.2 µL Phusion Hifi DNA polymerase (ThermoFisher Scientific, Waltham, MA, USA). Primers for the amplification of the 16S V3 and V4 region were selected from Klindworth et al. [28]. Illumina adapter overhang nucleotide sequences were added to the gene-specific sequences (Illumina P5/P7 adaptor sequences in italic, see above).
Amplification was performed as follows: initial denaturation at 95 °C for 5 min, 25 cycles of denaturation at 95 °C for 40 s, annealing at 53 °C for 40 s, and extension at 72 °C for 60 s, followed by a final extension of 7 min at 72 °C. Before the “library preparation” by index-PCR, amplicons were purified using the Agencourt AMPure®XP system on a BioMek NX workstation (Beckman Coulter, Germany) following instructions provided by the manufacturer. The index PCR attached dual indices using the Nextera XT® (Illumina Inc., San Diego, CA, USA) Index Kit following instructions provided by the manufacturer. The index PCR reaction was purified as described above followed by a library quantification, normalization, pooling, library denaturing, and MiSeq® (Illumina Inc., San Diego, CA, USA) sample loading in a final concentration of 10 pM, following the protocol described by the manufacturer. Sequencing was accomplished using MiSeq reagent kit v2 in a 2 × 250 cycle paired-end sequencing run.

2.7. 16S rRNA Amplicon Data Processing

Sequencing data were processed using the QIIME DADA2 plugin with the denoise-paired option and standard parameters (trunc_q = 2, max_ee = 2, chimera_method = consensus). Taxonomic classification was performed by a Naïve Bayes classifier (sklearn) [29], which was trained on the SILVA database release 128 [30]. Rarefaction curves were determined based on the feature table and analysis of the relative proportion of each bacterial taxon was made after the data were rarefied at a sequencing depth of 4000 sequences per sample.
Statistical analyzes were carried out using R for Statistical Computing (version 3.5.1, R Foundation for Statistical Computing, Vienna, Austria) [31] (Team RC). The QIIME biom data were imported and diversity scores calculated using the phyloseq R package [31,32]. Rarefaction curves were determined based on the feature table and analysis of the relative proportion of each bacterial taxon was made after the data were rarefied at a sequencing depth of 4000 sequences per sample. All continuous data were presented as mean and standard deviation (SD) or median and range, tested with Student’s t-test, Mann–Whitney U test, and Kruskal–Wallis-test with Dunn’s post-test, as appropriate. In the beta diversity, the UniFrac distances between the samples were visualized using principal coordinate analysis (PCoA), and group effects were tested by a permutational multivariate analysis of variance (PERMANOVA). Differentially abundant taxa were identified using linear discriminant analysis (LDA) effective size (LefSe) [33]. All statistical tests were two-tailed, and a p-value < 0.05 was considered statistically significant.

3. Results

3.1. Study Area and Host Population

Sixty-seven fecal samples were collected from subjects aged between 1 to 59 years old and nine samples from infants (<1 year), representing four different localities: 53 samples from an urban area (Bonoua) and 23 samples from non-urban areas (Assouindé, Kimoukro, Yaou; see Table 1). Fourteen samples were collected during the heavy rainy season, 22 during the low rainy season, and 40 during the heavy dry season.

3.2. Viral, Bacterial, and Protozoa Detection

Within the cohort, 12 subjects, including four infants, were tested negative for all analyzed microorganisms; 64 subjects, including five infants, were tested positive for at least one virus, bacterium, or protozoa; 10 subjects, including three infants, were tested positive for a single microorganism, 20 subjects for two microorganisms, and 34 subjects, including two infants, for three or more microorganisms.
Overall, 32 subjects, including five infants, were tested positive for at least one virus, with adenovirus (AdV) and enterovirus (EV) being the most common, as showed in Table 2.
A total of 17 subjects, including two infants, were tested positive for bacterial pathogens with enterotoxigenic E. coli (ETEC), Campylobacter, Shigella, and E. coli O157 being the most frequently identified (Table 2). A total of 54 subjects, including one infant, were positive for at least one protozoa species with Blastocystis being the most common (47 out of 54). Overall, 20 subjects were positive for Entamoeba hartmanni, 11 for Entamoeba coli (En. coli), and two for Entamoeba dispar; Giardia duodenalis was detected in 25 individuals, including one infant (Table 3).

3.3. Gut Microbiota Composition
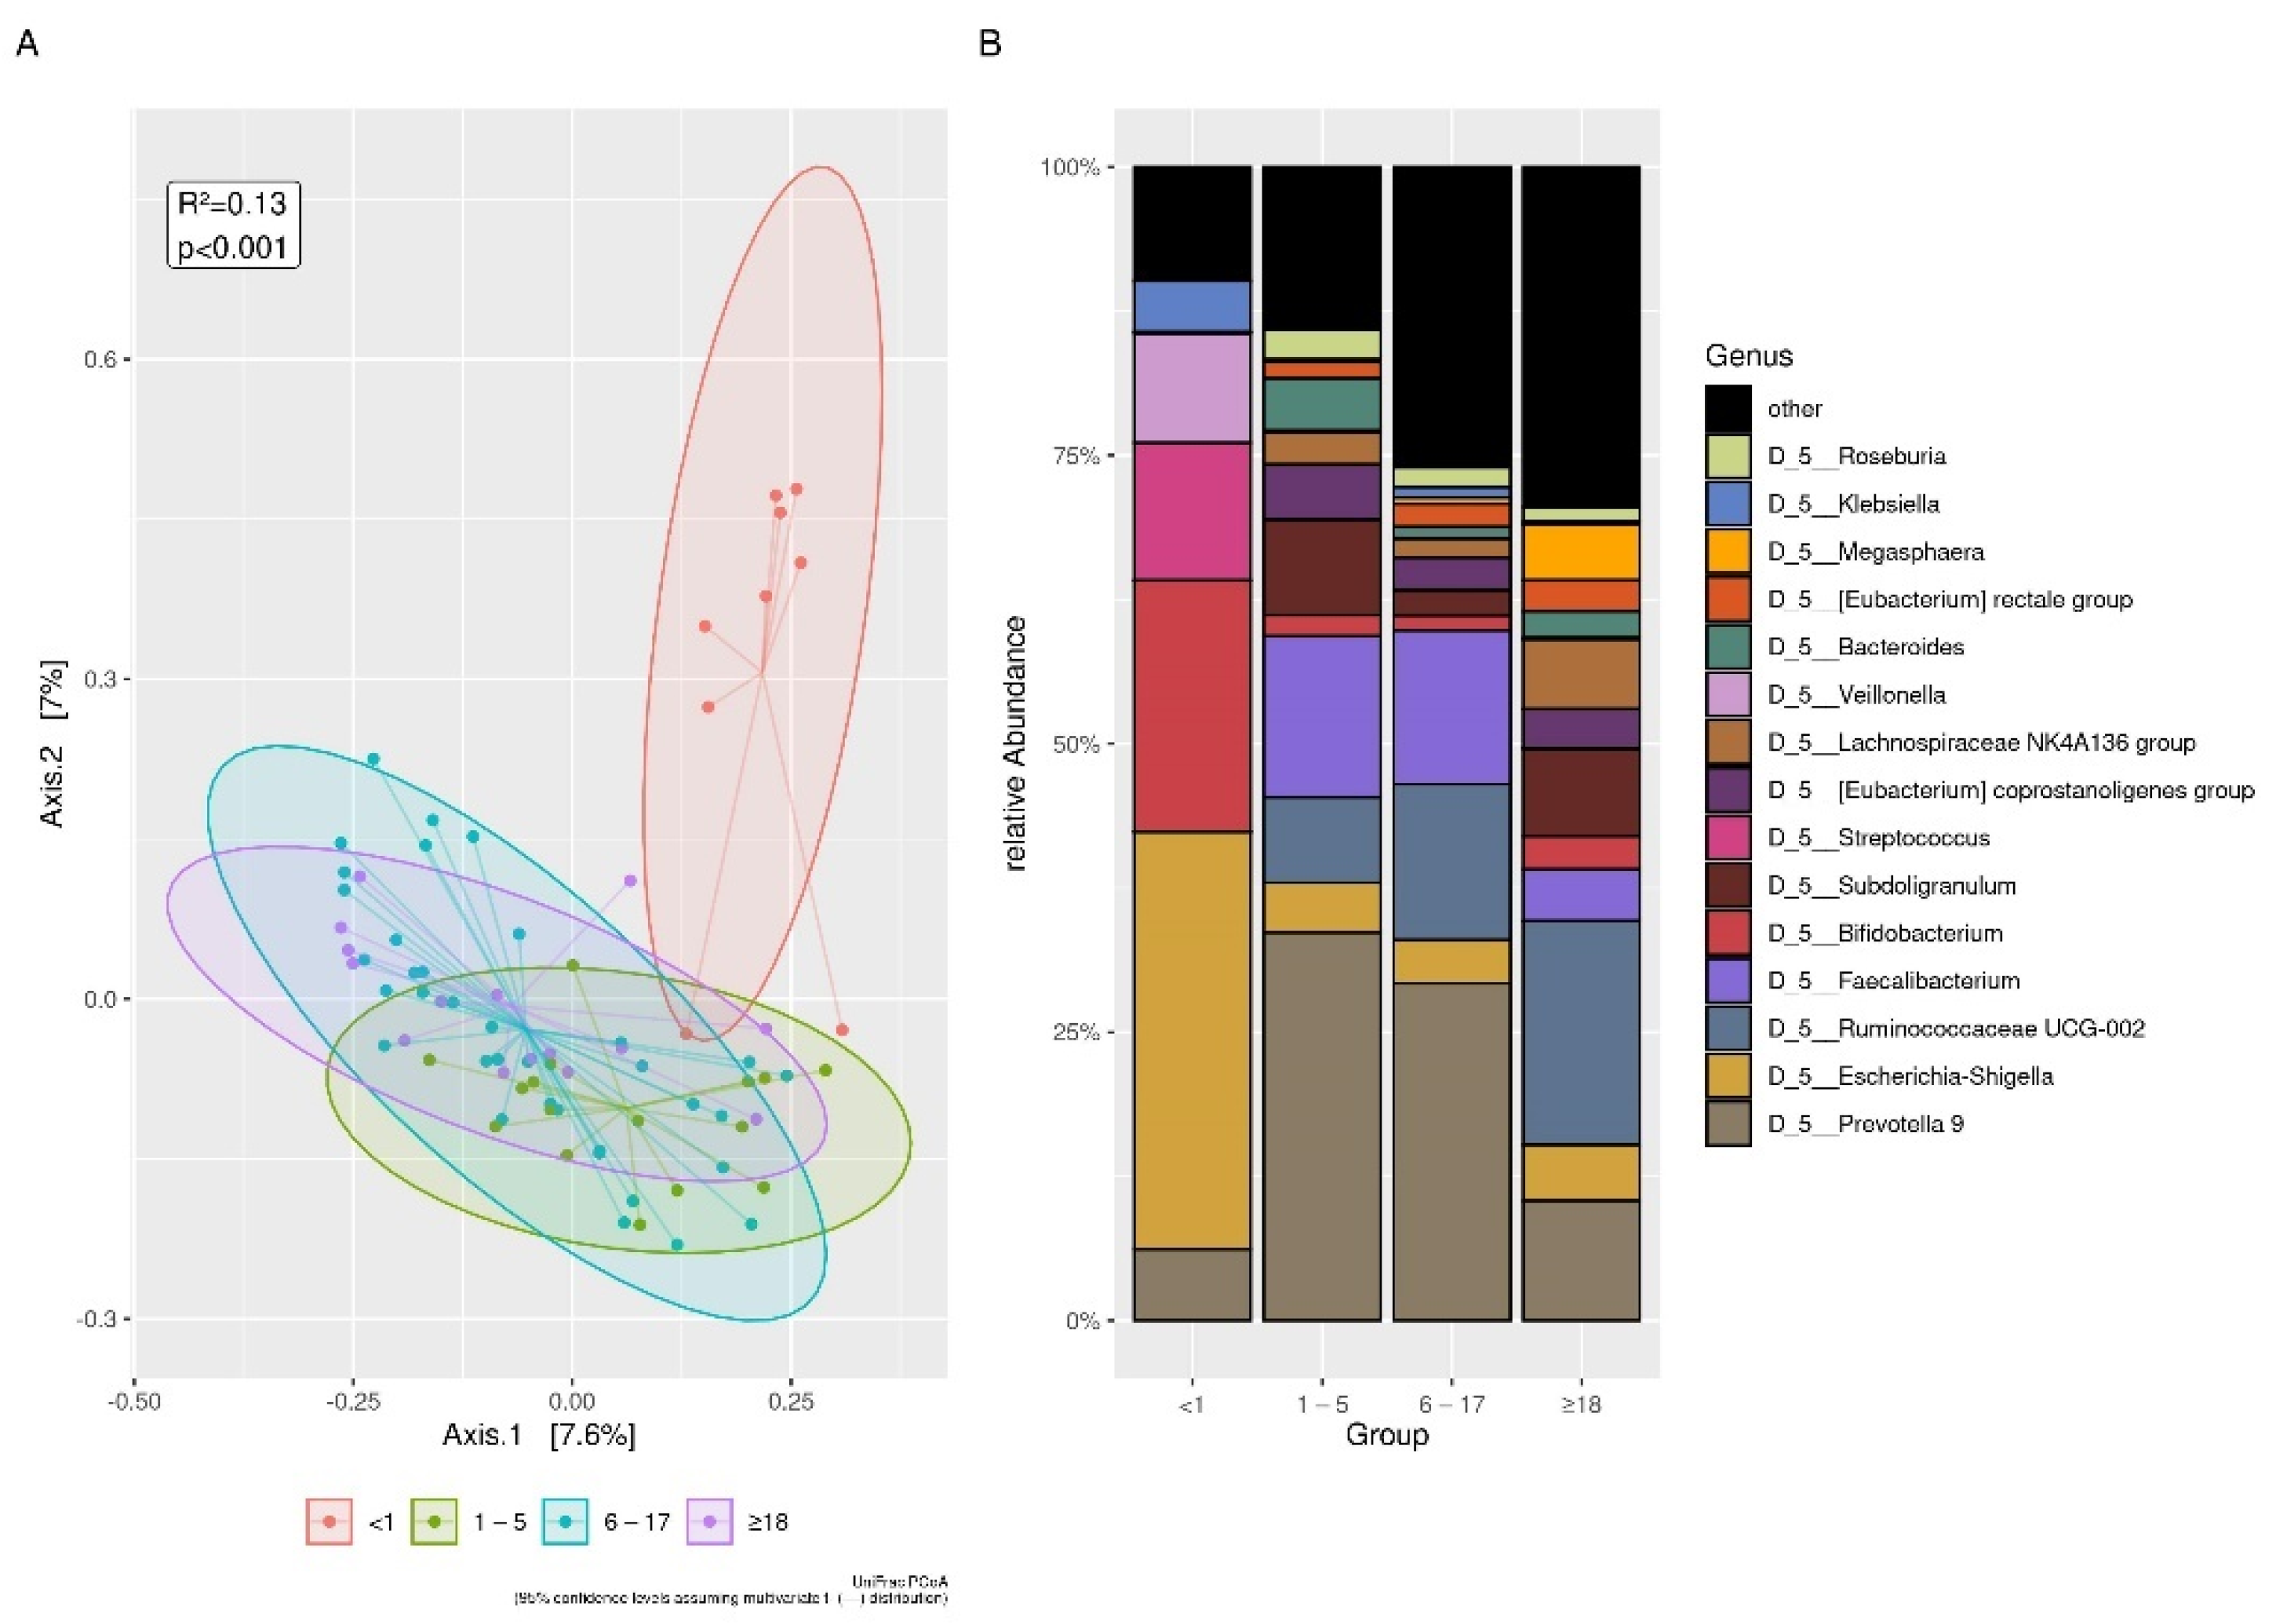
3.3.1. Age

A marked difference in diversity was found between infants compared to the other age groups (Figure 1A). Infants showed a significant lower alpha diversity, in particular when compared to those aged 6–17 and >18 years (Table 4).
As for bacterial composition, the phyla Proteobacteria and Actinobacteria were more abundant in <1 year of age, and the Firmicutes and Bacteroidetes phyla were more abundant in other age groups. In detail, the Christensenellaceae, Rikenellaceae, and Succinivibrionaceae families were absent in subjects <1 year of age, while a high prevalence of Actinomycetaceae was observed within this group (Figure S1A). Moreover, Enterobacteriaceae abundance (0.30025 (0.0005–1)) was higher when compared to subjects aged >1–5 (0.002875 (0.00025–0.26)), 6–17 (0.00375 (0–0.67675)), and ≥18 years (0.004 (0–0.32125)). An opposite trend was observed with Prevotellaceae (0 (0–0.5625)), which was less abundant in subjects <1 of age than in age groups 1–5 (0.3544 (0.00–0.8035), p < 0.05) and 6–17 years (0.2610 (0.00–0.9328), p < 0.001). Ruminococcaceae abundance (0.00025 (0–0.002)) was also lower than in the age groups 1–5 (0.29280 (0.06200–0.8785), p < 0.01), 6–17 years (0.33000 (0.0010–0.9120), p < 0.001), and >18 years (0.33000 (0.0010–0.9120), p < 0.001). Finally, Eubacterium coprostanoligenes, Eubacterium rectale group, Lachnospiracee NK group, Roseburia, Ruminococcaceae UCG-010, Ruminococcaceae UCG-013, Christensenellaceae R-7 group, and Rikenellaceae RC9 were absent in subjects aged <1 year.
The organisms most frequently present at the genus level are shown in Figure 1B; the related statistical significance in the abundance comparison between infants versus all other groups is reported in Table S1A.

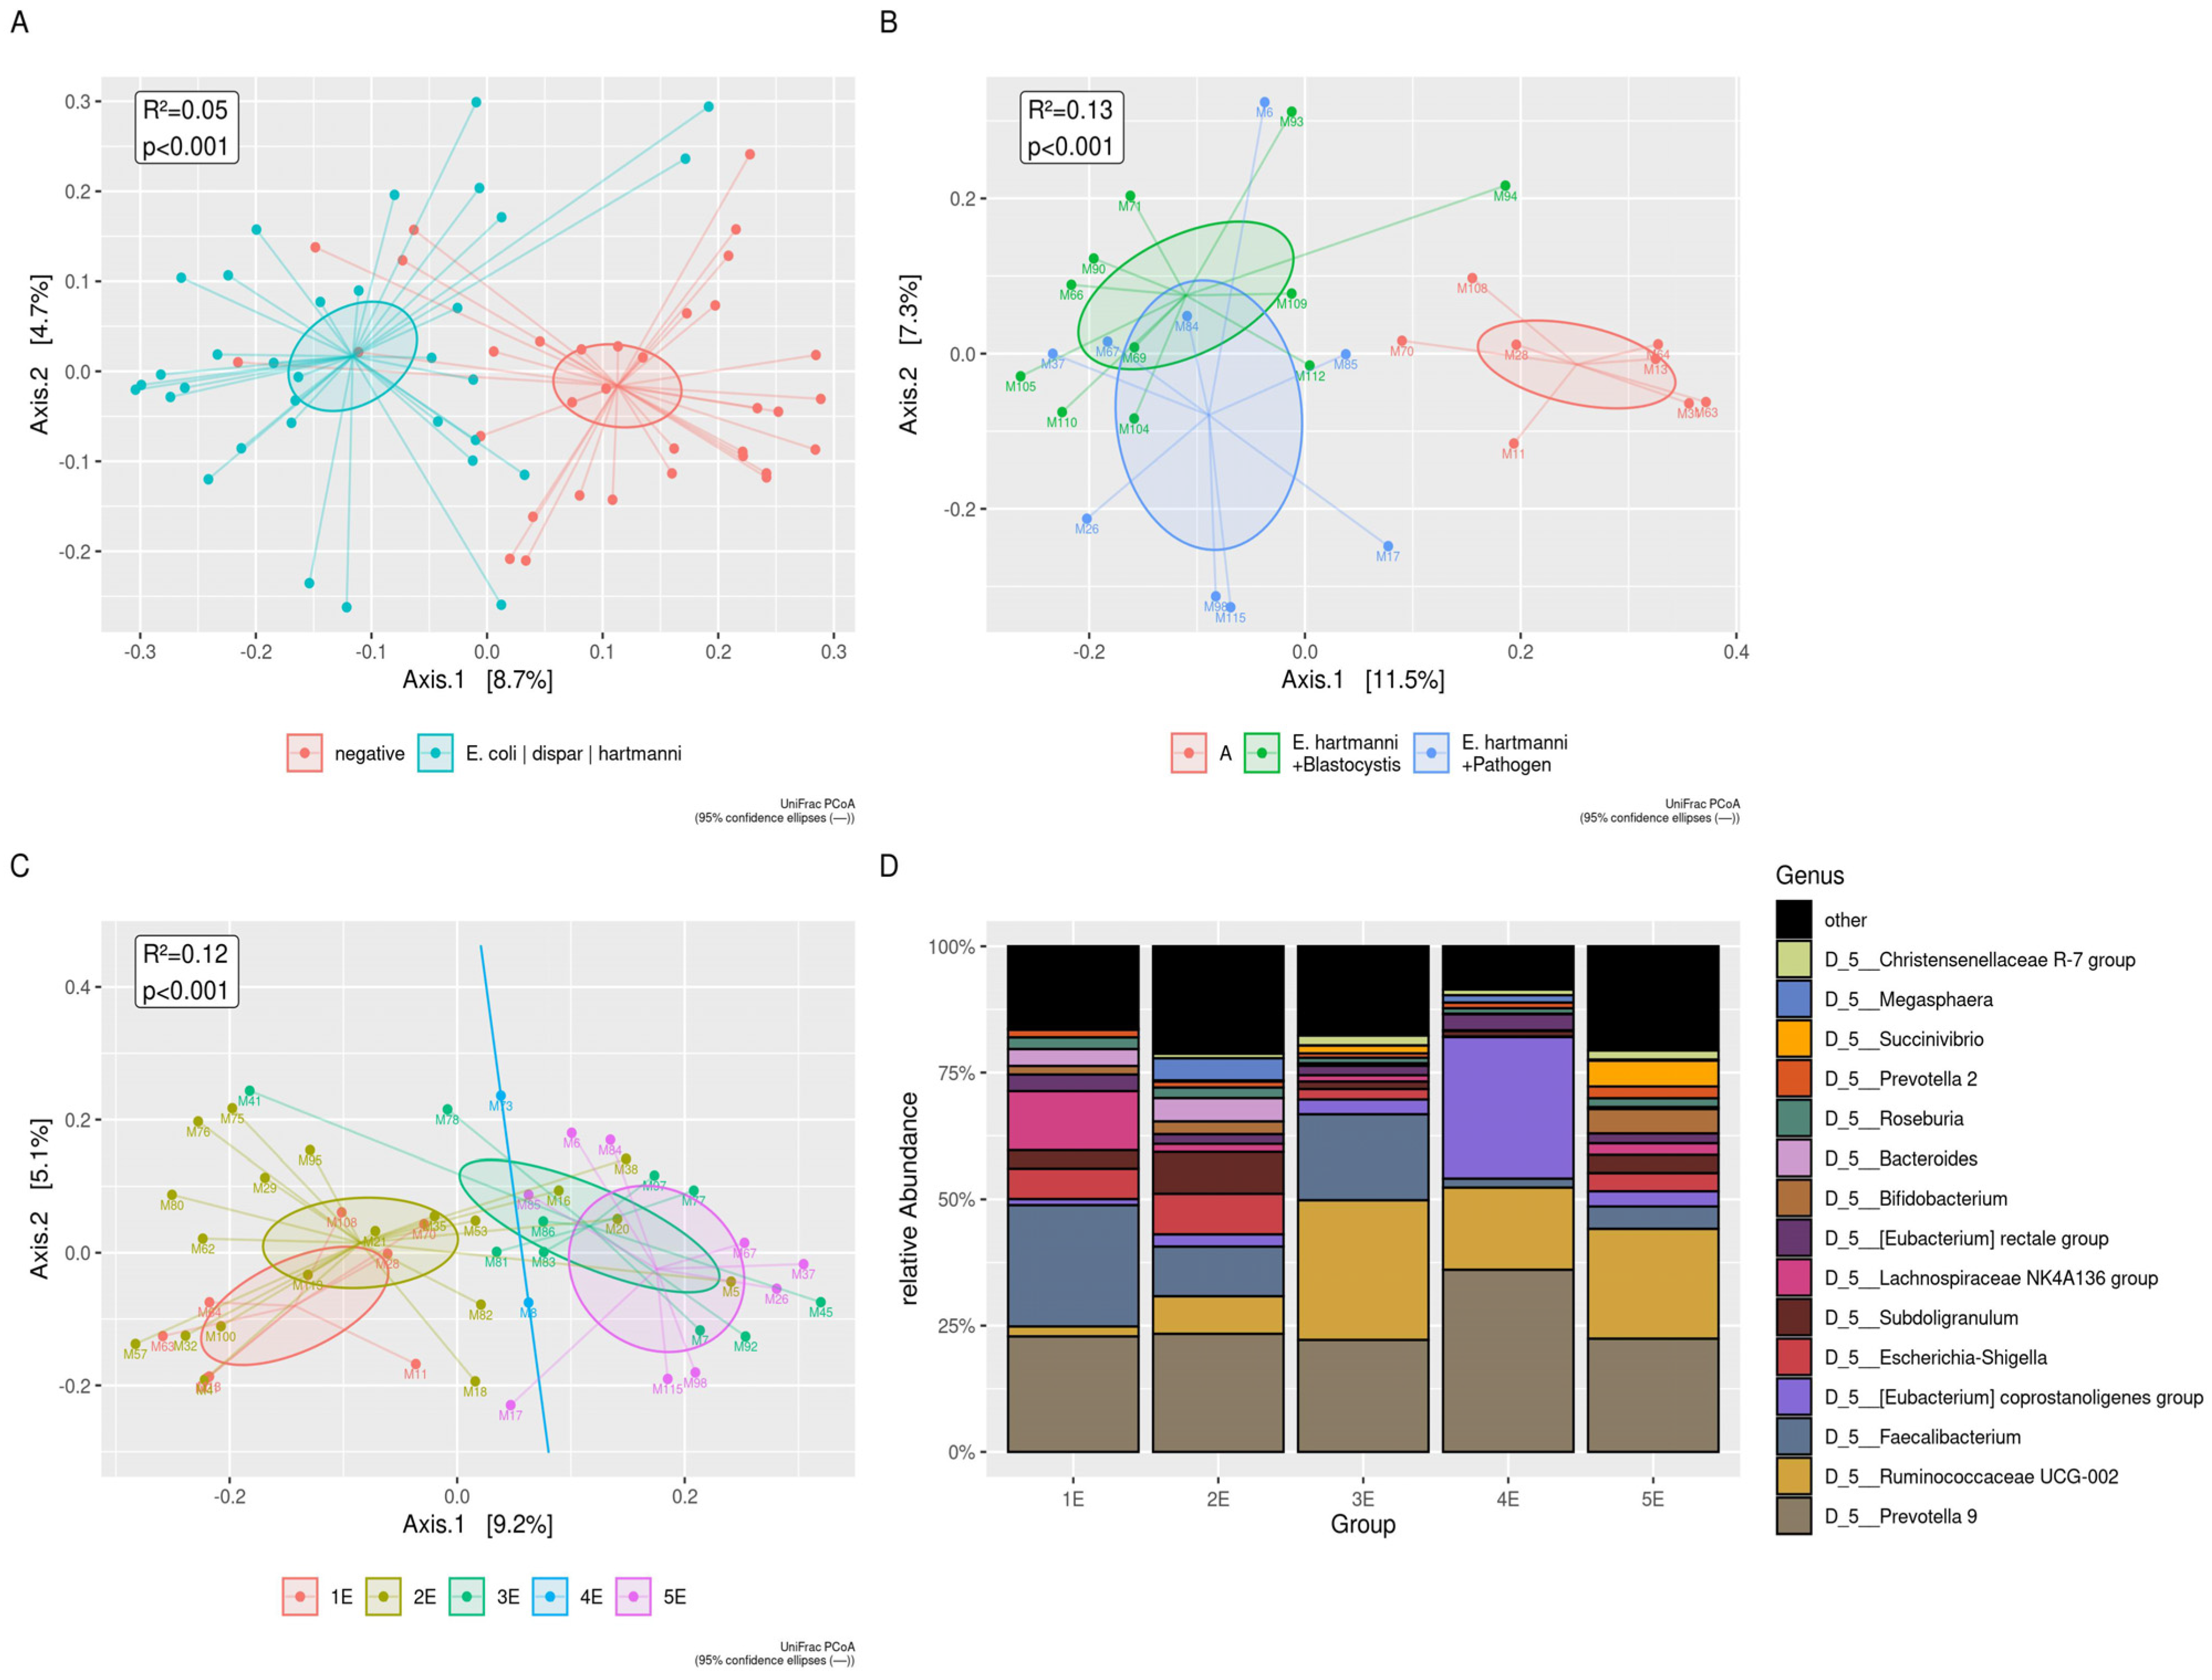
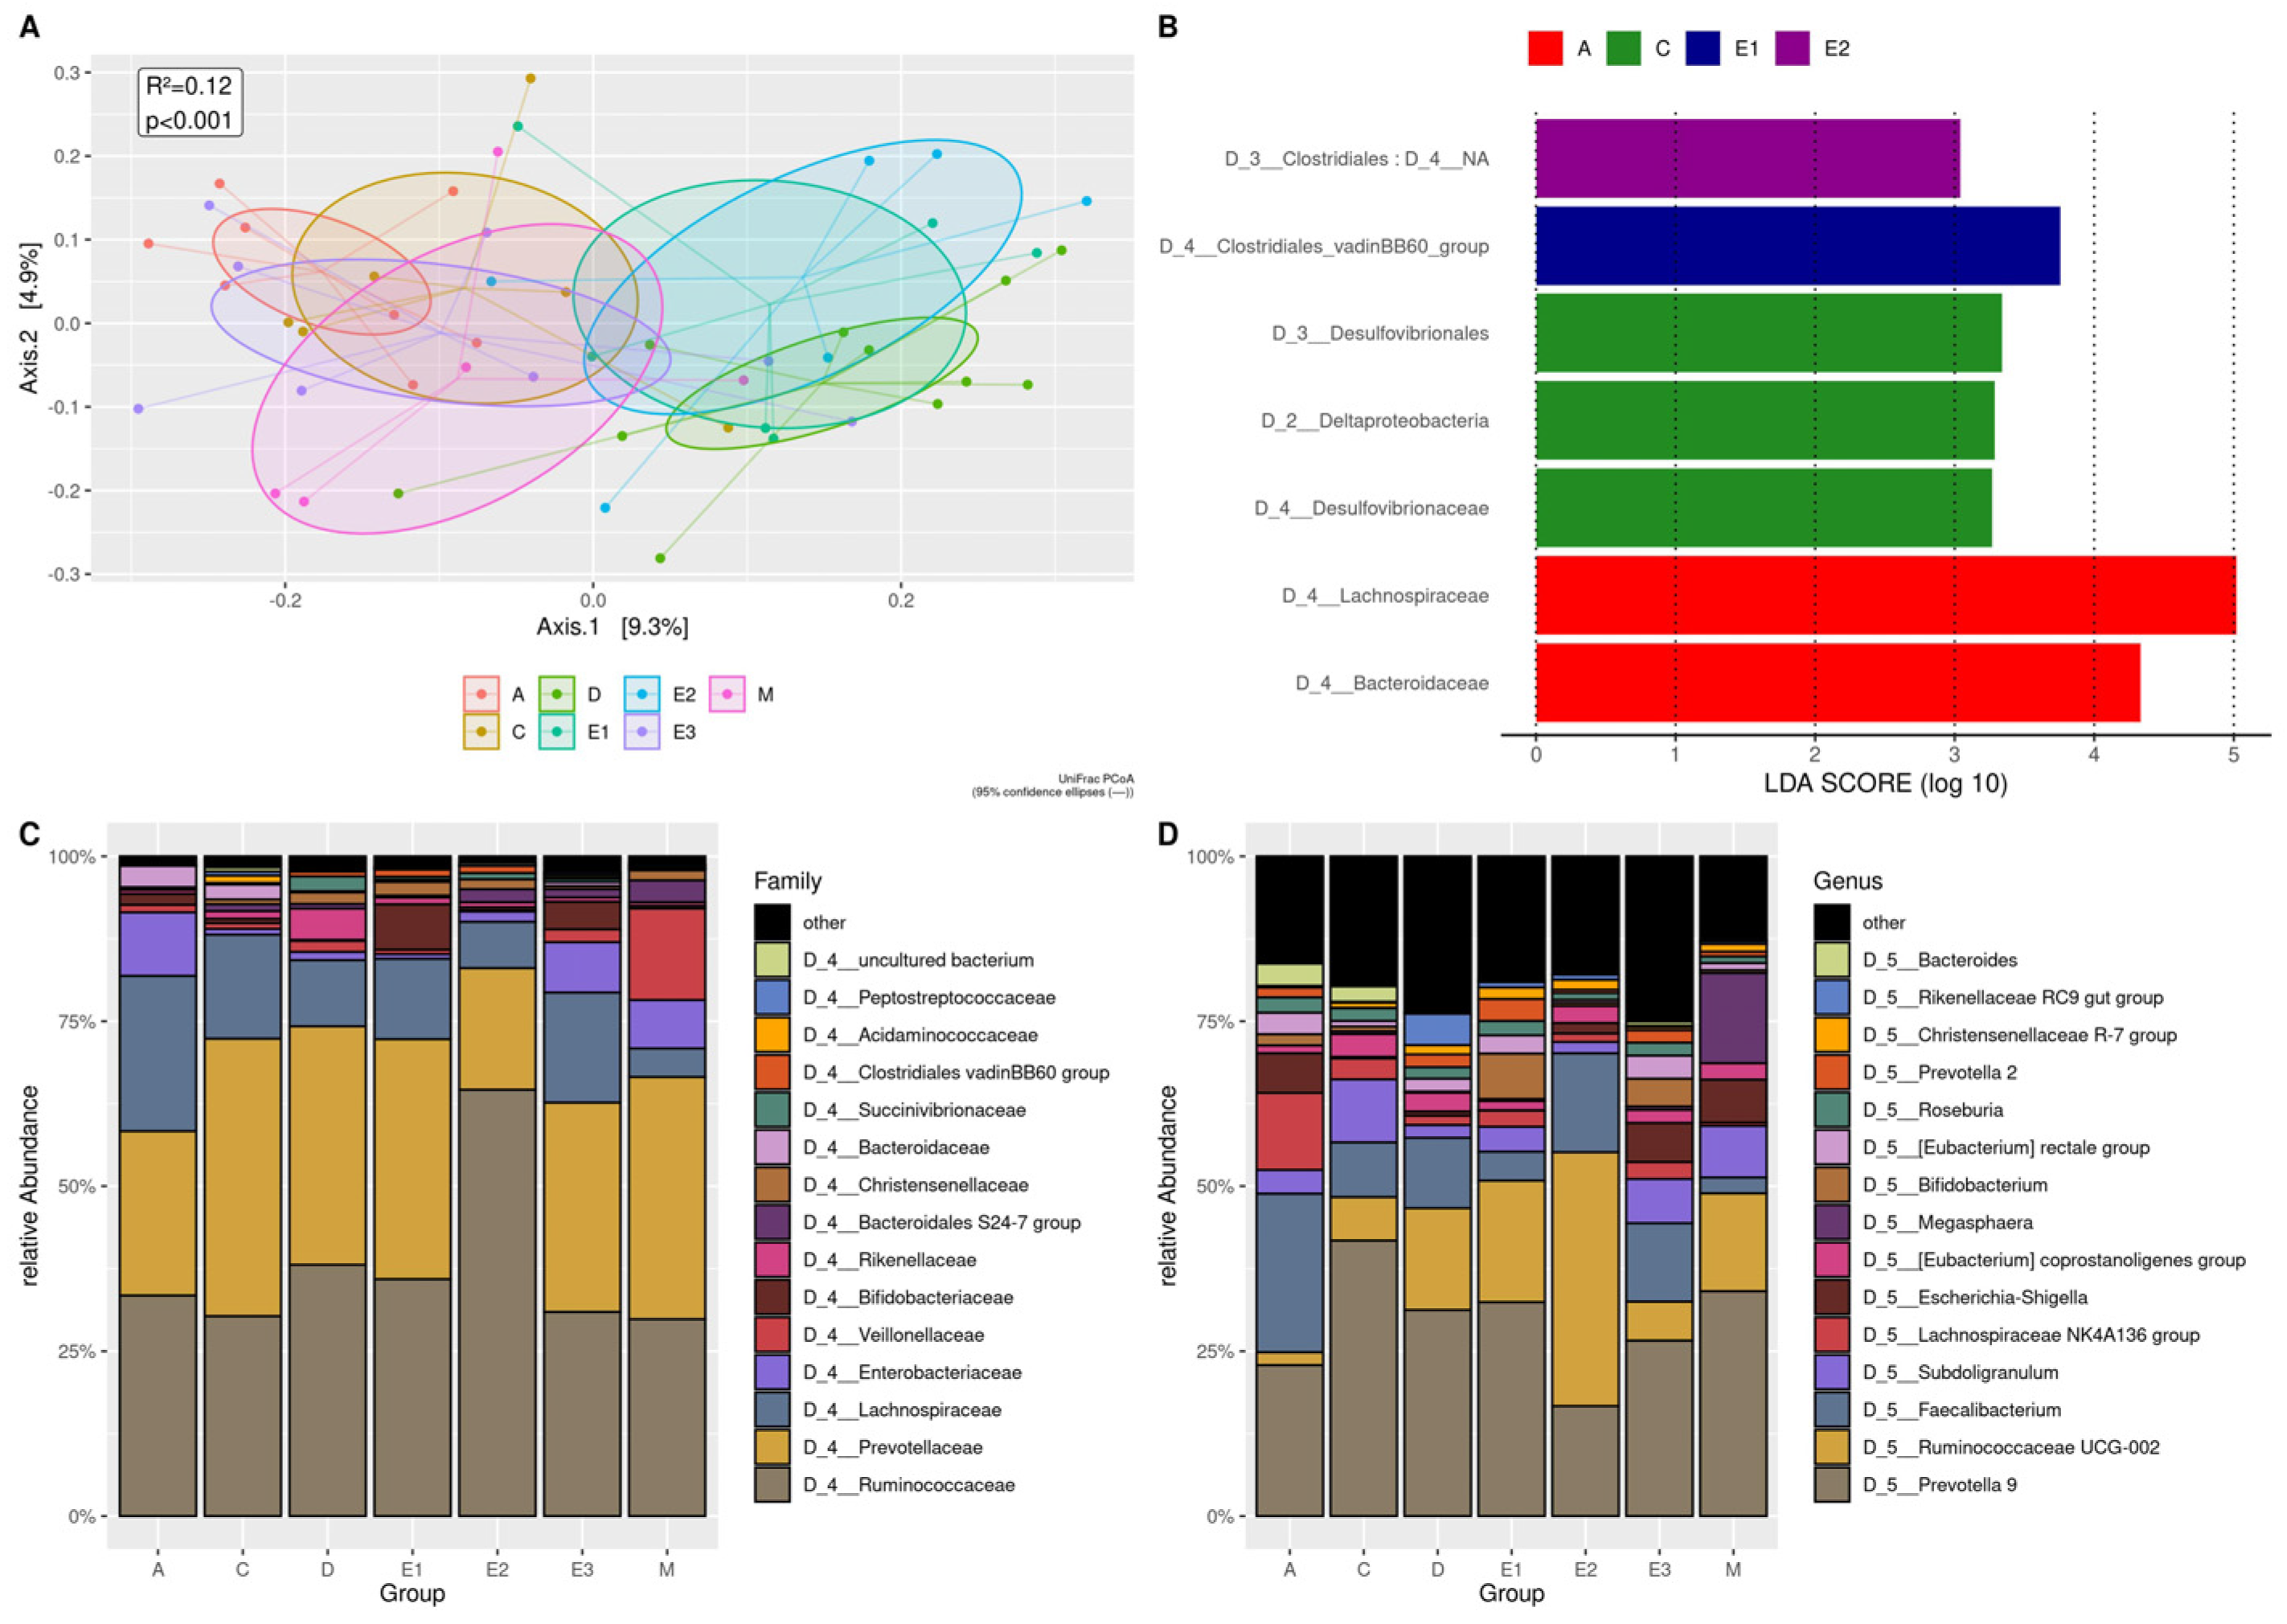
3.3.2. Denovo Clustering

In an attempt to identify different gut microbiome enterotypes in all 67 subjects >1 year of age, we calculated the UniFrac distances between all samples, partitioned (clustered) the data into k clusters around meteroids (Figure S2A), and calculated the respective gap statistics. Using this approach, we were able to split the subjects into two clusters. The first one, grouping 39 subjects aged 1–59 years and showed higher richness based on Chao1 (p < 0.01), OTUs (p < 0.01), and PD (p < 0.001), and dominance of Ruminococcaceae (Clostridia Class) over Prevotellaceae (Bacteroidia Class). The second cluster, including 28 subjects aged 1–19 years, showed an inverse dominance of Prevotellaceae versus Ruminococcaceae (Figure S2B–D). At the genus level, both clusters had similar abundances of Bacteroides, Escherichia-Shigella, Faecalibacterium, Roseburia, Eubacterium, Lachnospiraceae, Christensenellaceae R-7 group.

3.3.3. Sex

Overall, a significant difference in Faith’s phylogenetic diversity (PD) between 36 females (16.56 (0.9572–29.68)) and 40 males (12.22 (1.6780–34.15)) (p < 0.05) was observed. Ruminococcaceae abundance was higher in females (0.41125 (0–0.912)) versus males (0.174875 (0–0.8527)) (p < 0.01) and the Ruminococcaceae UCG-002 genus abundance showed the same trend (p < 0.01). No significant differences in alpha and beta diversity were found between male and female infants. Among subjects of other age groups, only females aged 6–17 years old showed a PD index between (19.28 (12.50–29.68)) which was different compared to males of 1–5 years old (12.39 (7.27–15.23)) (p < 0.05) and 6–17 years old (13.07 (7.34–34.15)) (p < 0.05). Among subjects aged 1–5 years, there was a lower abundance of Prevotella 9 in females (0.003 (0–0.477)) compared to males (0.704 [0.012–0.741]) (p < 0.01). In the 6–17 years age group, there was a greater abundance of Ruminococcaceae UCG-002 in females (0.125 (0.009–0.827)) compared to males (0.015 (0–0.440)) (p < 0.05). Within subjects >18 years of age, there was a higher abundance of Megasphaera in females (0.017 (0–0.654)) compared to males (0.00 (0–0)) (p < 0.01). Between the age groups, only Prevotella 9 was less abundant in females >18 (0.002 (0–0.139)) versus males of 1–5 years of age (0.704 (0.012–0.741) (p < 0.01). The top 15 bacterial composition at the genus level was shown in Figure 2.
Subsequently, the results relating to the nine infants are not indicated considering their small number and the unexpected variety of isolated pathogens.
The data of alpha and beta diversity concerning five subjects tested positive for different enteric pathogens (adenovirus, enterovirus, parechovirus, norovirus, Campylobacter, Shigella, and G. duodenalis) and four negative subjects were indicated in S3 (Table S3A, Figure S3B,D).

3.3.4. Localities and Seasonality

The gut microbiota of patients sampled from semi-urban (Bonoua) and non-urban areas (Assouindé, Kimoukro, Yaou) showed no differences in alpha and beta diversity.
The relative abundances of the genus Escherichia-Shigella (0.00125 (0–0.00125)) in samples collected during the low rainy season was lower than in sample collected in the heavy dry season (0.0045 (0–0.59125)) and the heavy rainy season (0.003 (0–0.272)). The genus Prevotella 9 showed a significant lower abundance in the heavy rainy season (0.001375 (0–0.6885)) versus heavy dry season (0.05575 (0–0.7405)) and versus low rainy season (0.52625 (0.022–0.86675)), and in heavy dry season versus low rainy season. The genus Megasphaera showed a significant lower abundance in heavy dry season (0 (0–0.121)) versus the heavy rainy season (0 (0–0.6535)). The top 15 bacterial composition at the family and genus levels were shown in Figure 3.

3.4. Blastocystis, Commensal Entamoeba spp., and Intestinal Pathogens

Subjects negative for common enteric pathogens (xTAG Luminex panel), EV, PeV, AdV (real-time PCR), Blastocystis, and Entamoeba spp. (PCR) were assumed as the control group (Figure S3A,C). The other groups contained positive individuals who tested positive for one or more of these microorganisms. Only five individuals aged 5 to 10 years (4F/1M, 7.8%) were found to have multiple infections and exclusively reported frequent abdominal pains (Table S4A). The beta diversity analysis showed a significant lower abundance of the genus Ruminococcaceae UCG-002 in negative (0.0116 [0–0.082]) versus positive individuals (0.065 [0–0.8272]) (p < 0.01). The opposite trend for the genus Faecalibacterium does not reach significance.
No difference was found between positive versus negative subjects for the different age groups (Figure 4).

3.5. Blastocystis

To shed light on a possible implication of single or co-detection Blastocystis on gut microbiota, the control group (Group 1) was compared with 42 positive Blastocystis patients further divided as follows: 6 subjects positive for Blastocystis only (Group 2); 12 subjects positive for Blastocystis and Entamoeba spp. only (Group 3); 5 subjects positive for Blastocystis, viruses, and bacteria (Group 4a); 6 subjects positive for Blastocystis and Entamoeba spp., viruses and bacteria (Group 4b); 13 positive subjects for Blastocystis and Entamoeba spp. and G. duodenalis and other pathogens (Group 5b). Alpha diversity indices increased when Entamoeba spp. co-infections were present ( Table S4B).
As for bacterial composition, significant differences were observed between Group 1 versus Groups 3, 4a, 4b, and 5b but not versus subjects positive for Blastocystis only (Group 2). In detail, at the genus level, Group 1 showed: (i) a lower median of Alloprevotella (p < 0.01), Rikenellaceae RC9, Succinivibrio (p < 0.05), and Ruminococcaceae UCG-010 (p < 0.01) versus Group 3, (ii) a higher median of Faecalibacterium (p < 0.05) versus Group 4a; (iii) a lower median of Ruminococcaceae UCG-002 and Ruminococcaceae UCG-010 versus Group 4b; (iv) a higher median of Bacteroides (p < 0.05) and Lachnoclostridium (p < 0.05) and a lower median of Ruminococcaceae UCG-010 (p < 0.05) compared with Group 5b. Finally, Group 2 showed an increase of Alloprevotella and Prevotella 2 (p < 0.05) versus Group 3 (Figure 5).

3.6. Commensal Entamoeba spp.

Entamoeba spp. was isolated in 49% (33/67) subjects, mostly associated with Blastocystis (94%, 31/33). Firstly, we compared Entamoeba spp. negative versus Entamoeba spp. positive subjects (Figure 6A and Table S5A and Table S5B). To better elucidate the association between Entamoeba and Blastocystis, we then categorized Entamoeba spp. negative (n = 34) as follows: (i) a group carrying Blastocystis (n = 16), (ii) a group without Blastocystis (n = 18), and both groups were compared with patients harboring Entamoeba spp. with/without Blastocystis (n = 33), regardless of other infecting microorganisms (data not shown). To better clarify the frequently detected association between E. hartmanni and Blastocystis we distinguished the following groups: (i) the control group (n = 8), (ii) a group carrying E. hartmanni and Blastocystis (n = 11), (iii) a group carrying E. hartmanni and Blastocystis and pathogens (n = 9).
The presence of E. hartmanni produced a significant increase in alpha diversity indices (Table S4C). The UniFrac distances, using principal coordinate analysis (PCoA), showed the shifting of positive groups for E. hartmanni (Figure 6B). At the genus level of the Christensenellaceae R-7 group, Ruminococcaceae UCG-002 increased in two groups carrying E. hartmanni; Blastocystis, Faecalibacterium, and Bifidobacterium showed an opposite trend (Table S5C).
The next step was to discriminate any differential relationship between the control group (Group 1E) and the subjects infected by pathogens, not including Entamoeba spp. (Group 2E), or infected by different Entamoeba species (Group 3E = positive for En. coli and other pathogens; Group 4E = positive for E. dispar and other pathogens; Group 5E = positive for E. hartmanni and other pathogens). As for alpha diversity, a significant difference was found in Chao1 Index, Observed OTUs (p < 0.05) and Faith’s phylogenetic diversity (p < 0.01), comparing Group 1E versus Group 5E; observed OTUs and Faith’s phylogenetic diversity (p < 0.05) comparing Group 2E versus Group 5E (Table S4D).
Beta diversity analysis showed: (i) a lower abundance for Bacteroides (p < 0.05) and for Lachnoclostridium (p < 0.01) in Group 3E versus Groups 1E and 2E; (ii) a lower abundance for [Ruminococcus] torques group in Group 3E versus Group 2E; (iii) an increased abundance for Ruminococcaceae UCG-002 and Ruminococcaceae UCG-010 (p < 0.05) in Group 5E versus Group 2E, and for Ruminococcaceae UCG-010 (p < 0.01) in Group 5E versus Group 1E (Figure 6C,D).

3.7. G. duodenalis and Other Intestinal Pathogens

To investigate the influence of G. duodenalis and other enteropathogens, the 67 subjects were divided into seven groups: control group (Group A); 6 subjects positive for Blastocystis only (group C); 11 subjects positive for Blastocystis and E. hartmanni without enteric pathogens (group D); 6 subjects infected by E. hartmanni, Blastocystis and G. duodenalis, and enteric pathogenic bacteria and viruses (group E1); 6 subjects positive with En. coli, Blastocystis and G. duodenalis, and enteric pathogenic bacteria and viruses (group E2); 8 subjects positive with Blastocystis, G. duodenalis, and enteric pathogenic bacteria and viruses (group E3); 5 subjects positive for Blastocystis and enteric pathogenic bacteria and viruses (group M).
Observed OTUs, Faith’s PD, and Shannon index were significantly increased in group D compared to the control group and only for the Shannon index compared to group M (Table S4E).
The UniFrac PCoA analysis along axis 1 showed some overlap in the composition of the groups and a non-significant separation between the three groups co-infected with Entamoeba species (D, E1, E2) and the other groups (A, E3, M) (Figure 7A); negative subjects (group A) were separated from subjects co-infected with Entamoeba spp. (D, E1, E2) as displayed in Figure 6A. Cladograms generated by LEfSe showed differences in taxa between A, C, E1, E2 groups with LDA score (p < 0.01) (Figure 7B). No significant differences between all groups were observed by the analysis of the relative abundance at the family and genus level (Figure 7C,D).

4. Discussion

Age, diet, mode of birth and lactation, environment, circadian rhythm, geographic location, and host genetics, in a complex way, contribute to the individual heterogeneity of the human gut microbiota [1]. The data currently available are mainly from populations living in so-called “Western” contexts such as Europe and North America where Bacteroides dominate the gut microbiota. Limited data are available from sub-Saharan rural or semi-urban areas where a predominance of Prevotella in bacteria composition is evidenced. However, the diffusing industrialization and westernization in these regions could influence these patterns [8,34,35].
The present study describes the composition of the intestinal microbiota in infants, children, and adults living in the Côte d’Ivoire without neglecting the most common endemic, pathogenic, and commensal microorganisms. This investigation aimed to delineate a potential link between Blastocystis, commensal Entamoeba spp., common enteric pathogens, and the gut microbiota [36,37]. Among adults, two clusters, one dominated by Ruminococcaceae and the other one by Prevotellaceae, could be identified. These species could be either termed “biomarkers” as proposed by Gorvitovskaia et al. [38], or “biomes types” as indicated by Huse et al. [39]. These species represent consortia of bacteria mostly influenced by genetic and immune host factors, and, above all, dietary and cooking practices [40]. The reduced abundance of Bacteroidaceae, in both clusters, was in line with previous data from similar eco-geographical areas, from agricultural societies, and countries with a low level of industrialization [10,41]. In our sampling area, weaning occurs earlier than in Western societies and the diet mostly includes local and seasonal vegetables (e.g., okra, cassava and cassava leaf, tubers, and plantain) prevailing on the intake of animal-based product (e.g., eggs, poultry, fish). Among the fats, peanuts, and palm oil dominate. Seasonal fruit consumption is not a widespread habit, due to economic reasons and its rapid deterioration and traditional sugary juices (pineapple, passion fruit, hibiscus, ginger) are preferred, therefore reducing the intake of vitamins, mineral salts and healthy fiber. Overall, the present investigation confirmed the different composition of gut microbiota between infants, children, and the high individual variation among adults [4,42]. Enterobacteriales (Proteobacteria phylum), Bifidobacteriales (Actinobacteria phylum), and Lactobacillales (Firmicutes phylum) showed higher relative abundance in infants, while Firmicutes and Bacteroidetes were the dominant phyla in older individuals, followed by Proteobacteria [43,44]. In all age groups, Faecalibacterium, Lachnospiraceae, Eubacterium rectale, Roseburia, members of Clostridium clusters XIVa and IV, have been detected. These taxa produce crucial metabolites that promote health and maintain gut microbiome colonization resistance [45]. The lack of complete uniformity with previous studies could be attributable to regional and geographical differences [10,46,47,48].
Regarding sex-related microbiota differences, females showed a higher phylogenetic diversity than males. It is possible to hypothesize that puberty in young women could have an impact on alpha diversity compared to males. Additionally, ethnic and social habits related to daily activities could contribute to an exposition of men and women to different environmental factors [49]. A sex-related divergence of Prevotella 9, Ruminococcaceae UCG-002, and Megasphaera was noted in different age groups. In the present cohort, Megasphaera was almost undetectable in both sexes, except in women >18 years of age, which is different from the study by Takagi et al. [50], who reported high levels in Japanese adult males. The meaning of these differences will require further detailed investigations.
A specific aim of the study was to provide new data on the microbiota composition in subjects harboring Blastocystis, Entamoeba spp., and common enteropathogens. The high detection of protozoa viruses and bacteria confirmed data reported by previous studies conducted in the same area [26,51] and other countries in sub-Saharan Africa [9,19,52,53,54]. No patients were tested positive for E. histolytica, C. hominis, and C. parvum. Unfortunately, the use of the xTAG GPP molecular test did not allow the isolation of Cryptosporidium meleagridis whose prevalence is relatively high in the same area [55].
The high number of asymptomatic individuals suggests an adaptation to constant and cumulative exposure to enteropathogens due to the common risk factors associated with low-income countries [22,23,56,57,58].
In children and adults carrying protozoa, bacteria, or viruses, greater diversity and richness in the gut microbiota than in negative subjects was evident, in line with other works [19,20]. Furthermore, the critical taxa involved in the intestinal homeostasis such as Faecalibacterium, Bifidobacterium, Lachnospiraceae, Ruminococcaceae UCG-002, (Eubacterium) coprostanoligenes, (Eubacterium) rectale, and Roseburia group showed variations in richness in the same comparison.
The variable abundance of bacterial genera such as Faecalibacterium, Bifidobacterium, Roseburia group allows for the production of key metabolites as short-chain fatty acids (SCFA), e.g., butyrate and succinate, lactate, or acetate to preserve homeostasis [1,4,59]. This scenario could reflect a bidirectional ability of adaptation between the host’s immune response and bacterial composition. Faecalibacterium prausnitzii and E. rectale are responsible for a major fraction of butyrate production and consequently play a crucial role in shaping the local and peripheral immune system. The emerging evidence of diet-induced changes in SCFA-producing bacteria, as reported by Morrison et al. [60], could suggest a possible contribution of Ivorian eating habits in the modulation of adaptive immunity.
Blastocystis was highly prevalent in our cohort and a non-significant variation of alpha diversity between Blastocystis positive-only group and the control group is evidence of the modest effect that Blastocystis carriage has [61,62]. The lower abundance of Bacteroides in subjects infected with Blastocystis seems to confirm the hypothesis of a minor predisposition to harbor this parasite in “Bacteroides-driven enterotype” subjects, as described for Danish and Spanish individuals by O’Brien Andersen et al. [63], and Mexican subjects by Nieves-Ramirez [64]. In all groups carrying Blastocystis, bacterial genera associated with a healthy status, such as E. rectale and coprostanoligenes groups, Roseburia and Succinivibrio showed a constant presence, although with a reduced relative abundance versus control group [46,65,66,67,68]. These specific OTUs could explain a beneficial influence on normobiosis [61] also in conjunction with a traditional African diet. Considering the genetic diversity within Blastocystis, with at least 17 different subtypes, the possible implications in the pathophysiology of human infections related to the different subtypes should be investigated to better understand the role of this parasite on the human gut microbiota [63,69].
Concerning commensal Entamoeba spp., an increase in alpha diversity in subjects co-harboring Entamoeba spp. and Blastocystis, especially in case of E. hartmanni co-occurrence, was evidenced. Clear separation in Unifrac distance was found and the increase of Succinivibrio, Christensenellaceae R-7 group, Ruminococcaeae UCG-002, Rikenellaceae RC9 intestinal group seem associable with Entamoeba perturbations. Bacterial niches, responsible for beneficial or detrimental associations in subjects positive for Blastocystis alone or co-harbored with commensal Entamoeba spp., should be further investigated [70,71]. The increase in Succinivibrio in people detected positive for E. hartmanni, Blastocystis, and pathogens seems to confirm the data reported from Cameroon by Morton et al. (19) and in Malawian children by Ordiz et al. [72]. These data suggest that recurrent endemic intestinal infections in rural countries [73], together with eating habits [10] could favor, in some groups of African natives compared to African Americans, the conditions for a stable presence of Succinivibrio in the gut microbiota. The low number of subjects harboring G. duodenalis and pathogenic viruses and bacteria precluded the statistical significance in any comparisons. However, an interesting aspect seems to emerge: some protective taxa (e.g., E. rectale group, Roseburia, Christensenellaceae) showed an expansion despite the reduction of Faecalibacterium, as previously reported [46,74,75,76,77,78]. The relative abundances of Bifidobacterium and Faecalibacterium were oppositely related. Subjects containing multiple enteric pathogens, without G. duodenalis and Entamoeba spp., showed a decrease in so-called protective taxa (Bifidobacterium and Faecalibacterium) while the prevalence of Megasphaera increased. This result should be better investigated concerning the potential involvement of Megasphaera in the adaptability of the human gut ecosystem [72,79,80].

5. Conclusions

In conclusion, the co-occurrence of Blastocystis and commensal Entamoeba spp., despite the presence of other enteric pathogens including G. duodenalis, seems to preserve a high diversity, favor different bacterial consortia, and does not compromise the intrinsic ability of intestinal microbiota to restore and/or maintain homeostasis [74,81,82,83,84,85]. However, the beneficial or potential regulatory effect of Blastocystis is reduced in subjects positive for bacterial and viral pathogens without G. duodenalis and commensal Entamoeba spp., probably reducing the entity of symptoms.
Finally, the complex scenario observed in this cohort from Côte d’Ivoire helps to provide an integrated view of human gut microbiota composition. Simultaneous testing of common intestinal pathogens supplies new data from Africa, still underrepresented in the global picture of the gut microbiota, and helps to better understand the balances of intestinal homeostasis.
Future investigations are needed to verify if the influence of rural diet on gut microbiota can play a role in seasonal predisposition to endemic enteritis. It will be very important to extend the understanding of eukaryotic microorganisms’ interactions in the gut microbiota in health status and intestinal infections.

Supplementary Materials

The following are available online at https://www.mdpi.com/article/10.3390/microorganisms9081763/s1, Figure S1A. The plot of top 15 bacterial relative abundances at the Family level in each age group; Table S1A. The top 15 bacterial relative abundances; Figure S2. Beta diversity of Cluster 1 versus Cluster 2 (Denovo clustering); Table S3A. Alpha diversity indices of positive and negative subjects, grouped in <1 year and >1 year; Figure S3. Positive versus negative subjects comparisons: Beta diversity analysis; Table S4A. All microorganisms detected in the 5 symptomatic subjects; Table S4B. Comparison of Blastocistys groups: Alpha diversity index; Table S4C. Comparison of E. hartmanni groups: Alpha diversity index; Table S4D. Comparison of Entamoeba species groups: Alpha diversity index; Table S4E. Comparison of G. duodenalis and other intestinal pathogens positives: Alpha diversity index; Table S5A. Beta diversity analysis for Entamoeba spp. presence; Table S5B. Beta diversity analysis for Entamoeba spp. presence; Table S5C. Comparison of E. hartmanni groups: Beta diversity at genus level; Table S5D. Beta diversity analysis for Entamoeba spp. detection; Table S5E. Beta diversity analysis for Entamoeba spp. presence.

Author Contributions

Conceptualization: R.D., F.B.; data curation: R.D., V.D.C., F.B., M.S., F.F., M.D., A.T.; formal analysis: F.F., A.T., M.D.; funding acquisition: K.A.E., V.D.C.; investigation: R.D., F.B., F.F., V.D.C., M.S., D.D.C., M.W., C.G.; resources: K.A.E., V.D.C., R.K., M.J.G.T.V.; visualization: R.D., V.D.C., F.F., F.B., D.D.C., M.J.G.T.V.; writing—original draft: R.D., V.D.C., F.B.; writing—review and editing: all authors. All authors have read and agreed to the published version of the manuscript.

Funding

The present study was supported by the Koeln Fortune Program of the Faculty of Medicine of the University of Cologne (Germany) to V.D.C.

Institutional Review Board Statement

All procedures performed in this study involving human participants were approved by the Don Orione Center’s Medical Committee (Bonoua, Côte d’Ivoire) and followed the 1975 Helsinki Declaration and its later amendments.

Informed Consent Statement

Adults’ participation was voluntary after providing a verbal agreement on the methods and purposes of sampling. For minors, informed consent was obtained from their parents and guardians. A local dialect interpreter was used to explain the study’s aims, procedures, and significance when necessary. All participants were assured that the human biological sample would provide data exclusively on intestinal microorganisms and not on the human subject. All data were analyzed anonymously.

Data Availability Statement

The dataset associated to this paper can be accessed on https://www.ncbi.nlm.nih.gov/sra/PRJNA741457 (accessed on 15 August 2021).

Acknowledgments

We thank the Associazione Solidarietà Missionaria Onlus with the “Ippocrate Project”, and the Centre Don Orione pour Handicapés Physiques for the sampling support. We thank David Essi for the sampling collaboration. We thank Filippo Martinelli (NUIG—National University of Ireland, Galway) for helpful comments on the manuscript content.

Conflicts of Interest

The authors declare no conflict of interest.

References

  1. Vonaesch, P.; Anderson, M.; Sansonetti, P.J. Pathogens, microbiome and the host: Emergence of the ecological Koch’s postulates. FEMS Microbiol. Rev. 2018, 42, 273–292. [Google Scholar] [CrossRef] [PubMed] [Green Version]
  2. Brandtzaeg, P. The gut as communicator between environment and host: Immunological consequences. Eur. J. Pharmacol. 2011, 668 (Suppl. 1), S16–S32. [Google Scholar] [CrossRef] [PubMed]
  3. Turnbaugh, P.J.; Gordon, J.I. The core gut microbiome, energy balance and obesity. J. Physiol. 2009, 587 Pt 17, 4153–4158. [Google Scholar] [CrossRef]
  4. Lozupone, C.A.; Stombaugh, J.I.; Gordon, J.I.; Jansson, J.K.; Knight, R. Diversity, stability and resilience of the human gut microbiota. Nature 2012, 489, 220–230. [Google Scholar] [CrossRef] [Green Version]
  5. Holmes, E.; Li, J.V.; Marchesi, J.R.; Nicholson, J.K. Gut microbiota composition and activity in relation to host metabolic phenotype and disease risk. Cell Metab. 2012, 16, 559–564. [Google Scholar] [CrossRef] [PubMed] [Green Version]
  6. Cho, I.; Blaser, M.J. The human microbiome: At the interface of health and disease. Nat. Rev. Genet. 2012, 13, 260–270. [Google Scholar] [CrossRef] [Green Version]
  7. Grześkowiak, Ł.; Collado, M.C.; Mangani, C.; Maleta, K.; Laitinen, K.; Ashorn, P.; Isolauri, E.; Salminen, S. Distinct gut microbiota in southeastern African and northern European infants. J. Pediatr. Gastroenterol. Nutr. 2012, 54, 812–816. [Google Scholar] [CrossRef] [PubMed]
  8. Yatsunenko, T.; Rey, F.E.; Manary, M.J.; Trehan, I.; Dominguez-Bello, M.G.; Contreras, M.; Magris, M.; Hidalgo, G.; Baldassano, R.N.; Anokhin, A.P.; et al. Human gut microbiome viewed across age and geography. Nature 2012, 486, 222–227. [Google Scholar] [CrossRef]
  9. Ou, J.; Carbonero, F.; Zoetendal, E.G.; DeLany, J.P.; Wang, M.; Newton, K.; Gaskins, H.R.; O’Keefe, S.J. Diet, microbiota, and microbial metabolites in colon cancer risk in rural Africans and African Americans. Am. J. Clin. Nutr. 2013, 98, 111–120. [Google Scholar] [CrossRef] [Green Version]
  10. Brooks, A.W.; Priya, S.; Blekhman, R.; Bordenstein, S.R. Gut microbiota diversity across ethnicities in the United States. PLoS Biol. 2018, 16, e2006842. [Google Scholar] [CrossRef] [Green Version]
  11. Ayeni, F.A.; Biagi, E.; Rampelli, S.; Fiori, J.; Soverini, M.; Audu, H.J.; Cristino, S.; Caporali, L.; Schnorr, S.L.; Carelli, V.; et al. Infant and Adult Gut Microbiome and Metabolome in Rural Bassa and Urban Settlers from Nigeria. Cell Rep. 2018, 23, 3056–3067. [Google Scholar] [CrossRef] [PubMed]
  12. Samb-Ba, B.; Mazenot, C.; Gassama-Sow, A.; Dubourg, G.; Richet, H.; Hugon, P.; Lagier, J.C.; Raoult, D.; Fenollar, F. MALDI-TOF identification of the human Gut microbiome in people with and without diarrhea in Senegal. PLoS ONE 2014, 9, e87419. [Google Scholar] [CrossRef]
  13. De Filippo, C.; Di Paola, M.; Ramazzotti, M.; Albanese, D.; Pieraccini, G.; Banci, E.; Miglietta, F.; Cavalieri, D.; Lionetti, P. Diet, Environments, and Gut Microbiota. A Preliminary Investigation in Children Living in Rural and Urban Burkina Faso and Italy. Front. Microbiol. 2017, 8, 1979. [Google Scholar] [CrossRef] [PubMed] [Green Version]
  14. Afolayan, A.O.; Ayeni, F.A.; Moissl-Eichinger, C.; Gorkiewicz, G.; Halwachs, B.; Högenauer, C. Impact of a Nomadic Pastoral Lifestyle on the Gut Microbiome in the Fulani Living in Nigeria. Front. Microbiol. 2019, 10, 2138. [Google Scholar] [CrossRef]
  15. Kuss, S.K.; Best, G.T.; Etheredge, C.A.; Pruijssers, A.J.; Frierson, J.M.; Hooper, L.V.; Dermody, T.S.; Pfeiffer, J.K. Intestinal microbiota promote enteric virus replication and systemic pathogenesis. Science 2011, 334, 249–252. [Google Scholar] [CrossRef] [Green Version]
  16. Iebba, V.; Santangelo, F.; Totino, V.; Pantanella, F.; Monsia, A.; Di Cristanziano, V.; Di Cave, D.; Schippa, S.; Berrilli, F.; D’Alfonso, R. Gut microbiota related to Giardia duodenalis, Entamoeba spp. and Blastocystis hominis infections in humans from Côte d’Ivoire. J. Infect. Dev. Ctries 2016, 10, 1035–1041. [Google Scholar] [CrossRef] [Green Version]
  17. Lukeš, J.; Stensvold, C.R.; Jirků-Pomajbíková, K.; Wegener Parfrey, L. Are Human Intestinal Eukaryotes Beneficial or Commensals? PLoS Pathog. 2015, 11, e1005039. [Google Scholar] [CrossRef] [PubMed] [Green Version]
  18. Popovic, A.; Bourdon, C.; Wang, P.W.; Guttman, D.S.; Voskuijl, W.; Grigg, M.E.; Bandsma, R.H.J.; Parkinson, J. Design and application of a novel two-amplicon approach for defining eukaryotic microbiota. Microbiome 2018, 6, 228. [Google Scholar] [CrossRef] [Green Version]
  19. Morton, E.R.; Lynch, J.; Froment, A.; Lafosse, S.; Heyer, E.; Przeworski, M.; Blekhman, R.; Ségurel, L. Variation in Rural African Gut Microbiota Is Strongly Correlated with Colonization by Entamoeba and Subsistence. PLoS Genet. 2015, 11, e1005658. [Google Scholar] [CrossRef] [PubMed] [Green Version]
  20. Audebert, C.; Even, G.; Cian, A.; Loywick, A.; Merlin, S.; Viscogliosi, E.; Chabé, M. Colonization with the enteric protozoa Blastocystis is associated with increased diversity of human gut bacterial microbiota. Sci. Rep. 2016, 6, 25255. [Google Scholar] [CrossRef]
  21. Gilchrist, C.A.; Petri, S.E.; Schneider, B.N.; Reichman, D.J.; Jiang, N.; Begum, S.; Watanabe, K.; Jansen, C.S.; Elliott, K.P.; Burgess, S.L.; et al. Role of the Gut Microbiota of Children in Diarrhea Due to the Protozoan Parasite Entamoeba histolytica. J. Infect. Dis. 2016, 213, 1579–1585. [Google Scholar] [CrossRef] [PubMed] [Green Version]
  22. Ngure, F.M.; Reid, B.M.; Humphrey, J.H.; Mbuya, M.N.; Pelto, G.; Stoltzfus, R.J. Water, sanitation, and hygiene (WASH), environmental enteropathy, nutrition, and early child development: Making the links. Ann. N. Y. Acad. Sci. 2014, 1308, 118–128. [Google Scholar] [CrossRef]
  23. Di Cristanziano, V.; Timmen-Wego, M.; Lübke, N.; Kaiser, R.; Pfister, H.; Di Cave, D.; Berrilli, F.; Kaboré, Y.; D’Alfonso, R. Application of Luminex Gastrointestinal Pathogen Panel to human stool samples from Côte d’Ivoire. J. Infect. Dev. Ctries 2015, 9, 884–889. [Google Scholar] [CrossRef] [Green Version]
  24. Cristanziano, V.D.; Bottcher, S.; Diedrich, S.; Timmen-Wego, M.; Knops, E.; Lübke, N.; Kaiser, R.; Pfister, H.; Kaboré, Y.; D’Alfonso, R. Detection and characterization of enteroviruses and parechoviruses in healthy people living in the South of Cote d’Ivoire. J. Clin. Virol. 2015, 71, 40–43. [Google Scholar] [CrossRef]
  25. Souppart, L.; Sanciu, G.; Cian, A.; Wawrzyniak, I.; Delbac, F.; Capron, M.; Dei-Cas, E.; Boorom, K.; Delhaes, L.; Viscogliosi, E. Molecular epidemiology of human Blastocystis isolates in France. Parasitol. Res. 2009, 105, 413–421. [Google Scholar] [CrossRef] [PubMed]
  26. D’Alfonso, R.; Santoro, M.; Essi, D.; Monsia, A.; Kaboré, Y.; Glé, C.; Di Cave, D.; Sorge, R.P.; Di Cristanziano, V.; Berrilli, F. Blastocystis in Côte d’Ivoire: Molecular identification and epidemiological data. Eur. J. Clin. Microbiol. Infect. Dis. 2017, 36, 2243–2250. [Google Scholar] [CrossRef] [PubMed]
  27. Santos, H.L.; Bandea, R.; Martins, L.A.; de Macedo, H.W.; Peralta, R.H.; Peralta, J.M.; Ndubuisi, M.I.; da Silva, A.J. Differential identification of Entamoeba spp. based on the analysis of 18S rRNA. Parasitol. Res. 2010, 106, 883–888. [Google Scholar] [CrossRef]
  28. Klindworth, A.; Pruesse, E.; Schweer, T.; Peplies, J.; Quast, C.; Horn, M.; Glöckner, F.O. Evaluation of general 16S ribosomal RNA gene PCR primers for classical and next-generation sequencing-based diversity studies. Nucleic Acids Res. 2013, 41, e1. [Google Scholar] [CrossRef] [PubMed]
  29. Pedregosa, F.; Varoquaux, G.; Gramfort, A.; Michel, V.; Bertrand, T.; Grisel, O.; Blondel, M.; Prettenhofer, P.; Weiss, R.; Dubourg, V.; et al. Scikit-learn: Machine Learning in Python. J. Mach. Learn. Res. 2011, 12, 2825–2830. [Google Scholar]
  30. Quast, C.; Pruesse, E.; Yilmaz, P.; Gerken, J.; Schweer, T.; Yarza, P.; Peplies, J.; Glöckner, F.O. The SILVA ribosomal RNA gene database project: Improved data processing and web-based tools. Nucleic Acids Res. 2013, 41, D590–D596. [Google Scholar] [CrossRef]
  31. RC Team. R: A Language and Environment for Statistical Computing; R Foundation for Statistical Computing: Vienna, Austria, 2018; Available online: https://www.R-project.org/ (accessed on 10 February 2015).
  32. McMurdie, P.J.; Holmes, S. phyloseq: An R package for reproducible interactive analysis and graphics of microbiome census data. PLoS ONE 2013, 8, e61217. [Google Scholar] [CrossRef] [Green Version]
  33. Segata, N.; Izard, J.; Waldron, L.; Gevers, D.; Miropolsky, L.; Garrett, W.S.; Huttenhower, C. Metagenomic biomarker discovery and explanation. Genome Biol. 2011, 12, R60. [Google Scholar] [CrossRef] [Green Version]
  34. Wu, G.D.; Chen, J.; Hoffmann, C.; Bittinger, K.; Chen, Y.Y.; Keilbaugh, S.A.; Bewtra, M.; Knights, D.; Walters, W.A.; Knight, R.; et al. Linking long-term dietary patterns with gut microbial enterotypes. Science 2011, 334, 105–108. [Google Scholar] [CrossRef] [Green Version]
  35. Brewster, R.; Tamburini, F.B.; Asiimwe, E.; Oduaran, O.; Hazelhurst, S.; Bhatt, A.S. Surveying Gut Microbiome Research in Africans: Toward Improved Diversity and Representation. Trends Microbiol. 2019, 27, 824–835. [Google Scholar] [CrossRef] [PubMed]
  36. Korpe, P.S.; Petri, W.A. Environmental enteropathy: Critical implications of a poorly understood condition. Trends Mol. Med. 2012, 18, 328–336. [Google Scholar] [CrossRef] [Green Version]
  37. Stecher, B. The Roles of Inflammation, Nutrient Availability and the Commensal Microbiota in Enteric Pathogen Infection. Microbiol. Spectr. 2015, 3. [Google Scholar] [CrossRef]
  38. Gorvitovskaia, A.; Holmes, S.P.; Huse, S.M. Interpreting Prevotella and Bacteroides as biomarkers of diet and lifestyle. Microbiome 2016, 4, 15. [Google Scholar] [CrossRef] [PubMed] [Green Version]
  39. Huse, S.M.; Ye, Y.; Zhou, Y.; Fodor, A.A. A core human microbiome as viewed through 16S rRNA sequence clusters. PLoS ONE 2012, 7, e34242. [Google Scholar] [CrossRef] [PubMed] [Green Version]
  40. Cheng, M.; Ning, K. Stereotypes about Enterotype: The Old and New Ideas. Genom. Proteom. Bioinform. 2019, 17, 4–12. [Google Scholar] [CrossRef] [PubMed]
  41. Harris, E.V.; de Roode, J.C.; Gerardo, N.M. Diet-microbiome-disease: Investigating diet’s influence on infectious disease resistance through alteration of the gut microbiome. PLoS Pathog. 2019, 15, e1007891. [Google Scholar] [CrossRef]
  42. Gupta, V.K.; Paul, S.; Dutta, C. Geography, Ethnicity or Subsistence-Specific Variations in Human Microbiome Composition and Diversity. Front. Microbiol. 2017, 8, 1162. [Google Scholar] [CrossRef] [PubMed] [Green Version]
  43. Labbé, A.; Ganopolsky, J.G.; Martoni, C.J.; Prakash, S.; Jones, M.L. Bacterial bile metabolising gene abundance in Crohn’s, ulcerative colitis and type 2 diabetes metagenomes. PLoS ONE 2014, 9, e115175. [Google Scholar] [CrossRef] [PubMed]
  44. Moya, A.; Ferrer, M. Functional Redundancy-Induced Stability of Gut Microbiota Subjected to Disturbance. Trends Microbiol. 2016, 24, 402–413. [Google Scholar] [CrossRef]
  45. Livanos, A.E.; Snider, E.J.; Whittier, S.; Chong, D.H.; Wang, T.C.; Abrams, J.A.; Freedberg, D.E. Rapid gastrointestinal loss of Clostridial Clusters IV and XIVa in the ICU associates with an expansion of gut pathogens. PLoS ONE 2018, 13, e0200322. [Google Scholar]
  46. Roberfroid, M.; Gibson, G.R.; Hoyles, L.; McCartney, A.L.; Rastall, R.; Rowland, I.; Wolvers, D.; Watzl, B.; Szajewska, H.; Stahl, B.; et al. Prebiotic effects: Metabolic and health benefits. Br. J. Nutr. 2010, 104 (Suppl. 2), S1–S63. [Google Scholar] [CrossRef] [PubMed] [Green Version]
  47. Lopetuso, L.R.; Scaldaferri, F.; Petito, V.; Gasbarrini, A. Commensal Clostridia: Leading players in the maintenance of gut homeostasis. Gut Pathog. 2013, 5, 23. [Google Scholar] [CrossRef] [Green Version]
  48. Jalanka, J.; Major, G.; Murray, K.; Singh, G.; Nowak, A.; Kurtz, C.; Silos-Santiago, I.; Johnston, J.M.; de Vos, W.M.; Spiller, R. The Effect of Psyllium Husk on Intestinal Microbiota in Constipated Patients and Healthy Controls. Int. J. Mol. Sci. 2019, 20, 433. [Google Scholar] [CrossRef] [Green Version]
  49. de la Cuesta-Zuluaga, J.; Kelley, S.T.; Chen, Y.; Escobar, J.S.; Mueller, N.T.; Ley, R.E.; McDonald, D.; Huang, S.; Swafford, A.D.; Knight, R.; et al. Age- and Sex-Dependent Patterns of Gut Microbial Diversity in Human Adults. mSystems 2019, 4, e00261-19. [Google Scholar] [CrossRef] [Green Version]
  50. Takagi, T.; Naito, Y.; Inoue, R.; Kashiwagi, S.; Uchiyama, K.; Mizushima, K.; Tsuchiya, S.; Dohi, O.; Yoshida, N.; Kamada, K.; et al. Differences in gut microbiota associated with age, sex, and stool consistency in healthy Japanese subjects. J. Gastroenterol. 2019, 54, 53–63. [Google Scholar] [CrossRef]
  51. Ouattara, M.; N’guéssan, N.A.; Yapi, A.; N’goran, E.K. Prevalence and spatial distribution of Entamoeba histolytica/dispar and Giardia lamblia among schoolchildren in Agboville area (Côte d’Ivoire). PLoS Negl. Trop. Dis. 2010, 4, e574. [Google Scholar] [CrossRef]
  52. Kotloff, K.L.; Nataro, J.P.; Blackwelder, W.C.; Nasrin, D.; Farag, T.H.; Panchalingam, S.; Wu, Y.; Sow, S.O.; Sur, D.; Breiman, R.F.; et al. Burden and aetiology of diarrhoeal disease in infants and young children in developing countries (the Global Enteric Multicenter Study, GEMS): A prospective, case-control study. Lancet 2013, 382, 209–222. [Google Scholar] [CrossRef]
  53. El Safadi, D.; Gaayeb, L.; Meloni, D.; Cian, A.; Poirier, P.; Wawrzyniak, I.; Delbac, F.; Dabboussi, F.; Delhaes, L.; Seck, M.; et al. Children of Senegal River Basin show the highest prevalence of Blastocystis sp. ever observed worldwide. BMC Infect. Dis. 2014, 14, 164. [Google Scholar] [CrossRef]
  54. Lokmer, A.; Cian, A.; Froment, A.; Gantois, N.; Viscogliosi, E.; Chabé, M.; Ségurel, L. Use of shotgun metagenomics for the identification of protozoa in the gut microbiota of healthy individuals from worldwide populations with various industrialization levels. PLoS ONE 2019, 14, e0211139. [Google Scholar] [CrossRef] [PubMed]
  55. Berrilli, F.; D’Alfonso, R.; Giangaspero, A.; Marangi, M.; Brandonisio, O.; Kaboré, Y.; Glé, C.; Cianfanelli, C.; Lauro, R.; Di Cave, D. Giardia duodenalis genotypes and Cryptosporidium species in humans and domestic animals in Cote d’Ivoire: Occurrence and evidence for environmental contamination. Trans. R Soc. Trop. Med. Hyg. 2012, 106, 191–195. [Google Scholar] [CrossRef] [PubMed]
  56. Honda, K.; Littman, D.R. The microbiome in infectious disease and inflammation. Annu. Rev. Immunol. 2012, 30, 759–795. [Google Scholar] [CrossRef] [PubMed] [Green Version]
  57. Muhsen, K.; Levine, M.M. A systematic review and meta-analysis of the association between Giardia lamblia and endemic pediatric diarrhea in developing countries. Clin. Infect. Dis. 2012, 55 (Suppl. 4), S271–S293. [Google Scholar] [CrossRef]
  58. Berrilli, F.; Di Cave, D.; N’Guessan, R.; Kaboré, Y.; Giangaspero, A.; Sorge, R.P.; D’Alfonso, R. Social determinants associated with Giardia duodenalis infection in southern Côte d’Ivoire. Eur. J. Clin. Microbiol. Infect. Dis. 2014, 33, 1799–1802. [Google Scholar] [CrossRef]
  59. Graziani, C.; Talocco, C.; De Sire, R.; Petito, V.; Lopetuso, L.R.; Gervasoni, J.; Persichilli, S.; Franceschi, F.; Ojetti, V.; Gasbarrini, A.; et al. Intestinal permeability in physiological and pathological conditions: Major determinants and assessment modalities. Eur. Rev. Med. Pharmacol. Sci. 2019, 23, 795–810. [Google Scholar] [PubMed]
  60. Morrison, D.J.; Preston, T. Formation of short chain fatty acids by the gut microbiota and their impact on human metabolism. Gut Microbes 2016, 7, 189–200. [Google Scholar] [CrossRef] [PubMed] [Green Version]
  61. Chen, T.L.; Chan, C.C.; Chen, H.P.; Fung, C.P.; Lin, C.P.; Chan, W.L.; Liu, C.Y. Clinical characteristics and endoscopic findings associated with Blastocystis hominis in healthy adults. Am. J. Trop. Med. Hyg. 2003, 69, 213–216. [Google Scholar] [CrossRef] [Green Version]
  62. Scanlan, P.D.; Stensvold, C.R.; Rajilić-Stojanović, M.; Heilig, H.G.; De Vos, W.M.; O’Toole, P.W.; Cotter, P.D. The microbial eukaryote Blastocystis is a prevalent and diverse member of the healthy human gut microbiota. FEMS Microbiol. Ecol. 2014, 90, 326–330. [Google Scholar] [CrossRef] [PubMed] [Green Version]
  63. Andersen, L.O.; Bonde, I.; Nielsen, H.B.; Stensvold, C.R. A retrospective metagenomics approach to studying Blastocystis. FEMS Microbiol. Ecol. 2015, 91. [Google Scholar] [CrossRef] [PubMed] [Green Version]
  64. Nieves-Ramírez, M.E.; Partida-Rodríguez, O.; Laforest-Lapointe, I.; Reynolds, L.A.; Brown, E.M.; Valdez-Salazar, A.; Morán-Silva, P.; Rojas-Velázquez, L.; Morien, E.; Parfrey, L.W.; et al. Asymptomatic Intestinal Colonization with Protist Blastocystis is Strongly Associated with Distinct Microbiome Ecological Patterns. mSystems 2018, 3, e00007-18. [Google Scholar] [CrossRef] [Green Version]
  65. Nicholson, J.K.; Holmes, E.; Kinross, J.; Burcelin, R.; Gibson, G.; Jia, W.; Pettersson, S. Host-gut microbiota metabolic interactions. Science 2012, 336, 1262–1267. [Google Scholar] [CrossRef] [Green Version]
  66. Gérard, P. Metabolism of cholesterol and bile acids by the gut microbiota. Pathogens 2013, 3, 14–24. [Google Scholar] [CrossRef] [Green Version]
  67. Basson, A.; Trotter, A.; Rodriguez-Palacios, A.; Cominelli, F. Mucosal Interactions between Genetics, Diet, and Microbiome in Inflammatory Bowel Disease. Front. Immunol. 2016, 7, 290. [Google Scholar] [CrossRef] [Green Version]
  68. Rampelli, S.; Candela, M.; Turroni, S.; Biagi, E.; Pflueger, M.; Wolters, M.; Ahrens, W.; Brigidi, P. Microbiota and lifestyle interactions through the lifespan. Trends Food Sci. Technol. 2016, 57, 265–272. [Google Scholar] [CrossRef]
  69. Tito, R.Y.; Chaffron, S.; Caenepeel, C.; Lima-Mendez, G.; Wang, J.; Vieira-Silva, S.; Falony, G.; Hildebrand, F.; Darzi, Y.; Rymenans, L.; et al. Population-level analysis of Blastocystis subtype prevalence and variation in the human gut microbiota. Gut 2019, 68, 1180–1189. [Google Scholar] [CrossRef] [Green Version]
  70. Faith, D.P. Phylogenetic Diversity and Conservation Evaluation: Perspectives on Multiple Values, Indices, and Scales of Application. In Phylogenetic Diversity: Applications and Challenges in Biodiversity Science; Scherson, R.A., Faith, D.P., Eds.; Springer International Publishing: Cham, Switzerland, 2018; pp. 1–26. [Google Scholar]
  71. Tsolis, R.M.; Bäumler, A.J. Gastrointestinal host-pathogen interaction in the age of microbiome research. Curr. Opin. Microbiol. 2020, 53, 78–89. [Google Scholar] [CrossRef] [PubMed]
  72. Ordiz, M.I.; Stephenson, K.; Agapova, S.; Wylie, K.M.; Maleta, K.; Martin, J.; Trehan, I.; Tarr, P.I.; Manary, M.J. Environmental Enteric Dysfunction and the Fecal Microbiota in Malawian Children. Am. J. Trop. Med. Hyg. 2017, 96, 473–476. [Google Scholar] [CrossRef] [PubMed] [Green Version]
  73. Jha, A.R.; Davenport, E.R.; Gautam, Y.; Bhandari, D.; Tandukar, S.; Ng, K.M.; Fragiadakis, G.K.; Holmes, S.; Gautam, G.P.; Leach, J.; et al. Gut microbiome transition across a lifestyle gradient in Himalaya. PLoS Biol. 2018, 16, e2005396. [Google Scholar] [CrossRef] [PubMed] [Green Version]
  74. Balamurugan, R.; Janardhan, H.P.; George, S.; Raghava, M.V.; Muliyil, J.; Ramakrishna, B.S. Molecular studies of fecal anaerobic commensal bacteria in acute diarrhea in children. J. Pediatr. Gastroenterol. Nutr. 2008, 46, 514–519. [Google Scholar] [CrossRef]
  75. Ubeda, C.; Djukovic, A.; Isaac, S. Roles of the intestinal microbiota in pathogen protection. Clin. Transl. Immunol. 2017, 6, e128. [Google Scholar] [CrossRef] [PubMed]
  76. Menon, R.; Ramanan, V.; Korolev, K.S. Interactions between species introduce spurious associations in microbiome studies. PLoS Comput. Biol. 2018, 14, e1005939. [Google Scholar] [CrossRef] [PubMed] [Green Version]
  77. Domínguez-Díaz, C.; García-Orozco, A.; Riera-Leal, A.; Padilla-Arellano, J.R.; Fafutis-Morris, M. Microbiota and Its Role on Viral Evasion: Is It With Us or Against Us? Front. Cell Infect. Microbiol. 2019, 9, 256. [Google Scholar] [CrossRef] [PubMed] [Green Version]
  78. Rinninella, E.; Raoul, P.; Cintoni, M.; Franceschi, F.; Miggiano, G.A.D.; Gasbarrini, A.; Mele, M.C. What is the Healthy Gut Microbiota Composition? A Changing Ecosystem across Age, Environment, Diet, and Diseases. Microorganisms 2019, 7, 14. [Google Scholar] [CrossRef] [Green Version]
  79. Shetty, S.A.; Marathe, N.P.; Lanjekar, V.; Ranade, D.; Shouche, Y.S. Comparative genome analysis of Megasphaera sp. reveals niche specialization and its potential role in the human gut. PLoS ONE 2013, 8, e79353. [Google Scholar] [CrossRef] [PubMed] [Green Version]
  80. Yun, Y.; Chang, Y.; Kim, H.N.; Ryu, S.; Kwon, M.J.; Cho, Y.K.; Kim, H.L.; Cheong, H.S.; Joo, E.J. Alterations of the Gut Microbiome in Chronic Hepatitis B Virus Infection Associated with Alanine Aminotransferase Level. J. Clin. Med. 2019, 8, 173. [Google Scholar] [CrossRef] [PubMed] [Green Version]
  81. Chabé, M.; Lokmer, A.; Ségurel, L. Gut Protozoa: Friends or Foes of the Human Gut Microbiota? Trends Parasitol. 2017, 33, 925–934. [Google Scholar] [CrossRef]
  82. Marie, C.; Petri, W.A. Regulation of virulence of Entamoeba histolytica. Annu. Rev. Microbiol. 2014, 68, 493–520. [Google Scholar] [CrossRef]
  83. Wilson, I.W.; Weedall, G.D.; Hall, N. Host-Parasite interactions in Entamoeba histolytica and Entamoeba dispar: What have we learned from their genomes? Parasite Immunol. 2012, 34, 90–99. [Google Scholar] [CrossRef] [PubMed] [Green Version]
  84. Serrano-Luna, J.; Piña-Vázquez, C.; Reyes-López, M.; Ortiz-Estrada, G.; de la Garza, M. Proteases from Entamoeba spp. and Pathogenic Free-Living Amoebae as Virulence Factors. J. Trop. Med. 2013, 2013, 890603. [Google Scholar] [CrossRef] [PubMed] [Green Version]
  85. Leon-Coria, A.; Kumar, M.; Chadee, K. The delicate balance between. Gut Microbes 2020, 11, 118–125. [Google Scholar] [CrossRef] [PubMed]
Figure 1. Differences between age groups. (A): UniFrac distances among infants and other age groups. The samples were visualized using principal coordinate analysis (PCoA). Differences with other age groups are statistically significant. (B): The plot of top 15 relative bacterial abundances at genus level. The statistical significances are shown in Table S1A.
Microorganisms 09 01763 g001
Figure 2. The plot of top 15 relative bacterial abundances at genus level. The subjects were distinguished by sex and age.
Microorganisms 09 01763 g002
Figure 3. The plot of top 15 relative bacterial abundances. (A): the family level. (B): the genus level. The groups were based on the season of collection: the heavy dry season (HDS), heavy rainy season (HRS), and the low rainy season (LRS).
Microorganisms 09 01763 g003
Figure 4. The UniFrac distances between enteric pathogen positive versus enteric pathogen negative subjects is displayed by age groups, using principal coordinate analysis (PCoA). The infant group tends to separate out according to Axis 1 (7.6%) and Axis 2 component (7%). The differences of the infant group from other age groups as shown in Figure 1, are also confirmed for comparisons of enteric pathogen negative versus enteric pathogen positive subjects.
Microorganisms 09 01763 g004
Figure 5. Beta diversity analysis in presence of Blastocystis. Group1: control group; Group 2: positive only for Blastocystis; Group 3: positive for Blastocystis and Entamoeba spp.; Group 4a: positive for Blastocystis and pathogenic virus and bacteria; Group 4b: positive for Blastocystis and Entamoeba spp. and pathogenic virus and bacteria; Group 5b: positive for Blastocystis and Entamoeba spp. and G. duodenalis and pathogenic virus, and bacteria. (A) The UniFrac distances among groups, using principal coordinate analysis (PCoA). UniFrac showed low divergences along Axis 1 (8,6%) between people carrying Blastocystis and Entamoeba spp. (Groups 3, 4b, 5b) compared to the negative subjects (Group 1) and subjects carrying Blastocystis but not Entamoeba spp. (Groups 2 and 4a). (B) The plot of top 15 relative bacterial abundances at the genus level.
Microorganisms 09 01763 g005
Figure 6. Beta diversity analysis in presence of Entamoeba spp. (A) The UniFrac distances between negative and positive subjects for Entamoeba spp., using principal coordinate analysis (PCoA) (B) The UniFrac distances among negative group, subjects harboring E. hartmanni and Blastocystis, and subjects harboring E. hartmanni, Blastocystis, and other pathogens, using principal coordinate analysis (PCoA). Group 1E: control group; Group: 2E: positive for pathogens not including Entamoeba spp.; Group 3E: subjects positive for En. coli and other pathogens; Group 4E: subjects positive for E. dispar and other pathogens; Group 5E: subjects positive for E. hartmanni and other pathogens. (C) The UniFrac distances among Group 1E, 2E, 3E, 4E, and 5E using principal coordinate analysis (PCoA). The groups carrying En. coli, E. dispar, and E. hartmanni (Groups 3E, 4E, and 5E), clearly were separated from groups not harboring Entamoeba species (Groups 1E and 2E). (D) The plot of top 15 relative bacterial abundances at the genus level. All the significances relating to (AD) are summarized in Table S5D.
Microorganisms 09 01763 g006
Figure 7. Beta diversity analysis for the subjects positive for G. duodenalis and other intestinal pathogens. Groups A: control group; Groups C: positive for Blastocystis only; Groups D: positive for Blastocystis and E. hartmanni without other pathogens; Groups E1: positive for E. hartmanni, Blastocystis and G. duodenalis, and pathogenic bacteria and viruses; Groups E2: positive for En. coli, Blastocystis and G. duodenalis, and pathogenic bacteria and viruses; Groups E3: positive for Blastocystis, G. duodenalis, and pathogenic bacteria and viruses; Groups M: positive for Blastocystis and mixed infection of pathogenic bacteria and viruses, without G. duodenalis and Entamoeba spp. (A) PCoA UniFrac showing low divergences along Axis 1 (9,3%) between positives with Blastocystis and E. hartmanni without pathogens (Group D) and Groups E1 and E2 including positives for G. duodenalis and other intestinal microorganisms. (B) Histogram of the linear discriminant analysis (LDA scores indicate the higher difference between clades of A, C, E1, and E2 groups. (C) The plot of top 15 relative bacterial abundances at the family level. (D) The plot of top 15 relative bacterial abundances at the genus level.
Microorganisms 09 01763 g007
Table 1. Demographic characteristics of enrolled individuals.
Age Groups<1 year>1–5 years6–17 years>18 yearsTotal
Localitiesn
F/M
Median
min–max
n
F/M
Median
min–max
n
F/M
Median
min–max
n
F/M
Median
min–max
n
F/M
Median
min–max
Bonoua8
2/6
0.1
0.02–0.5
10
6/4
4.5
2–5
20
10/10
11.5
8–17
15
7/8
30
18–59
53
25/28
11
0.02–59
Assouindé1
1/0
0.75--3
2/1
11
11–15
--4
3/1
11
0.75–15
Kimokro--1
0/1
2.55
2/3
8
6–10
--6
2/4
7.5
2.5–10
Yaou--5
3/2
5
4–5
8
3/5
6.5
6–13
--13
6/7
6
4–13
Total9
3/6
0.1
0.1–0.7
16
9/7
4.5
1.8–5
36
17/19
10
6–17
15
7/8
0.1
0.1–05
76
36/40
9
0.02–59
Table 2. Summary of detected bacterial and viral pathogens.
Viruses and BacteriaPositive Samples n (F/M)Mean Age (min–max)Detected Pathogens (n)
Adenovirus
(AdV)
17 (9/8)13.5 (0.25–59)EV (2); NoV (2); ETEC (3); Campylobacter (1)
Parechovirus (PeV)4 (1/3)5.4 (0.1–14)EV (2); NoV (1); Campylobacter (1)
Enterovirus
(EV)
14 (5/9)6.5 (0.1–14)PeV (2); AdV (3); NoV(3); Campylobacter (2); ETEC (4)
Norovirus G1/G2 (NoV)8 (3/5)12.7 (0.1–39)EV (3); AdV (2); PeV (1); RoV (1)
Rotavirus A
(RoV)
1 (1/0)39RoV (1)
Campylobacter5 (3/2)6.3 (9.75–9)E.coli O157 (1); ETEC (1); STEC (1); Shigella (1); EV (2); PeV (1); AdV (1)
E.coli O157 4 (2/2)11 (17–8)ETEC (3); STEC (1); Campylobacter (1); Shigella (1); EV (2); PeV (1); AdV (1)
ETEC 10 (6/4)7 (1.8–17)E.coli O157 (3); STEC (2); Campylobacter (3); Shigella (2); EV (4); AdV (3)
Salmonella1 (0/1)43-
STEC2 (1/1)9 (9)E.coli O157 (1); ETEC (2); Campylobacter (1)
Shigella4 (3/1)11.7 (0.75–24)E.coli O157 (1); ETEC (2); Campylobacter (1); PeV (1)
ETEC: enterotoxigenic E. coli, STEC: Shiga-like toxin producing E. coli.
Table 3. Protozoa distribution based on age and localities.
E. hartmanniEn. coliE. disparBlastocystisG. duodenalis
LocalitiesSexAgeSexAgeSexAgeSexAgeSexAge
n (F/M)Mean
(min–max)
n (F/M)Mean
(min–max)
n (F/M)Mean
(min–max)
n (F/M)Mean
(min–max)
n (F/M)Mean
(min–max)
Bonoua16
(6/10)
21
(9–50)
2
(2F)
3
(2–4)
1
(1F)
528 (17/11)22
(9–59)
8 *
(6/2)
17
(2–50)
Assouindé1
(1F)
11----3
(2/1)
12
(11–15)
3
(2/1)
12
(11–15)
Kimoukro1
(1M)
63
(1/2)
7
(2–10)
--4
(2/2)
8
(6–10)
7
(2–10)
8
(4/4)
Yaou2
(2F)
5
(4–6)
6
(4/2)
6
(5–7)
1
(1M)
512
(6/6)
6
(4–13)
8
(4/4)
5
(4–7)
Total20
(9/11)
18
(4–50)
11
(7/4)
12
(2–59)
2
(1/1)
547
(27/20)
14
(4–59)
24
(14/10)
11
(2–50)
* One-month child was detected positive for G. duodenalis.
Table 4. Alpha diversity indices in the age groups.
Age Groups (n)<1 year (9)
Median
(min–max)
1–5 years (16)
Median
(min–max)
6–17 years (36)
Median
(min–max)
>18 years (15)
Median
(min–max)
Alpha Diversity
Shannon index1.703
(0.6059–3.019)
3.411
(2.2730–4.131) c
3.703
(2.1940–4.962) a
3.631
(1.5140–4.589) c
Observed OTUs39.00
(19.00–86.00)
151.00
(79.00–258.00) b
189.00
(94.00–459.00) a
177.00
(82.00–305.00) a
Faith’s phylogenetic diversity4.601
(0.9572–12.04)
12.850
(7.2710–20.82) c
16.560
(7.3410–34.15) a
17.540
(8.4570–25.67) a
Chao1 index39.50
(19.00–95.07)
189.50
(98.60–313.30) b
228.20
(105.50–610.00) a
231.00
(100.40–406.90) b
ap < 0.001, b p < 0.01, c p < 0.05 versus <1 year.
Publisher’s Note: MDPI stays neutral with regard to jurisdictional claims in published maps and institutional affiliations.

