Article

Inhibition of Primary Photosynthesis in Desiccating Antarctic Lichens Differing in Their Photobionts, Thallus Morphology, and Spectral Properties

1
Department of Experimental Biology, Faculty of Science, Masaryk University, Kamenice 5, Building A13/119, 625 00 Brno, Czech Republic
2
Laboratory of Plant Ecophysiology, Faculty of Natural Resources, Campus Luis Rivas del Canto, Catholic University of Temuco, Rudecindo Ortega #03694, 4780000 Temuco, Chile
3
Laboratory of Mycology and Mycorrhiza, Faculty of Natural Sciences and Oceanography, Campus Concepción, Concepción University, 4030000 Concepción, Chile
*
Author to whom correspondence should be addressed.
Microorganisms 2021, 9(4), 818; https://doi.org/10.3390/microorganisms9040818
Submission received: 1 February 2021 / Revised: 2 April 2021 / Accepted: 7 April 2021 / Published: 13 April 2021
(This article belongs to the Special Issue Lichen Functional Traits and Ecosystem Functions)

Abstract

:
Five macrolichens of different thallus morphology from Antarctica (King George Island) were used for this ecophysiological study. The effect of thallus desiccation on primary photosynthetic processes was examined. We investigated the lichens’ responses to the relative water content (RWC) in their thalli during the transition from a wet (RWC of 100%) to a dry state (RWC of 0%). The slow Kautsky kinetics of chlorophyll fluorescence (ChlF) that was recorded during controlled dehydration (RWC decreased from 100 to 0%) and supplemented with a quenching analysis revealed a polyphasic species-specific response of variable fluorescence. The changes in ChlF at a steady state (Fs), potential and effective quantum yields of photosystem II (FV/FM, ΦPSII), and nonphotochemical quenching (NPQ) reflected a desiccation-induced inhibition of the photosynthetic processes. The dehydration-dependent fall in FV/FM and ΦPSII was species-specific, starting at an RWC range of 22–32%. The critical RWC for ΦPSII was below 5%. The changes indicated the involvement of protective mechanisms in the chloroplastic apparatus of lichen photobionts at RWCs of below 20%. In both the wet and dry states, the spectral reflectance curves (SRC) (wavelength 400–800 nm) and indices (NDVI, PRI) of the studied lichen species were measured. Black Himantormia lugubris showed no difference in the SRCs between wet and dry state. Other lichens showed a higher reflectance in the dry state compared to the wet state. The lichen morphology and anatomy data, together with the ChlF and spectral reflectance data, are discussed in relation to its potential for ecophysiological studies in Antarctic lichens.

1. Introduction

The lichen biota of the Antarctic continent dominates the polar tundra with more than 350 species distributed throughout the few small ice-free areas [1,2]. Temperature and water are the two principal factors limiting the distribution of living organisms in Antarctica [3]. Both lichens and mosses penetrate further into the discontinuous small ice-free microsites that offer colonizable substrates, reaching almost 86 °S in the case of lichens [4]. Although almost the entire distribution is modeled based on the temperatures that make life feasible, little is known about the role of water in survival on the frozen continent. However, for microenvironments, it has been reported that beyond 72 °S, the most determining factors of diversity are the length of the active period and the available water, which is closely linked to temperature [5]. Various studies have shown that lichens are resistant to low temperatures and present positive photosynthesis at temperatures close to 0 °C [6]. However, it has also been recorded that the optimum temperature for net photosynthesis for several lichens is between 5–15 °C [7]. Furthermore, it is expected that, as global warming progresses, these organisms will be affected by the increase in temperature [8], which in Antarctica is as high as approximately 3 °C, although this varies throughout the continent. On the other hand, the majority of Antarctic lichens are saxicolous because rocks and stones are the most available substrate on the Antarctic continent; therefore, the water content variations to which they are exposed are greater because the rocks do not retain water. In this context, although their response to temperatures is well known, less is known about the response of Antarctic lichens to a lack of water in the field. Lichens are poikilohydric organisms that obtain water from atmospheric humidity or from rain. In Antarctica, where it rarely rains, water is mostly available in liquid form from the water runoff from snowbanks and glaciers or from snowfall in summer. Therefore, during the study of the in situ response of the crustose lichen Placopsis antartica, it was found that the dominant factor that affected the electron transport rate (ETR) was the speed with which the thallus moistened in comparison to the controls [9]. Hence, from the ecological perspective, it is important to investigate whether Antarctic lichens present differences in their ability to respond to changes in humidity, as well as whether there are differences between species displaying different morphotypes [10,11]. During the Antarctic summer, lichens absorb water from rain, mist, and thawing snow [12]. However, in Continental Antarctica, lichens can also absorb water from snow sublimation [13].
Lichens are desiccation-tolerant organisms that undergo a large number of dehydration/rehydration cycles during their lifetime [5]. When lichens undergo desiccation from a wet to a dry state, they lose their photosynthetic activity and gradually become physiologically and photosynthetically inactive. For severely desiccated thalli, CO2 exchange is ceased in lichen photobionts until they become hydrated again [7]. Desiccation in lichens correlates with a decline in primary photosynthetic activity, a loss of variable chlorophyll fluorescence (ChlF), and a decrease in their overall fluorescence yield. These changes are accompanied by a decoupling of photosystems I and II in the algal/cyanobacterial photobiont during thallus desiccation. Lichens activate several protective mechanisms during desiccation, which decrease ChlF. The mechanisms quench ChlF and protect the chloroplastic apparatus from over-energization during desiccation. The changes enable photobiont cells and their chloroplasts to keep functioning, even under severe desiccation. The underlying mechanisms have been studied over the last few decades, and several quenching mechanisms have been identified in lichens [14]. Among relevant studies, energy dissipation from desiccating mosses and lichens was described by [15,16,17,18]. The mechanism comprises effective quenching centers that appear during desiccation and act as thermal dissipation units.
This study focuses on the effects of lichen desiccation on the shape of slow Kautsky kinetics (KKs) of ChlF measured in dark-adapted samples exposed to continuous light. The KKs show a rise from the O (background ChlF) to the P peak, followed by a polyphasic SMT phase. The OPSMT transient reflects important points on KKs, where O stands for the origin, P for peak, S for a semi-steady-state ChlF level, M for local maximum, and T for a terminal steady-state ChlF level. The OPSMT shapes have been analyzed in detail by Riznichenko et al. (1996) [19], Govindjee (see [20,21]). The authors described the ChlF signal change within the PSMT part of the KKs and attributed it to the photochemical and nonphotochemical processes that take place in a photosynthetic apparatus. Regarding the photochemical processes, the reoxidation of reduced QA due to the photosynthetic electron transport chain causes the decrease in the PSMT phase. However, other processes, such as those involved in nonphotochemical quenching, could also be involved (see below). Generally, the SMT phase of the ChlF signal forming the induction curve and the appearance of additional maxima are caused by stimulating the dark reactions of the Calvin-Benson cycle of the CO2 fixation (see [22]). The SMT part is polyphasic due to several co-acting processes. Nonphotochemical fluorescence quenching (NPQ) results from these processes as the formation of the transthylakoidal proton gradient [23], phosphorylation of the light-harvesting complex (see [24]), oxidation of the plastoquinone pool, and photoinhibition [25]. The P-S-M transition is denoted to the components of nonphotochemical quenching (qN), i.e., energy-dependent quenching (qE), state transition quenching (qT), and photoinhibitory treatment (qI) [26]. For qE, several underlying mechanisms have been proposed, such as quenching in light-harvesting complexes [27]. For qT, the “spillover” of excitation energy from PSII to PSI has been considered; however, the involvement of excitation spillover during the P-S phase is improbable [28]. For the S-M phase, the involvement of the state transition was reported previously [29]. Although qI’s involvement in the SMT phase is minor, photoinhibition-induced changes and the activation of photoprotective mechanisms must be taken into consideration. Because a proportion of the qN components are species- and treatment-specific, it may be suggested that the entire PSMT chlorophyll fluorescence transient reflects a superimposition of several processes.
Compared to the numerous studies that exploit KKs to analyze stress on PS II functioning, KKs has only been used sporadically in lichens. It was used to characterize their sensitivity to photoinhibition [30] and freezing stress [31]. Nabe et al. (2007) [32] studied the sorbitol effect on the KKs shape in liverwort (Marchantia polymorpha) and moss (Bryum argenteum). In this study, we focused on the PSMT phase of the KKs shape. We hypothesized that the KKs would be species-specific and sensitive to the desiccation of selected Antarctic lichens. Therefore, we measured the KKs of selected lichen species and analyzed the parameters derived from the O, P, S, M, and T ChlF signals (e.g., the ratios related to peak ChlF [P]), such as P/M, P/T, and others. We hypothesized that they would be related to the relevant water content (RWC) in thalli.
A dehydration-induced decrease in variable chlorophyll fluorescence that results in a decrease in slow ChlF transient has been shown several times for lichens. The decrease in O, P, S, and T ChlF signals is accompanied by the inhibition of primary photosynthetic processes, which is demonstrated by a decrease in potential yield of photochemical processes in photosystem II (FV/FM), and effective quantum yield of photosystem II (ΦPSII). Such response has been found in cyano- and chlorolichens (see [33]). However, the decline is species-specific and bi- or triphasic if the supersaturation effect takes place. The latter is true for some cyanolichens and Nostoc commune colonies [34]. Therefore, in our study, we expected species-specific responses to the ChlF parameters when evaluating the photosystem II activity of lichen photobiont, such as FV/FM, ΦPSII, and steady-state chlorophyll fluorescence (Fs) in gradually desiccating lichen samples. Additionally, we were interested in the RWC at which the first signs of inhibition of the photosynthetic processes in PSII appear and the RWC at which half of the maximum ChlF parameters are found. Emphasis was also given to the critical RWC, i.e., the RWC at which the individual species show a full limitation of the primary photochemical processes of photosynthesis. Furthermore, we expected species-specific involvement of NPQ, which is considered a protective mechanism that is activated during desiccation in lichens [35]. We evaluated species-specific sensitivity of primary photosynthetic processes in several chlorolichens at low desiccation. This study is a follow-up study of a previous one [33], which focused on desiccation-induced limitation of primary photosynthetic processes in lichens monitored by ChlF parameters (ΦPSII and nonphotochemical quenching of absorbed light energy—qN) and changes in spectral reflectance indices during thallus desiccation. In this study, we supplemented the approach by using a more detailed analysis of the shape of slow Kautsky kinetics during desiccation. We hypothesized that Antarctic lichens from King George Island, specifically their primary processes of photosynthesis, will be highly resistant to desiccation.

2. Material and Methods

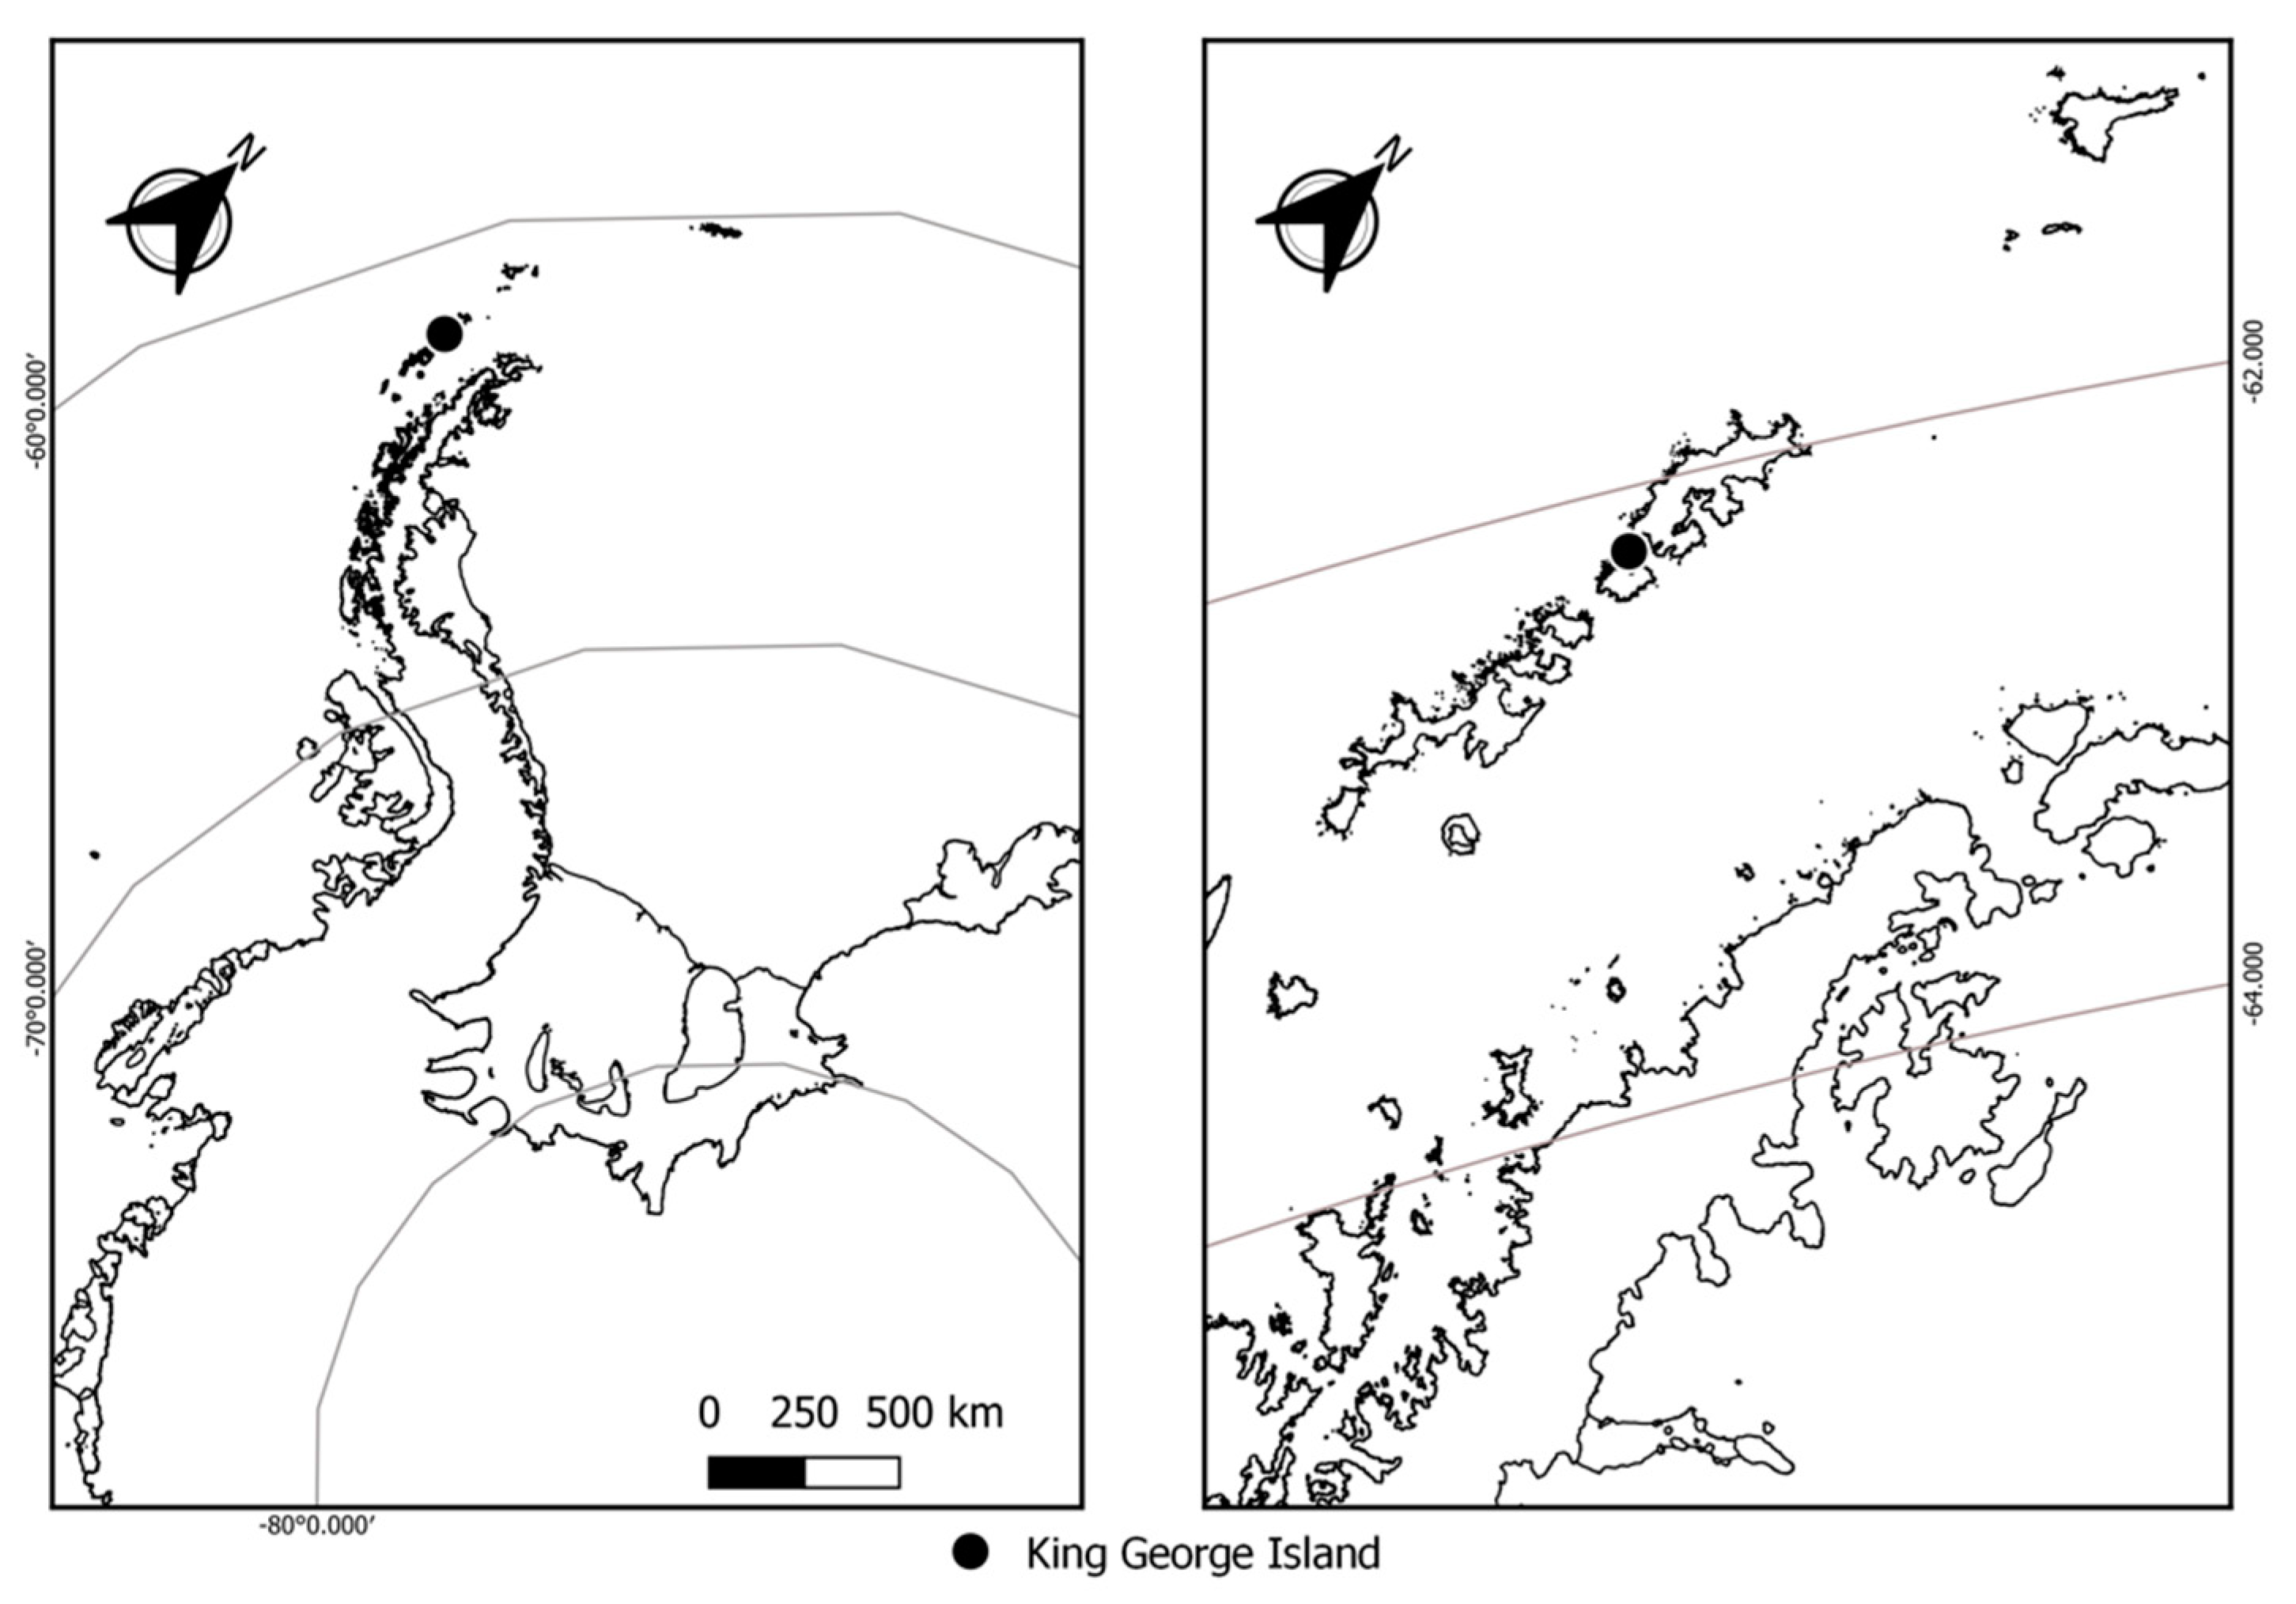
2.1. Site Description, Lichen Species Collection, and Handling

The lichen material was collected during the Chilean Antarctic Expedition (ECA56) on the Fildes Peninsula (62°12′25″ S, 58°58′26″ O), King George Island (KGI), South Shetland Island Archipelago (Figure 1), which is located close to the northern Antarctic Peninsula. For terrestrial vegetation, the greatest diversity, cover and growth rates are contributed by cryptogam species in the northern part of the peninsula up to 72° S, where the factor that best correlates with the exuberance of the polar tundra would be the annual temperature [4]. Therefore, the South Shetland Archipelago in the maritime Antarctic is considered a diversity hotspot. Fildes Peninsula is the second largest ice-free area within the Archipelago, with a mean annual air temperature at sea level of −2.3 °C at Bellinghausen Station, and the annual decadal air temperature trend between 1969–2010 being about 0.259 K/decade [36]. The tundra vegetation consists of expanding, well-developed lichen and moss communities. A total of 61 moss species have been documented on King George Island, of which 40 are present on Fildes Peninsula [37], with also about 109 lichen species being distributed along the ice-free areas [38]. The lichen samples were transferred to Professor Julio at Escudero Station from Instituto Antártico Chileno (INACH) in January 2019, and the voucher specimens were stored at the Fungarium of the Universidad de Concepción, CONC-F.

2.2. Species Characteristics

For the study, we selected the following five Antarctic lichens (Figure 2 and Figure 3) that differ in their thallus morphology, photobiont, and morphotype: foliose (Parmelia saxatilis), crustose (Placopsis antarctica), and fruticose species (Himantormia lugubris, Ramalina terebrata, and Lecania brialmontii), as shown in Table 1.
To study the anatomy of the lichen thalli, freehand cross-sections were made using a razor blade; thickness of the upper and lower cortex, medulla, and algae layer were measured in only two species, Himantormia lugubris and Parmelia saxatilis, due to the restrictions imposed by the quarantine. Lichen samples were put on glass slides before being observed under a Leitz Dialux microscope (Leitz, Wetzlar, Germany) at 100× magnification and documented using a Nikon Coolpix 950 digital camera (Nikon, Tokyo, Japan) attached to the microscope.

2.3. RWC during Dehydration

After collection in the field, the thalli of the lichen species chosen for the experiments were fully hydrated at 15 °C for 24 h in closed Petri dishes until the maximum weight was reached (this was tested by weighing the lichen on a laboratory analytical scale [Brand, Adam Equipment, Oxford, MS, USA]). The fully hydrated thalli were then dried at room temperature (18 °C, 40% RH) in the laboratory at the Escudero Station (Fildes Peninsula). During desiccation, the thalli were regularly (typically in around ten-minute intervals) weighed to evaluate the RWC which was calculated using the following equation: RWC (%) = [(Fw − Dw)/(Ww − Dw)] × 100, where Fw is the actual fresh weight of a sample, Dw is the weight of the fully dry sample (oven-dried sample at 35 °C for 24 h), and Ww is the weight of the fully hydrated sample. The weighing of the thalli and RWC evaluation lasted until a constant weight of dry thalli was reached.

2.4. Chlorophyll Fluorescence Measurements

The samples were collected and immediately remoistened for 24 h under the natural outside temperature. Before the dehydration measurements, the samples were tested for FV/FM after 24 h, 25 h, and 26 h of rehydration. When FV/FM reached a maximum and constant value, the sample was considered vigorous and the primary photosynthetic processes fully activated. From the fully wet (RWC = 100%) to dry (RWC = 0–10%) states of the studied species, the ChlF parameters were measured repeatedly, typically in 40-min intervals.
Laboratory measurements using the slow Kautsky kinetics (KKs) method supplemented with saturation pulses in dark- and light-adapted states were used. The chlorophyll fluorescence parameters were recorded using a FluorCam HFC 1000-H (Photon Systems Instruments, Drásov, Czech Republic) and the FluorCam v. 7.0 software. Additionally, Kautsky kinetics supplemented with a quenching analysis was used. The method starts with a saturation pulse applied in a dark-adapted state (ten minutes) to induce the maximum ChlF (FM) followed by ten seconds of dark. Then, the samples were exposed to actinic light (100 μmol (photons) m−2 s−1) for 300 s, and a polyphasic time course of the ChlF emission was recorded. When a steady-state ChlF was reached (after 300 s), another saturation pulse was applied to induce FM’ levels of ChlF, i.e., the maximum ChlF value in light-adapted material. After switching off the actinic light, background ChlF (F0′) was recorded for 20 s. Standard ChlF parameters (FV/FM, ΦPSII, NPQ, Fs) were calculated using FluorCam software. Their dependence on RWC is presented in this study. For a more detailed analysis, the dehydration response curves of the effective quantum yield of the photosynthetic processes in PSII (ΦPSII) and the steady-state chlorophyll fluorescence (Fs) were selected. The critical points were distinguished for the ΦPSII and Fs dehydration response curves, which denoted the RWC at which the ChlF parameter was limited to 0.
The dehydration response curves of ΦPSII, NPQ, and FS were plotted and analyzed. Species-specific responses in the dehydration-induced decline in photosynthetic parameters were noted, and the RWC at which the functional changes occurred were evaluated.
The records of ChlF transients for particular lichen species and RWC were analyzed. On the slow Kautsky kinetics of ChlF, the levels O, P, S, M, and T were identified, along with the times at which they were reached. This was done using FluorCam software after 100× magnification of the curve (y axis: ChlF as dependent variable), which distinguished the particular ChlF levels, even on seemingly flat curves. Particular species-specific levels (P, S, M, T) were found by the software, as the ChlF signals reached at the times of 2.0 s (for P) 4.8–5.2 s (for S), 16.0–28.6 s (for M), and 300 s (for T) after the continuous light inducing KKs was switched on. The exception was P. antarctica (algal part) where S and M ChlF levels were found in 16.2 and 50.0 s. The effects of RWC on the above-specified ChlF levels and ratio parameters (P/S, P/M, S/M, M/T) were then evaluated according to [40].

2.5. Spectral Properties in the Wet and Dry States of Thallus

Reflectance spectra within the range of 380–800 nm were measured using non-imaging spectro-reflectometers, PolyPen RP 400 (UV-VIS, Photon Systems Instruments, Brno, Czech Republic). The measurements were conducted in the wet and dry states of the thallus to evaluate the hydration-dependent changes in spectral reflectance curves and derived from spectral indices (see Table 2). Lichen thalli were placed into a clip in the PolyPen’s measuring head, which allowed a constant distance between the detector and the lichen. In the clip, a short darkening period (approx. one minute) was allowed before single measurements of the spectral reflectance were taken. After downloading the files from the spectro-reflectometer, the mean ’wet’ and ’dry’ spectrums were calculated. The means of particular spectral reflectance indices were evaluated, and the change between the dry and wet states was discussed.

2.6. Statistical Analysis

Unless stated otherwise, the statistical analysis was done by an ANOVA test (RWC effect on ChlF parameters) and Student t-test (spectral reflectance curves), with statistically significant differences of p ≤ 0.05.

3. Results

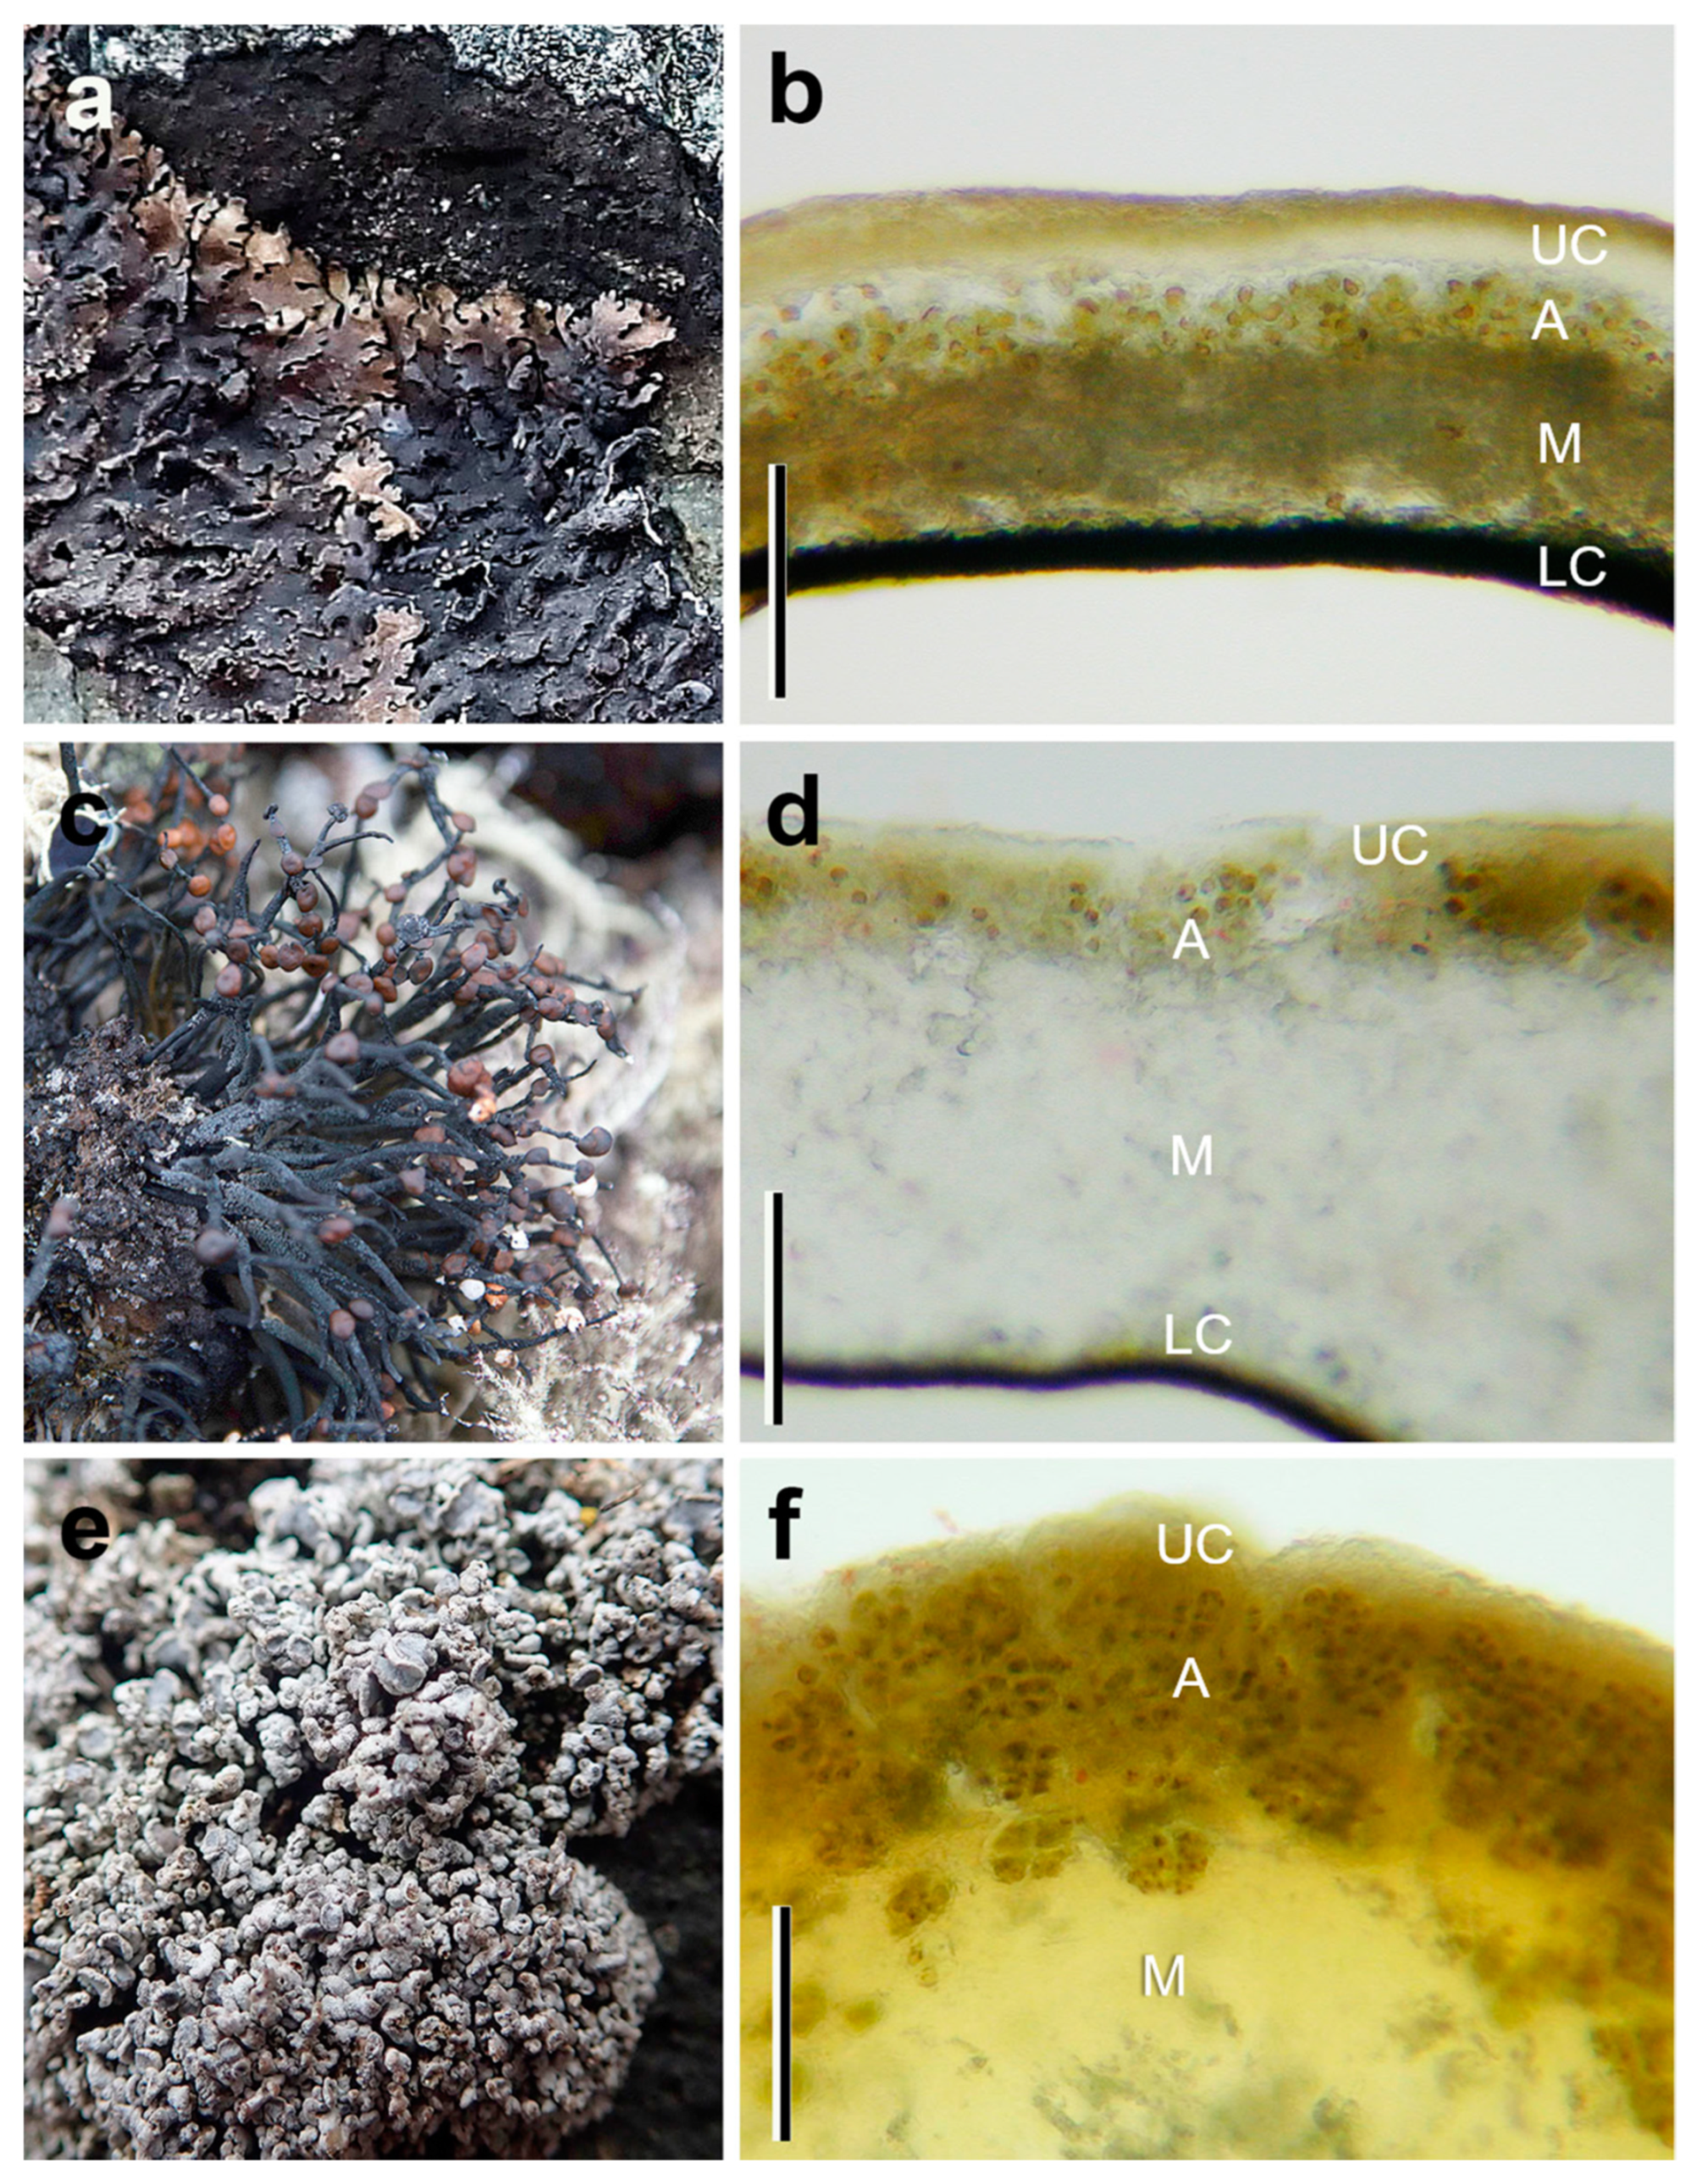
3.1. Anatomy of the Species

A microscopy study revealed species-specific differences in the heteromerous thallus morphology and anatomy of the five different Antarctic lichens. Qualitative differences were found in the four thalline layers, upper cortex, green-algae layer (Trebouxioid), medulla, and lower cortex. In P. saxatilis, the algal layer is very thin and continuous, and the thallus thickness ranges between 152–159 μm (Figure 2a,b). For the fruticolose Himantormia lugubris, a very thin algal layer (compared to the thallus thickness) is located beneath the cortex (Figure 2c,d). However, the algal cells do not form an evenly thick layer but small clusters with some substantial spaces (up to 15 μm) between them (not shown). The upper cortex averages 15 μm, and thallus thickness fluctuates between 168–372.0 μm. Lecania brialmontii is a microfruticolose lichen that forms a pulvinate cushion. The thallus shows terete ramification below the upper cortex with a continuous algal layer, which can form between 25–30% of the thallus (Figure 2e,f). Placopsis antarctica has two types of photobionts—the green algal layer below the upper cortex (Figure 3a,b) and the cephalodia in the center of the thallus with cyanobacteria (Figure 3a,c). For R. terebrata, the old thallus parts exhibit an algal layer of varying thickness that is located beneath the cortex (Figure 3d,e). Young tips show an irregular distribution of the algal photobiont within a thallus cross-section. The algae form a series of cell clusters with a patchy distribution.

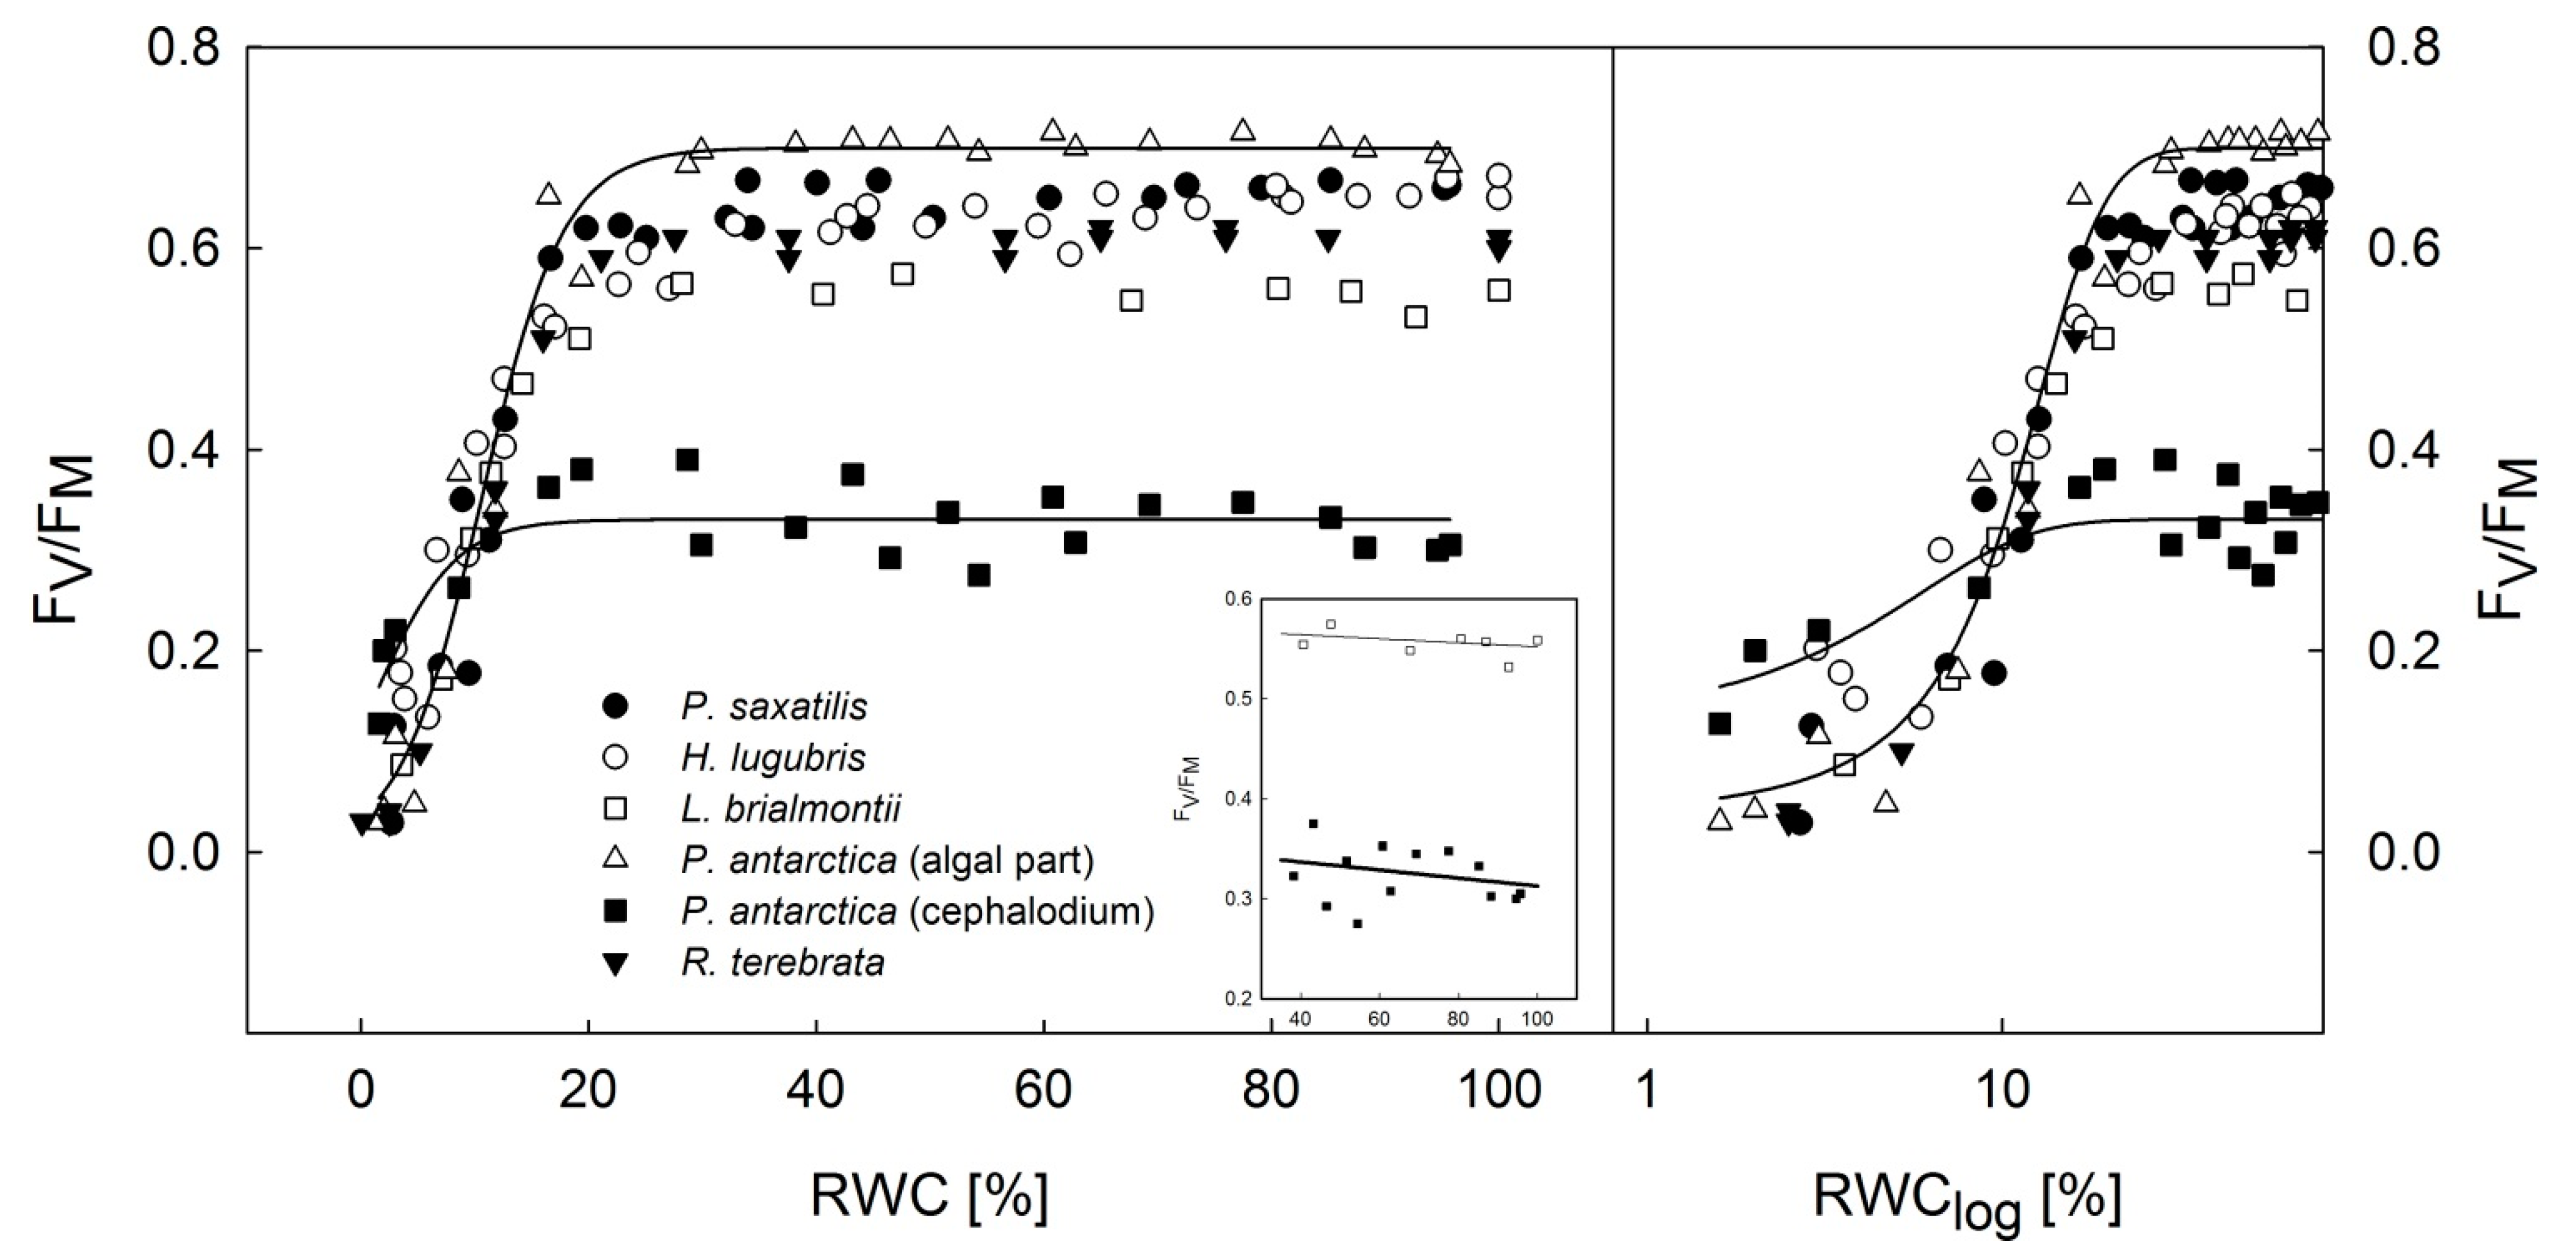
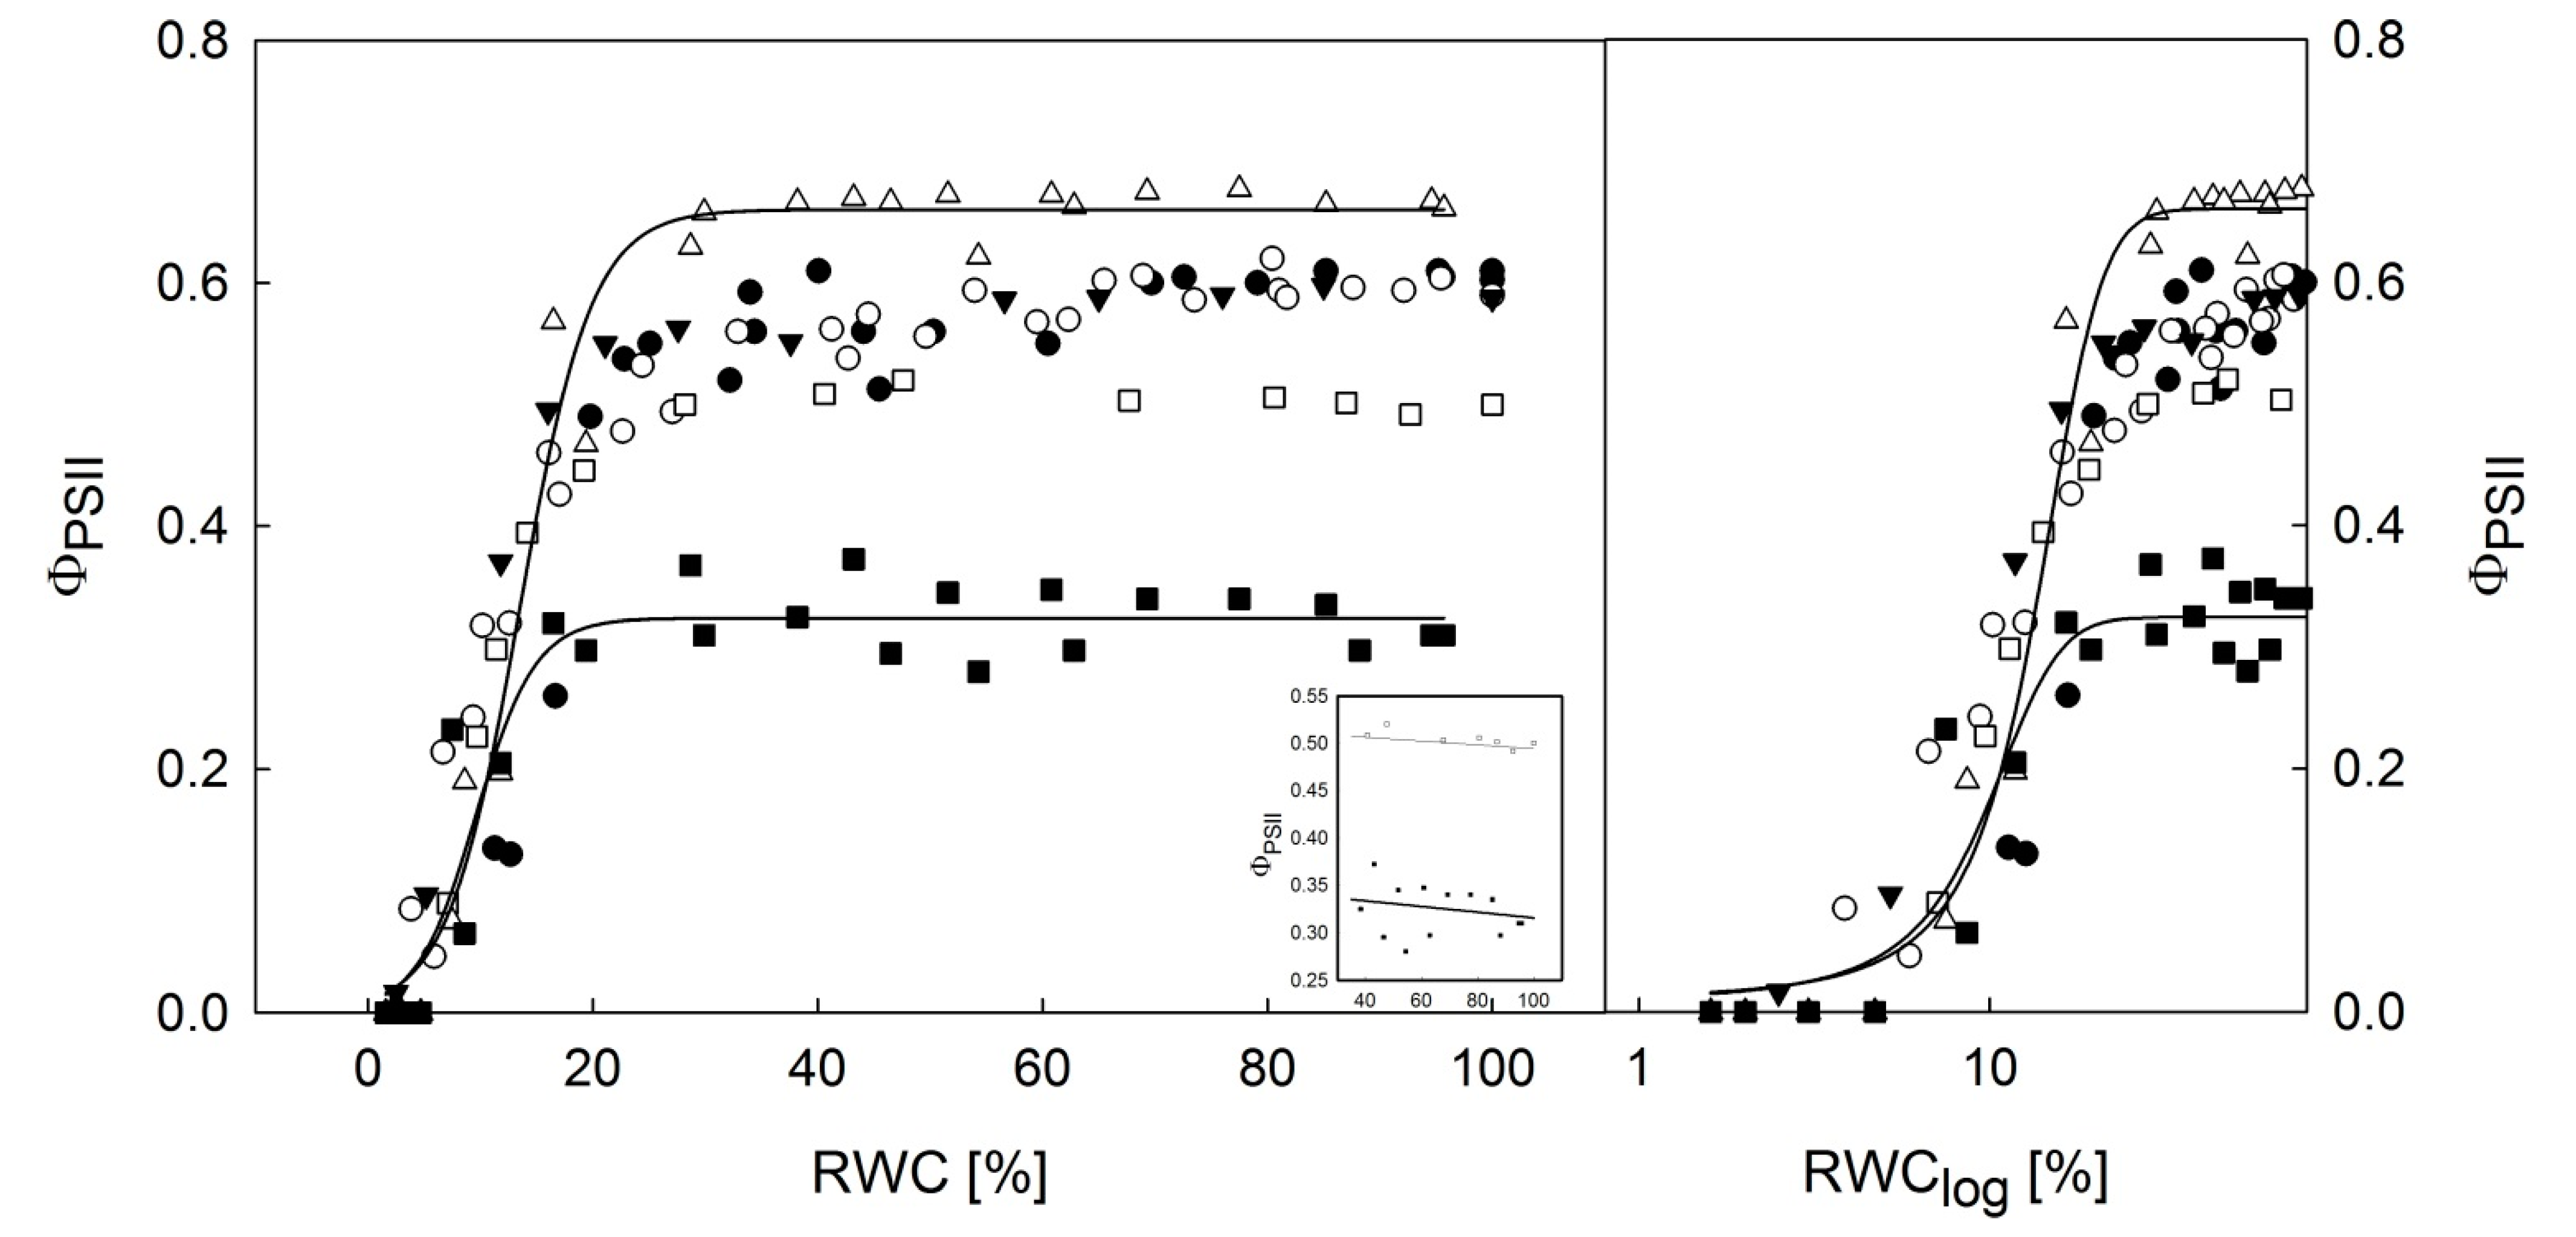
3.2. Dehydration Response Curves of the Potential and Effective Quantum Yield of PSII

Most species showed no limitations of FV/FM (Figure 4) and ΦPSII (Figure 5) in the thalli desiccating from a wet state (RWC: 100%) to a semi-dry state (RWC: approx. 35%). The cephalodium of P. antarctica and L. brialmontii had a different dehydration response curve with a slight but constant increase in FV/FM and ΦPSII when the RWC decreased from 100% to 20% (for FV/FM) and 100% to 30% (for ΦPSII), see the inset in Figure 4 and Figure 5. Then, with further desiccation below the RWC of 30%, a significant decline in the FV/FM and ΦPSII was found with further thallus desiccation at RWCs below 25%. Species-specific dehydration-dependent fall in FV/FM and ΦPSII started at an RWC range of 22–32%. With further desiccation, species-specific differences were more distinguishable. This was particularly true for the RWC1/2 values, in which FV/FM and ΦPSII reached their half maximum values. For FV/FM, RWC1/2 was found below 15% and declined in the following order: Ramalina terebrata (11.80%), Himantormia lugubris (9.72%), Lecania brialmontii (9.70%), Parmelia saxatilis (8.90%), algal part of Placopsis antarctica (8.62%), and cephalodium of P. antarctica (2.01%). For ΦPSII, although the species order of RWC1/2 differed, it generally had higher RWC1/2 values than FV/FM, as follows: algal part of P. antarctica (19.4%), P. saxatilis (16.7%), R. terebrata and cephalodium of P. antarctica (11.80%), L. brialmontii (11.4%), and H. lugubris (10.2%). Generally, low values were found for the critical RWC (RWCcrit), at which FV/FM and ΦPSII reached zero. In all species, the RWCcrit was below 5%. For FV/FM, the values reached 0.85 % (P. saxatilis), 0.25 % (H. lugubris), 1.20% (L. brialmontii), 0.95% (P. antarctica—algal part), 0.20% (P. antarctica—cephalodium), 1.05 % (R. terebrata). For ΦPSII, the RWCcrit values reached 8.2% (P. saxatilis), 3.3% (H. lugubris), 4.4% (L. brialmontii), 5.0% (P. antarctica—algal part), 4.3% (P. antarctica—cephalodium), and 2.9% (R. terebrata). For the dehydration response curve of P. antarctica, a significantly higher ΦPSII was found for the algal part of the thallus than for the cephalodia with the RWC declining from 100 to 15 %. In final phase of desiccation (RWC below 10%), however, ΦPSII values are almost identical in algal and cyanobacterial parts of the thallus, contrasting with FV/FM, where higher values are found for cephalodia than for the algal part. With the exception of cephalodium of P. antarctica (FV/FM) and H. lugubrisPSII,), the values of FV/FM and ΦPSII were highly related to steady state ChlF (Fs), see Table 3.
Steady-state chlorophyll fluorescence (Fs) declined in a polyphasic manner with ongoing thalli dehydration in all species (Figure 6). It showed a slight decline in the RWC range, as it decreased from 100% to 30%. Then, like FV/FM and ΦPSII, Fs started to decline more significantly at a RWC of about 30%. Except for H. lugubris and cephalodium of P. antarctica, ΦPSII correlated with Fs (R2 over 0.97), which indicates a high potential for the Fs signal to monitor vigor and photosynthetic activity in P. saxatilis, L. brialmontii, R. terebrata, and P. antarctica (algal part).
NPQ increased with desiccation, more apparently at the RWCs below 20%. The dehydration curves were of similar shape with the exception of L. brialmontii and H. lugubris. The two species showed smaller NPQ increase in the RWC declining from 20 to 0% RWC than the other ones.

3.3. Slow Kautsky Kinetics Recorded for the Lichens at Different RWCs during Desiccation from Fully a Wet to a Dry State

The chlorophyll fluorescence signal decreased with thallus desiccation in all species except for H. lugubris, in which the ChlF signal showed an increase in RWC, followed by a decrease from 100% to 60%. In L. brialmontii, the KKs was almost identical in the RWC range during desiccation from 100% to 20%. However, in all species, a significant ChlF decrease in the KKs was apparent at RWCs below 20%. The desiccation-induced decrease was demonstrated by a “flattening” of the slow KKs and a decrease in the P, S, M, and T ChlF values (Figure 7). Similarly, a decrease was found for the ChlF values that were reached after the application of saturation pulses (FM data not shown in Figure 7). These changes were attributed to the generally increased nonphotochemical quenching and the changes in the optical properties of lichen thalli during desiccation (for more details see Discussion). Additionally, some species-specific changes were observed in the KKs shape, specifically for the ChlF fluorescence signals reached at particular O, P, S, M, and T levels (Figure 7, see the upper left and lower left panels): (1) FP < FM with the S point becoming less distinguishable with pronounced desiccation (in this case, FM does not denote to maximum ChlF reached after saturation pulse applied to a dark adapted sample but ChlF level reached at M in Figure 7), (2) time at which the M point was reached (e.g., 36 s in R. terebrata, 66 s in P. saxatilis). Therefore, desiccation induced some minor changes in the index parameters (P/S, P/M, S/M, M/T). These were small but apparent in all species except for L. brialmontii (see Table 4), which showed the KK’s “plateau type,” which is typical for most cyanobacteria [43]. The other species showed the typical OPSMT shape for chlorolichens.

3.4. Analysis of Reflectance Spectra in Dry and Wet States

The spectral reflectance curves, PRI, and NDVI showed species-specific sensitivity to dehydration (see Table 5, Figure 8). H. lugubris did not show any change between the spectrum recorded in dry and wet states, while the Lecania brialmontii spectra showed a lowering of reflectance from a dry to a wet state throughout the whole wavelength interval. The reflectance spectrum of dry L. brialmontii increased almost linearly between 300 nm to 680 nm. However, a local peak was apparent at 640 nm, followed by a red-edge increase starting at 680 nm. In both the wet and dry states, the red-edge increase was biphasic with a faster increase in the wavelength range of 680–720 nm, followed by a slower increase within the range of 720–780 nm.
NDVI and PRI differed for dry and fully hydrated thalli of the experimental lichen species. However, the response was species-specific. NDVI decreased in the hydrated state for H. lugubris and P. saxatilis but increased in L. brialmontii, R. terebrata and P. antarctica. However, in wet states, the values of PRI either increased (H. lugubris), decreased (P. saxatilis, P. antarctica), or showed no change (L. brialmontii, R. terebrata).

4. Discussion

4.1. Chlorophyll Fluorescence Parameters during Desiccation

The results show that Antarctic lichens have a high desiccation tolerance because all species showed a decline in FV/FM and ΦPSII at RWCs below 20% to 30%, as has been reported previously for Cladonia borealis [44]. Recent studies support the idea that liquid water availability is the main limiting factor for lichen photosynthesis (see [45]). For all experimental species, the values of FV/FM and ΦPSII were fairly constant in the thalli, desiccating from 100% to 30% RWC (Figure 4 and Figure 5). Except for L. bialmontii and Nostoc-containing cephalodium of P. antarctica (see the insets in Figure 4 and Figure 5), the FV/FM and ΦPSII values showed either no change or a decrease when the RWC declined from 100% to 30%. The slight increase of FV/FM and ΦPSII in L. brialmontii and cephalodium of P. antarctica that was found with desiccation from 100% to 30% of RWC can be attributed to the limited CO2 diffusion into the thallus in the wet state. This phenomenon is caused by exopolysaccharidic envelopes of cyanobacteria cells, which in the wet state represent a physical barrier for CO2 transfer. Therefore, photosynthetic processes are limited in fully hydrated thalli and increase with partial dehydration, as shown by Nostoc commune colonies [34].
Considering the microsite conditions at King George Island and thallus morphology, the crustose Placopsis antarctica, which grows on stones on the ground in a humid environment, passes faster desiccation during the summer season (shown by [9]) than Lecania brialmontii, which grows on coastal rocks with water runoff and high humidity. L. brialmontii is a microfruticulose lichen with a pulvinate cushion form where water can be retained for a long time. This has been found in similar morphological arrangements in Antarctic cushion mosses [46], where individual specimens lose water faster than the cushion form. A minor decrease in FV/FM and ΦPSII was found in R. terebrata, which grows on higher rocks that are exposed to the wind. On the other hand, H. lugubris is the species that showed the highest tolerance to drought, as indicated by higher values of ΦPSII data points at RWCs below 10% than for the rest of species (Figure 5) and generally low NPQ values at the same RWC interval (Figure 6). The species grows on stones in drier areas to form extensive communities with other fruticose lichens [47]. The behavior of H. lugubris is interesting because the KKs analysis showed that the ChlF signal is most effective at a lower RWC (see below). The maximum value of ΦPSII found for H. lugubris was comparable to the value reported by [47] for grey thallus branches.
A significant S-curve decrease of FV/FM and ΦPSII at RWCs of below 20–30% was found for the five experimental species (Figure 4 and Figure 5) and has been well documented for a variety of lichens [48,49]. Similarly, an earlier study [50] reported a rapid decline in FV/FM in lichens when the RWC decreased below 20%. These changes indicate a severe limitation of PS II in lichen thalli in the final stage of desiccation. FV/FM reached 10% of their maximum value at the RWC values below 10%. Such values are comparable to the data reported previously [51] for three lichen species from Norway. This suggests that lichens are capable of performing primary photochemical processes of photosynthesis at low thallus hydration.
During the desiccation of the lichen thallus, excess ROS formation occurs in PS II and other chloroplastic/cellular compartments of a photobiont. Desiccation-induced ROS formation in PS II results in high PS II pressure and, consequently, in photooxidative injury of pigment-protein complexes of PSII. These changes lead to a reduction of photosynthetic efficiency (FV/FM and ΦPSII decline, see Figure 4 and Figure 5). High levels of ROS are harmful not only to PS II but also to essential biomolecules, including nucleic acids, proteins, and lipids [52]. Moreover, the lack of water molecules in desiccating lichens combined with sunlight may overexcite the RCs of PS II, regardless of low lighting [53]. These changes are accompanied by an NPQ increase in RWCs below 20% (see Figure 6), which comprises several protective mechanisms that enhance desiccation tolerance. The reason behind the lower NPQ in L. brialmontii at the RWC below 20% than in other species is unknown. Such low activation of NPQ, however, suggests yet unidentified photosynthetic peculiarities of the L. brialmontii photobiont. NPQ has at least the following three components: (1) pH-dependent energy dissipation in the antenna system of PSII (qE); (2) a state transition between PSII and PSI (qT); and (3) a photo inhibitory quenching (qI) (see [54]). Our ChlF measurements could not determine which of the three components played a major role in the response of the experimental species to thallus dehydration. However, similarly to [44]—Cho et al. (2020), we suggest that qE could contribute to a rapid reduction in PS II excitation pressure. It is known that qE quenching involves converting violaxanthin to zeaxanthin, which is generally associated with desiccation tolerance in lichen [55,56]. Other processes protecting the photosynthetic apparatus during desiccation are the increase in antioxidant content (see [57]), conformational changes of pigment–protein complexes, and thermal dissipation of absorbed light energy [17], dehydration-induced PSII deactivation (see [35]), xanthophyll cycle-independent mechanisms [14], and efficient spillover, i.e., energy transfer from PSII to PSI and consequent quenching due to the formation of a long-lived P700+ state [58]. The PSII to PSI energy transfer is attributed to chlorophyll molecules aggregation in the LHCs of PSII or a new type of quenching in the PSII core antenna [59]. Generally, the protective nonphotochemical dissipation of absorbed light energy happens fast in lichens and other desiccation-tolerant organisms [18,60].
Because nonphotochemical quenching increases with desiccation, the overall ChlF signal decreases. This has been demonstrated for the decline rate of F0 and Fs during desiccation at RWCs of 30–40% (see Figure 6 and Figure 7). The desiccation-induced decrease in F0 in lichen is attributed to changes in the optical properties of the upper cortex [61] and increased nonradiative dissipation of absorbed excitation energy from light-harvesting complexes [59,62].

4.2. Kautsky Curve Changes during Desiccation

Our data on the OPSM shape of KKs is in agreement with a previous study [63], which reviewed the main differences between “algal” and “cyanobacterial” curves. Except for L. brialmontii and cephalodia of P. antarctica (flat KK), the lichen species exhibited distinguished O, P, S, M, and T points in the wet state (RWC = 100 %), with the ChlF level at P point lower than that at M point on the KK. For higher plants and algae, however, higher ChlF levels reached in the P-S than the M-T part of KKs are reported [20,63] similarly to findings for the P. antarctica algal part (fully hydrated, Figure 7). In chlorolichens, such KKs having higher ChlF levels in the P-S than the M-T part of KKs have been observed (e.g., [30]—Conti et al. 2014—Usnea antarctica). For some other Antarctic lichens, however, lower P-S than M-T ChlF levels are reported [40,64]. The latter study reports also the light effects on the ChlF levels at P and M points, and, consequently ChlF P/M ratio (see Table 4).
When lower values of ChlF are reached in the P-S than in the M-T part of KKs in cyanobacteria, this is attributed to State 2→State 1 transition taking place during the S to M rise (see e.g., [65,66]). For unicellular green algae, it is attributed to the migration of LHCII from PS I to PS II after LHC dephosphorylation (e.g., [67] for Chlamydomonas reinhardtii). In chlorolichens and their symbiotic alga Trebouxia sp., however, the mechanism has not been experimentally proven.
In R. terebrata, H. lugubris, P. saxatilis, and P. antarctica (algal part), the M peak (see Figure 7) tended to decrease with decreasing RWC, which can be attributed to the involvement of state transitions [63]. As shown in an earlier study [68], the M peak tends to decrease with higher light intensity. The study reported a decrease corresponding to the light increase from 40 to 160 μmol m−2 s−1 in Umbilicaria antarctica. The same study reported a higher ChlF at P than at M point for Dermatocarpon polyphyllizum (c.f. P. antarctica in Figure 7). Moreover, the P/M ratio of ChlF is temperature-dependent because the KKs shape differs at different temperatures when measured in an optimally hydrated state. The time at which the M point occurs is also temperature-dependent; however, the M point is typically found 60–140 s after the actinic light starts to induce the KKs. In our experiment, the M point was found at varying intervals, ranging from 30 s to 60 s. Except for L. brialmontii, the experimental species exhibited similar responses (trends) in O, P, S, M, T, and ratios (Table 4) with thallus desiccation. In general, numeric values of the ratios P/S, P/M, S/M and M/T increased with desiccation, which is consistent with [60] reporting an increase in the parameters with severity of temperature stress and flattening of the KKs curve. Therefore, the differences between ChlF values at the P, S, M, T decreases, and numeric value of the above-specified ratios increases. In some species, however, the parameters did not show any change with desiccation, which can be explained by generally small differences between P, S, M, and T ChlF levels in “flat” KKs recorded during desiccation (e.g., R. terebrata, P. antarctica—algal part). This contrasts with an earlier study [40] reporting a wide range of numeric values of P/S and P/M in wet Antarctic lichen exposed to a decreasing thallus temperature. In L. brialmontii, where the ratios (Table 4) were close to 1, the phenomenon can be explained by flat KKs with small differences between the P, S, M, and T points, which were hardly distinguishable. A flat KKs is more typical for cyanolichens [9] than chlorolichens. However, chlorococcoid photobiont has been reported for Lecania species [69]. Therefore, we recommend that follow-up studies should conduct a detailed analysis of the KKs shape and quenching mechanisms.
The KKs provide more details about the species-specific responses because the fruticolose Himantormia lugubris in maritime Antarctica grows in a different microenvironment than the crustose Placopsis antarctica. While both species grow on rocks and stones, P.antarctica presents a higher ChlF signal than H. lugubris at 100% RWC (Figure 7), which suggests that P. antarctica is photosynthetically more active at water saturation than the latter. In this context, it is important to mention that H. lugubris is a species that is rather tolerant to drought and does not tolerate water saturation like other Antarctic lichens which show carbon assimilation decrease with water saturation [13]. On the other side, P. antartica is a pioneer species on glacier retreat areas, which are prone to high humidity. Another species that is not as active at high RWC is L. brialmontii, as its fluorescence signal in the KKs study shows that ChlF changes insignificantly from 19–100%, with its activity being slightly lower at 100% (Figure 7).

4.3. Lichen Spectral Properties

Species-specific spectral curves could be correlated with the color of thalli. No change in the spectral reflectance spectrum in wet and dry thalli of H. lugubris can be attributed to the generally black thallus that reflects similarly in wet as well as dry conditions. A similar pattern was found for the blackish cyanolichen Leptogium puberulum (reflectance below 0.1) [33,70].
For L. brialmontii, the wet-state spectral reflectance curve had lower reflectance values than the dry one. However, for both, a biphasic increase in the red-edge region was found as follows: there was a higher rate within the ranges of 680 nm to 710 nm and 710 nm to 800 nm, respectively. The presence of a red-edge increase in spectral reflectance is a characteristic of chlorolichens that has been reported and documented for many species that exhibit a large variety of thallus colors (see [71,72]). In general, hydrated chlorolichen samples, except for the black H. lugubris, showed lower reflectance values than in the dry state. This is mainly true for the spectral range of 400–670 nm, where the difference between the wet and dry spectra is most remarkable (Figure 8), as shown earlier by [64] for Antarctic lichen Dermatocarpon polyphyllizum. Hydration-induced reflectance changes in the visible region are due to the high absorption by photosynthetic pigments, while high reflectance in the near-infrared region is due to high scattering from the internal tissues of the lichens [73,74].
The shape of the spectral reflectance curve of R. terebrata is typical for lichens with green thalli, with several local maxima in the wavelength range of 520–660 nm followed by the red-edge increase. Similar features of the respective curves were found for the thalli of two Antarctic species which are green when moist but not in dry state: Physconia muscigena [33], and Dermatocarpon polyphyllizum [75]. The spectral range of 520–660 is affected mainly by the composition and number of photosynthetic pigments which are sensed as the above-mentioned maxima in wet thalli but not in dry thalli which appear grey (P. muscigena, D. polyphillizum) due to the chromatic change in the dehydrated upper cortex. The role of the upper cortex optical properties can be seen in the spectral curves of the algae-containing part of Placopsis antarctica which, due to generally white color in both dry and wet states, shows almost identical spectral curves (see Figure 8) and does not have any local maxima in the 520–660 nm band.
Our data suggest that apart from species-specific effects, NDVI and PRI indices differ in dry and wet lichens. An increase in NDVI in dry vs. wet thalli in black H. lugubris can be compared to a similar response in the following polar lichens that have a black thallus in a wet state: Umbilicaria hirsuta [76], U. cylindrica, and U. decussata ([77]). However, other representatives of Umbilicariaceae that have a deep green color in wet state show a decrease of NDVI with thallus desiccation, as well as lower NDVI values in dry than in wet condition (U. arctica, U. hyperborea: see [49]).
Our result shows that reflectance curves and/or NDVI offer great potential for remote sensing studies, at least for the detection of Antarctic lichen, according to differential physiological conditions. In many lichen species, NDVI differs in wet and dry states. Typically, lower NDVI values are found in a wet than a dry state [33]. Therefore, NDVI values would be used as proxies of hydration status of thalli and physiological activity of lichens. With technological progress and more frequent use of unmanned aerial vehicles for follow-up studies in Antarctic terrestrial ecosystems, an improvement in the application of NDVI in lichen ecophysiological studies might be expected.

5. Conclusions

  • Dehydration response curves of potential yield of PSII (FV/FM) revealed that primary photosynthetic processes of PSII remained active in P. antarctica cephalodia, even after severe desiccation (RWC below 10%) compared to the chlorolichens that exhibit a high degree of FV/FM limitation. This might be explained by the effect of the exopolysaccaridic envelope of symbiotic Nostoc commune that helps the cephalodium to maintain higher RWC than average values for the whole thallus including the algal part of the thallus.
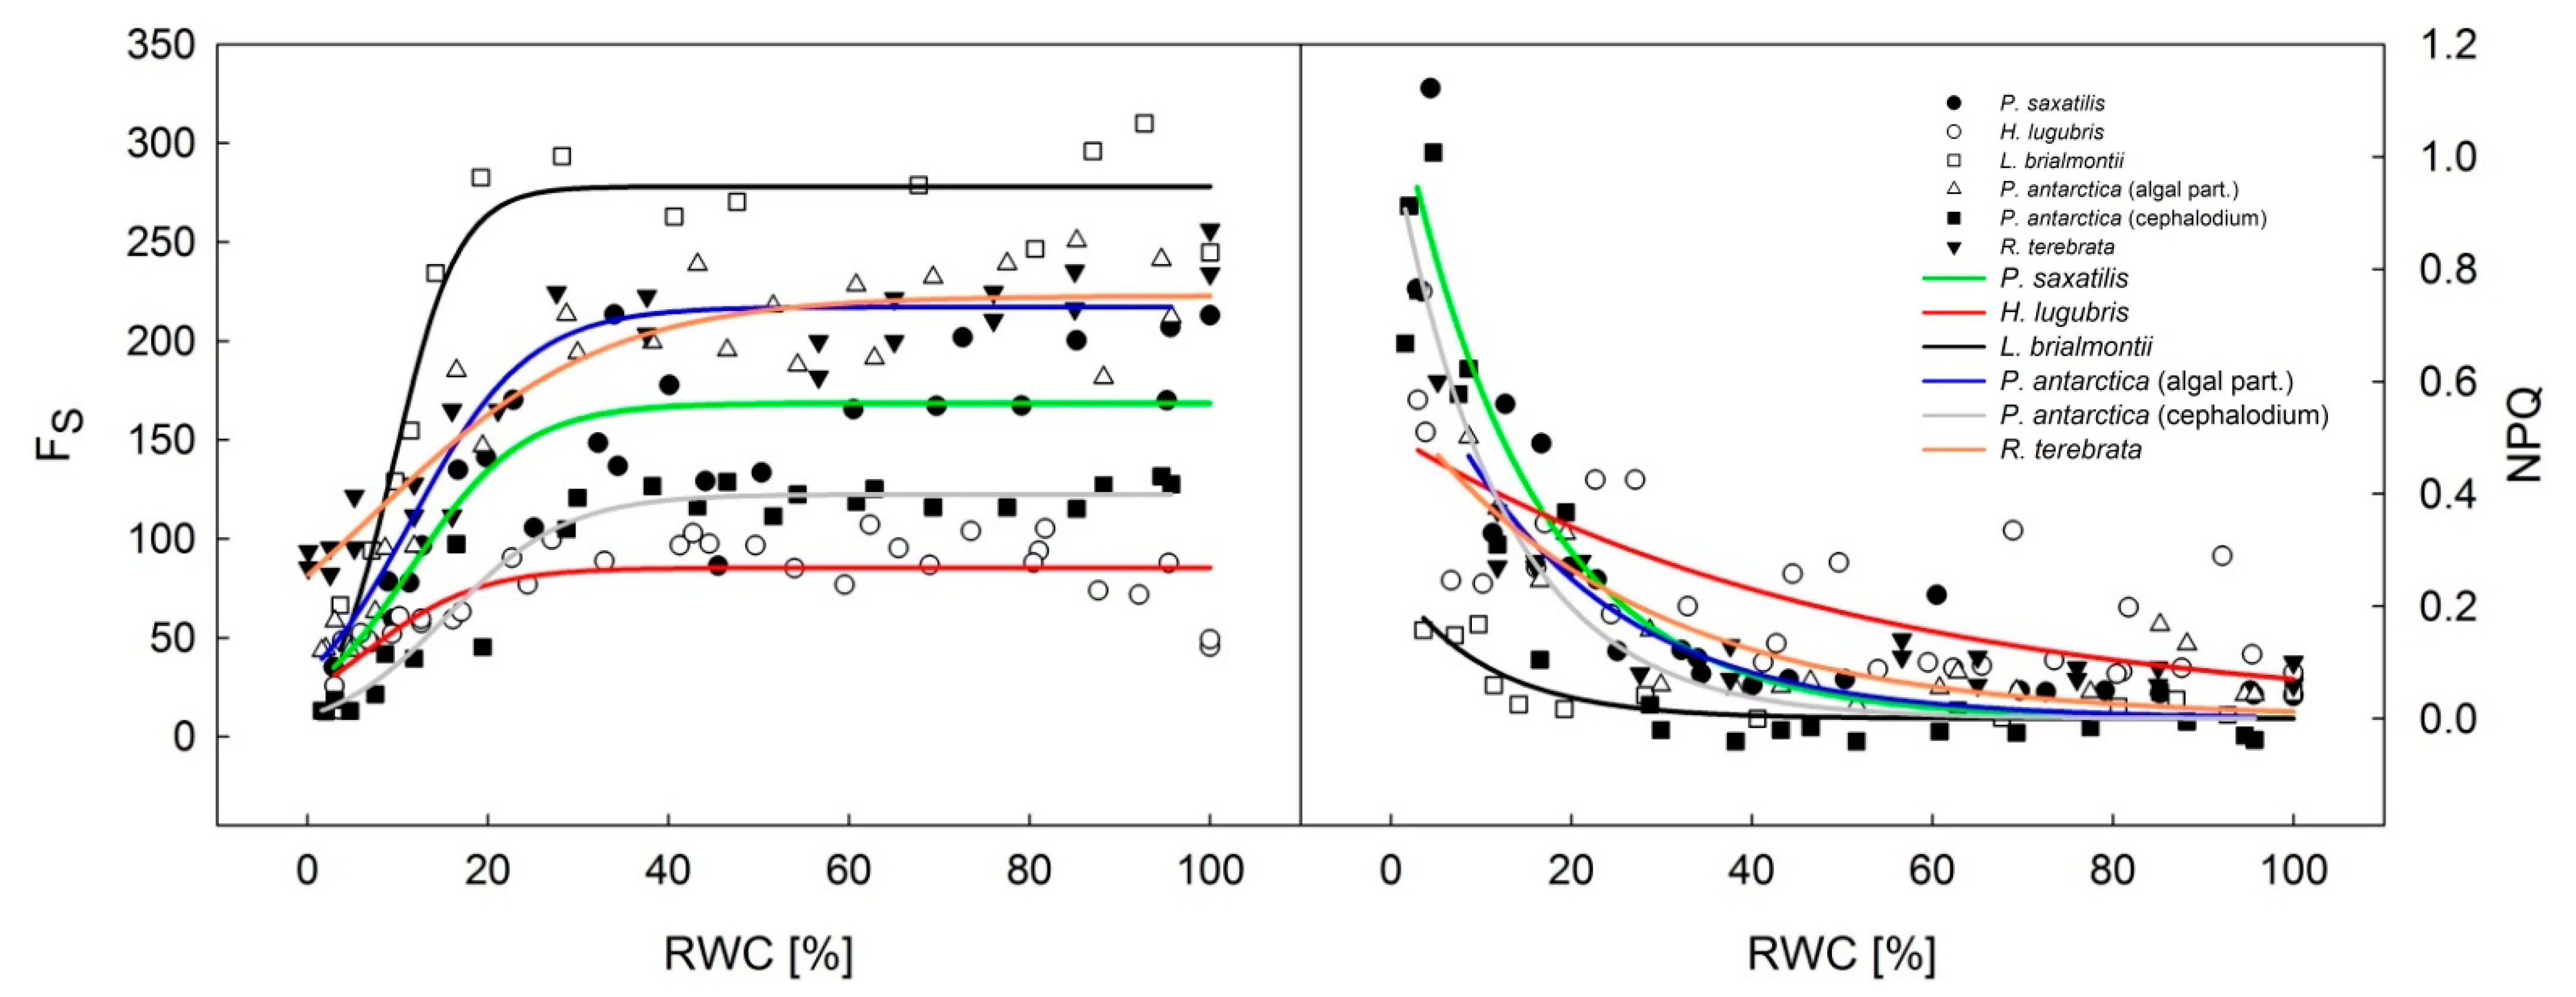
  • For effective yield of PSII (ΦPSII), the dehydration response curves indicated that H. lugubris showed somewhat higher ΦPSII values at the RWC < 10% than the rest of the investigated species. Together with gradual activation of nonphotochemical quenching (NPQ) during thallus desiccation, this suggests an advantage for the species in terms of efficient primary photosynthetic processes during the final phase of desiccation. This might be a useful mechanism because in the field, the species desiccates rapidly due to the black thallus color. Generally, lichens with dark thalli absorb more light energy and therefore warm up and desiccate more rapidly than species with brighter-colored thalli.
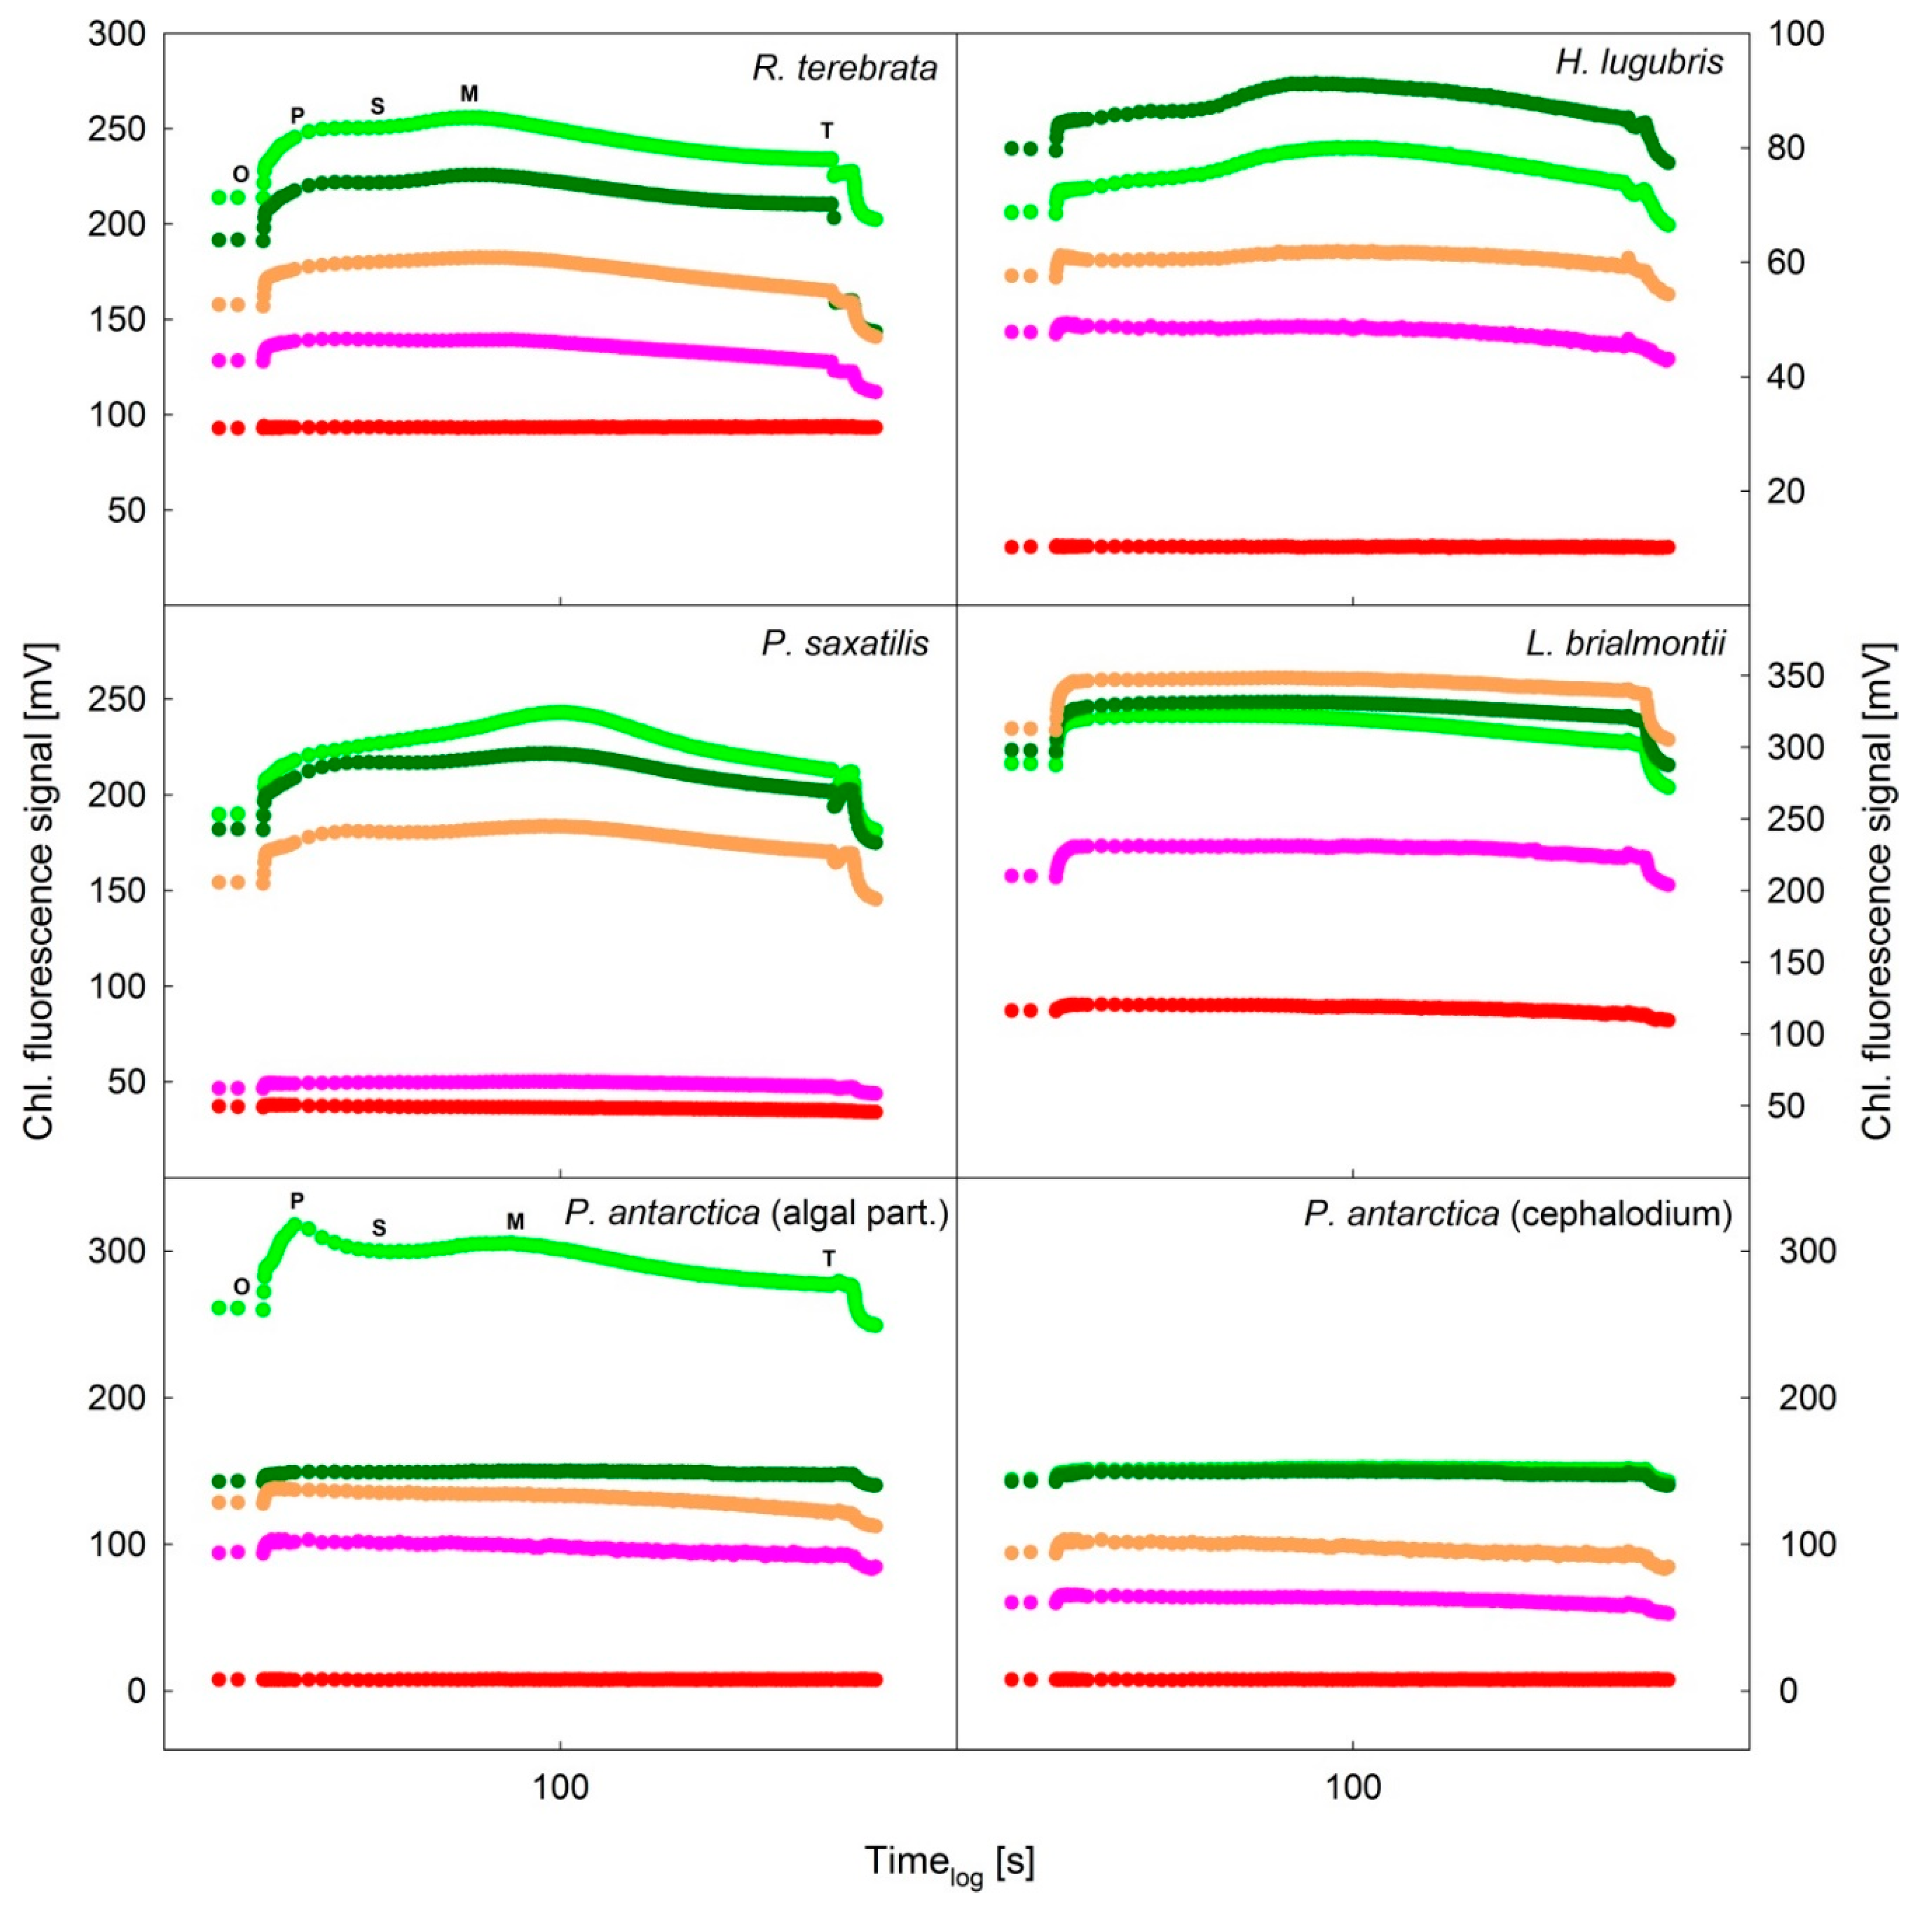
  • All species showed a decrease in the ChlF signal with ongoing desiccation and general flattening of the slow Kautsky kinetics curve. As a result of this phenomenon the index parameters derived from the ChlF levels P, S, M, S, such as P/S, P/M S/M generally increased, but the response and indicative value of such parameters for ecophysiological studies must be verified in follow-up studies.
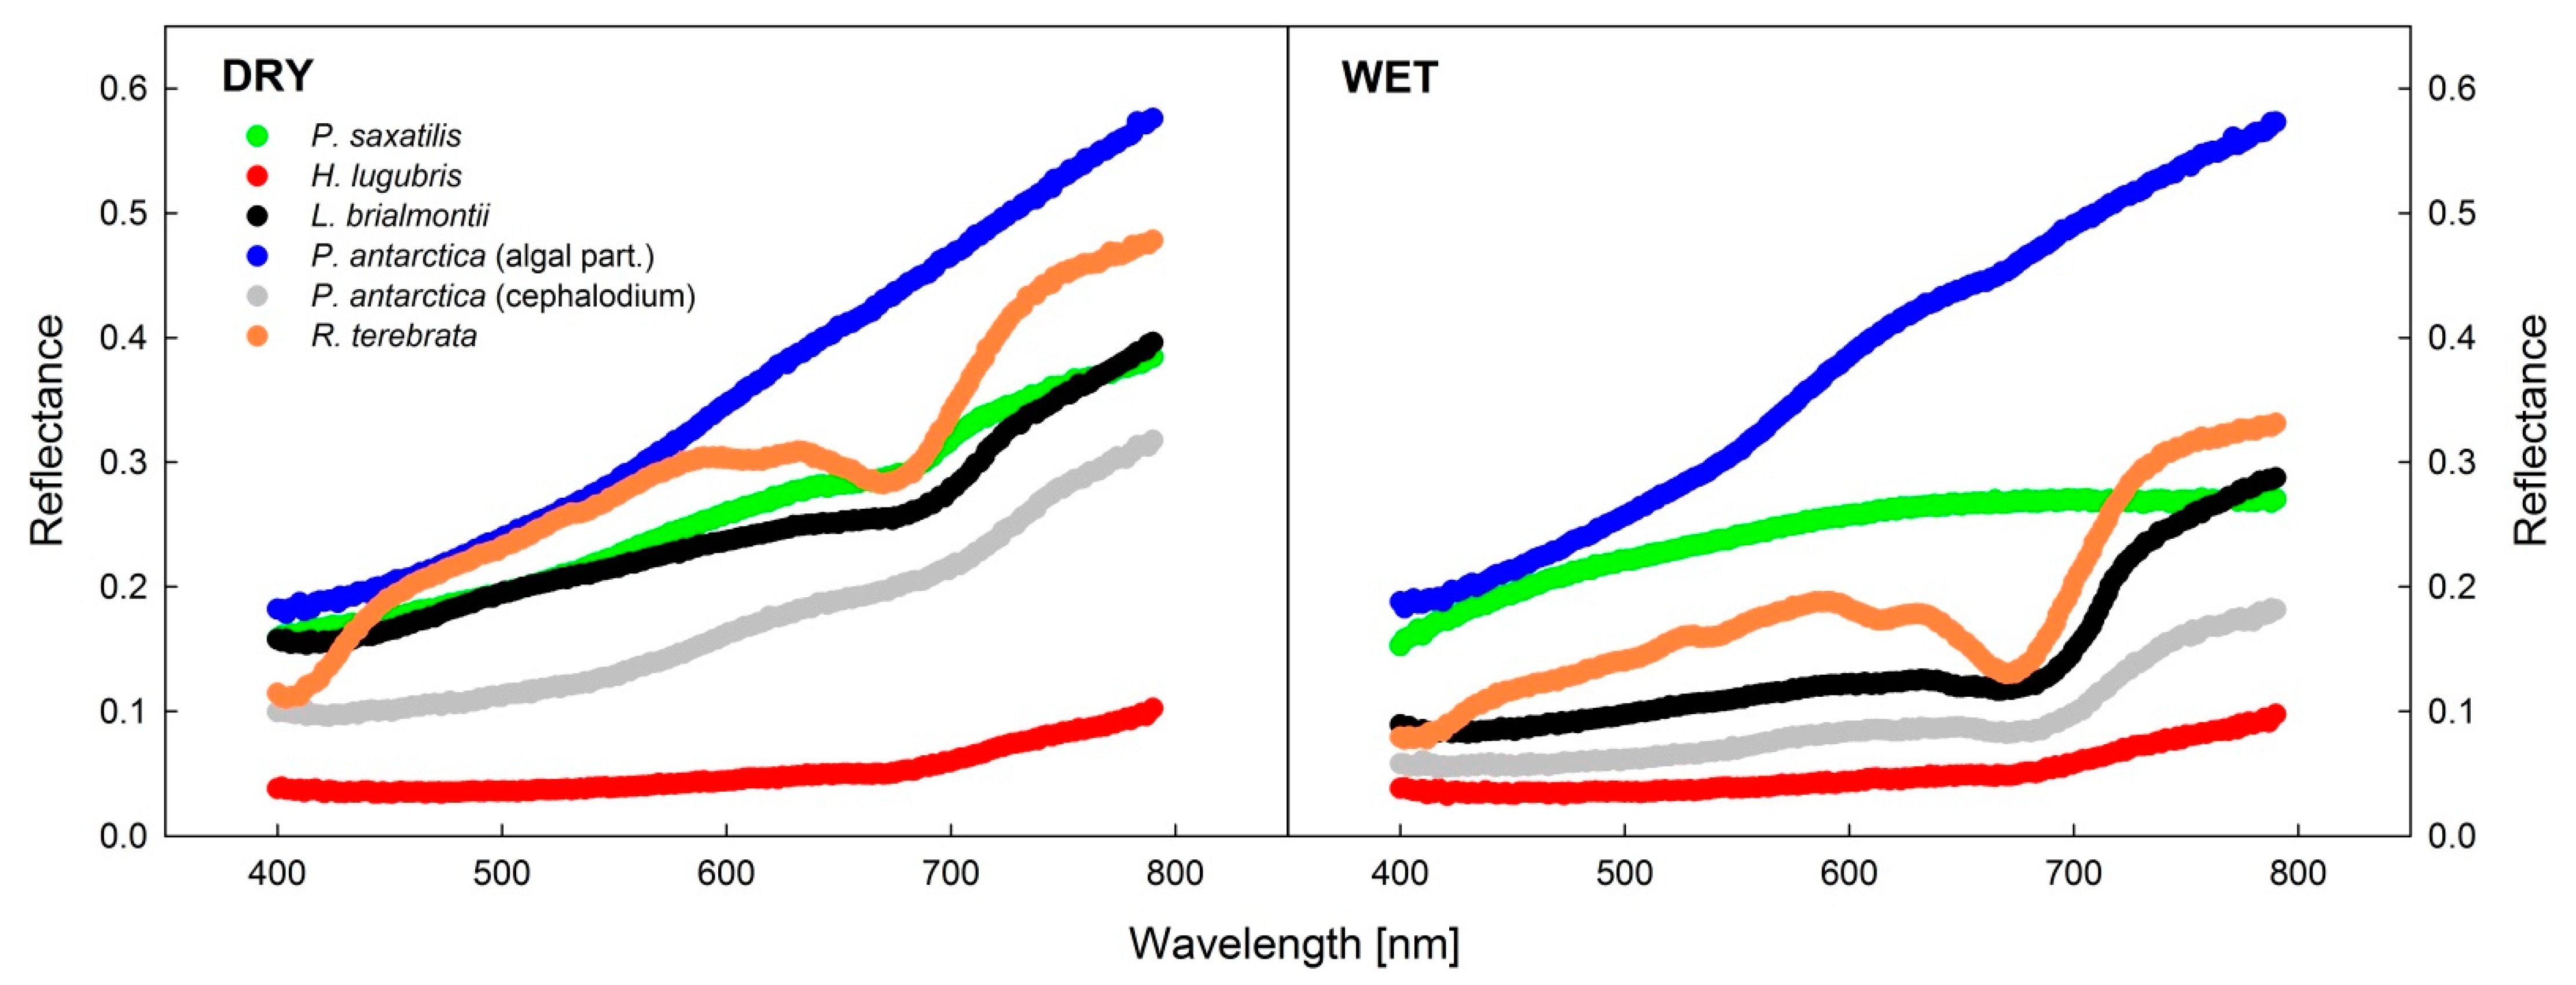
  • Spectral reflectance curves recorded in wet and dry states of thalli showed more evident differences in green than black or blackish lichens, with typically lower reflectance in the wet than in the dry state.
  • In addition to being used to separate rock-dwelling lichens from those growing on bare soil, species-specific spectral signatures, spectral reflectance methods, and NDVI in particular have the potential to determine lichen physiological activity and water content [78].

Author Contributions

M.B.: data measurements, chlorophyll fluorescence data processing and manuscript writing; A.C.-K.: Antarctic Expeditions leader, manuscript writing; J.H.: data processing, graphs creation and editing; A.O.: data processing, literature survey; C.M.: lichens morphoanalisis; J.V.: thallus morphology analysis and manuscript writing; G.P.: Thallus documentation, microscopical photography. All authors have read and agreed to the published version of the manuscript.

Funding

This research was funded by Chilean Antarctic Institute, grant number INACH RT2716 (Chile), National Fund for Scientific and Technological Development, grant number ANID-FONDECYT 1181745 (Chile), Czech Ministry of Education, Youth, and Sports, grant numbers CZ.02.1.01/0.0/0.0/16_013/0001708 and LM2015078, and Masaryk University Brno, Czech Republic grant number MUNI/G/1540/2019.

Institutional Review Board Statement

Field Antarctic research was based on the permit for traveling to Antarctica 1021/2018 and the sampling permit No. 1022/2018 given by INACH (Chile).

Informed Consent Statement

Not applicable.

Data Availability Statement

Not applicable.

Acknowledgments

The authors acknowledge the projects: CZ.02.1.01/0.0/0.0/16_013/0001708 (ECOPOLARIS, Czech Republic), LM2015078 (CzechPolar II, Czech Republic), and MUNI/G/1540/2019 (Masaryk University, Brno).

Conflicts of Interest

The authors declare no conflict of interest.

Abbreviations

ChlF—chlorophyll fluorescence; Fs—steady state chlorophyll fluorescence; FV/FM—potential yield of photochemical processes in photosystem II; ΦPSII—effective quantum yield of photosystem II; HA—Himantormia lugubris; KKs—Kautsky kinetics of chlorophyll fluorescence; LB—Lecania brialmontii; NDVI—normalized difference vegetation index; NPQ—nonphotochemical quenching; OPMST—shape of slow Kautsky kinetics with remarkable points O (origin) to T (steady state); PA—Placopsis antarctica; PAR—photosynthetically-active radiation; PS II—photosystem II; PRI—photochemical reflectance index; PS—Parmelia saxatilis; SRC—spectral reflectance curve; RA—Ramalina terebrata; RC—reaction centre; RWC—relative water content; RWC1/2—relative water content at which a chlorophyll fluorescence parameter reaches half of its maximum value; RWCcrit—relative water content at which the chlorophyll fluorescence parameter reaches zero.

References

  1. Øvstedal, D.; Lewis-Smith, R. Lichens of Antarctica and South Georgia, A Guide to their Identification and Ecology; Cambridge University Press: Cambridge, UK, 2001; p. 411. [Google Scholar]
  2. Olech, M. Lichens of King George Island, Antarctica; Drukarnia Uniwersytetu Jagiellńskiego: Kraków, Poland, 2004; p. 391. [Google Scholar]
  3. Kennedy, A.D. Water as a limiting factor in the Antarctic Terrestrial environment: A biogeographical synthesis. Artic Alp. Res. 1993, 25, 308–315. [Google Scholar] [CrossRef]
  4. Green, T.; Sancho, L.; Pintado, A.; Schroeter, B. Functional and spatial pressures on terrestrial vegetation in Antarctica forced by global warming. Polar Biol. 2011, 34, 1643–1656. [Google Scholar] [CrossRef]
  5. Green, T.G.A.; Sancho, L.G.; Pintado, A. Ecophysiology of desiccation/rehydration cycles in mosses and lichens. In Plant Desiccation Tolerance; Luttge, U., Beck, E., Bartels, D., Eds.; Springer: Berlin/Heidelberg, Germany, 2011; Volume 215, pp. 89–120. [Google Scholar]
  6. Schroeter, B.; Scheidegger, C. Water relations in lichens at subzero temperatures: Structural changes and carbon dioxide exchange in the lichen Umbilicaria aprina from continental Antartica. New Phytol. 1995, 131, 275–285. [Google Scholar] [CrossRef]
  7. Green, T.G.A.; Schroeter, B.; Sancho, L.G. Plant life in Antarctica. In Handbook of Functional Plant Ecology; Pugnaire, F.I., Valladares, F., Eds.; Marcel Dekker Inc.: New York, NY, USA, 2007. [Google Scholar]
  8. Sancho, L.; Pintado, A.; Green, A. Antarctic studies show lichens to be excellent biomonitors of climate change. Diversity 2019, 11, 42. [Google Scholar] [CrossRef] [Green Version]
  9. Casanova-Katny, A.; Barták, M.; Gutierrez, C. Open top chamber microclimate may limit photosynthetic processes in Antarctic lichen: Case study from King George Island, Antarctica. Czech. Polar Rep. 2019, 9, 61–77. [Google Scholar] [CrossRef]
  10. Colesie, C.; Williams, L.; Büdel, B. Water relations in the soil crust lichen Psora decipiens are optimized via anatomical variability. Lichenologist 2017, 49, 483–492. [Google Scholar] [CrossRef] [Green Version]
  11. Inoue, T.; Kudoh, S.; Uchida, M.; Tanabe, Y.; Inoue, M.; Kanda, H. Factors affecting water availability for high Arctic lichens. Polar Biol. 2017, 40, 853–862. [Google Scholar] [CrossRef] [Green Version]
  12. Kappen, L. Some aspects of the great success of lichens in Antarctica. Antarct. Sci. 2000, 12, 314–324. [Google Scholar] [CrossRef]
  13. Colesie, C.; Green, T.G.A.; Raggio, J.; Büdel, B. Summer activity patterns of Antarctic and high alpine lichen- dominated biological soil crusts—Similar but different? Arct. Antarct. Alp. Res. 2016, 48, 449–460. [Google Scholar] [CrossRef]
  14. Veerman, J.; Vasilev, S.; Paton, G.D.; Ramanauskas, J.; Bruce, D. Photoprotection in the lichen Parmelia sulcata: The origins of desiccation-induced fluorescence quenching. Plant. Physiol. 2007, 145, 997–1005. [Google Scholar] [CrossRef] [Green Version]
  15. Heber, U.; Bilger, W.; Shuvalov, V.A. Thermal energy dissipation in reaction centers of photosystem II protects desiccated poikilohydric mosses against photooxidation. J. Exp. Bot. 2006, 57, 2993–3006. [Google Scholar] [CrossRef] [Green Version]
  16. Heber, U.; Azarkovich, M.; Shuvalov, V.A. Activation of mechanisms of photoprotection by desiccation and by light: Poikilohydric photoautotrophs. J. Exp. Bot. 2007, 58, 2745–2759. [Google Scholar] [CrossRef]
  17. Heber, U. Photoprotection of green plants: A mechanism of ultra-fast thermal energy dissipation in desiccated lichens. Planta 2008, 228, 641–650. [Google Scholar] [CrossRef]
  18. Heber, U.; Bilger, W.; Turk, R.; Lange, O.L. Photoprotection of reaction centres in photosynthetic organisms: Mechanisms of thermal energy dissipation in desiccated thalli of the lichen Lobaria pulmonaria. New Phytol. 2010, 185, 459–470. [Google Scholar] [CrossRef]
  19. Riznichenko, G.; Lebedeva, G.; Pogosyan, S.; Sivchenko, M.; Rubin, A. Fluorescence induction curves registered from individual microalgae cenobiums in the process of population growth. Photosynth. Res. 1996, 49, 151–157. [Google Scholar] [CrossRef] [PubMed]
  20. Papageorgiou, G.C.; Govindjee. Photosystem II fluorescence slow changes—Scaling from the past. J. Photochem. Photobiol. B Biol. 2011, 104, 258–270. [Google Scholar] [CrossRef] [PubMed]
  21. Stirbet, A.; Riznichenko, G.Y.; Rubin, A.B.; Govind, J. Modeling chlorophyll a fluorescence transient: Relation to photosynthesis. Biochemistry 2014, 79, 291–323. [Google Scholar] [CrossRef] [PubMed]
  22. Seaton, G.G.; Walker, D.D. Chlorophyll fluorescence as a measure of photosynthetic carbon assimilation. Proc. R. Soc. 1990, 242, 29–35. [Google Scholar]
  23. Noctor, G.; Horton, P. Uncouple titration of energy-dependent chlorophyll fluorescence quenching and photosystem II photochemical yield in intact pea chloroplasts. Biochim. Biophys. Acta 1990, 1016, 228–234. [Google Scholar] [CrossRef]
  24. Allen, J.F. Protein phosphorylation in regulation of photosynthesis. Biochim. Biophys. Acta 1992, 1098, 275–335. [Google Scholar] [CrossRef]
  25. Krause, H.G. Photoinhibition of photosynthesis. An evaluation of damaging and protective mechanisms. Physiol. Plant. 1988. [Google Scholar] [CrossRef]
  26. Kodru, S.; Malavath, T.; Devadasu, E.; Nellaepalli, S.; Stirbet, A.; Subramanyam, R.; Govind, J. The slow S to M rise of chlorophyll a fluorescence reflects transition from state 2 to state 1 in the green alga Chlamydomonas reinhardtii. Photosynth. Res. 2015, 125, 219–231. [Google Scholar] [CrossRef] [PubMed]
  27. Ruban, A.V.; Young, A.J.; Horton, P. Induction of nonphotochemical energy dissipation and absorbance changes in leaves (Evidence for changes in the state of the light-harvesting system of photosystem II in vivo). Plant. Physiol. 1993, 102, 741–750. [Google Scholar] [CrossRef] [PubMed]
  28. Tikkanen, M.; Grieco, M.; Nurmi, P.; Rantala, M.; Suorsa, M.; Aro, E.-M. Regulation of the photosynthetic apparatus under fluctuating growth light. Philos. Trans. R. Soc. Lond. Ser. Biol. Sci. 2012, 367, 3486–3493. [Google Scholar] [CrossRef] [Green Version]
  29. Stirbet, A.; Govindjee. The slow phase of chlorophyll a fluorescence induction in silico: Origin of S-M fluorescence rise. Photosynth. Res. 2016, 130, 193–213. [Google Scholar] [CrossRef] [PubMed]
  30. Conti, S.; Hazdrová, J.; Hájek, J.; Očenášová, P.; Barták, M.; Skácelová, K.; Adamo, P. Comparative analysis of heterogeneity of primary photosynthetic processes within fruticose lichen thalli: Preliminary study of interspecific differences. Czech. Polar Rep. 2014, 4, 149–157. [Google Scholar] [CrossRef] [Green Version]
  31. Mishra, A.; Hájek, J.; Tuháčková, T.; Barták, M.; Mishra, K.B. Features of chlorophyll fluorescence transients can be used to investigate low temperature induced effects on photosystem II of algal lichens from polar regions. Czech. Polar Rep. 2015, 5, 99–111. [Google Scholar] [CrossRef]
  32. Nabe, H.; Funabiki, R.; Kashino, Y.; Koike, H.; Satoh, K. Responses to desiccation stress in Bryophytes and an important role of dithiothreitol-insensitive non-photochemical quenching against photoinhibition in dehydrated states. Plant. Cell Physiol. 2007, 48, 1548–1557. [Google Scholar] [CrossRef] [Green Version]
  33. Barták, M.; Hájek, J.; Morkusová, J.; Skácelová, K.; Košuthová, A. Dehydration-induced changes in spectral reflectance indices and chlorophyll fluorescence of Antarctic lichens with different thallus color, and intrathalline photobiont. Acta Physiol. Plant. 2018, 40, 177–187. [Google Scholar]
  34. Trnková, K.; Barták, M. Desiccation-induced changes in photochemical processes of photosynthesis and spectral reflectance in Nostoc commune (Cyanobacteria, Nostocales) colonies from Antarctica. Phycol. Res. 2017, 65, 44–50. [Google Scholar] [CrossRef]
  35. Kosugi, M.; Miyake, A.; Kasino, Y.; Shibata, Y.; Satoh, K.; Itoh, S. Lichens assist the drought-induced fluorescence quenching of their photobiont green algae through arabitol. In Photosynthesis Research for Food, Fuel and the Future. Advanced Topics in Science and Technology in China; Springer: Berlin/Heidelberg, Germany, 2013; pp. 514–520. [Google Scholar]
  36. Rückamp, M.; Braun, M.; Suckro, S.; Blindow, N. Observed glacial changes on the King George Island ice cap, Antarctica, in the last decade. Glob. Planet. Chang. 2011, 79, 99–109. [Google Scholar] [CrossRef]
  37. Ochyra, R.; Smith, R.I.L.; Bednarek-Ochyra, H. The Illustrated Moss Flora of Antarctica; Cambridge University Press: Cambridge, UK, 2008; p. 704. [Google Scholar]
  38. Andreyev, M.P. The lichens in the vicinity of Bellingshausen Station, King George Island. Polar Geogr. Geol. 1989, 13, 42–45. [Google Scholar] [CrossRef]
  39. Beck, A.; Bechteler, J.; Casanova-Katny, A.; Dzhilyanova, I. The pioneer lichen Placopsis in maritime Antarctica: Genetic diversity of their mycobionts and green algal symbionts, and their correlation with deglaciation time. Symbiosis 2019, 79, 1–24. [Google Scholar] [CrossRef]
  40. Marečková, M.; Barták, M. Effects of short-term low temperature stress on chlorophyll fluorescence transients in Antarctic lichen species. Czech. Polar Rep. 2016, 6, 56–65. [Google Scholar] [CrossRef] [Green Version]
  41. Rouse, J.W.; Haas, R.H.; Schell, J.A.; Deering, D.W. Monitoring vegetation systems in the Great Plains with ERTS. In Proceedings of the Third Earth Resources Technology Satellite–1 Syposium. Volume I: Technical Presentations, NASA SP-351, NASA, Washington, DC, USA, 10–14 December 1973; pp. 309–317. [Google Scholar]
  42. Gamon, J.A.; Peñuelas, J.; Fiels, C.B. A narrow-waveband spectral index that tracks diurnal changes in photosynthetic efficiency. Remote Sens. Environ. 1992, 41, 35–44. [Google Scholar] [CrossRef]
  43. Dufková, K.; Barták, M.; Morkusová, J.; Elster, J.; Hájek, J. Screening of growth phases of Antarctic algae and cyanobacteria cultivated on agar plates by chlorophyll fluorescence imaging. Czech. Polar Rep. 2019, 9, 170–181. [Google Scholar] [CrossRef]
  44. Cho, S.M.; Lee, H.; Hong, S.G.; Lee, J. Study of ecophysiological responses of the antarctic fruticose lichen Cladonia borealis using the PAM fluorescence system under natural and laboratory conditions. Plants 2020, 9, 85. [Google Scholar] [CrossRef] [Green Version]
  45. Uchida, M.; Nakatsubo, T.; Kanda, H.; Koizumi, H. Estimation of the annual primary production of the lichen Cetrariella delisei in a glacier foreland in the high Arctic, Ny-Ålesund, Svalbard. Polar Res. 2006, 25, 39–49. [Google Scholar]
  46. Zúñiga-González, P.; Zúñiga-González, G.E.; Pizzaro, M.; Casanova-Katny, A. Soluble carbohydrate content variation in Sanionia uncinata and Polytrichastrum alpinum, two Antarctic mosses with contrasting desiccation capacities. Biol. Res. 2016, 49, 1–9. [Google Scholar] [CrossRef] [Green Version]
  47. Sancho, L.; De los Ríos, A.; Pintado, A.; Colesie, C.; Raggio, J.; Ascaso, C.; Green, A. Himantormia lugubris, an Antarctic endemic on the edge of the lichen symbiosis. Symbiosis 2020, 82, 49–58. [Google Scholar] [CrossRef]
  48. Barták, M. Lichen Photosynthesis. Scaling from the cellular to the organism level. In The Structural Basis of Biological Energy Generation. Advances in Photosynthesis and Respiration; Hohmann-Marriott, M.F., Ed.; Advances in Photosynthesis and Respiration; Springer: Dordrecht, The Netherlands, 2014; Volume 39, pp. 379–400. [Google Scholar] [CrossRef]
  49. Barták, M.; Trnková, K.; Hansen, E.S.; Hazdrová, J.; Skácelová, K.; Hájek, J.; Forbelská, M. Effect of dehydration on spectral reflectance and photosynthetic efficiency in Umbilicaria arctica and U. hyperborea. Biol. Plant. 2015, 59, 357–365. [Google Scholar] [CrossRef]
  50. Nayaka, S.; Saxena, P. Physiological responses and ecological success of lichen Stereocaulon foliolosum and moss Racomitrium subsecundum growing in same habitat in Himalaya. Indian J. Fundam. Appl. Life Sci. 2014, 4, 167–179. [Google Scholar]
  51. Hovind, A.B.A.; Phinney, N.H.; Gauslaa, Y. Functional trade-off of hydration strategies in old forest epiphytic cephalolichens. Fungal Biol. 2020, 124, 903–913. [Google Scholar] [CrossRef] [PubMed]
  52. Kranner, I.; Beckett, R.; Hochman, A.; Nash, T.H. Desiccation-tolerance in lichens: A review. Bryologist 2008, 111, 576–593. [Google Scholar] [CrossRef]
  53. Heber, U.; Lange, O.L.; Shuvalov, V.A. Conservation and dissipation of light energy as complementary processes: Homoiohydric and poikilohydric autotrophs. J. Exp. Bot. 2006, 57, 1211–1223. [Google Scholar] [CrossRef] [PubMed]
  54. Krause, G.H.; Jahns, P. Non-photochemical energy dissipation determined by chlorophyll fluorescence quenching: Characterization and function. In Chlorophyll a Fluorescence; Springer: Dordrecht, The Netherlands, 2004; Volume 19, pp. 463–495. [Google Scholar]
  55. Zorn, M.; Pfeifhofer, H.W.; Grill, D.; Kranner, I. Responses of plastid pigments to desiccation and rehydration in the desert lichen Ramalina maciformis. Symbiosis 2001, 31, 201–212. [Google Scholar]
  56. MacKenzie, T.D.; MacDonald, T.M.; Dubois, L.A.; Campbell, D.A. Seasonal changes in temperature and light drive acclimation of photosynthetic physiology and macromolecular content in Lobaria pulmonaria. Planta 2001, 214, 57–66. [Google Scholar] [CrossRef] [PubMed]
  57. Kranner, I.; Zorn, M.; Turk, B.; Wornik, S.; Beckett, R.P.; Batič, F. Biochemical traits of lichens differing in relative desiccation tolerance. New Phytol. 2003, 160, 167–176. [Google Scholar] [CrossRef] [Green Version]
  58. Slavnov, C.; Reus, M.; Holzwarth, A.R. Two different mechanisms cooperate in the desiccation-induced excited state quenching in Parmelia lichen. J. Phys. Chem. B 2013, 117, 11326–11336. [Google Scholar] [CrossRef] [PubMed]
  59. Komura, M.; Yamagishi, A.; Shibata, Y.; Iwasaki, I.; Itoh, S. Mechanism of strong quenching of photosystem II chlorophyll fluorescence under drought stress in a lichen, Physciella melanchla, studied by subpicosecond fluorescence spectroscopy. Biochim. Biophys. Acta 2010, 1797, 331–338. [Google Scholar] [CrossRef] [PubMed] [Green Version]
  60. Heber, U. Conservation and dissipation of light energy in desiccation-tolerant photoautotrophs, two sides of the same coin. Photosynth. Res. 2012, 113, 5–13. [Google Scholar] [CrossRef]
  61. Gauslaa, Y.; Solhaug, K.A. Fungal melanins as a sun screen for symbiotic green algae in the lichen Lobaria pulmonaria. Oecologia 2001, 126, 462–471. [Google Scholar] [CrossRef] [PubMed]
  62. Wieners, P.C.; Mudimu, O.; Bilger, W. Desiccation-induced non-radiative dissipation in isolated green lichen algae. Photosynth. Res. 2012, 113, 239–247. [Google Scholar] [CrossRef]
  63. Papageorgiou, G.C.; Tsimilli-Michael, M.; Stamatakis, K. The fast and slow kinetics of chlorophyll a fluorescence induction in plants, algae and cyanobacteria: A viewpoint. Photosynth. Res. 2007, 94, 275–290. [Google Scholar] [CrossRef] [PubMed]
  64. Mishra, K.B.; Vítek, P.; Barták, M. A correlative approach, combining chlorophyll a fluorescence, reflectance, and Raman spectroscopy, for monitoring hydration induced changes in Antarctic lichen Dermatocarpon polyphyllizum. Spectrochim. Acta Part A Mol. Biomol. Spectrosc. 2019, 208, 13–23. [Google Scholar] [CrossRef] [PubMed]
  65. Tsimilli-Michael, M.; Stamatakis, K.; Papageorgiou, G.C. Dark-to-light transition in Synechococcus sp. PCC 7942 cells studied by fluorescence kinetics assesses plastoquinone redox poise in the dark and photosystem II fluorescence component and dynamics during state 2 to state 1 transition. Photosynth. Res. 2009, 99, 243–255. [Google Scholar] [CrossRef] [PubMed]
  66. Kaňa, R.; Kotabová, E.; Komárek, O.; Šedivá, B.; Papageorgiou, G.C.; Govindjee; Prášil, O. The slow S to M fluorescence rise in cyanobacteria is due to a state 2 to state 1 transition. Biochim. Biophys. Acta 2012, 1817, 1237–1247. [Google Scholar] [CrossRef] [Green Version]
  67. Finazzi, G.; Barbagalo, R.P.; Bergo, E.; Barbato, R.; Forti, G. Photoinhibition of Chlamydomonas reinhardtii in State 1 and State 2. Damages to the photosynthetic apparatus under linear and cyclic electron flow. J. Biol. Chem. 2001, 276, 22251–22257. [Google Scholar] [CrossRef] [Green Version]
  68. Mishra, K.B.; Vítek, P.; Mishra, A.; Hájek, J.; Barták, M. Chlorophyll a fluorescence and Raman spectroscopy can monitor activation/deactivation of photosynthesis and carotenoids in Antarctic lichens. Spectrochim. Acta Part A Mol. Biomol. Spectrosc. 2020, 239, 118458. [Google Scholar] [CrossRef]
  69. Ekman, S. The corticolous and lignicolous species of Bacidia and Bacidina in North America. Opera Bot. 1996, 127, 1–139. [Google Scholar]
  70. Barták, M.; Hájek, J.; Amarillo, A.M.; Hazdrová, J.; Carreras, H. Changes in spectral reflectance of selected Antarctic and South American lichens caused by dehydration and artificially-induced absence of secondary compounds. Czech. Polar Rep. 2016, 6, 221–230. [Google Scholar] [CrossRef]
  71. Bechtel, R.; Rivard, B.; Sánchez-Azofeifa, A. Spectral properties of foliose and crustose lichens based on laboratory experiments. Remote Sens. Environ. 2002, 82, 389–396. [Google Scholar] [CrossRef]
  72. Van Der Veen, C.J.; Csatho, B.M. Spectral characteristics of Greenland Lichens. Géogr. Phys. Quat. 2005, 59, 63–73. [Google Scholar] [CrossRef] [Green Version]
  73. Kiang, N.Y.; Siefert, J.; Govindjee; Blankenship, R.E. Spectral signatures of photosynthesis. I. Review of earth organisms. Astrobiology 2007, 7, 222–251. [Google Scholar] [CrossRef] [Green Version]
  74. Kiang, N.Y.; Segura, A.; Tinetti, G.; Govindjee; Blankenship, R.E.; Cohen, M.; Siefert, J.; Crisp, D.; Meadows, V.S. Spectral signatures of photosynthesis. II. Coevolution with other stars and the atmosphere on extrasolar worlds. Astrobiology 2007, 7, 252–274. [Google Scholar] [CrossRef] [PubMed] [Green Version]
  75. Barták, M.; Mishra, K.B.; Marečková, M. Spectral reflectance indices sense desiccation induced changes in the thalli of Antarctic lichen Dermatocarpon polyphyllizum. Czech. Polar Rep. 2018, 8, 249–259. [Google Scholar] [CrossRef]
  76. Gloser, J.; Gloser, V. Changes in spectral reflectance of a foliar lichen Umbilicaria hirsuta during desiccation. Biol. Plant. 2007, 51, 395–398. [Google Scholar] [CrossRef]
  77. Jupa, R.; Hájek, J.; Hazdrová, J.; Barták, M. Interspecific differences in photosynthetic efficiency and spectral reflectance in two Umbilicaria species from Svalbard during controlled desiccation. Czech. Polar Rep. 2012, 2, 31–41. [Google Scholar] [CrossRef] [Green Version]
  78. Granlund, L.; Keski-Saari, S.; Kumpula, T.; Oksanen, E.; Keinanan, M. Imaging lichen water content with visible to mid-wave infrared (400–5500 nm) spectroscopy. Remote Sens. Environ. 2018, 216, 301–310. [Google Scholar] [CrossRef]
Figure 1. Map of the Antarctic Peninsula showing the northern part of the South Shetlands Archipelago (left) and the localization of King George Island (South Shetlands, Antarctica). The point indicates Fildes Peninsula (right) according to the data set in https://doi.org/10.5285/ad7d345a-0650-4f44-b7eb-c48e1999086b (accessed on 1 February 2021).
Microorganisms 09 00818 g001
Figure 2. In situ morphology and the anatomical characteristics of Antarctic lichens used in the experiments showing the four thalline layers, upper cortex (UC), green-algae layer (A), medulla (M), and lower cortex (LC). (a,b) the foliose Parmelia saxatilis; (c,d) a fruticulose specimen of Himantormia lugubris; (e,f): the microfruticolose cushion Lecania brialmontii (bar = 100 μm). Photo credit: A. Casanova-Katny.
Microorganisms 09 00818 g002
Figure 3. In situ morphology and anatomical characteristics of Antarctic lichens used in the experiments showing the four thalline layers, upper cortex (UC), green-algae layer (A), medulla (M), cephalodium (C), and lower cortex (LC). (a) the crustose Placopsis antarctica thallus; (b) green photobiont section, (c) cephalodium section; (d,e) the fruticolose Ramalina terebrata (bar = 100 μm). Photo credit: A. Casanova-Katny and A. Beck (R. terebrata).
Microorganisms 09 00818 g003
Figure 4. Desiccation response curve of FV/FM in experimental lichen species desiccating from a wet (RWC = 100%) to a dry state (RWC = 0%) expressed in the decadic (left) and logarithmic RWC (right) scales. The fits with distinguishable S-curves at a RWC of below 20% are presented for the algal and cyanobacterial (cephalodium) parts of Placopsis antarctica. The inset shows a linear fit through the H. lugubris and P. antractica (cephalodium) data points within the RWC range of 30–100%.
Microorganisms 09 00818 g004
Figure 5. Desiccation response curve of effective quantum yield (ΦPSII) in experimental lichen species desiccating from a wet (RWC = 100%) to a dry state (RWC = 0%) expressed in decadic (left) and logarithmic RWC (right) scales. The fits with distinguishable S-curves at a RWC of below 20% are presented for the algal and cyanobacterial (cephalodium) parts of Placopsis antarctica. The inset shows a linear fit through the H. lugubris and P. antractica (cephalodium) datapoints within the RWC range of 30–100%.
Microorganisms 09 00818 g005
Figure 6. Desiccation response curve of steady-state chlorophyll fluorescence (FS—(left) panel) and nonphotochemical quenching (NPQ—(right) panel) in Antarctic lichens desiccating from a wet (RWC = 100%) to a dry state (RWC = 0%).
Microorganisms 09 00818 g006
Figure 7. Slow Kautsky kinetics recorded for desiccating lichens at five different RWCs, which varied according to the lichen species. Ramalina terebrata (RWC = 100%, 65%, 16%, 5%, 0.1%), Himantormia lugubris (RWC = 100%, 65%, 16%, 6%, 3%), Parmelia saxatilis (RWC = 100%, 72%, 22%, 9%, 3%), Lecania brialmontii (RWC = 100%, 67%, 19%, 9%, 4%), Placopsis antarctica (RWC = 100%, 62%, 19%, 5%, 1%), and P. antarctica cephalodium (RWC = 100%, 62%, 19%, 5%, 1%). The RWC values are provided in the following different colors: 100% = soft green; 62–72% = deep green; 16–22% = orange; 5–9% = violet; 0.1–4% = red. The time axis (x) is given in a log scale. The O, P, S, M, and T points are indicated for R. terebrata and Placopsis antarctica (algal part of the thallus). The chlorophyll fluorescence signal is shown with different scales according to the species-specific values.
Microorganisms 09 00818 g007
Figure 8. Spectral reflectance curves recorded for experimental lichen species in dry (RWC = 0%) and wet (RWC = 100%) states of the thallus.
Microorganisms 09 00818 g008
Table 1. Antarctic lichen species used in the study from Fildes Peninsula, King George Island. The species’ details were obtained from field observation and using [1,2,39].
Lichen FamilyLichen SpeciesPhotobiontThallus MorphotypeEcology and Distribution
ParmeliaceaParmelia saxatilis (L.) AchTrebouxioidFolioseCosmopolitan species with southern limit in Antarctica, on rocks, boulders, stones, and mosses, and on dry to moist rock faces. Apothecia not observed in Antarctica.
Himantormia lugubris (Hue) I.M. LambTrebouxioidFruticoseEndemic in Antarctica. Preferentially saxicolous on acidic rocks and abundant on the southern part of Fildes Peninsula and Ardley Island, where it forms several patches on soil or moss. In nitrophobic communities, growing above 70 m.a.s.l.
RamalinaceaLecania brialmontii (Vain.) Zahlbr.TrebouxioidFruticoseEndemic in Antarctica. Preferentially saxicolous, grows on rocks and moist and shaded sites, typical for ornithocoprophilous lichen communities.
Ramalina terebrata Hook. F. & TaylorTrebouxioidFruticoseCosmopolitan species with southern limit in Antarctica. Saxicolous, grows on costal cliffs and large boulders, typical for ornithocoprophilous lichen communities. Apothecia not observed in Antarctica.
TrapeliaceaePlacopsis antarctica, D.J. Galloway, R.I.L. Sm. & QuilhotStichococcus antarcticus; or S. allasCrustoseEndemic in Antarctica. Grows in nitrophobic communities. Cyanobacteria in cephalodia, with species of Nostoc.
Table 2. List of used spectral reflectance indices with equations and referenced sources.
Spectral Reflectance IndicesEquationReferences
Normalized Difference Vegetation Index (NDVI)NDVI = (R780 − R670)/(R780 + R670)[41] Rouse et al. (1974)
Photochemical Reflectance Index (PRI)PRI = (R531 − R570)/(R531 + R570)[42] Gamon et al. (1992)
Table 3. Regression coefficient (R2) for the nonlinear relationships between Fs (steady-state chlorophyll fluorescence and potential (FV/FM) and effective quantum yields of PSII (ΦPSII) for lichen species. The regression model was a fourth order polynomial.
Lichen SpeciesR2 for Fs Versus
FV/FMΦPSII
Parmelia saxatilis0.97770.9804
Himantormia lugubris0.52650.3106
Lecania brialmontii0.97680.9752
Placopsis antarctica—algal part0.99660.9954
Placopsis antarctica—cephalodium0.47660.8825
Ramalina terebrata0.90980.9211
Table 4. Parameters derived from the O, P, S, M, T curves (means of five replicates per species and particular RWC). The values were distinguished on the slow Kautsky kinetics recorded for the experimental lichen species during their desiccation from a wet (RWC = 100%) to a dry state (RWC below 5%).
Lichen SpeciesRWC (%)Parameters
P/SP/MS/MM/TO/PO/T
Lecania brialmontii1000.9900.9911.0001.0580.9050.949
670.9870.9840.9971.0320.9100.925
190.9961.0061.0101.0110.9020.918
91.0000.9980.9981.0370.9070.939
41.0041.0030.9991.0510.9621.014
Himantormia lugubris1000.9730.9110.9361.0810.9420.927
650.9840.9300.9451.0710.9370.933
161.0090.9820.9741.0450.9420.968
61.0151.0060.9921.0780.9661.047
31.0041.0071.0031.0020.9951.004
P. antarctica algal part1001.0601.0420.9831.1010.8220.943
621.0000.9930.9931.0180.9570.968
191.0151.0221.0071.1050.9311.051
51.0171.0120.9951.1100.9101.022
11.0030.9990.9961.0240.9871.009
P. antarctica cephalodium1001.0080.9910.9831.0050.9500.947
621.0010.9950.9951.0170.9580.969
191.0091.0040.9961.0850.9381.022
51.0161.0311.0151.0870.9151.025
11.0271.0100.9841.0010.9320.943
Ramalina terebrata1000.9730.9530.9791.0920.8550.890
650.9820.9630.9811.0740.8790.909
160.9700.9560.9861.0970.8990.944
50.9870.9891.0021.0900.9301.002
0.50.9990.9980.9991.0000.9950.993
Parmelia saxatilis1000.9630.8980.9321.1360.8710.888
720.9630.9430.9791.0960.8700.899
220.9700.9530.9831.0750.8780.900
91.0070.9810.9741.0580.9410.976
31.0101.0431.0331.0290.9721.043
Table 5. Means of spectral indices (NDVI, PRI) recorded for dry and wet thalli of the five Antarctic lichen species (means of five replicates per species in wet and dry state). Different upper index letters indicate statistically significant differences at p ≤ 0.05.
Spectral IndexState of the ThallusLichens Species
Himantormia lugubrisLecania brialmontiiRamalina terebrataParmelia saxatilisPlacopsis antarctica (green algae)Placopsis antarctica cephalodium
NDVIDry0.329 a0.213 a0.2120.152 a0.033 a0.190 a
Wet0.23 b0.39 b0.300 b0.060 b0.143 b0.211 a
PRIDry−0.059 a−0.038 a−0.058 a−0.061 a0.003 a−0.056 a
Wet−0.029 b−0.039 a−0.054 a−0.075 a−0.082 b−0.077 b
Publisher’s Note: MDPI stays neutral with regard to jurisdictional claims in published maps and institutional affiliations.

