Batch and Continuous Lactic Acid Fermentation Based on A Multi-Substrate Approach

 ,
, 
 , and
, and 
Abstract
1. Introduction
2. Materials and Methods
2.1. Substrates
2.2. Microorganism Used and Inoculum Preparation
2.3. Substrate Preparation
2.4. Fermentation
2.5. Analytical Methods
3. Results
3.1. Substrate Composition
3.2. Batch Fermentations
3.3. Continuous Fermentations
4. Discussion
5. Conclusions
Author Contributions
Funding
Conflicts of Interest
References
- Grand View Research. Lactic Acid Market Size, Share & Trends Analysis Report By Raw Material (Sugarcane, Corn, Cassava), by Application (Industrial, F&B, Pharmaceuticals, Personal Care, PLA), And Segment Forecasts, 2018–2025; Grand View Research: San Francisco, CA, USA, 2019. [Google Scholar]
- Ioannidou, S.M.; Pateraki, C.; Ladakis, D.; Tsakona, M.; Vlysidis, A.; Kookos, I.K. Sustainable production of bio-based chemicals and polymers via integrated biomass refining and bioprocessing in a circular bioeconomy context. Bioresour. Technol. 2020, 123093. [Google Scholar] [CrossRef]
- González, M.I.; Álvarez, S.; Riera, F.; Álvarez, R. Economic evaluation of an integrated process for lactic acid production from ultrafiltered whey. J. Food Eng. 2007, 80, 553–561. [Google Scholar] [CrossRef]
- Alves de Oliveira, R.; Komesu, A.; Vaz Rossell, C.E.; Maciel Filho, R. Challenges and opportunities in lactic acid bioprocess design—From economic to production aspects. Biochem. Eng. J. 2018, 133, 219–239. [Google Scholar] [CrossRef]
- Cubas-Cano, E.; González-Fernández, C.; Ballesteros, I.; Tomás-Pejó, E. Efficient utilization of hydrolysates from steam-exploded gardening residues for lactic acid production by optimization of enzyme addition and pH control. Waste Manag. 2020, 107, 235–243. [Google Scholar] [CrossRef] [PubMed]
- Pleissner, D.; Demichelis, F.; Mariano, S.; Fiore, S.; Schneider, R.; Venus, J.; Michelle, I.; Guti, N. Direct production of lactic acid based on simultaneous sacchari fi cation and fermentation of mixed restaurant food waste. J. Clean. Prod. 2017, 143, 615–623. [Google Scholar] [CrossRef]
- López-Gómez, J.P.; Unger, P.; Schneider, R.; Venus, J. From Upstream to Purification: Production of Lactic Acid from the Organic Fraction of Municipal Solid Waste. Waste Biomass Valorization 2020, 1–8. [Google Scholar] [CrossRef]
- López-Gómez, J.P.; Latorre-Sánchez, M.; Unger, P.; Schneider, R.; Coll Lozano, C.; Venus, J.; Lozano, C.C.; Venus, J. Assessing the organic fraction of municipal solid wastes for the production of lactic acid. Biochem. Eng. J. 2019, 150, 107251. [Google Scholar] [CrossRef]
- Alves de Oliveira, R.; Schneider, R.; Lunelli, B.H.; Rossell, C.E.V.; Filho, R.M.; Venus, J. A Simple Biorefinery Concept to Produce 2G-Lactic Acid from Sugar Beet Pulp (SBP): A High-Value Target Approach to Valorize a Waste Stream. Molecules 2020, 25, 2113. [Google Scholar] [CrossRef] [PubMed]
- Ahring, B.K.; Traverso, J.J.; Murali, N.; Srinivas, K. Continuous fermentation of clarified corn stover hydrolysate for the production of lactic acid at high yield and productivity. Biochem. Eng. J. 2016, 109, 162–169. [Google Scholar] [CrossRef]
- Putra, M.D.; Abasaeed, A.E. A more generalized kinetic model for binary substrates fermentations. Process Biochem. 2018, 75, 31–38. [Google Scholar] [CrossRef]
- Calderon, M.; Loiseau, G.; Guyot, J.P. Fermentation by Lactobacillus fermentum Ogi E1 of different combinations of carbohydrates occurring naturally in cereals: Consequences on growth energetics and α-amylase production. Int. J. Food Microbiol. 2003, 80, 161–169. [Google Scholar] [CrossRef]
- Kwon, Y.J.; Engler, C.R. Kinetic models for growth and product formation on multiple substrates. Biotechnol. Bioprocess. Eng. 2005, 10, 587–592. [Google Scholar] [CrossRef]
- Burgos-Rubio, C.N.; Okos, M.R.; Wankat, P.C. Kinetic Study of the Conversion of Different Substrates to Lactic Acid Using Lactobacillus bulgaricus. Biotechnol. Prog. 2000, 16, 305–314. [Google Scholar] [CrossRef]
- Lu, H.; Zhao, X.; Wang, Y.; Ding, X.; Wang, J.; Garza, E.; Manow, R.; Iverson, A.; Zhou, S. Enhancement of D-lactic acid production from a mixed glucose and xylose substrate by the Escherichia coli strain JH15 devoid of the glucose effect. BMC Biotechnol. 2016, 16, 19. [Google Scholar] [CrossRef] [PubMed]
- Zabaniotou, A. Redesigning a bioenergy sector in EU in the transition to circular waste-based Bioeconomy—A multidisciplinary review. J. Clean. Prod. 2018, 177, 197–206. [Google Scholar] [CrossRef]
- Bonk, F.; Bastidas-Oyanedel, J.R.; Yousef, A.F.; Schmidt, J.E.; Bonk, F. Exploring the selective lactic acid production from food waste in uncontrolled pH mixed culture fermentations using different reactor configurations. Bioresour. Technol. 2017, 238, 416–424. [Google Scholar] [CrossRef]
- Tashiro, Y.; Inokuchi, S.; Poudel, P.; Okugawa, Y.; Miyamoto, H.; Miayamoto, H.; Sakai, K. Novel pH control strategy for efficient production of optically active l-lactic acid from kitchen refuse using a mixed culture system. Bioresour. Technol. 2016, 216, 52–59. [Google Scholar] [CrossRef]
- Peinemann, J.C.; Rhee, C.; Shin, S.G.; Pleissner, D. Non-sterile fermentation of food waste with indigenous consortium and yeast–Effects on microbial community and product spectrum. Bioresour. Technol. 2020, 306, 123175. [Google Scholar] [CrossRef]
- Tang, J.; Wang, X.; Hu, Y.; Zhang, Y.; Li, Y. Lactic acid fermentation from food waste with indigenous microbiota: Effects of pH, temperature and high OLR. Waste Manag. 2016, 52, 278–285. [Google Scholar] [CrossRef]
- Su, F.; Xu, P. Genomic analysis of thermophilic Bacillus coagulans strains: Efficient producers for platform bio-chemicals. Sci. Rep. 2014, 4, 3926. [Google Scholar] [CrossRef]
- Aulitto, M.; Fusco, S.; Bartolucci, S.; Franzén, C.J.; Contursi, P. Bacillus coagulans MA-13: A promising thermophilic and cellulolytic strain for the production of lactic acid from lignocellulosic hydrolysate. Biotechnol. Biofuels 2017, 10, 210. [Google Scholar] [CrossRef] [PubMed]
- Alves de Oliveira, R.; Schneider, R.; Vaz Rossell, C.E.; Maciel Filho, R.; Venus, J. Polymer grade l-lactic acid production from sugarcane bagasse hemicellulosic hydrolysate using Bacillus coagulans. Bioresour. Technol. Rep. 2019, 6, 26–31. [Google Scholar] [CrossRef]
- Sakai, K.; Ezaki, Y. Open L-lactic acid fermentation of food refuse using thermophilic Bacillus coagulans and fluorescence in situ hybridization analysis of microflora. J. Biosci. Bioeng. 2006, 101, 457–463. [Google Scholar] [CrossRef] [PubMed]
- Pleissner, D.; Neu, A.K.; Mehlmann, K.; Schneider, R.; Puerta-Quintero, G.I.; Venus, J. Fermentative lactic acid production from coffee pulp hydrolysate using Bacillus coagulans at laboratory and pilot scales. Bioresour. Technol. 2016, 218, 167–173. [Google Scholar] [CrossRef] [PubMed]
- Dietz, D.; Schneider, R.; Papendiek, F.; Venus, J. Leguminose green juice as an efficient nutrient for L(+)-lactic acid production. J. Biotechnol. 2016, 236, 26–34. [Google Scholar] [CrossRef] [PubMed]
- Alexandri, M.; Neu, A.; Schneider, R.; Pablo, L.; Venus, J. Evaluation of various Bacillus coagulans isolates for the production of high purity L-lactic acid using defatted rice bran hydrolysates. Int. J. Food Sci. Technol. 2018, 1321–1329. [Google Scholar] [CrossRef]
- Abdel-Banat, B.M.A.; Hoshida, H.; Ano, A.; Nonklang, S.; Akada, R. High-temperature fermentation: How can processes for ethanol production at high temperatures become superior to the traditional process using mesophilic yeast? Appl. Microbiol. Biotechnol. 2010, 85, 861–867. [Google Scholar] [CrossRef] [PubMed]
- Olszewska-Widdrat, A.; Alexandri, M.; López-Gómez, J.P.; Schneider, R.; Mandl, M.; Venus, J. Production and Purification of l-lactic Acid in Lab and Pilot Scales Using Sweet Sorghum Juice. Fermentation 2019, 5, 36. [Google Scholar] [CrossRef]
- ISO 15681-1. Water Quality—Determination of Orthophosphate and Total Phosphorus Contents by Flow Analysis (FIA and CFA)—Part 1: Method by Flow Injection Analysis (FIA) Qualité; ISO Copyright Office: Geneva, Switzerland, 2003. [Google Scholar]
- Chandrapala, J.; Duke, M.C.; Gray, S.R.; Weeks, M.; Palmer, M.; Vasiljevic, T. Strategies for maximizing removal of lactic acid from acid whey–Addressing the un-processability issue. Sep. Purif. Technol. 2017, 172, 489–497. [Google Scholar] [CrossRef]
- Chen, G.Q.; Eschbach, F.I.I.; Weeks, M.; Gras, S.L.; Kentish, S.E. Removal of lactic acid from acid whey using electrodialysis. Sep. Purif. Technol. 2016, 158, 230–237. [Google Scholar] [CrossRef]
- López-Gómez, J.P.; Alexandri, M.; Schneider, R.; Venus, J. A review on the current developments in continuous lactic acid fermentations and case studies utilising inexpensive raw materials. Process Biochem. 2019. [Google Scholar] [CrossRef]
- Payot, T.; Chemaly, Z.; Fick, M. Lactic acid production by Bacillus coagulans-Kinetic studies and optimization of culture medium for batch and continuous fermentations. Enzyme Microb. Technol. 1999, 24, 191–199. [Google Scholar] [CrossRef]
- Kwan, T.H.; Hu, Y.; Lin, C.S.K. Valorisation of food waste via fungal hydrolysis and lactic acid fermentation with Lactobacillus casei Shirota. Bioresour. Technol. 2016, 217, 129–136. [Google Scholar] [CrossRef] [PubMed]
- Nguyen, C.M.; Choi, G.J.; Choi, Y.H.; Jang, K.S.; Kim, J.C. D- and l-lactic acid production from fresh sweet potato through simultaneous saccharification and fermentation. Biochem. Eng. J. 2013, 81, 40–46. [Google Scholar] [CrossRef]
- Panesar, P.S.; Kennedy, J.F.; Knill, C.J.; Kosseva, M.; Patel, S.A.; Parikh, S.C. Production of L(+) Lactic Acid using Lactobacillus casei from Whey. Int. J. Curr. Microbiol. Appl. Sci. 2010, 5, 734–741. [Google Scholar] [CrossRef]
- Taleghani, H.G.; Najafpour, G.D.; Ghoreyshi, A.A. A study on the effect of parameters on lactic acid production from whey. Pol. J. Chem. Technol. 2016, 18, 58–63. [Google Scholar] [CrossRef]
- Mladenović, D.D.; Djukić-Vuković, A.P.; Kocić-Tanackov, S.D.; Pejin, J.D.; Mojović, L.V. Lactic acid production on a combined distillery stillage and sugar beet molasses substrate. J. Chem. Technol. Biotechnol. 2016, 91, 2474–2479. [Google Scholar] [CrossRef]
- Abdel-Rahman, M.A.; Tan, J.; Tashiro, Y.; Zendo, T.; Sakai, K.; Sonomoto, K. Non-carbon loss long-term continuous lactic acid production from mixed sugars using thermophilic Enterococcus faecium QU 50. Biotechnol. Bioeng. 2020, 1673–1683. [Google Scholar] [CrossRef]
- Sun, Y.; Xu, Z.; Zheng, Y.; Zhou, J.; Xiu, Z. Efficient production of lactic acid from sugarcane molasses by a newly microbial consortium CEE-DL15. Process Biochem. 2019, 81, 132–138. [Google Scholar] [CrossRef]
- Klotz, S.; Kuenz, A.; Prüße, U. Nutritional requirements and the impact of yeast extract on the d-lactic acid production by Sporolactobacillus inulinus. Green Chem. 2017, 19, 4633–4641. [Google Scholar] [CrossRef]
- Wang, Y.; Yang, Z.; Qin, P.; Tan, T. Fermentative l-(+)-lactic acid production from defatted rice bran. RSC Adv. 2014, 4, 8907. [Google Scholar] [CrossRef]
- Pleissner, D.; Lau, Y.; Zhang, C.; Sze, C.; Lin, K. Plasticizer and Surfactant Formation from Food-Waste- and Algal Biomass-Derived Lipids. ChemSusChem 2015, 1–7. [Google Scholar] [CrossRef]
- Peinemann, J.C.; Demichelis, F.; Fiore, S.; Pleissner, D. Techno-economic assessment of non-sterile batch and continuous production of lactic acid from food waste. Bioresour. Technol. 2019, 289, 121631. [Google Scholar] [CrossRef] [PubMed]
- Wee, Y.J.; Ryu, H.W. Lactic acid production by Lactobacillus sp. RKY2 in a cell-recycle continuous fermentation using lignocellulosic hydrolyzates as inexpensive raw materials. Bioresour. Technol. 2009, 100, 4262–4270. [Google Scholar] [CrossRef]


| Component | Acid Whey | Molasses (240 g·L−1) | Sugar Bread (SB) | Alfalfa Juice | Tapioca (% DW) |
|---|---|---|---|---|---|
| Glucose (g·L−1) | BDL | 56.6 | 3.96 | 4.57 | 13.81% DW (Starch 95.02% DW) |
| Fructose (g·L−1) | 14.48 | 17.0 | 0.90 | 4.68 | |
| Galactose (g·L−1) | BDL | BDL | BDL | BDL | n.d. |
| Disaccharides (g·L−1) | 397 | 505 | 22.91 | 1.42 | n.d. |
| Lactose (g·L−1) | 419 | BDL | BDL | BDL | n.d. |
| Lactic acid (g·L−1) | 30.71 | 29.7 | BDL | BDL | n.d. |
| Total nitrogen (mg·L−1) | 8370.00 | 18,922 | 14,514 a | 2078 | 0.022% DW |
| Total phosphorus (mg·L−1) | 8525.00 | 39.5 | 1863 a | 220 | n.d. |
| Cl− (mg·L−1) | 54,522 | 1766 | n.d. | 672 | n.d. |
| SO42+ (mg·L−1) | 6475 | 7177 | n.d. | 906 | n.d. |
| Na+ (mg·L−1) | 28,414 | 10,258 | n.d. | 26.5 | n.d. |
| K+ (mg·L−1) | 56,456 | 36,048 | n.d. | 2809 | n.d. |
| Mg2+ (mg·L−1) | 1273 | 38.6 | n.d. | 233 | n.d. |
| Ca2+ (mg·L−1) | 1910 | 1061 | n.d. | 899 | n.d. |
| Component | Acid Whey Microfilter. 0.2 µm, Diluted, Autoclaved at 121 °C | Molasses Diluted and Sterilised at 121 °C | SB Hydrolysate | Alfalfa Juice Microfilter. 0.2 µm | Tapioca Hydrolysate | Yeast Extract |
|---|---|---|---|---|---|---|
| Glucose (g·L−1) | 0.75 | 12.2 | 76.9 | 4.60 | 141.6 | BDL |
| Fructose (g·L−1) | n.d. | 10.7 | 9.98 | 10.3 | BDL | |
| Galactose (g·L−1) | 5.44 | n.d. | n.d. | n.d. | n.d. | n.d. |
| Disaccharides (g·L−1) | n.d. | 109 (sucrose) | 38.5 (sucrose) | n.d. | 3.34 | 1.08 a |
| Lactose (g·L−1) | 122 | n.d. | n.d. | n.d. | n.d. | n.d. |
| Lactic acid (g·L−1) | 7.62 | 6.34 | n.d. | n.d. | n.d. | n.d. |
| Total nitrogen (mg·L−1) | 1233 | 4516 | 193 | 1086 | 25 | 106.7 b |
| Total phosphorus (mg·L−1) | 2601 | 32 | 164 | 463 | 36 | 15.7 b |
| Cl− (mg·L−1) | 12,411 | 479 | 175 | 632 | 23 | n.d. |
| SO42+ (mg·L−1) | 1261.0 | 1718.0 | 73.4 | 398.5 | 25.1 | n.d. |
| Na+ (mg·L−1) | 5134 | 2121 | 318 | 22 | 44 | 3.11 b |
| K+ (mg·L−1) | 10,600 | 7821 | 225 | 2619 | 50 | 31.33 b |
| Mg2+ (mg·L−1) | 255.4 | 9.5 | 27.2 | 170.6 | 5.2 | 1.58 b |
| Ca2+ (mg·L−1) | 537.7 | 227.1 | 72.3 | 507.2 | 9.5 | 0.57 b |
| Total Carbon (g·L−1) | 56.89 | 34.64 | 50.96 | 5.96 | 58.04 | 0.45 |
| Substrate | Total Sugars (g·L−1) | Yield (g·g−1) | Pg (g·L−1·h−1) | Pmax (g·L−1·h−1) | LA (g·L−1) | LA Optical Purity (%) |
|---|---|---|---|---|---|---|
| Acid whey (a) | 107.30 | 0.85 | 2.84 | 5.72 | 90.95 | 99.2 |
| Acid whey (b) | 107.94 | 0.85 | 1.77 | 4.93 | 92.08 | 99.1 |
| Molasses (c) | 143.39 | 0.88 | 2.00 | 7.62 | 93.80 | 98.0 |
| Molasses (d) | 132.37 | 0.90 | 1.89 | 4.13 | 87.70 | 98.0 |
| Sugar bread (e) | 120.41 | 0.85 | 2.67 | 9.26 | 80.00 | 99.6 |
| Sugar bread (f) | 119.50 | 0.74 | 3.00 | 8.86 | 77.84 | 99.6 |
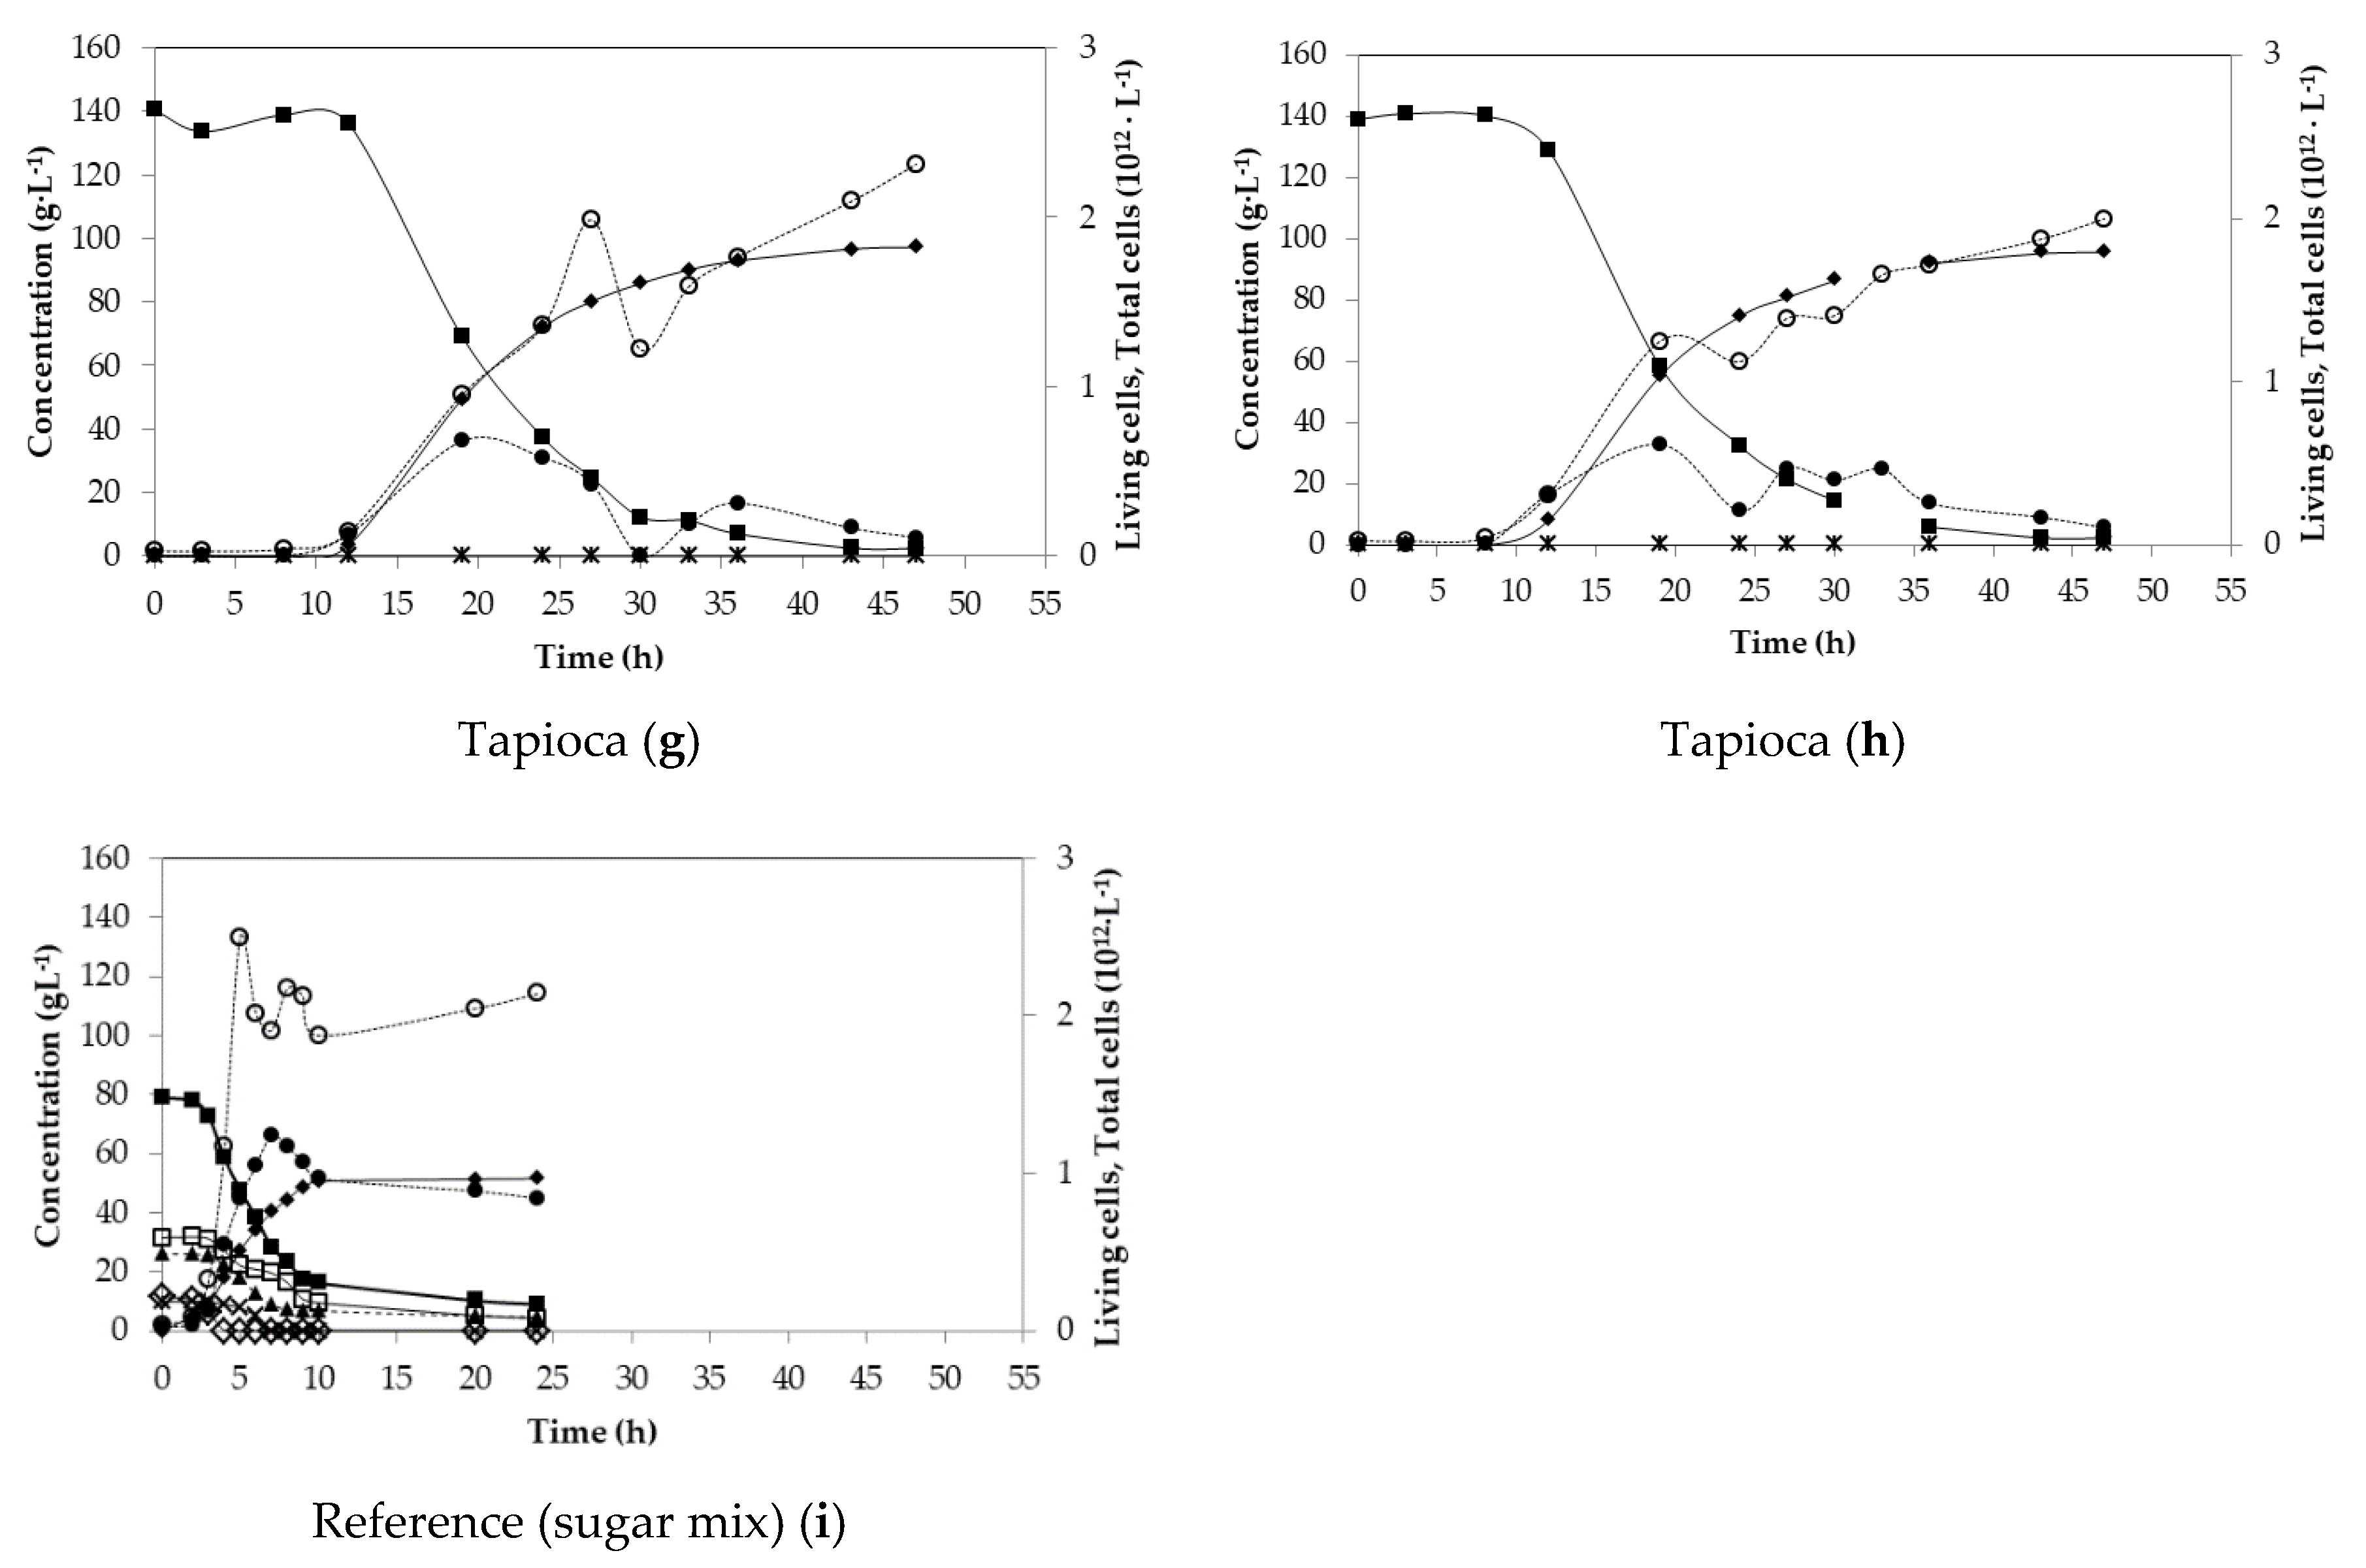
| Tapioca (g) | 140.45 | 0.93 | 2.25 | 6.57 | 96.64 | n.d. |
| Tapioca (h) | 139.12 | 0.90 | 2.22 | 6.70 | 95.26 | n.d. |
| Sugar mix (i) | 78.90 | 0.79 | 2.15 | 9.28 | 51.51 | 99.8 |
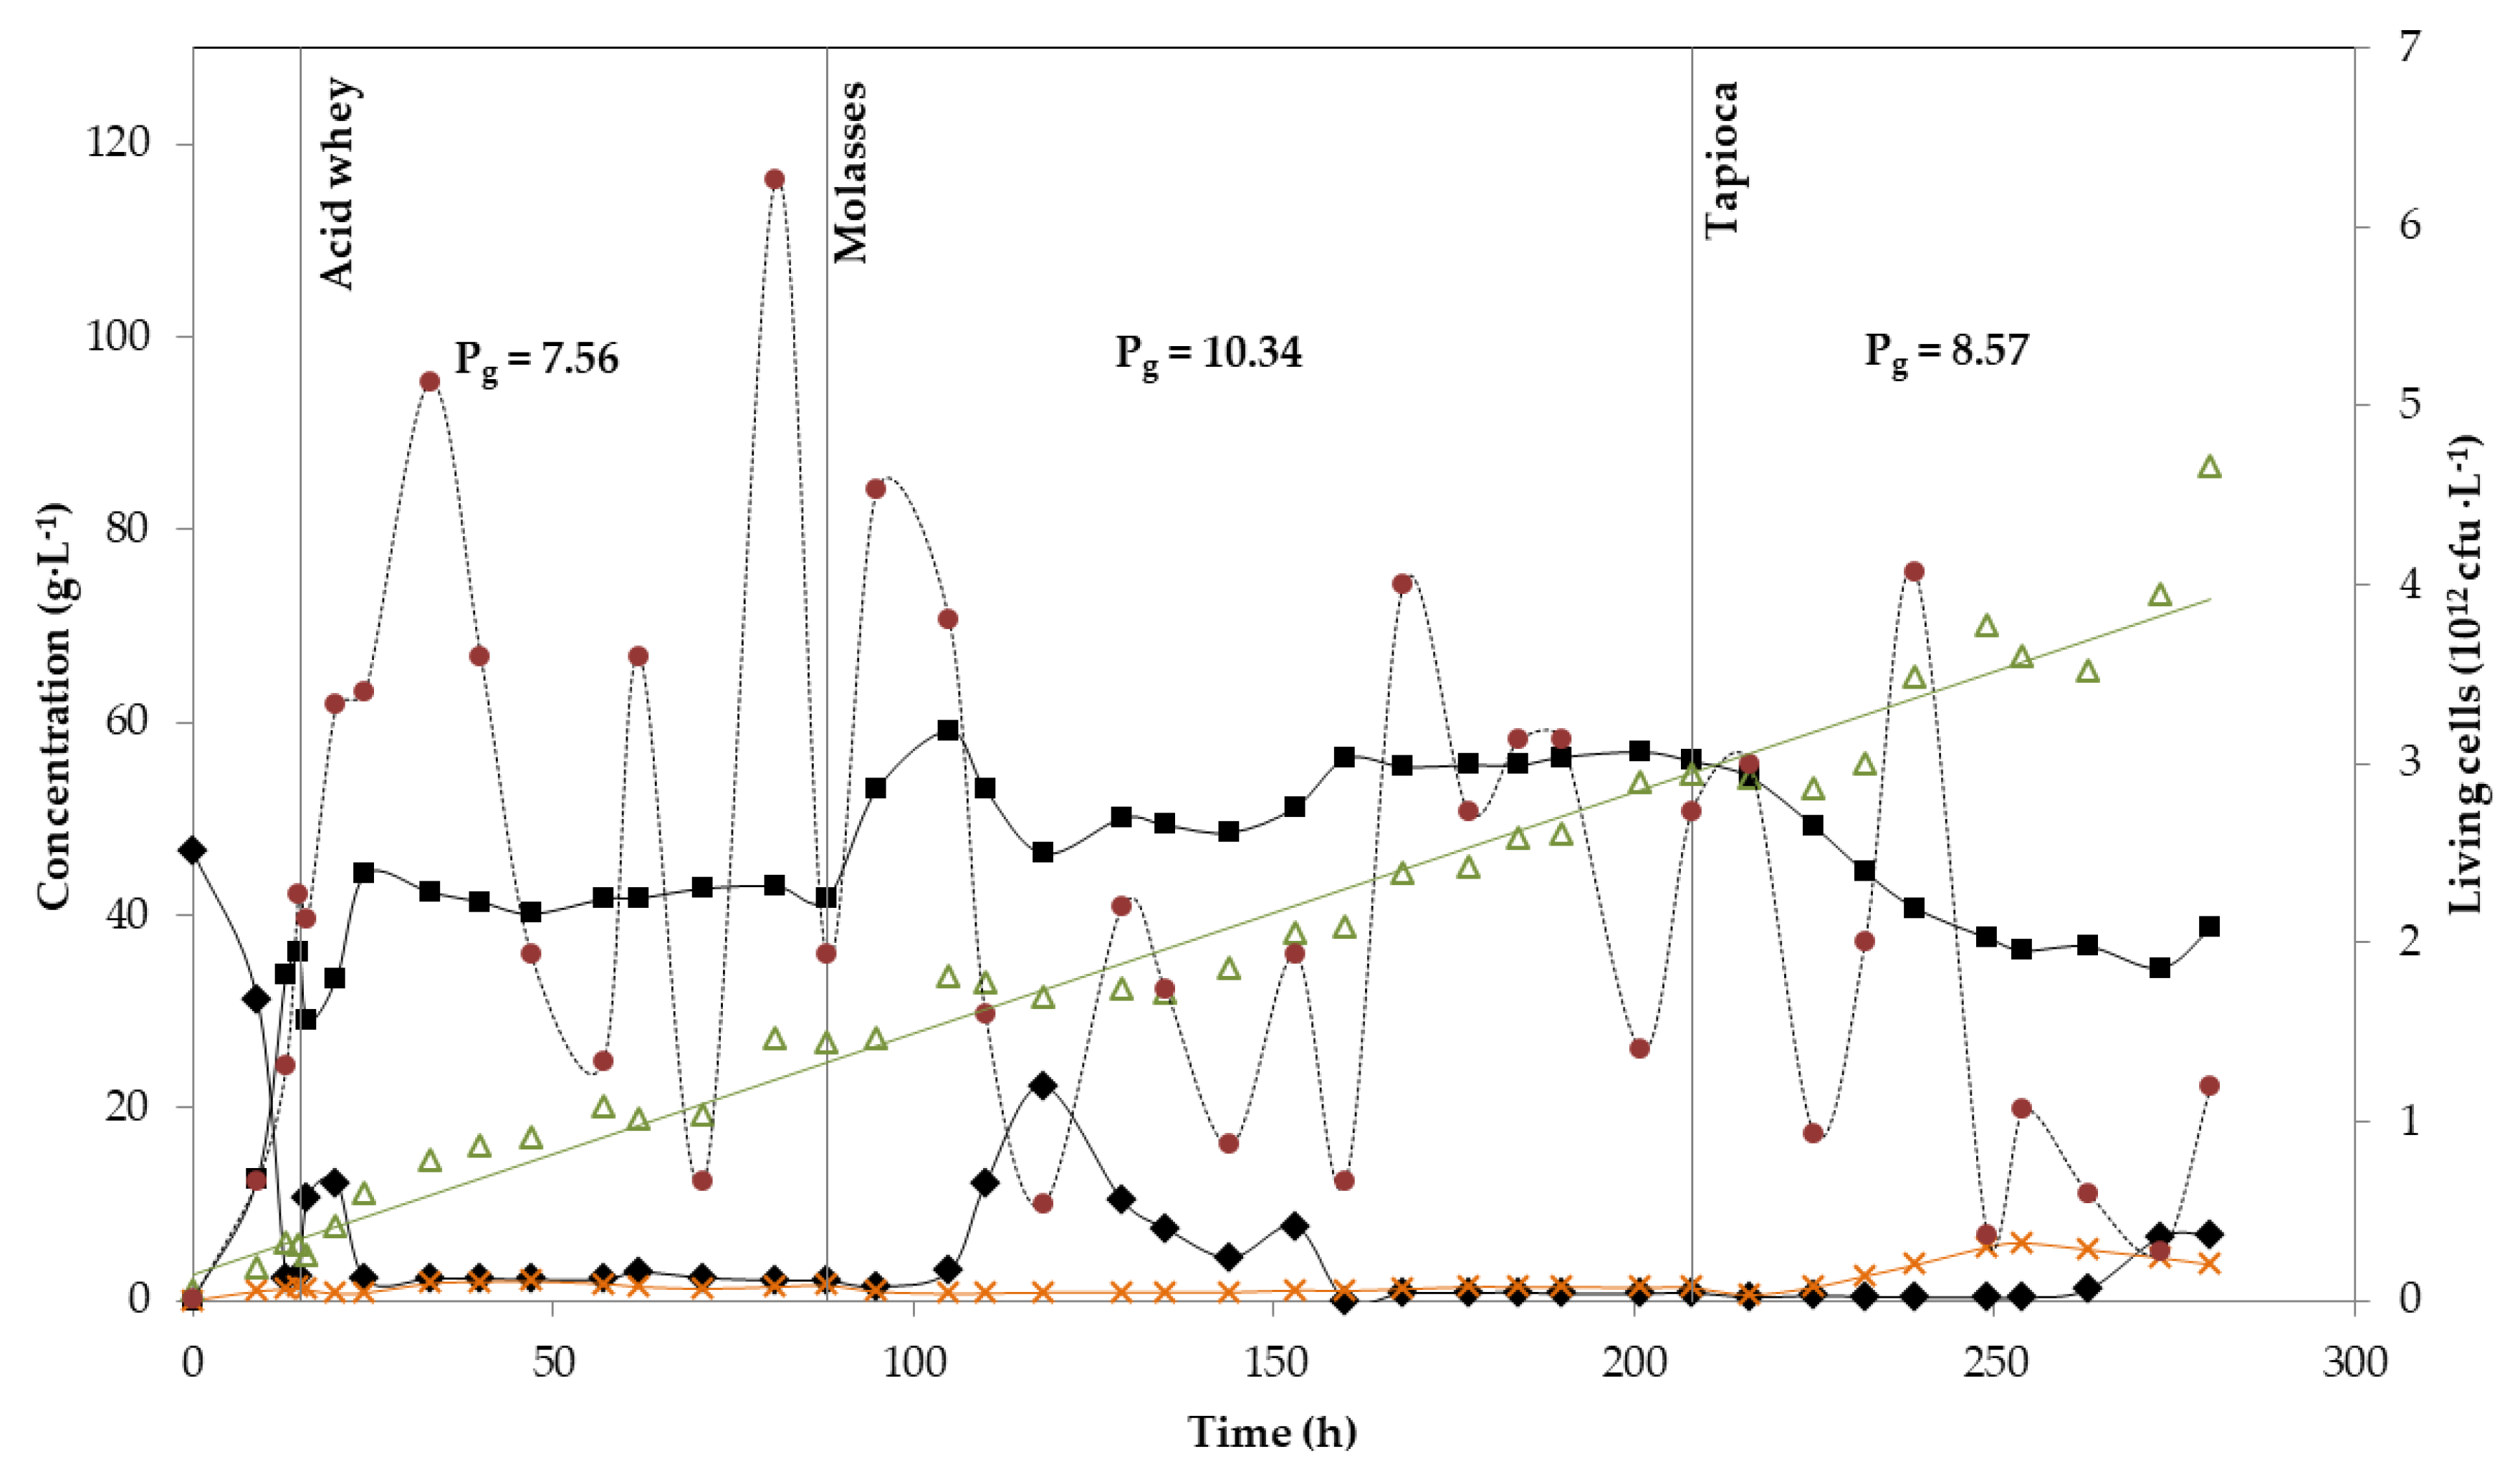
| Parameter | Acid Whey | Molasses | Sugar Bread | Sugar Bread: Green Juice | Molasses | Acid Whey | Tapioca |
|---|---|---|---|---|---|---|---|
| Pg (g·L−1·h−1) | 7.56 */7.31 | 10.34 */9.55 | 8.49 | 8.44 | 10.31 | 6.62 | 8.57 * |
| Yield (g·g−1) | 0.74 */0.66 | 0.86 */0.76 | 0.76 | 0.68 | 0.78 | 0.87 | 0.70 * |
© 2020 by the authors. Licensee MDPI, Basel, Switzerland. This article is an open access article distributed under the terms and conditions of the Creative Commons Attribution (CC BY) license (http://creativecommons.org/licenses/by/4.0/).
Share and Cite
Olszewska-Widdrat, A.; Alexandri, M.; López-Gómez, J.P.; Schneider, R.; Venus, J. Batch and Continuous Lactic Acid Fermentation Based on A Multi-Substrate Approach. Microorganisms 2020, 8, 1084. https://doi.org/10.3390/microorganisms8071084
Olszewska-Widdrat A, Alexandri M, López-Gómez JP, Schneider R, Venus J. Batch and Continuous Lactic Acid Fermentation Based on A Multi-Substrate Approach. Microorganisms. 2020; 8(7):1084. https://doi.org/10.3390/microorganisms8071084
Chicago/Turabian StyleOlszewska-Widdrat, Agata, Maria Alexandri, José Pablo López-Gómez, Roland Schneider, and Joachim Venus. 2020. "Batch and Continuous Lactic Acid Fermentation Based on A Multi-Substrate Approach" Microorganisms 8, no. 7: 1084. https://doi.org/10.3390/microorganisms8071084
APA StyleOlszewska-Widdrat, A., Alexandri, M., López-Gómez, J. P., Schneider, R., & Venus, J. (2020). Batch and Continuous Lactic Acid Fermentation Based on A Multi-Substrate Approach. Microorganisms, 8(7), 1084. https://doi.org/10.3390/microorganisms8071084