Assessment of the Presence of Hepatitis E Virus in Surface Water and Drinking Water in Portugal


Abstract
1. Introduction
2. Materials and Methods
2.1. Study Sites
2.2. Water Collection and Primary Concentration
2.3. Elution and Secondary Concentration
2.4. Tertiary Concentration and Nucleic Acid Extraction
2.5. Detection and Quantification of Viral Genomes
2.6. Infectivity Assays
2.7. Statistical Analyses
3. Results
3.1. RT-qPCR HEV RNA Detection and Quantification in Water Samples
3.1.1. HEV RNA in Surface Water Samples
3.1.2. HEV RNA in Drinking Water Samples
3.2. Evaluation of the Efficacy of Water Treatment Plants (WTPs) in HEV RNA Elimination
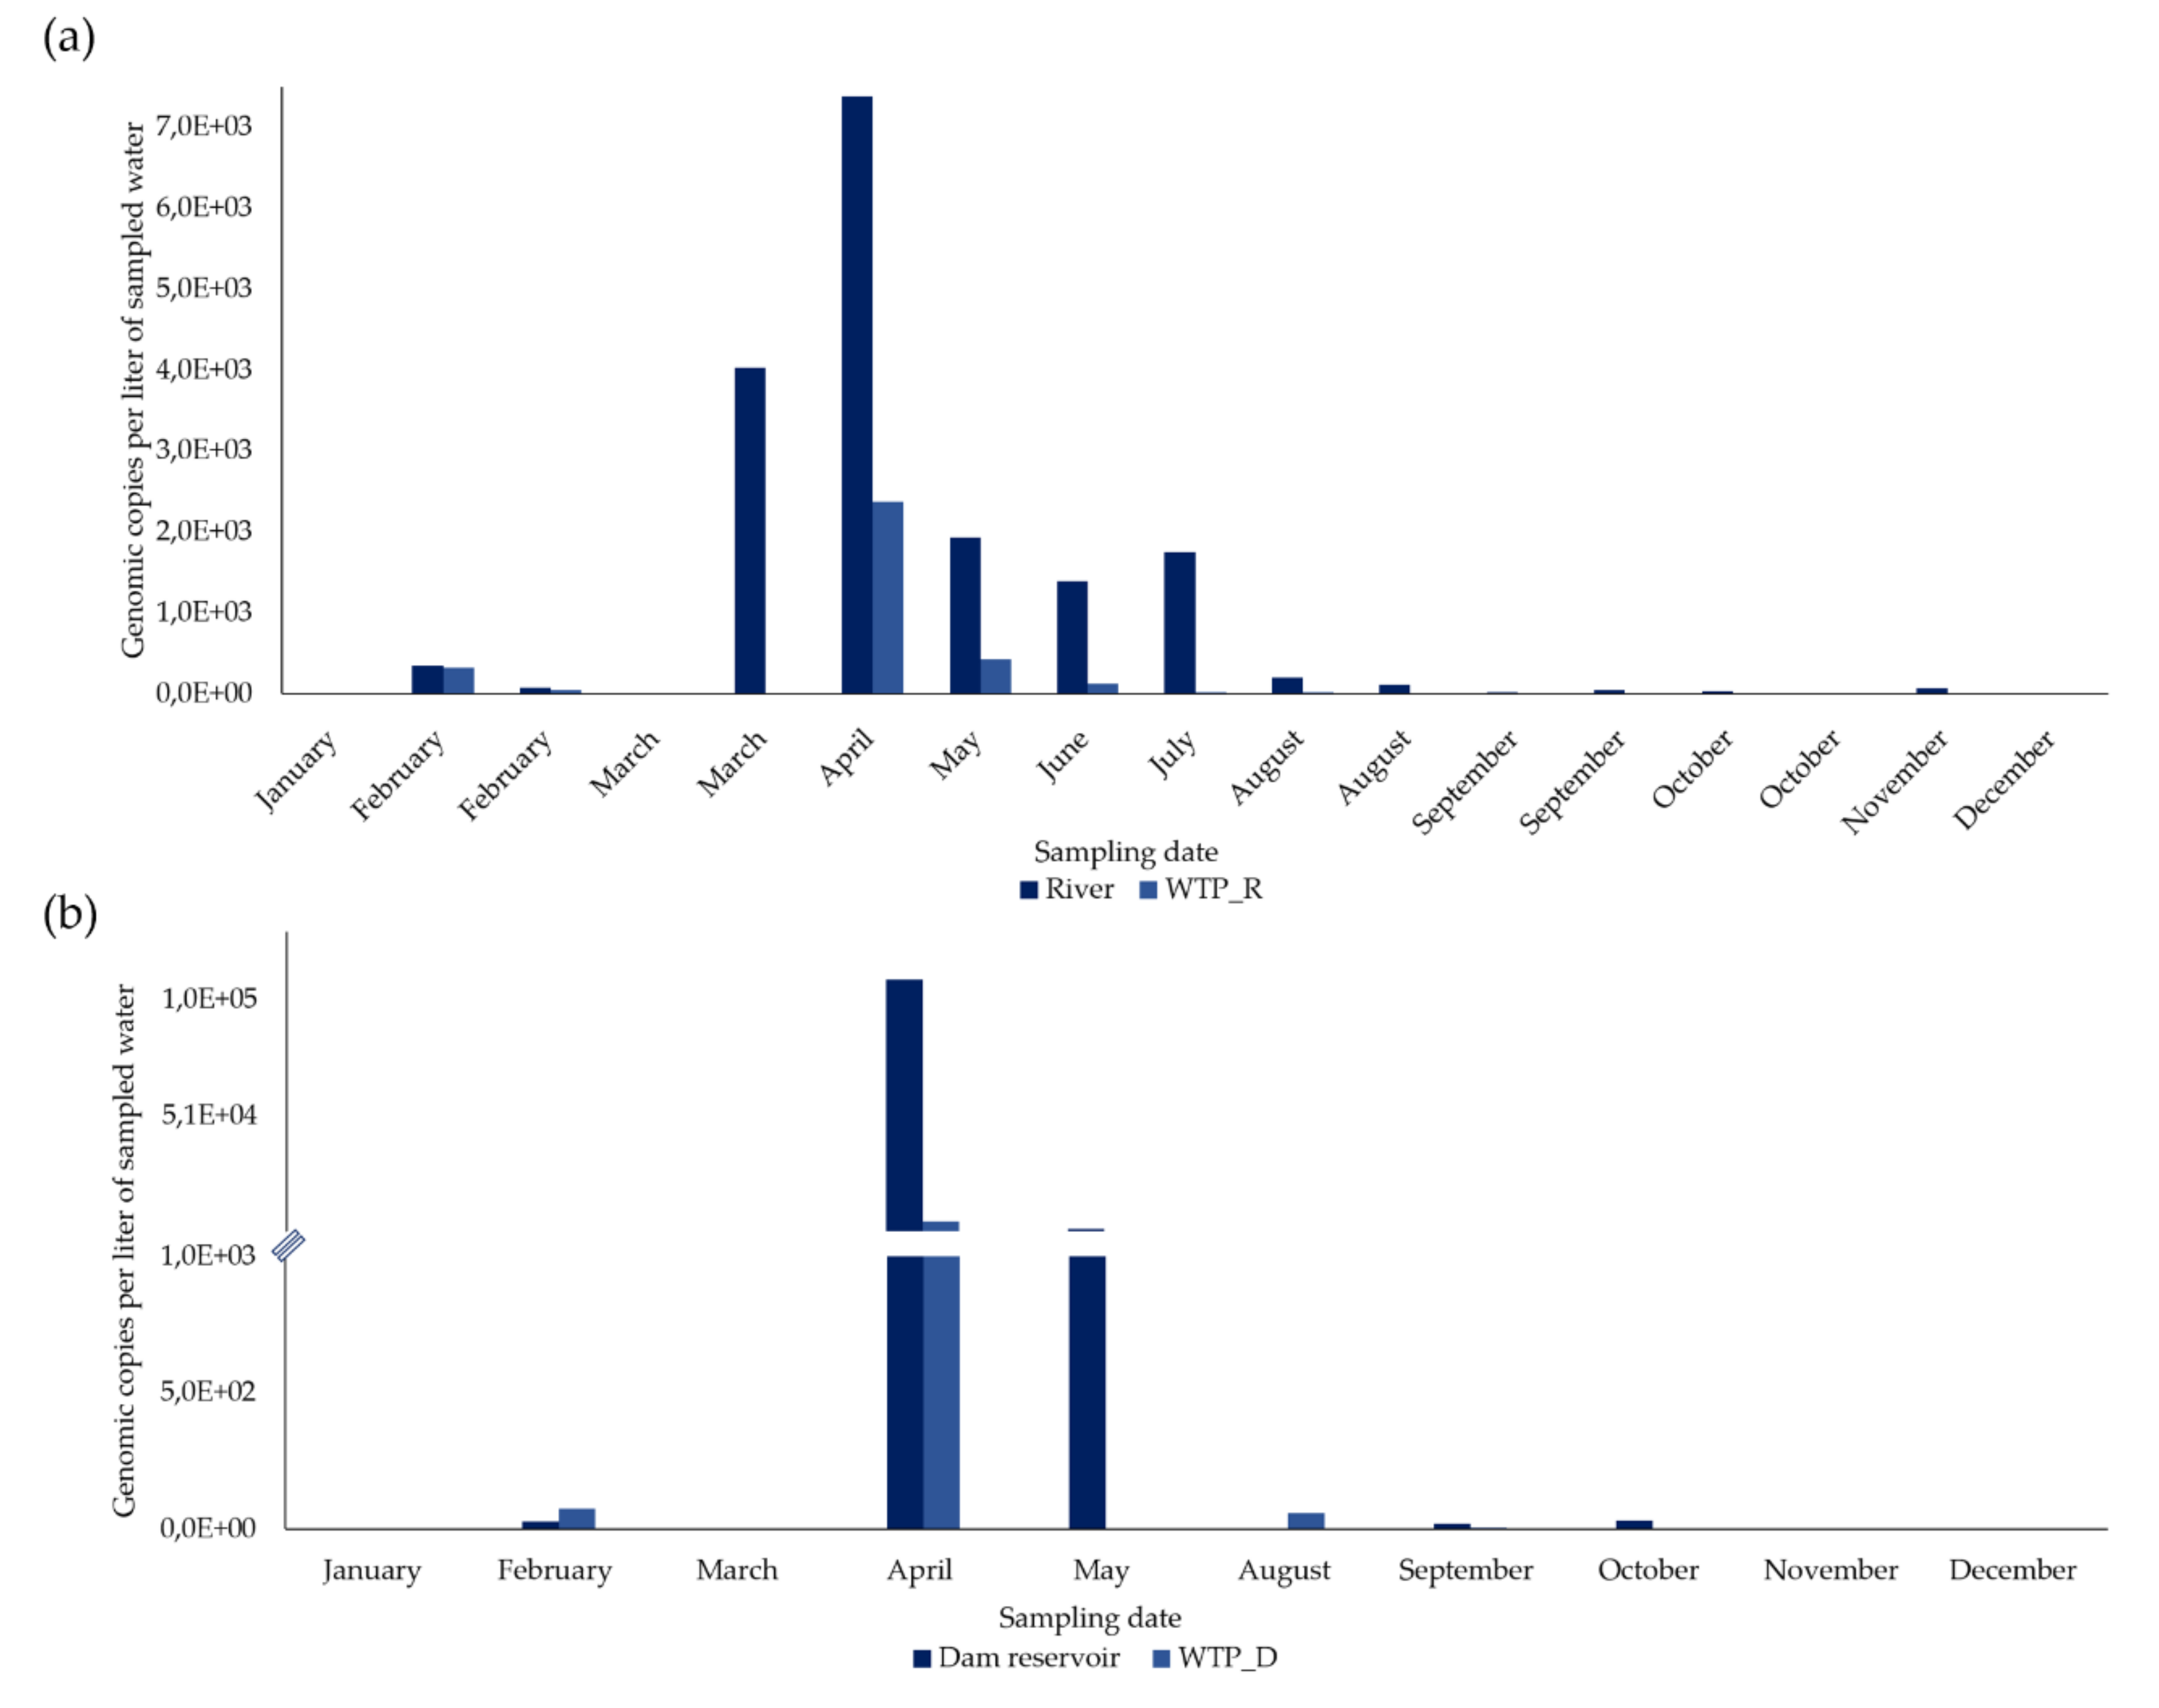
3.2.1. River vs WTP_R
3.2.2. Dam Reservoir vs WTP_D
3.3. Recovery of the Process Control Virus (Mengo Virus) in the Water Samples Subjected to the Survey
3.4. Potential Infectivity of the Water Samples
3.4.1. Effect on Vero E6 Cultures and Production of Putative Viral Particles
3.4.2. RT-qPCR Evaluation of Putative Infectious HEV Produced in Vero E6 Cultures
4. Discussion
5. Conclusions
Author Contributions
Funding
Acknowledgments
Conflicts of Interest
References
- Eifan, S.A. Enteric Viruses And Aquatic Environment. Internet J. Microbiol. 2013, 12, 1–7. [Google Scholar]
- Harrison, L.; DiCaprio, E. Hepatitis E Virus: An Emerging Foodborne Pathogen. Front. Sustain. Food Syst. 2018, 2, 1–9. [Google Scholar] [CrossRef]
- Teixeira, P.; Salvador, D.; Brandão, J.; Ahmed, W.; Sadowsky, M.J.; Valério, E. Environmental and Adaptive Changes Necessitate a Paradigm Shift for Indicators of Fecal Contamination. Microbiol. Spectr. 2020, 8, 1–20. [Google Scholar] [CrossRef]
- World Health Organization. Guidelines for Drinking-Water Quality: Fourth Edition Incorporating the First Addendum; World Health Organization: Geneva, Switzerland, 2017; pp. 1–541. [Google Scholar]
- Denner, J. Hepatitis e virus (HEV)-The future. Viruses 2019, 11, 251. [Google Scholar] [CrossRef]
- Wyn-Jones, A.P.; Sellwood, J. A review: Enteric viruses in the aquatic environment. J. Appl. Microbiol. 2001, 91, 945–962. [Google Scholar] [CrossRef]
- Lee, S.H.; Kim, S.J. Detection of infectious enteroviruses and adenoviruses in tap water in urban areas in Korea. Water Res. 2002, 36, 248–256. [Google Scholar] [CrossRef]
- Rodríguez-Lázaro, D.; Cook, N.; Ruggeri, F.M.; Sellwood, J.; Nasser, A.; Nascimento, M.S.J.; D’Agostino, M.; Santos, R.; Saiz, J.C.; Rzezutka, A.; et al. Virus hazards from food, water and other contaminated environments. FEMS Microbiol. Rev. 2012, 36, 786–814. [Google Scholar] [CrossRef]
- Wang, H.; Kjellberg, I.; Sikora, P.; Rydberg, H.; Lindh, M.; Bergstedt, O.; Norder, H. Hepatitis E virus genotype 3 strains and a plethora of other viruses detected in raw and still in tap water. Water Res. 2020, 168, 1–9. [Google Scholar] [CrossRef]
- Pang, X.; Qiu, Y.; Gao, T.; Zurawell, R.; Neumann, N.F.; Craik, S.; Lee, B.E. Prevalence, levels and seasonal variations of human enteric viruses in six major rivers in Alberta, Canada. Water Res. 2019, 153, 349–356. [Google Scholar] [CrossRef]
- World Health Organization. Global Hepatitis Report; World Health Organization: Geneva, Switzerland, 2017; pp. 1–68. [Google Scholar]
- Purdy, M.A.; Harrison, T.J.; Jameel, S.; Meng, X.J.; Okamoto, H.; Van Der Poel, W.H.M.; Smith, D.B. ICTV virus taxonomy profile: Hepeviridae. J. Gen. Virol. 2017, 98, 2645–2646. [Google Scholar] [CrossRef]
- Yin, X.; Feng, Z.; Wang, H.; Kjellberg, I.; Sikora, P.; Rydberg, H.; Lindh, M.; Bergstedt, O.; Norder, H.; Purdy, M.A.; et al. Cell culture models for hepatitis E virus. Viruses 2019, 11, 883. [Google Scholar] [CrossRef] [PubMed]
- Hellmér, M.; Paxéus, N.; Magnius, L.; Enache, L.; Arnholm, B.; Johansson, A.; Bergström, T.; Norder, H. Detection of pathogenic viruses in sewage provided early warnings of hepatitis A virus and norovirus outbreaks. Appl. Environ. Microbiol. 2014, 80, 6771–6781. [Google Scholar] [CrossRef] [PubMed]
- Berto, A.; Mesquita, J.R.; Hakze-van der Honing, R.; Nascimento, M.S.J.; van der Poel, W.H.M. Detection and Characterization of Hepatitis E Virus in Domestic Pigs of Different Ages in Portugal. Zoonoses Public Health 2012, 59, 477–481. [Google Scholar] [CrossRef] [PubMed]
- López-Gálvez, F.; Truchado, P.; Sánchez, G.; Aznar, R.; Gil, M.I.; Allende, A. Occurrence of enteric viruses in reclaimed and surface irrigation water: Relationship with microbiological and physicochemical indicators. J. Appl. Microbiol. 2016, 121, 1180–1188. [Google Scholar] [CrossRef] [PubMed]
- Shakir, E.; Zahraw, Z.; Al-obaidy, A.H.M.J. Environmental and health risks associated with reuse of wastewater for irrigation. Egypt. J. Pet. 2017, 26, 95–102. [Google Scholar] [CrossRef]
- Prez, V.E.; Martínez, L.C.; Victoria, M.; Giordano, M.O.; Masachessi, G.; Ré, V.E.; Pavan, J.V.; Colina, R.; Barril, P.A.; Nates, S.V. Tracking enteric viruses in green vegetables from central Argentina: Potential association with viral contamination of irrigation waters. Sci. Total Environ. 2018, 637, 665–671. [Google Scholar] [CrossRef]
- Moher, D.; Liberati, A.; Tetzlaff, J.; Altman, D.G.; Grp, P. Preferred Reporting Items for Systematic Reviews and Meta-Analyses: The PRISMA Statement (Reprinted from Annals of Internal Medicine). Phys. Ther. 2009, 89, 873–880. [Google Scholar] [CrossRef]
- Randazzo, W.; Vásquez-García, A.; Bracho, M.A.; Alcaraz, M.J.; Aznar, R.; Sánchez, G. Hepatitis E virus in lettuce and water samples: A method-comparison study. Int. J. Food Microbiol. 2018, 277, 34–40. [Google Scholar] [CrossRef]
- Horvatits, T.; Zur Wiesch, J.S.; Lütgehetmann, M.; Lohse, A.W.; Pischke, S. The clinical perspective on hepatitis E. Viruses 2019, 11, 617. [Google Scholar] [CrossRef]
- Kenney, S.P. The current host range of hepatitis E viruses. Viruses 2019, 11, 452. [Google Scholar] [CrossRef]
- Kumar, S.; Subhadra, S.; Singh, B.; Panda, B.K. Hepatitis E virus: The current scenario. Int. J. Infect. Dis. 2013, 17, 228–233. [Google Scholar] [CrossRef] [PubMed]
- Ferreira, C.M.; Santos, J.A.; Lourenço, T.; Benoliel, C.; Matos, R.; Martins, H.C. Diagnóstico da infeção por vírus da hepatite E no INSA, 2000-2012. Bol. Epidemiológico Obs. 2013, 10, 27–28. [Google Scholar] [CrossRef]
- Baez, P.A.; Lopez, M.C.; Duque-Jaramillo, A.; Pelaez, D.; Molina, F.; Navas, M.C. First evidence of the Hepatitis E virus in environmental waters in Colombia. PLoS ONE 2017, 12, 1–16. [Google Scholar] [CrossRef] [PubMed]
- Purpari, G.; Macaluso, G.; Di Bella, S.; Gucciardi, F.; Mira, F.; Di Marco, P.; Lastra, A.; Petersen, E.; La Rosa, G.; Guercio, A. Molecular characterization of human enteric viruses in food, water samples, and surface swabs in Sicily. Int. J. Infect. Dis. 2019, 80, 66–72. [Google Scholar] [CrossRef] [PubMed]
- Hazam, R.K.; Singla, R.; Kishore, J.; Singh, S.; Gupta, R.K.; Kar, P. Surveillance of hepatitis E virus in sewage and drinking water in a resettlement colony of Delhi: What has been the experience? Arch. Virol. 2010, 155, 1227–1233. [Google Scholar] [CrossRef] [PubMed]
- La Rosa, G.; Pourshaban, M.; Iaconelli, M.; Vennarucci, V.S.; Muscillo, M. Molecular detection of hepatitis E virus in sewage samples. Appl. Environ. Microbiol. 2010, 76, 5870–5873. [Google Scholar] [CrossRef] [PubMed]
- Ahmad, T.; Anjum, S.; Zaidi, N.; Ali, A.; Waqas, M.; Afzal, M.S.; Arshad, N. Frequency of hepatitis E and Hepatitis A virus in water sample collected from Faisalabad, Pakistan. Ann. Agric. Environ. Med. 2015, 22, 661–664. [Google Scholar] [CrossRef]
- Matos, A.; Mesquita, J.R.; Gonçalves, D.; Abreu-Silva, J.; Luxo, C.; Nascimento, M.S.J. First detection and molecular characterization of hepatitis e virusin water from wastewater treatment plants in portugal. Ann. Agric. Environ. Med. 2018, 25, 364–367. [Google Scholar] [CrossRef]
- Cuevas-Ferrando, E.; Randazzo, W.; Pérez-Cataluña, A.; Sánchez, G. HEV Occurrence in Waste and Drinking Water Treatment Plants. Front. Microbiol. 2020, 10, 1–10. [Google Scholar] [CrossRef]
- Park, W.; Park, B.; Ahn, H.; Lee, J.; Park, S.; Song, C.; Lee, S.; Yoo, H.; Choi, I. Hepatitis E virus as an emerging zoonotic pathogen. J. Vet. Sci. 2016, 17, 1–11. [Google Scholar] [CrossRef]
- Capai, L.; Charrel, R.; Falchi, A. Hepatitis e in high-income countries: What do we know? and what are the knowledge gaps? Viruses 2018, 10, 285. [Google Scholar] [CrossRef] [PubMed]
- Rivero-Juarez, A.; Vallejo, N.; Lopez-lopez, P.; Díaz-mareque, A.I.; Frias, M.; Vallejo, A.; Caballero-gómez, J.; Rodríguez-velasco, M.; Molina, E.; Aguilera, A. Ribavirin as a first treatment approach for hepatitis e virus infection in transplant recipient patients. Microorganisms 2020, 8, 51. [Google Scholar] [CrossRef] [PubMed]
- Ananta, S.; Gupta, B.P.; Lama, T.K. Current Treatment of Acute and Chronic Hepatitis E Virus Infection: Role of Antivirals. Euroasian J. Hepato-Gastroenterol. 2017, 7, 73–77. [Google Scholar] [CrossRef][Green Version]
- Trepo, C. A brief history of hepatitis milestones. Liver Int. 2014, 34, 29–37. [Google Scholar] [CrossRef] [PubMed]
- AdP - Águas de Portugal Águas de Portugal. Available online: www.adp.pt (accessed on 10 March 2020).
- Ikner, L.A.; Gerba, C.P.; Bright, K.R. Concentration and Recovery of Viruses from Water: A Comprehensive Review. Food Environ. Virol. 2012, 4, 41–67. [Google Scholar] [CrossRef] [PubMed]
- Francy, D.S.; Stelzer, E.A.; Brady, A.M.G.; Huitger, C.; Bushon, R.N.; Ip, H.S.; Ware, M.W.; Villegas, E.N.; Gallardo, V.; Lindquist, H.D.A. Comparison of filters for concentrating microbial indicators and pathogens in lake water samples. Appl. Environ. Microbiol. 2013, 79, 1342–1352. [Google Scholar] [CrossRef] [PubMed]
- Fout, G.S.; Cashdollar, J.L.; Varughese, E.A.; Parshionikar, S.U.; Grimm, A.C. EPA Method 1615. Measurement of Enterovirus and Norovirus Occurrence in Water by Culture and RT-qPCR. I. Collection of Virus Samples. J. Vis. Exp. 2016, 107, 1–13. [Google Scholar] [CrossRef]
- Fout, G.S.; Brinkman, N.E.; Cashdollar, J.L.; Griffin, M.; McMinn, B.R.; Rhodes, E.R.; Varughese, E.A.; Karim, M.R.; Grimm, A.C.; Spencer, S.K. Method 1615-Measurement of Enterovirus and Norovirus Occurrence in Water by Culture and RT-qPCR. JoVE 2016, 107, 1–13. [Google Scholar]
- ISO. International Standard-Microbiology of the Food Chain—Horizontal Method for Determination of Hepatitis A Virus and Norovirus; ISO Copyright Office: Geneva, Switzerland, 2017. [Google Scholar]
- Teixeira, P.; Costa, S.; Brown, B.; Silva, S.; Rodrigues, R.; Valério, E. Quantitative PCR detection of enteric viruses in wastewater and environmental water sources by the Lisbon municipality: A case study. Water 2020, 12, 544. [Google Scholar] [CrossRef]
- O’Brien, E.; Nakyazze, J.; Wu, H.; Kiwanuka, N.; Cunningham, W.; Kaneene, J.B.; Xagoraraki, I. Viral diversity and abundance in polluted waters in Kampala, Uganda. Water Res. 2017, 127, 41–49. [Google Scholar] [CrossRef]
- Silva, A.M.; Vieira, H.; Martins, N.; Granja, A.T.S.; Vale, M.J.; Vale, F.F. Viral and bacterial contamination in recreational waters: A case study in the Lisbon bay area. J. Appl. Microbiol. 2009, 108, 1023–1031. [Google Scholar] [CrossRef] [PubMed]
- Ammerman, N.; Beier-Sexton, M.; Azad, A. Growth and maintenance of Vero cell lines. Curr. Protoc. Microbiol. 2008, 1–10. [Google Scholar] [CrossRef] [PubMed]
- Lee, J.H.; Lee, G.C.; Kim, J.I.; Yi, H.A.; Lee, C.H. Development of a new cell culture-based method and optimized protocol for the detection of enteric viruses. J. Virol. Methods 2013, 191, 16–23. [Google Scholar] [CrossRef]
- Haramoto, E.; Kitajima, M.; Hata, A.; Torrey, J.R.; Masago, Y.; Sano, D.; Katayama, H. A review on recent progress in the detection methods and prevalence of human enteric viruses in water. Water Res. 2018, 135, 168–186. [Google Scholar] [CrossRef] [PubMed]
- Rodríguez, R.A.; Pepper, I.L.; Gerba, C.P. Application of PCR-based methods to assess the infectivity of enteric viruses in environmental samples. Appl. Environ. Microbiol. 2009, 75, 297–307. [Google Scholar] [CrossRef]
- Leifels, M.; Hamza, I.A.; Krieger, M.; Wilhelm, M.; Mackowiak, M.; Jurzik, L. From Lab to Lake – Evaluation of Current Molecular Methods for the Detection of Infectious Enteric Viruses in Complex Water Matrices in an Urban Area. PLoS ONE 2016, 11, 1–16. [Google Scholar] [CrossRef]
- Hamza, I.A.; Jurzik, L.; Überla, K.; Wilhelm, M. Methods to detect infectious human enteric viruses in environmental water samples. Int. J. Hyg. Environ. Health 2011, 214, 424–436. [Google Scholar] [CrossRef]
- Dilnessa, T.; Zeleke, H. Cell Culture, Cytopathic Effect and Immunofluorescence Diagnosis of Viral Infection. J. Microbiol. Mod. Tech. 2017, 2, 1–8. [Google Scholar] [CrossRef]
- Format, P.; Properties, C.; Level, B.; Conditions, S. VERO C1008 [Vero 76, Clone E6, Vero E6] (ATCC®CRL-1586TM). Available online: https://www.lgcstandards-atcc.org/Products/All/CRL-1586.aspx?geo_country=pt (accessed on 1 April 2020).
- Grigas, J.; Simkute, E.; Simanavicius, M.; Pautienius, A.; Streimikyte-Mockeliune, Z.; Razukevicius, D.; Stankevicius, A. Hepatitis e genotype 3 virus isolate from wild boar is capable of replication in non-human primate and swine kidney cells and mouse neuroblastoma cells. BMC Vet. Res. 2020, 16, 1–11. [Google Scholar] [CrossRef]
- Instituto Português do Mar e da Atmosfera. Resumo Climatológico Preliminar 1 a 29 Abril de 2019. Available online: https://www.ipma.pt/resources.www/docs/im.publicacoes/edicoes.online/20190503/IsNqBQXrKBtUkblVoGQA/cli_20190401_20190430_pcl_mm_co_pt.pdf (accessed on 25 March 2020).
- Jiang, S.C.; Chu, W. PCR detection of pathogenic viruses in southern California urban rivers. J. Appl. Microbiol. 2004, 97, 17–28. [Google Scholar] [CrossRef]
- Pordata-Valor da Produção Agrícola: Total e Por Tipo. Available online: https://www.pordata.pt/Municipios/Valor+da+produção+agrícola+total+e+por+tipo-956 (accessed on 26 March 2020).
- Dalton, H.R.; Seghatchian, J. Hepatitis E virus: Emerging from the shadows in developed countries. Transfus. Apher. Sci. 2016, 55, 271–274. [Google Scholar] [CrossRef] [PubMed]
- Martin-latil, S.; Hennechart-collette, C.; Delannoy, S.; Guillier, L. Quantification of Hepatitis E Virus in Naturally-Contaminated Pig Liver Products. Front. Microbiol. 2016, 7, 1–10. [Google Scholar] [CrossRef] [PubMed]
- Tsindos, S. What drove us to drink 2 litres of water a day? Aust. N. Z. J. Public Health 2012, 36, 205–207. [Google Scholar] [CrossRef] [PubMed]
- Farkas, K.; Cooper, D.M.; McDonald, J.E.; Malham, S.K.; de Rougemont, A.; Jones, D.L. Seasonal and spatial dynamics of enteric viruses in wastewater and in riverine and estuarine receiving waters. Sci. Total Environ. 2018, 634, 1174–1183. [Google Scholar] [CrossRef]
- Haramoto, E.; Katayama, H.; Oguma, K.; Ohgaki, S. Application of cation-coated filter method to detection of noroviruses, enteroviruses, adenoviruses, and torque teno viruses in the Tamagawa River in Japan. Appl. Environ. Microbiol. 2005, 71, 2403–2411. [Google Scholar] [CrossRef]
- Da Silva, A.K.; Le Saux, J.C.; Parnaudeau, S.; Pommepuy, M.; Elimelech, M.; Le Guyader, F.S. Evaluation of removal of noroviruses during wastewater treatment, using real-time reverse transcription-PCR: Different behaviors of genogroups I and II. Appl. Environ. Microbiol. 2007, 73, 7891–7897. [Google Scholar] [CrossRef]
- Hennechart-Collette, C.; Martin-Latil, S.; Guillier, L.; Perelle, S. Determination of which virus to use as a process control when testing for the presence of hepatitis a virus and norovirus in food and water. Int. J. Food Microbiol. 2015, 202, 57–65. [Google Scholar] [CrossRef]
- Girones, R.; Carratalà, A.; Calgua, B.; Calvo, M.; Rodriguez-Manzano, J.; Emerson, S. Chlorine inactivation of hepatitis e virus and human adenovirus 2 in water. J. Water Health 2014, 12, 436–442. [Google Scholar] [CrossRef]
- Guerrero-Latorre, L.; Gonzales-Gustavson, E.; Hundesa, A.; Sommer, R.; Rosina, G. UV disinfection and flocculation-chlorination sachets to reduce hepatitis E virus in drinking water. Int. J. Hyg. Environ. Health 2016, 219, 405–411. [Google Scholar] [CrossRef]
- Shin, E.; Kim, J.S.; Oh, K.H.; Oh, S.S.; Kwon, M.J.; Kim, S.; Park, J.; Kwak, H.S.; Chung, G.T.; Kim, C.J.; et al. A waterborne outbreak involving hepatitis A virus genotype IA at a residential facility in the Republic of Korea in 2015. J. Clin. Virol. 2017, 94, 63–66. [Google Scholar] [CrossRef]
- Lim, M.Y.; Kim, J.M.; Lee, J.E.; Ko, G. Characterization of ozone disinfection of murine norovirus. Appl. Environ. Microbiol. 2010, 76, 1120–1124. [Google Scholar] [CrossRef] [PubMed]
- WHO. Quantitative Microbial Risk Assessment: Application for Water Safety Management. WHO Press: Geneva, Switzerland, 2016; pp. 1–187. [Google Scholar]


| Sampling Site | Date | Sampled Volume (L) | |
|---|---|---|---|
| Surface Water | Drinking Water | ||
| River and Water Treatment Plant R (WTP_R) | January | 900 | 1200 |
| February, first half | 690 | 1800 | |
| February, second half | 250 | 1300 | |
| March, first half | 220 | 1600 | |
| March, second half | 170 | 1500 | |
| April | 170 | 1350 | |
| May | 152 | 1300 | |
| June | 122 | 2000 | |
| July | 150 | 1500 | |
| August, first half | 150 | 1350 | |
| August, second half | 130 | 950 | |
| September, first half | 165 | 1200 | |
| September, second half | 220 | 1300 | |
| October, first half | 155 | 1400 | |
| October, second half | 130 | 1180 | |
| November | 130 | 1500 | |
| December | 230 | 1400 | |
| Dam reservoir and Water Treatment Plant D (WTP_D) | January | 690 | 960 |
| February | 710 | 620 | |
| March | 1500 | 3400 | |
| April | 550 | 1100 | |
| May | 2340 | 800 | |
| June | 530 | 1000 | |
| September | 450 | 900 | |
| October | 250 | 800 | |
| November | 665 | 945 | |
| December | 215 | 675 | |
| Point in the distribution network | January | - | 1700 |
| February | 1780 | ||
| April | 1700 | ||
| May | 1800 | ||
| June | 1900 | ||
| July | 1600 | ||
| August | 1400 | ||
| September | 1700 | ||
| October | 1880 | ||
| Date | HEV Concentration (gc/L) | Reduction (%) after Treatment | HEV Concentration (gc/L) | Reduction (%) after Treatment | ||
|---|---|---|---|---|---|---|
| River | WTP_R | Dam Reservoir | WTP_D | |||
| January | 0 | 0 | * | 0 | 0 | * |
| February, first half | 355.5 | 320.8 | 9.8 | - | - | - |
| February, second half | 78.2 | 49.3 | 37.0 | 29.1 | 75.2 | NR |
| March, first half | 0 | 0 | * | - | - | - |
| March, second half | 4,029.1 | 0 | 100 | 0 | 0 | * |
| April | 7,383.1 | 2,379.3 | 67.8 | 109,687.5 | 5,617.1 | 94.9 |
| May | 1,936.5 | 428.0 | 77.9 | 2,412 | 0 | 100 |
| June | 1,394.9 | 126.0 | 91.0 | 0 | 58.7 | NR |
| July | 1,755.0 | 22.0 | 98.7 | - | - | - |
| August, first half | 206.5 | 24.2 | 88.3 | - | - | - |
| August, second half | 113.3 | 0 | 100 | - | - | - |
| September, first half | 23.3 | 1.9 | 91.9 | - | - | - |
| September, second half | 55.1 | 5.0 | 90.9 | 19.5 | 5.2 | 73.3 |
| October, first half | 36.3 | 4.5 | 87.6 | - | - | - |
| October, second half | 2.7 | 0 | 100 | 30.4 | 0.7 | 97.6 |
| November | 69.9 | 4.8 | 93.1 | 0.7 | 0 | 100 |
| December | 2.1 | 0 | 100 | 0 | 0 | * |
| Months | HEV RNA (gc/L) | HEV Reduction (%) after Treatment | HEV Infectivity (*) | ||
|---|---|---|---|---|---|
| River | WTP_R | River | WTP_R | ||
| February | 355.5 | 320.8 | 9.8 | Negative | Negative |
| February | 78.2 | 49.3 | 37 | Negative | Negative |
| March | 4,029.1 | 0 | 100 | Negative | Negative |
| April | 7,383.1 | 2,379.3 | 67.8 | Negative | Negative |
| May | 1,936.5 | 428 | 77.9 | Negative | Positive |
| June | 1,394.9 | 126 | 91 | Positive | Positive |
| July | 1,755 | 22 | 98.7 | Negative | Negative |
| August | 206.5 | 24.2 | 88.3 | Negative | Negative |
| August | 113.3 | 0 | 100 | Positive | Positive |
| Months | HEV RNA (gc/L) | HEV Reduction (%) after Treatment | HEV Infectivity (*) | ||
|---|---|---|---|---|---|
| Dam Reservoir | WTP_D | Dam Reservoir | WTP_D | ||
| February | 29.1 | 75.2 | NR | Negative | Negative |
| April | 109,687.5 | 5,617.1 | 94.9 | Negative | Negative |
| May | 2,412 | 0 | 100 | Negative | Negative |
| June | 0 | 58.7 | NR | Positive | Positive |
| Months | HEV RNA (gc/L) | HEV Infectivity (*) |
|---|---|---|
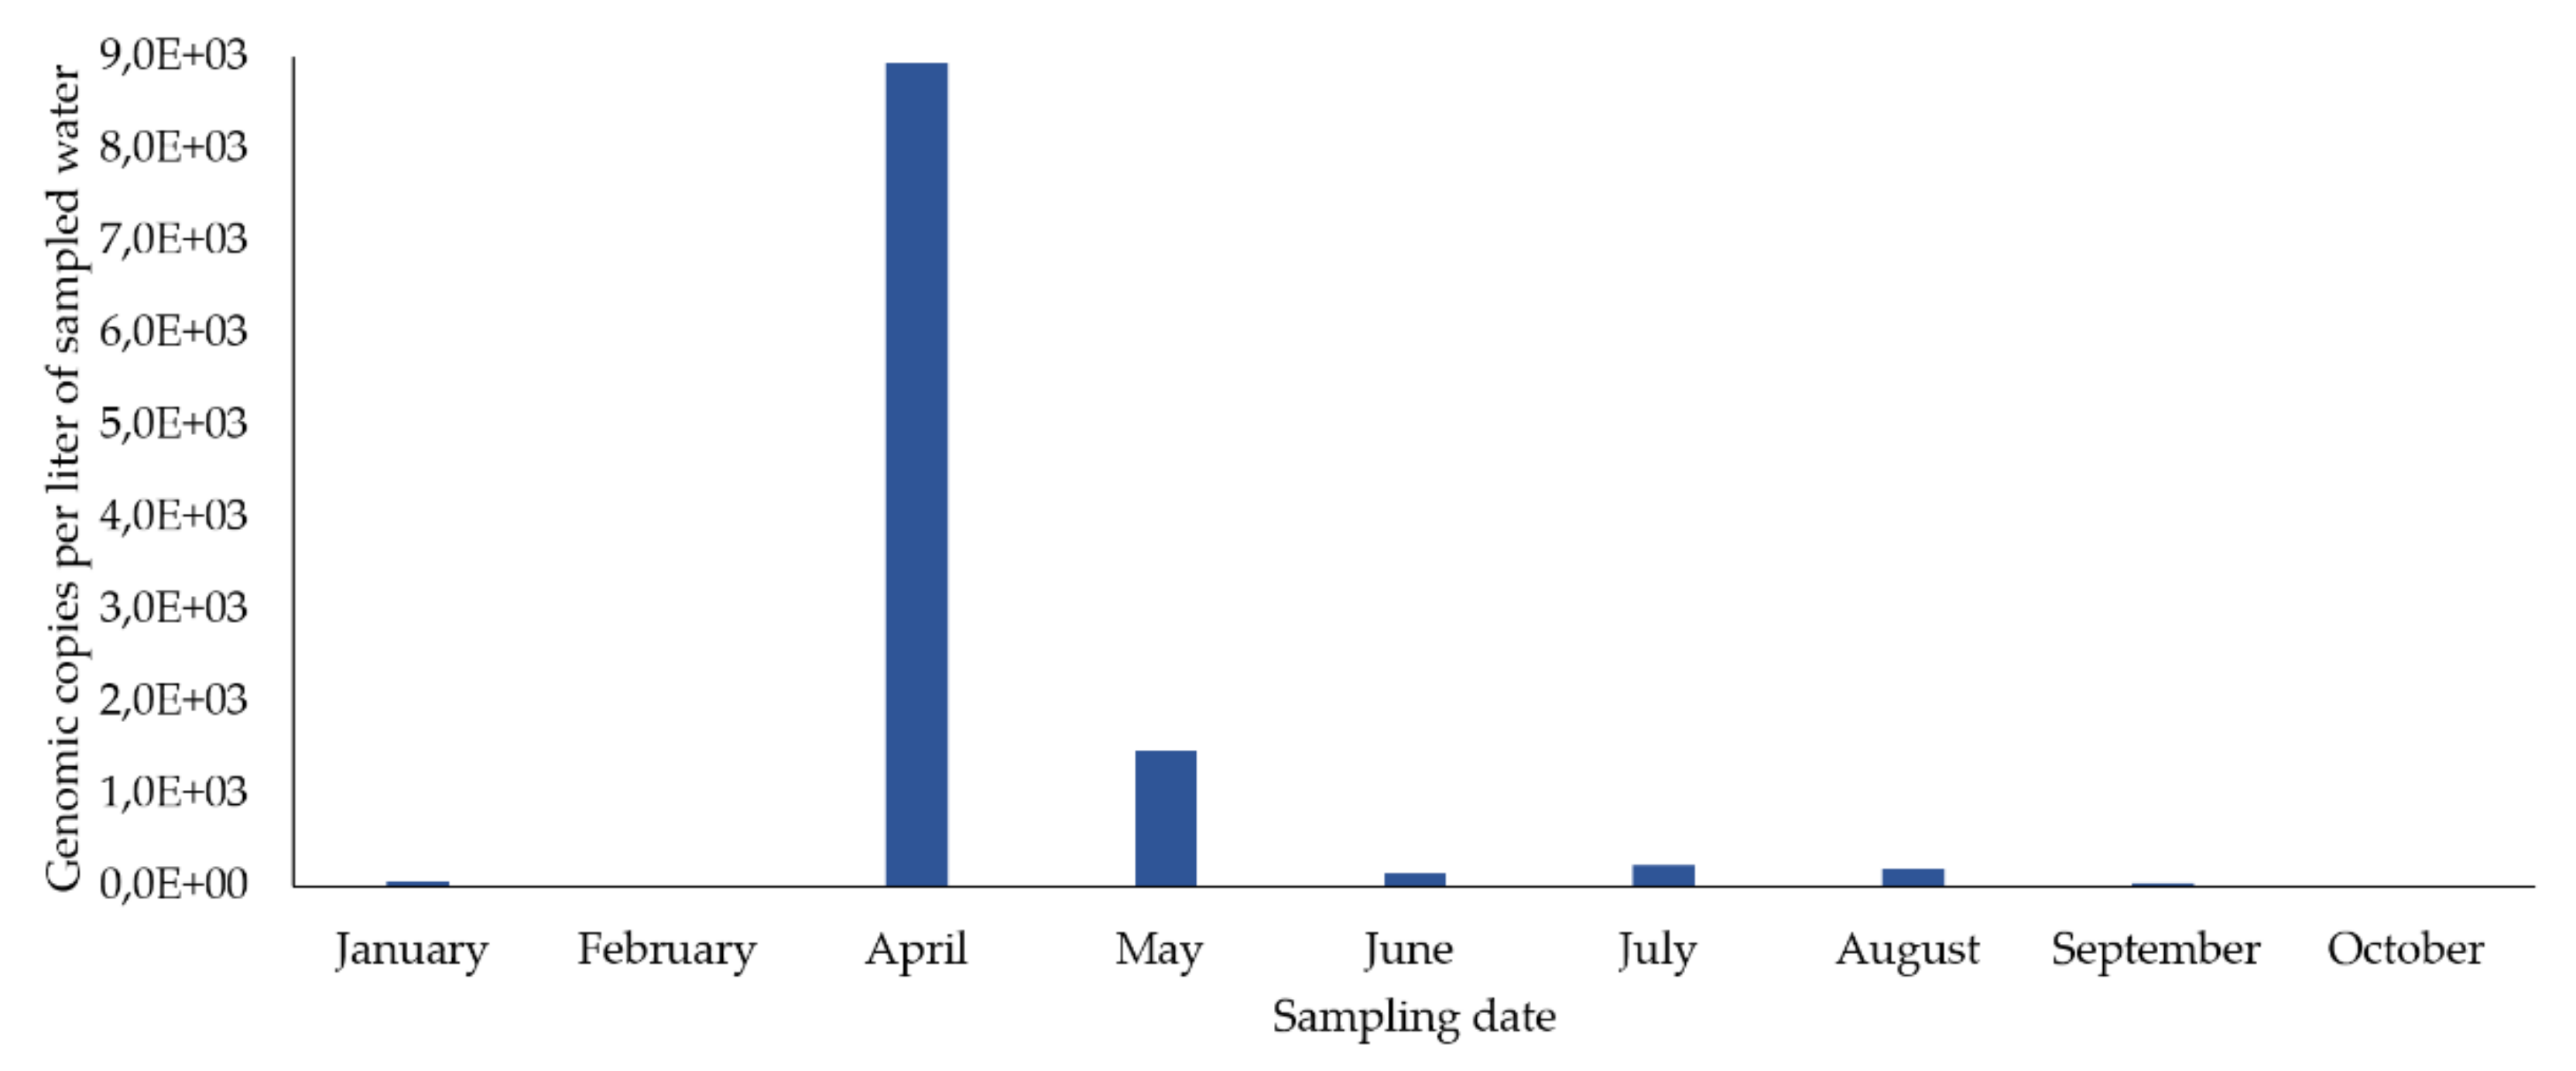
| January | 46.9 | Negative |
| April | 8,926.6 | Negative |
| May | 1,473.5 | Negative |
| June | 133.3 | Negative |
| July | 221.4 | Positive |
| August | 186.6 | Negative |
© 2020 by the authors. Licensee MDPI, Basel, Switzerland. This article is an open access article distributed under the terms and conditions of the Creative Commons Attribution (CC BY) license (http://creativecommons.org/licenses/by/4.0/).
Share and Cite
Salvador, D.; Neto, C.; Benoliel, M.J.; Caeiro, M.F. Assessment of the Presence of Hepatitis E Virus in Surface Water and Drinking Water in Portugal. Microorganisms 2020, 8, 761. https://doi.org/10.3390/microorganisms8050761
Salvador D, Neto C, Benoliel MJ, Caeiro MF. Assessment of the Presence of Hepatitis E Virus in Surface Water and Drinking Water in Portugal. Microorganisms. 2020; 8(5):761. https://doi.org/10.3390/microorganisms8050761
Chicago/Turabian StyleSalvador, Daniel, Célia Neto, Maria João Benoliel, and Maria Filomena Caeiro. 2020. "Assessment of the Presence of Hepatitis E Virus in Surface Water and Drinking Water in Portugal" Microorganisms 8, no. 5: 761. https://doi.org/10.3390/microorganisms8050761
APA StyleSalvador, D., Neto, C., Benoliel, M. J., & Caeiro, M. F. (2020). Assessment of the Presence of Hepatitis E Virus in Surface Water and Drinking Water in Portugal. Microorganisms, 8(5), 761. https://doi.org/10.3390/microorganisms8050761