Article

Diversity of Bacterial Biosynthetic Genes in Maritime Antarctica

1
Interdisciplinary Centre of Marine and Environmental Research (CIIMAR), University of Porto, 4450-208 Matosinhos, Portugal
2
Institute of Biomedical Sciences Abel Salazar (ICBAS), University of Porto, 4050-313 Porto, Portugal
3
Institute F.-A. Forel, Earth and Environmental Sciences, Faculty of Sciences, University of Geneva, 66, Boulevard Carl-Vogt, 1211 Genève 4, Switzerland
4
Centro de Química Estrutural at Instituto Superior Técnico, Universidade de Lisboa, Av. Rovisco Pais, 1049-001 Lisboa, Portugal
5
Faculty of Sciences, University of Porto, 4150-179 Porto, Portugal
6
School of Science, University of Waikato, Hamilton 3216, New Zealand
*
Authors to whom correspondence should be addressed.
Microorganisms 2020, 8(2), 279; https://doi.org/10.3390/microorganisms8020279
Submission received: 24 January 2020 / Revised: 14 February 2020 / Accepted: 14 February 2020 / Published: 18 February 2020

Abstract

:
Bacterial natural products (NPs) are still a major source of new drug leads. Polyketides (PKs) and non-ribosomal peptides (NRP) are two pharmaceutically important families of NPs and recent studies have revealed Antarctica to harbor endemic polyketide synthase (PKS) and non-ribosomal peptide synthetase (NRPS) genes, likely to be involved in the production of novel metabolites. Despite this, the diversity of secondary metabolites genes in Antarctica is still poorly explored. In this study, a computational bioprospection approach was employed to study the diversity and identity of PKS and NRPS genes to one of the most biodiverse areas in maritime Antarctica—Maxwell Bay. Amplicon sequencing of soil samples targeting ketosynthase (KS) and adenylation (AD) domains of PKS and NRPS genes, respectively, revealed abundant and unexplored chemical diversity in this peninsula. About 20% of AD domain sequences were only distantly related to characterized biosynthetic genes. Several PKS and NRPS genes were found to be closely associated to recently described metabolites including those from uncultured and candidate phyla. The combination of new approaches in computational biology and new culture-dependent and -independent strategies is thus critical for the recovery of the potential novel chemistry encoded in Antarctica microorganisms.

1. Introduction

Microorganisms, and bacteria in particular, produce a plethora of bioactive natural products (NPs), including clinically-relevant antibiotics, antifungals and anticancer agents, and continue to be a major source of new structural leads [1]. Despite the vast structural diversity of these bacterial small molecules, the majority of biomedically relevant NPs belong to the polyketide (PK) or non-ribosomal peptide (NRP) biogenetic families, or to their hybrids [2]. PKs and NRPs are biosynthesized by polyketide synthase (PKS) and non-ribosomal peptide synthetase (NRPS) enzymatic machinery, respectively [3]. Conserved motifs on the genes encoding these enzymes have allowed for the design of degenerate primers [4,5], that have proved useful to determine PKS and NRPS phylogenetic diversity in natural ecosystems [6], and also to predict (to some extent) their encoded chemical outputs [7]. Such primers target the highly conserved ketosynthase (KS) and adenylation (AD) domains of PKS and NRPS genes, respectively. A growing number of studies have employed the PCR-based sequence tag approach to uncover PKS and NRPS gene diversity across different environmental microbiomes [7,8,9].
Extreme environments, such as Antarctica, have the potential to reveal novel molecules since they are still a poorly explored source of chemical scaffolds and novel chemical diversity [10,11]. As such, metabarcoding approaches to study PKS and NRPS diversity in Antarctic ecosystems represent a simple and effective strategy to understand the biosynthetic potential of a large number of sampling sites [7]. A couple of such studies have been carried out very recently in Antarctica [12,13] revealing that soils at different Antarctica locations harbor multiple endemic PKS and NRPS genes, likely to be involved in the synthesis of new chemical diversity. In Antarctic soils, the percentage of yet-uncultured genera is expected to be much higher [14] than the 82% described for general soils [15]. A considerable fraction of such uncultured bacteria corresponds to members of the NP-rich Actinobacteria [16,17] and Cyanobacteria [18,19] phyla.
King George Island is one of the largest ice-free and biodiverse areas in maritime Antarctica [20]. It harbors a high density of scientific stations, particularly in Maxwell Bay [21], where most of terrestrial biology research takes place. Although bacterial diversity studies have been conducted in this area [22,23], the diversity of bacterial biosynthetic genes has not been a target of study. Here, we perform a detailed study on soil samples from Maxwell Bay, with the main goal of assessing the diversity and identity of key biosynthetic genes (PKS and NRPS) and to what extent these are likely to be unique to this peninsular environment.

2. Materials and Methods

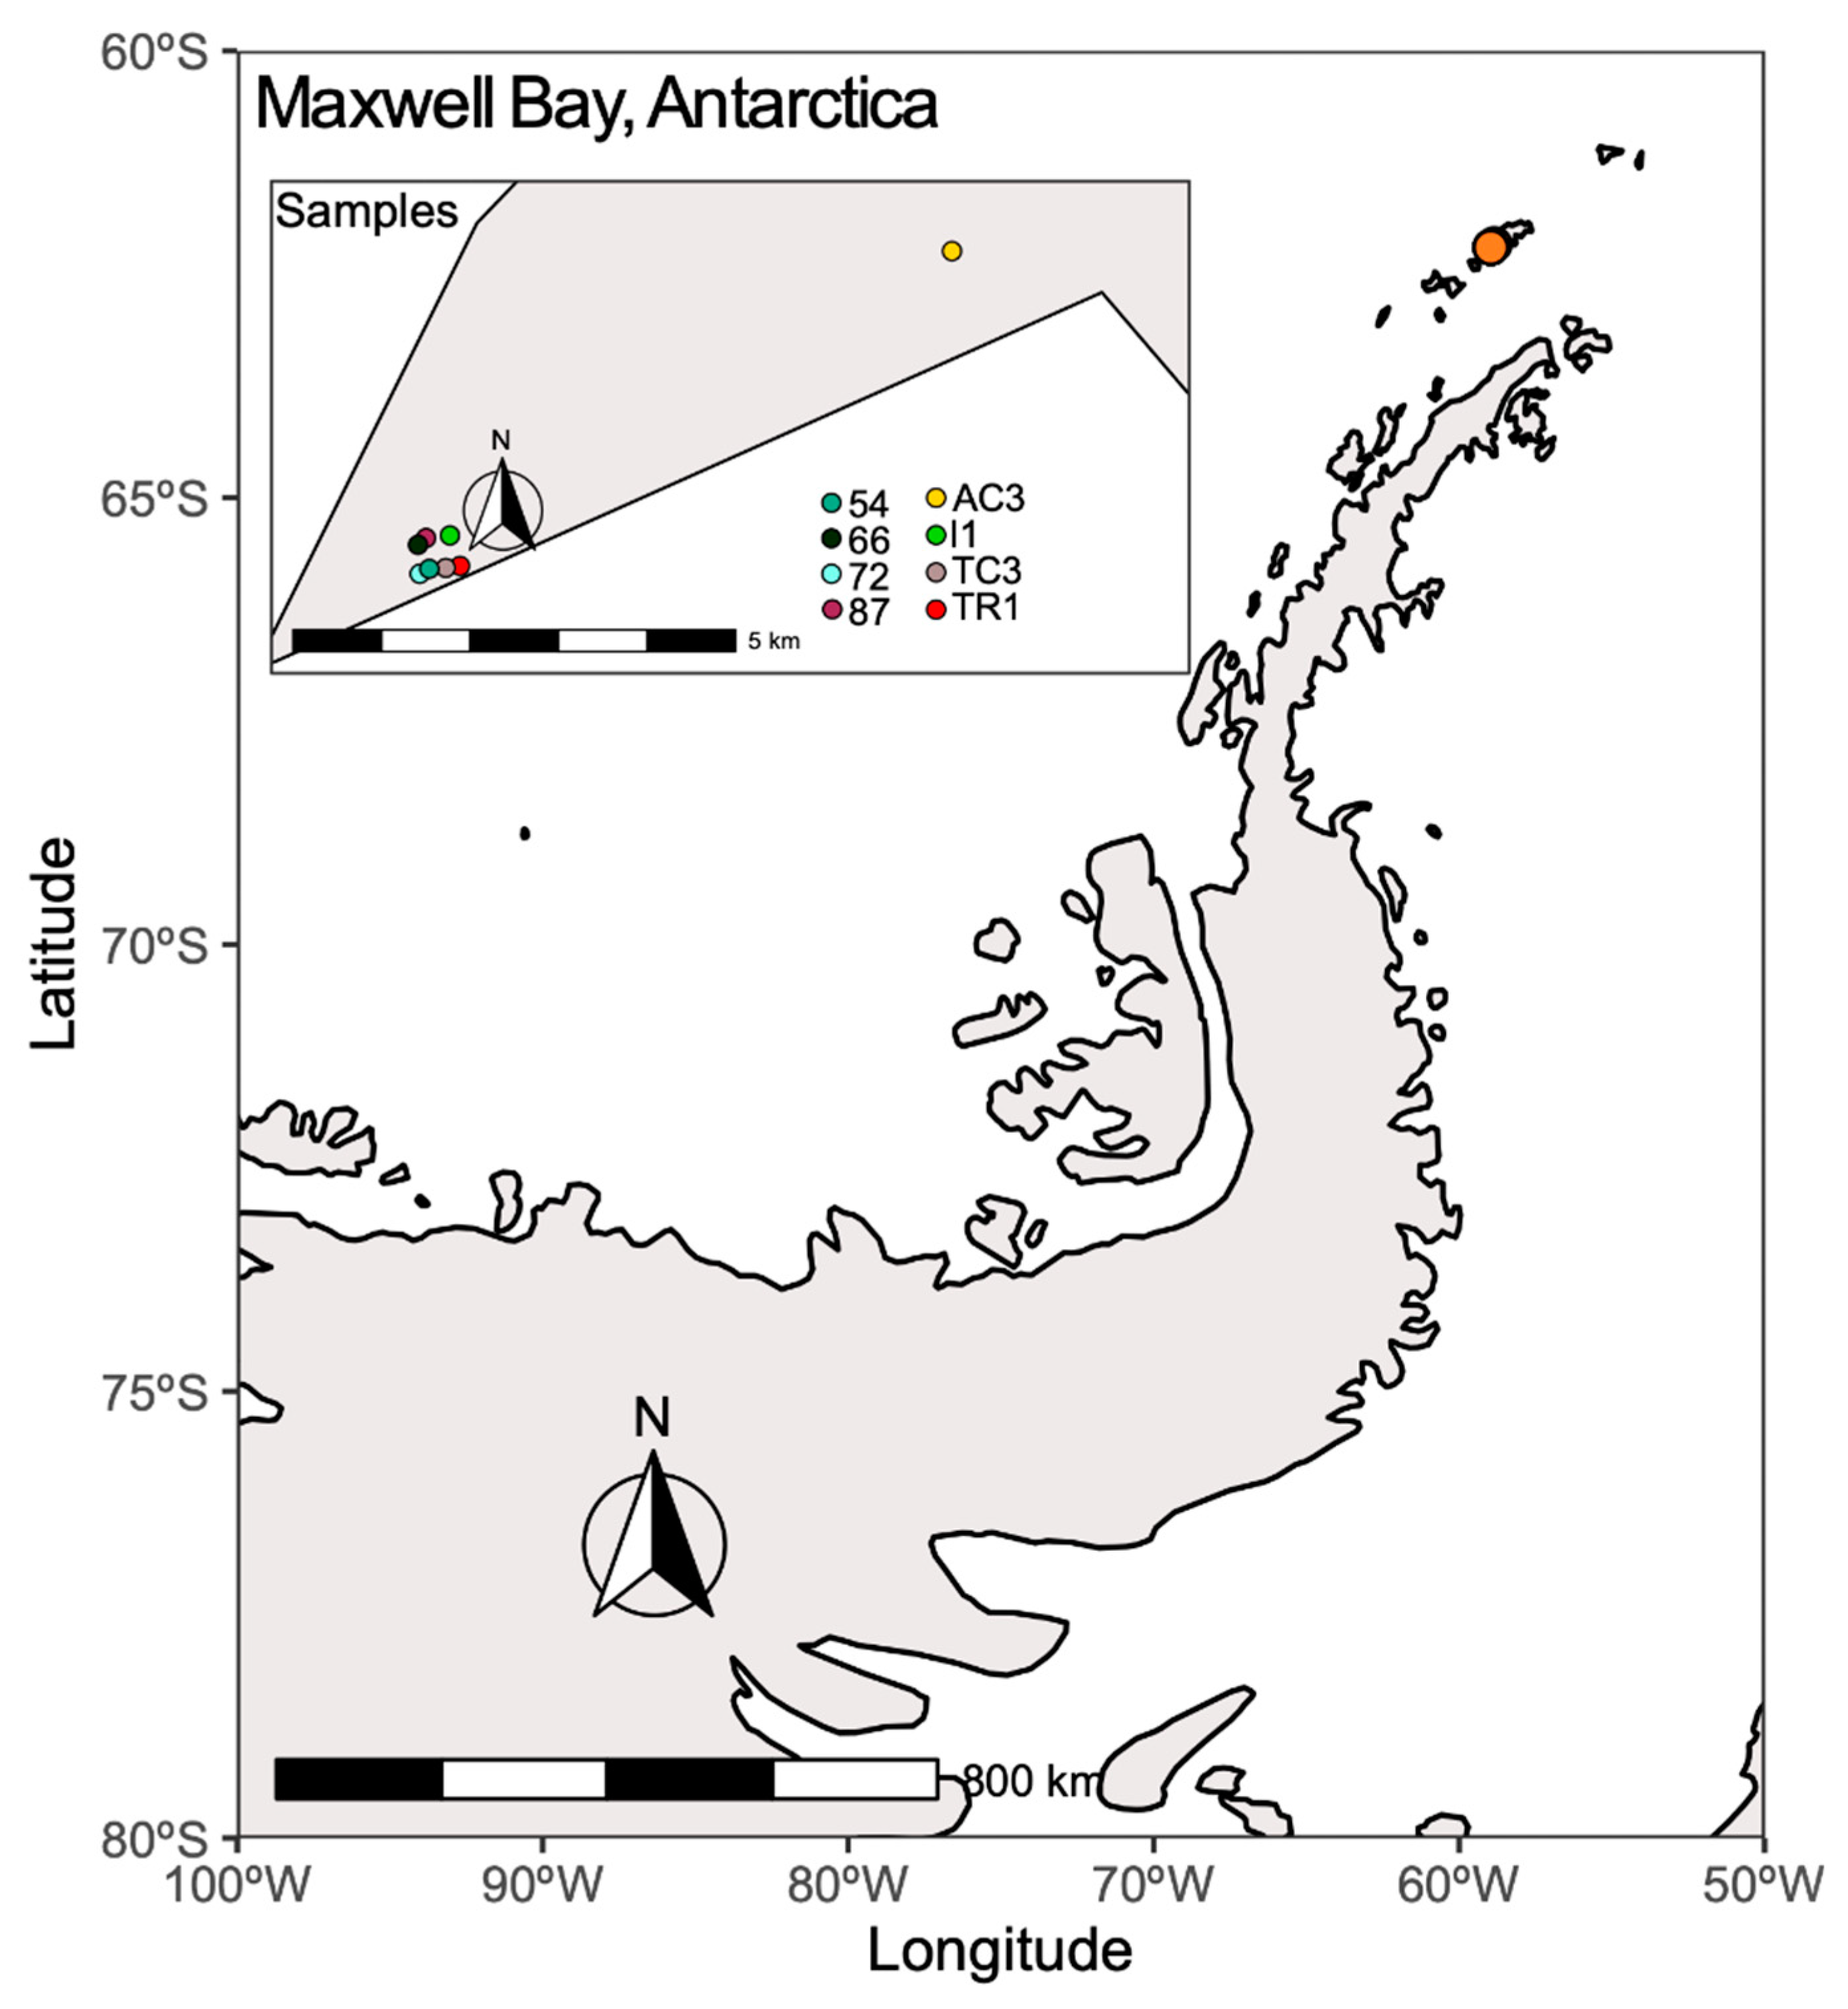
2.1. Sampling Area and Environmental Variables

The study site—Fildes Peninsula—is located on the southwestern part of King George Island, maritime Antarctica (Figure 1). Despite being the subject of intense human activities, the Fildes Peninsula is recognized as a special ecological protection area [21]. Samples were collected during the CONTANTARC-3 campaign in Maxwell Bay, between 5 and 15 February 2014. Surface soil samples (up to 10 cm deep) from eight stations (Figure 1, Table S1) were collected using a sterile plastic spatula and stored immediately in sterile plastic bags with zip closure [24] and preserved at −20 °C until arriving at our laboratory (CIIMAR, University of Porto, Portugal) where samples were preserved at −80 °C until further analysis. Organic matter (OM) and water content were measured according with previous described methods [25]. Principal component analysis (PCA) was applied to the environmental variables measured in this study and also presented in a previous study [24], using R v. 3.6.1.

2.2. DNA Extraction and 16S rRNA Gene Amplification and Sequencing

DNA was extracted from 0.5 g (w.w.) of each homogenized soil sample, using the PowerSoil™ DNA isolation kit (MoBio, Carlsbad, CA, USA), according to the manufacturer’s instructions. The 16S rRNA gene was amplified with the prokaryotic primer pair 515F-Y (5′-GTGYCAGCMGCCGCGGTAA-3′) [31] and 926R (5′-CCGYCAATTYMTTTRAGTTT-3′) [32] in order to be paired-end sequenced on an Illumina MiSeq platform using V3 Chemistry (Illumina), according to Sousa and co-workers [33]. Sequencing was carried out by LGC Genomics (LGC Genomics GmbH, Berlin, Germany).

2.3. Amplification and Sequencing of KS and AD Domain Sequences

Degenerate primer pairs degKS2F (5′-GCNATGGAYCCNCARCARMGNVT)/degKS2R(5′-GTNCCNGTNCCRTGNSCYTCNAC) [5] and A3F (5′-GCSTACSYSATSTACACSTCSGG)/A7R(5′-SASGTCVCCSGTSCGGTA) [4] were used to amplify KS and AD domains, respectively, from the same DNA samples used for the 16S rRNA gene amplification. The PCR reaction was prepared in a volume of 20 μL containing 1× TaKaRA PCR Buffer (TAKARA BIO INC, Shiga, Japan), 1.5 mM MgCl2 (TAKARA BIO INC, Shiga, Japan), 250 μM dNTPs (TAKARA BIO INC, Shiga, Japan)), 0.625 μL of each primer (100μM), 0.25 mg/mL of UltraPureTM BSA (Life technologies, Waltham, MA USA), 0.5 U TaKaRa Taq™ Hot Start Version (TAKARA BIO INC Shiga, Japan)), and 2 μL of template DNA. The PCR conditions were executed as following: initial denaturation step at 95 °C for 4 min, followed by 40 cycles of a denaturation step at 94 °C during 40 s, annealing at 56.3 °C for 40 s (KS), or 67.5 °C for 30 s (AD), and extension at 72 °C for 75 s and 60 s, for KS and AD, respectively, followed by a final extension step at 72 °C for 5 min. Amplified PCR products were sequenced using Illumina MiSeq 2×300 technology, as described previously [34], at LGC Genomics (LGC Genomics GmbH, Berlin, Germany).

2.4. Sequence Analysis and Taxonomic Assignment of 16S rRNA Gene Amplicons

The sequence analysis of 16S rRNA gene amplicons was performed in DADA2 version 1.12.1 [35] The demultiplexed and primer-clipped reads were trimmed based on quality and length (240 and 160 bp for forward and reverse reads, respectively). Trimmed sequences were dereplicated, denoised, merged, and chimeras were removed. The resulting 16S rRNA gene amplicon sequence variants (ASVs) were taxonomically classified against SILVA v.132 using the Naive Bayes classifier [36]. The ASV table and taxonomy were imported into the phyloseq R package [37] to perform alpha and beta-diversity analysis.

2.5. Sequence Analysis and Taxonomic Assignment of KS and AD Domains

Primer-clipped forward and reverse fastq sequences from KS and AD domains were quality trimmed using bbduk, which is part of the BBMap suite version 38.34 (available online: https://sourceforge.net/projects/bbmap/) and truncated to 240 and 175 bp, respectively, using USEARCH v11.0.667 [38], as described in literature [34]. The reads were then reordered to obtain the correct match pairs (using the repair.sh tool from BBMap, available online: https://sourceforge.net/projects/bbmap/) and the matching pairs were concatenated with an intervening “N” using USEARCH. The sequence identifiers of each sample were renamed to allow for discrimination on the statistical analysis and all the samples were combined in a single file. The sequences were dereplicated using USEARCH, clustered at 97% identity, the singletons were removed, and a second round of clustering at 95% of identity was performed, as described previously [34]. Finally, VSEARCH v2.10.4 [39] was used to generate an OTU (operational domain unit) table that was imported to phyloseq [37] for alpha and beta-diversity analysis. The alpha-diversity metrics computed were the number of observed OTUs and Shannon, for beta-diversity, the Bray–Curtis metric was estimated and visualized through principal coordinate analysis method (PCoA). The final plots were obtained using the ggplot2 v.3.1.0 [27] R package. For correlations between the 16S rRNA gene, the most abundant bacterial phyla and the biosynthetic domains, Chao dissimilarity matrices and Mantel tests were computed using the vegan R package 2.56 [40].
For the annotation of KS and AD sequences, the representative OTU sequences generated through USEARCH were aligned locally by BLAST+ version 2.9.0 [41] against the RefSeq non-redundant protein sequences (nr) database. The best hit of each representative KS and AD OTU was retrieved, and BLAST results were curated in order to detect false positives, in which case these were removed. The accession number of each best hit was used to recover the lineage of the closest representatives of each KS and AD OTU using an in-house python script (available online: https://github.com/antonioggsousa/get_taxonomy_lineage.py). The taxonomy classification was included in the respective KS and AD OTUs tables generated in VSEARCH and imported to phyloseq to compute relative abundance of the taxonomic provenience of KS and AD domains that were represented in bar plots.

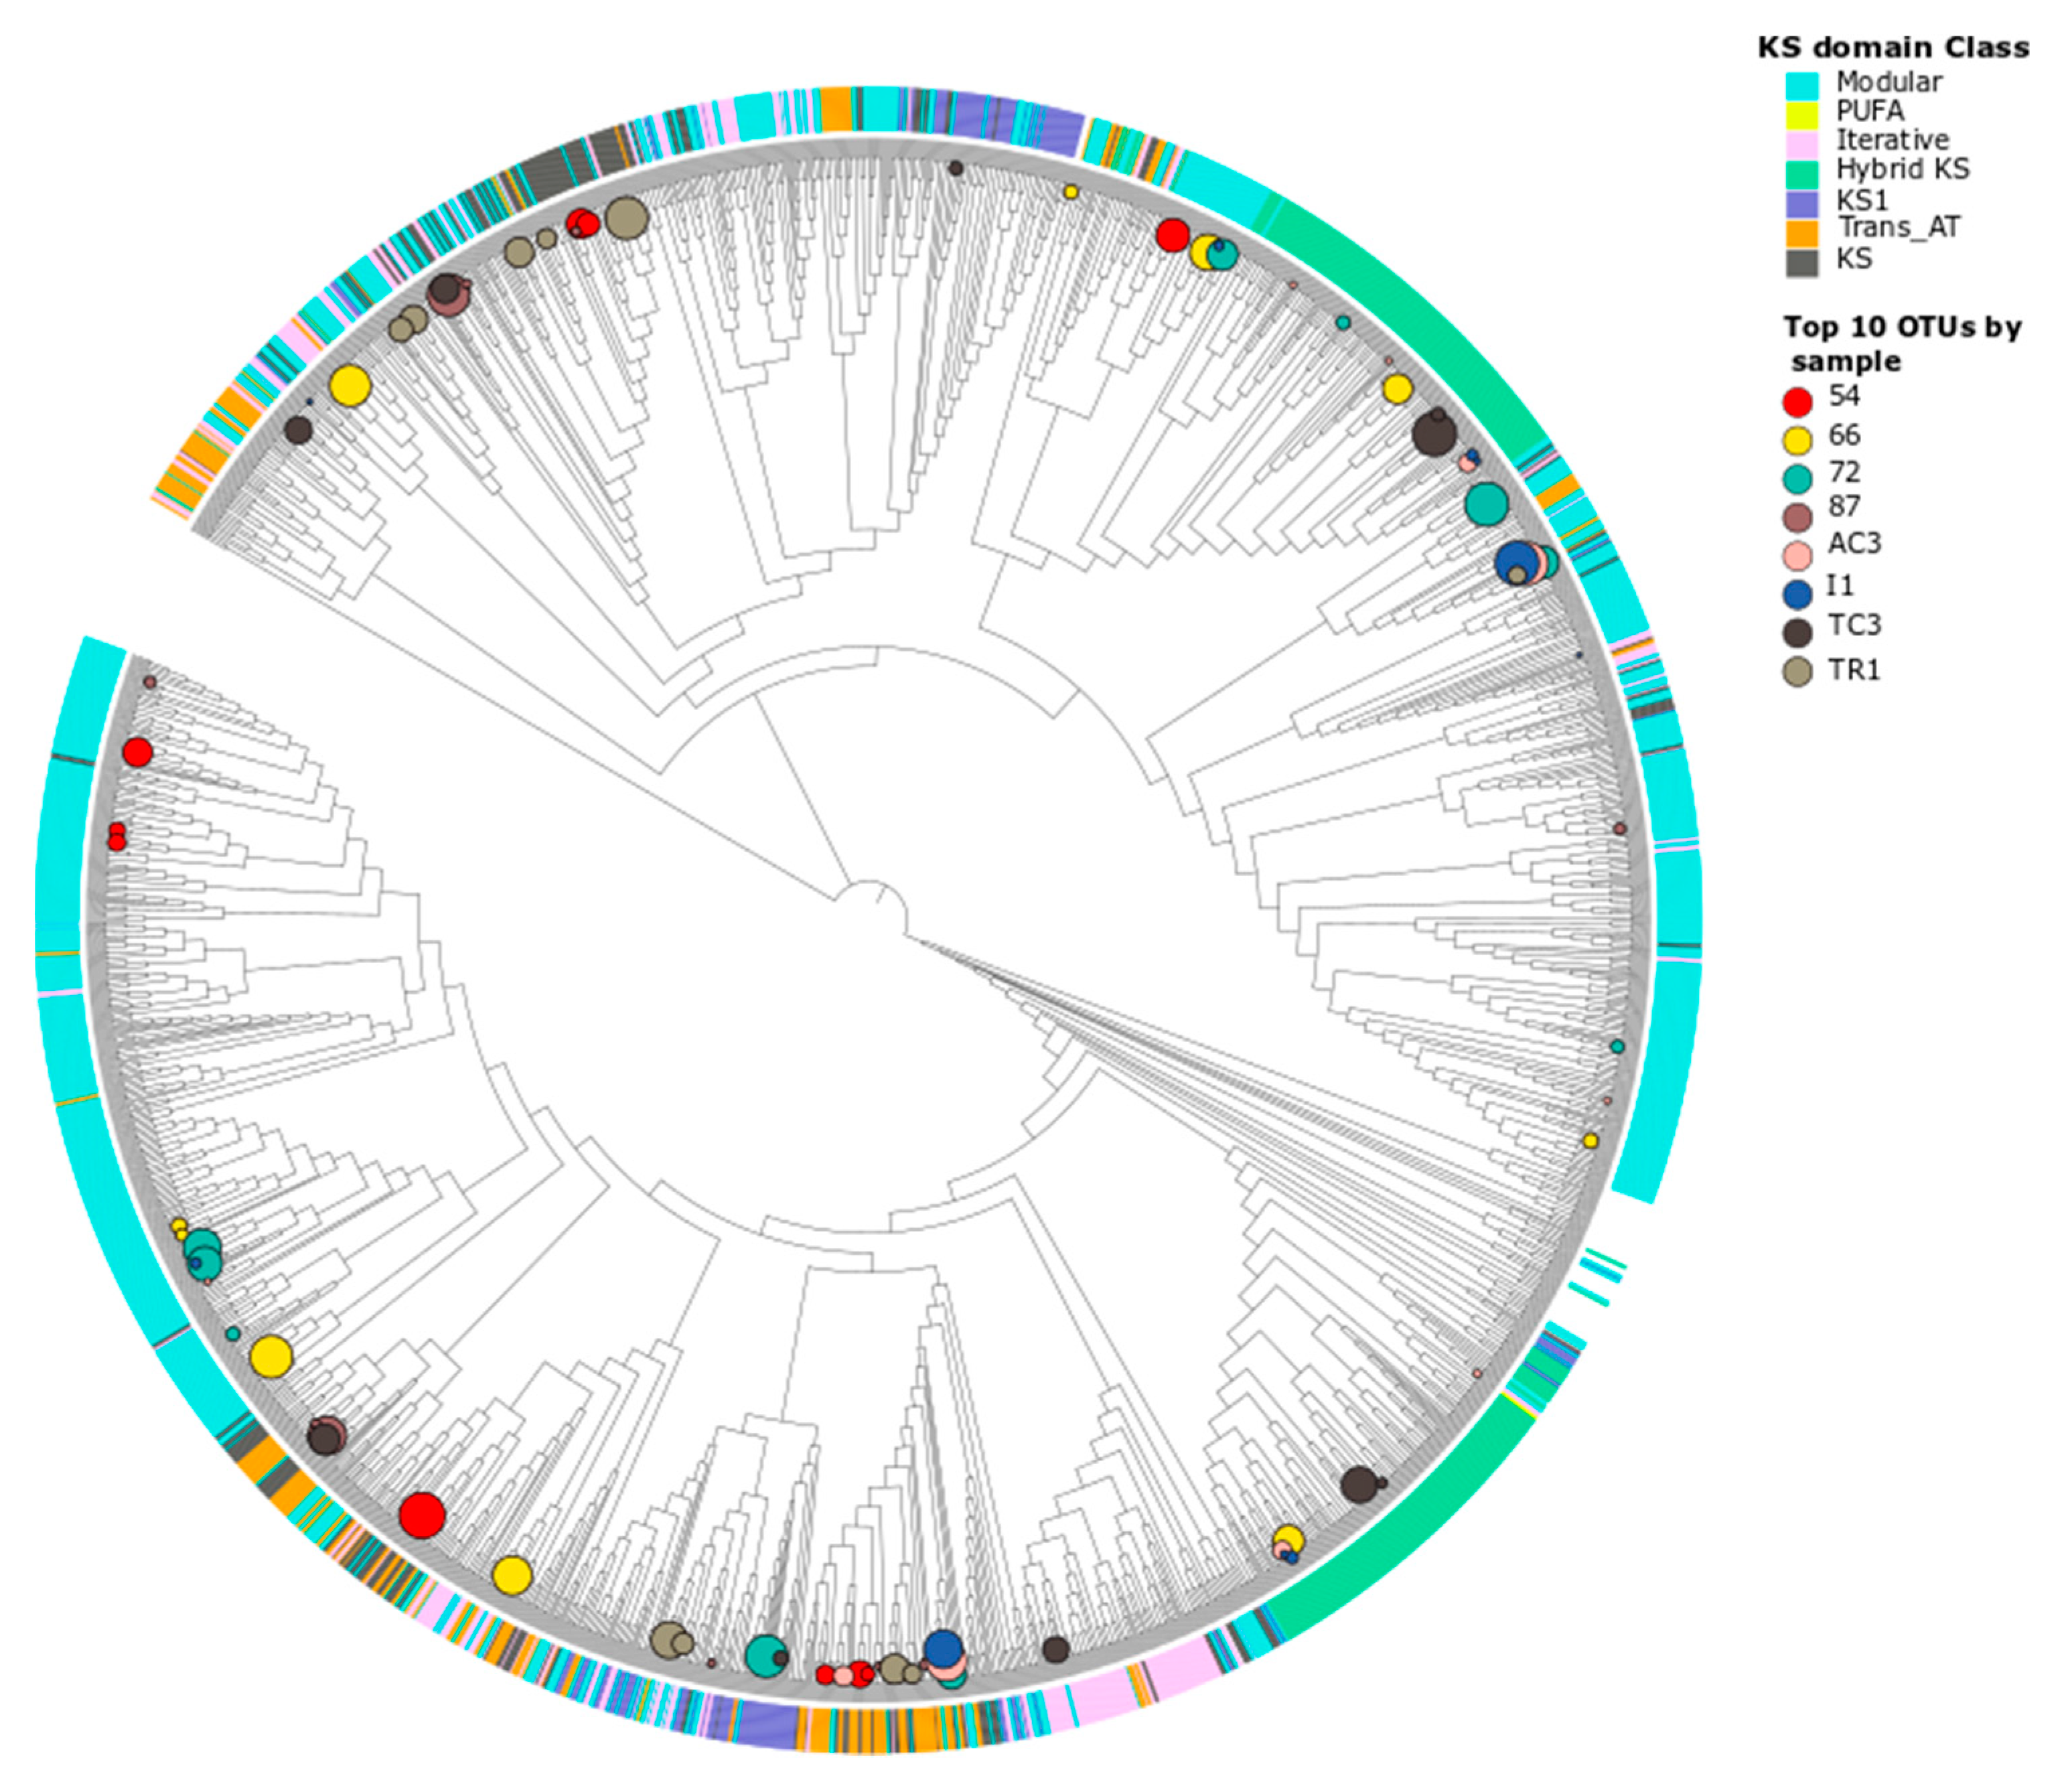
2.6. Phylogenetic Analysis

Multiple sequence alignment (using the ClustalW algorithm) and phylogenetic analysis were performed in MEGA X [42]. The corrected Akaike information criterion (AICc) was used to determine the best nucleotide substitution model in MEGA X. The phylogenetic trees [37] were reconstructed using the maximum likelihood statistical method, bootstrap (with 500 replications), and the corresponding best nucleotide substitution model (GTR + G + I for both domains). Phylogenetic trees were visualized and annotated in iTOL v.4.4.2 [43].

2.7. Functional Annotation of KS and AD Domain Sequences to the MiBIG Database

KS and AD OTU sequences were aligned locally with BLAST+ version 2.9.0 against the MiBiG database v.1.4 [44]. BLAST matches with an e-value above 10−20 were reported as Not Assigned (NA), due to low statistical confidence. The R packages phyloseq and ggplot2 [27] were used for downstream analysis and visualization, including relative and total abundance classification and functional summary charts. Circos software [45] was used to create heatmaps and circular plots. Chemical structures were drawn using ChemDraw v19.0.1.28 (available online: https://www.perkinelmer.com/category/chemdraw).

3. Results and Discussion

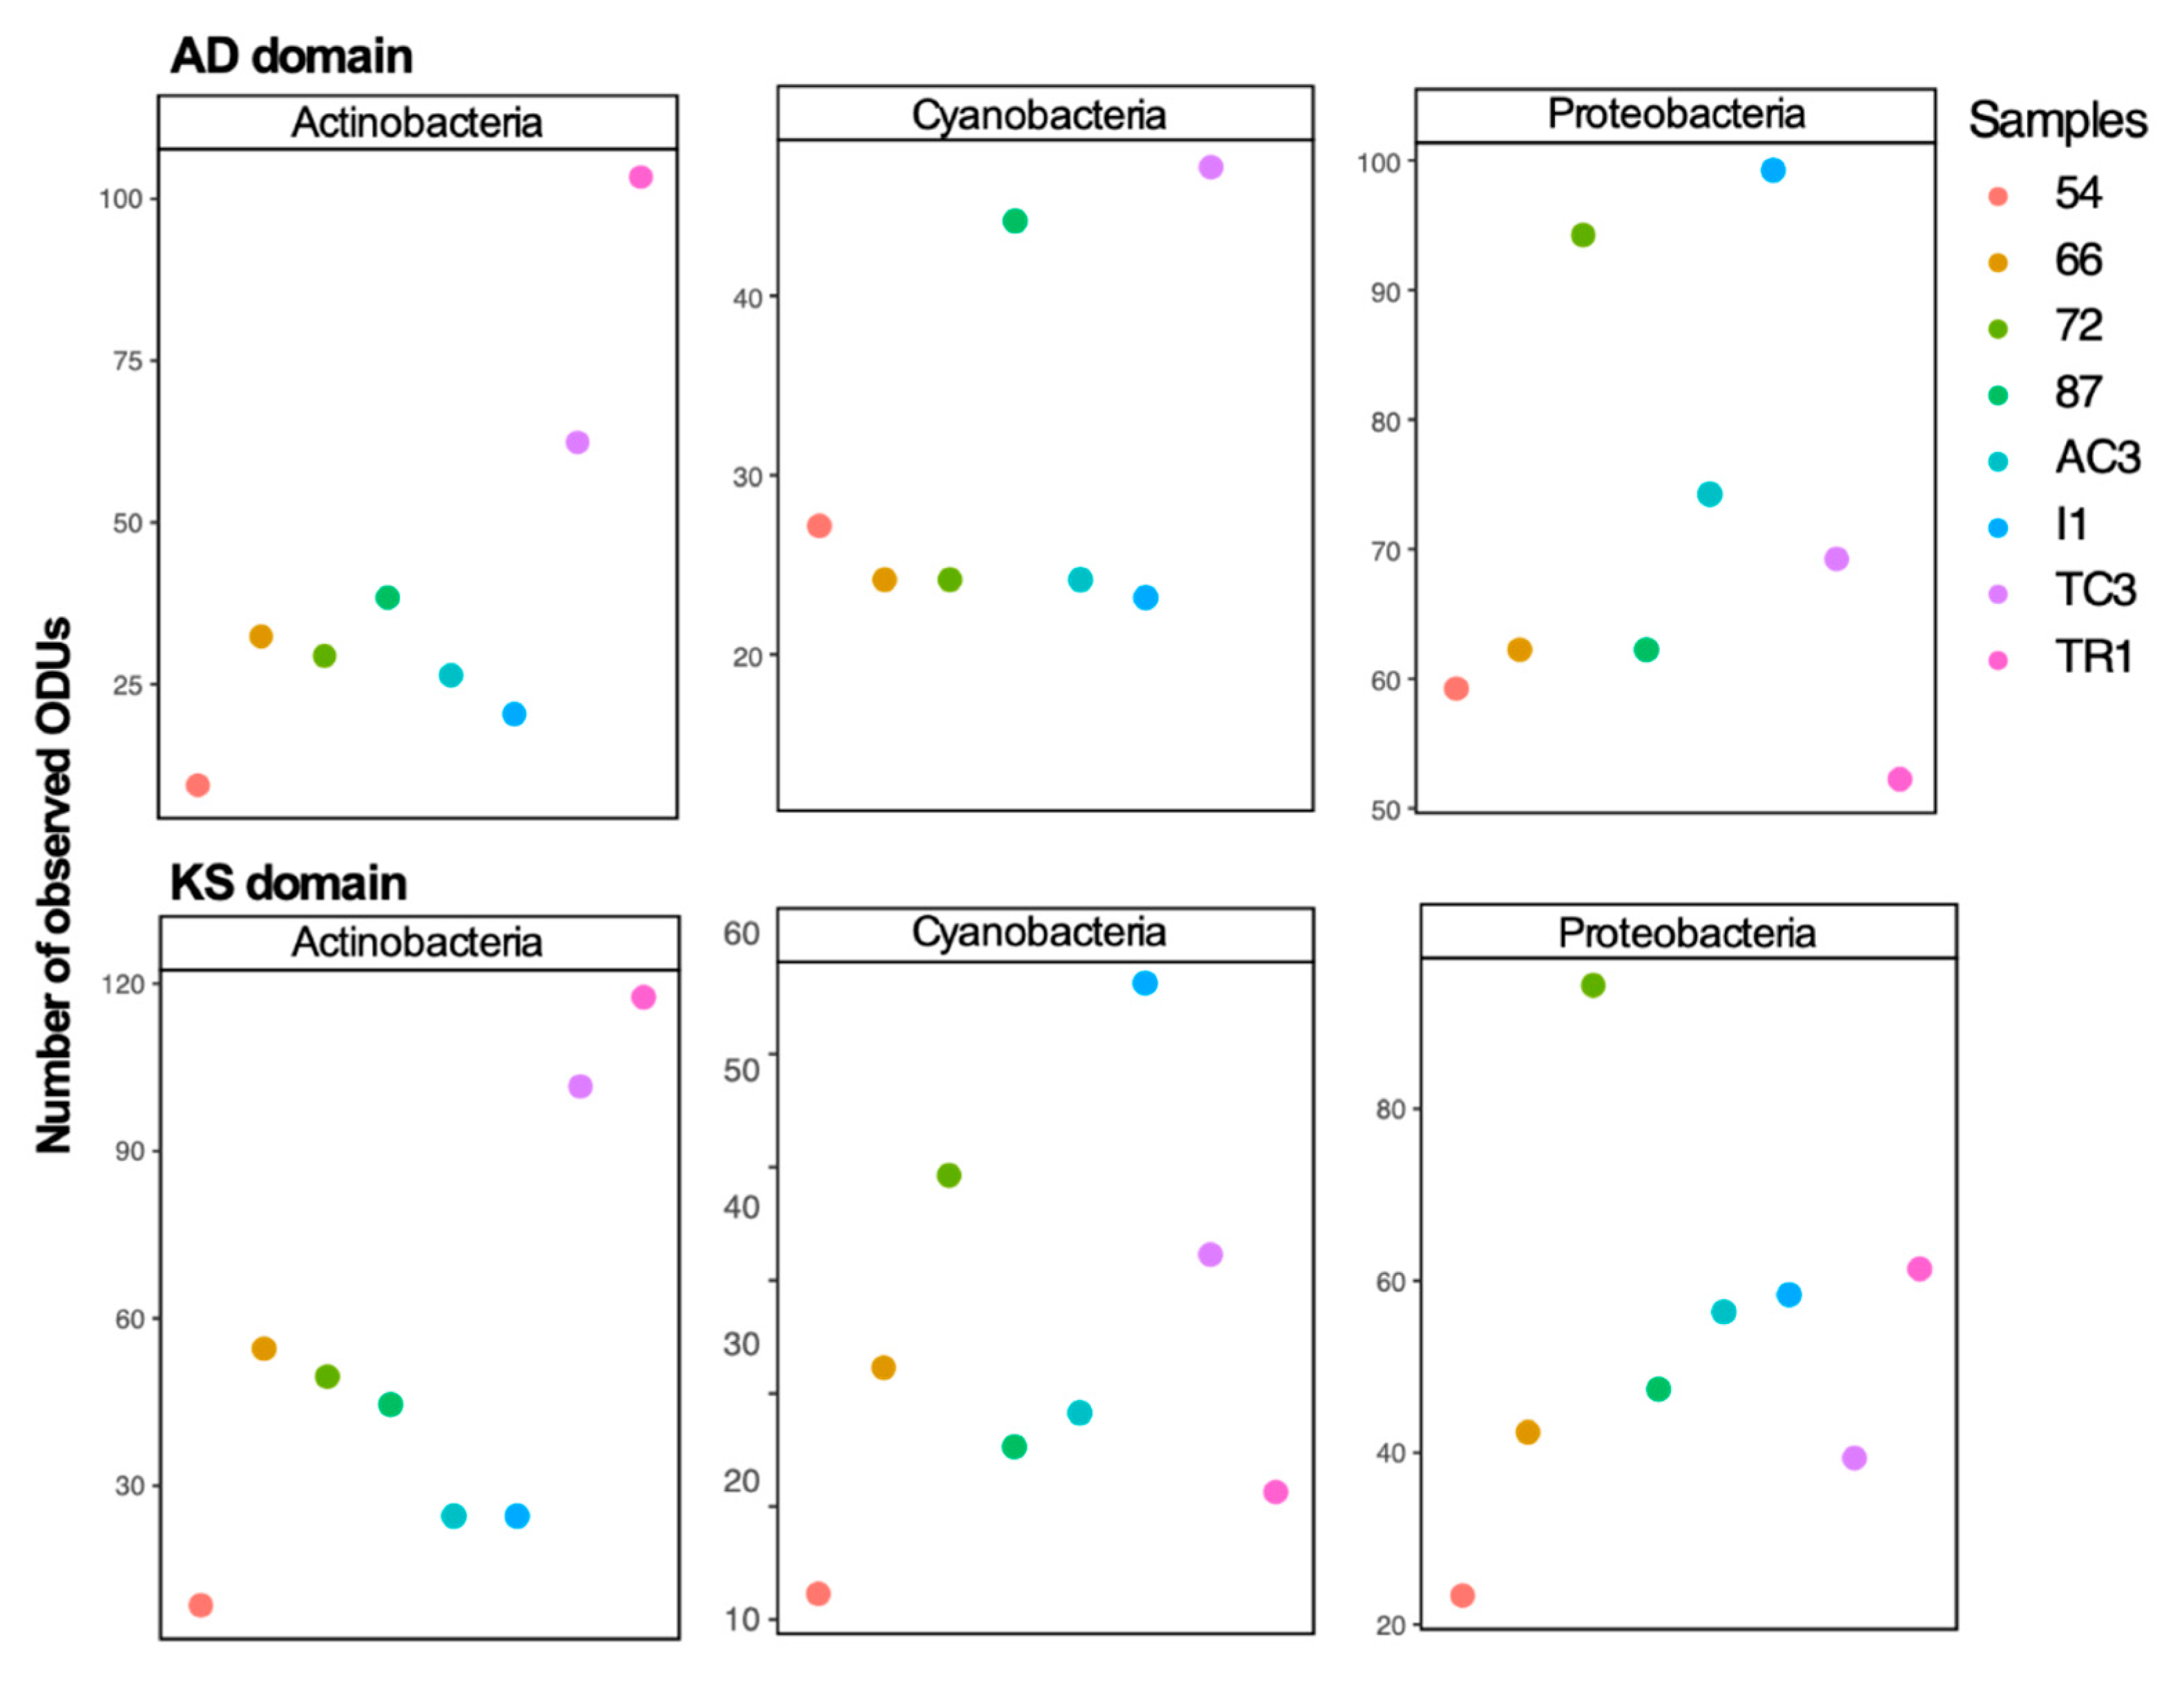
3.1. Diversity of 16S rRNA Gene, KS and AD Domains in the Maxwell Bay Peninsula, Antarctica

In total, 1710 and 1012 OTUs were successfully retrieved for KS and AD domain of PKS and NRPS genes, respectively. The degenerated primers used showed specificity to the target domains since false positives accounted for less than 4 % and 1% of the total number of OTUs retrieved for KS and AD domains, respectively. Rarefaction plots revealed the diversity of the samples was exhaustively recovered for all samples, except for sample 54 (Figure S1).
To examine differences between 16S rRNA gene diversity and biosynthetic domain diversity between samples, diversity indices (number of ASVs/OTUs and Shannon index) were computed (Figure 2 and Figure 3). A distinct clustering and diversity pattern between the 16S rRNA gene and the conserved biosynthetic motifs of PKS and NRPS genes was detected through the beta-diversity and alpha-diversity metrics (Figure 2). The most diverse samples regarding the distribution of the biosynthetic domains—samples 72, I1, and TC3—were the least diverse for the 16S rRNA gene (Figure 2). It is interesting to note that while computing KS and AD domain alpha-diversity individually for the main prolific phyla (Actinobacteria, Cyanobacteria, and Proteobacteria [46]), it is clear that these phyla are highly diverse in samples 72, I1, and TC3 (Figure 3), which share environmental attributes (Figure S2). To determine the existence of a correlation between the diversity of the functional genes and specific bacterial phyla, Mantel correlation tests between the generated Chao dissimilarity matrices for each marker gene and the bacterial phyla, were performed. A positive correlation between the diversity of biosynthetic genes and the diversity of the known-producers Proteobacteria, Actinobacteria, and Planctomycetes and for the less known Acidobacteria and Gemmatimonadetes bacterial phyla was observed (Table 1). Recently Borsetto and co-workers [13] also found the Gemmatimonadetes phylum to be positively correlated with biosynthetic genes’ diversity.
Curiously, samples 72 and TC3, the most biosynthetically diverse (Figure 2), are located geographically very closely to sample 54 (Figure 1), the least biosynthetically diverse (Figure 2). The beta-diversity metric supports this observation, since sample 54 groups independently, suggesting a distinct biosynthetic composition. In agreement, the principal components analysis (PCA) applied to the environmental variables (Table S1) indicates that sample 54 was distinguished from others by being associated with high total organic matter and water content (Figure S2). A previous study from our team [47] has revealed that in samples with higher water availability, from McMurdo Dry Vallleys, Antarctica, Actinobacteria dominance was replaced by other phyla, such as Cyanobacteria. Similarly, sample 54 harbors a lower relative abundance and richness of Actinobacteria (Figure 4A) which might be related to the observed shift in KS/AD diversity (Figure 2). Recently Benaud and co-workers [12] reported that drier polar soils are usually associated with a greater amplification of NRPS and PKS genes, which is in agreement with our data.
Previous studies have revealed that soil type [48], actinobacteria richness, geographic location [7], and, more recently, latitude and pH [9] are preponderant factors determining the biosynthetic diversity in environmental microbiomes. In our samples, the geographic location seems to differentiate sample AC3 from the others with respect to environmental characteristics (Figure S2) but did not dictate differences in biosynthetic or taxonomic diversity (Table S1).
The bacterial taxonomy profile is quite similar across the studied samples, what is expected since samples were collected in a limited spatial area. However, a few changes are noticed such as a relative increased of Proteobacteria and Bacteroidetes in sample TR1 in detriment of Actinobacteria and Verrucomicrobia (Figure 4A). According to the PCA analysis (Figure S2), TR1 diverges from the other samples by being related with higher concentrations of Hg, Pb, Zn, and Cd in soils, thus these chemical variables may be driving differences in the taxonomic composition of this sample. The bacterial community distribution, including the most abundant bacterial phyla (Proteobacteria, Bacteroidetes, Acidobacteria, and Actinobacteria) are in agreement with previous reports in Fildes Peninsula [20,23].
In comparison with similar studies in different ecosystems, such as American desert soil [8], urban park soils [34], and even from soils distributed at a global scale [7] the biosynthetic diversity observed in Maxwell Bay (Tables S2 and S3) is clearly inferior, which is expected for a continent with extreme environmental constraints [13]. Very recently, Benaud [12] and Borsetto [13] have assessed biosynthetic diversity in Antarctica, and while diversity indices presented here are not directly comparable with Benaud and co-worker’s study [12] due to different methodological procedures, they are in agreement with the ones presented by Borsetto [13].
The conserved regions of the KS domain are informative of genes tightly associated with bioactivity [49] and allow for a phylogeny-based classification of the PKS gene [50], while this is not observed with the AD domain of NRPSs. A phylogenetic tree constructed from the KS domain sequences obtained in this study (Figure 5), indicates that these sequences cluster within the described classes in the NaPDoS database [50]. The sequences are mainly distributed within modular and hybrid PKS whereas only two OTUs were identified as PUFA synthases and none were associated to the biologically active enediyne class. In the phylogenetic trees for both domains (Figure 5 for KS and Figure S3 for AD domains), the sequences from the same sample do not group into a single biosynthetic class or phylogenetic clade, but are distributed along the tree, as previously observed in other studies [8]. These results suggest that the retrieved KS and AD sequences from the different samples share diverse ancestors. It is well-established that PKS and NRPS evolution is driven by horizontal gene transfer (HGT) [46,51], and this has recently been observed also for polar soils [12].

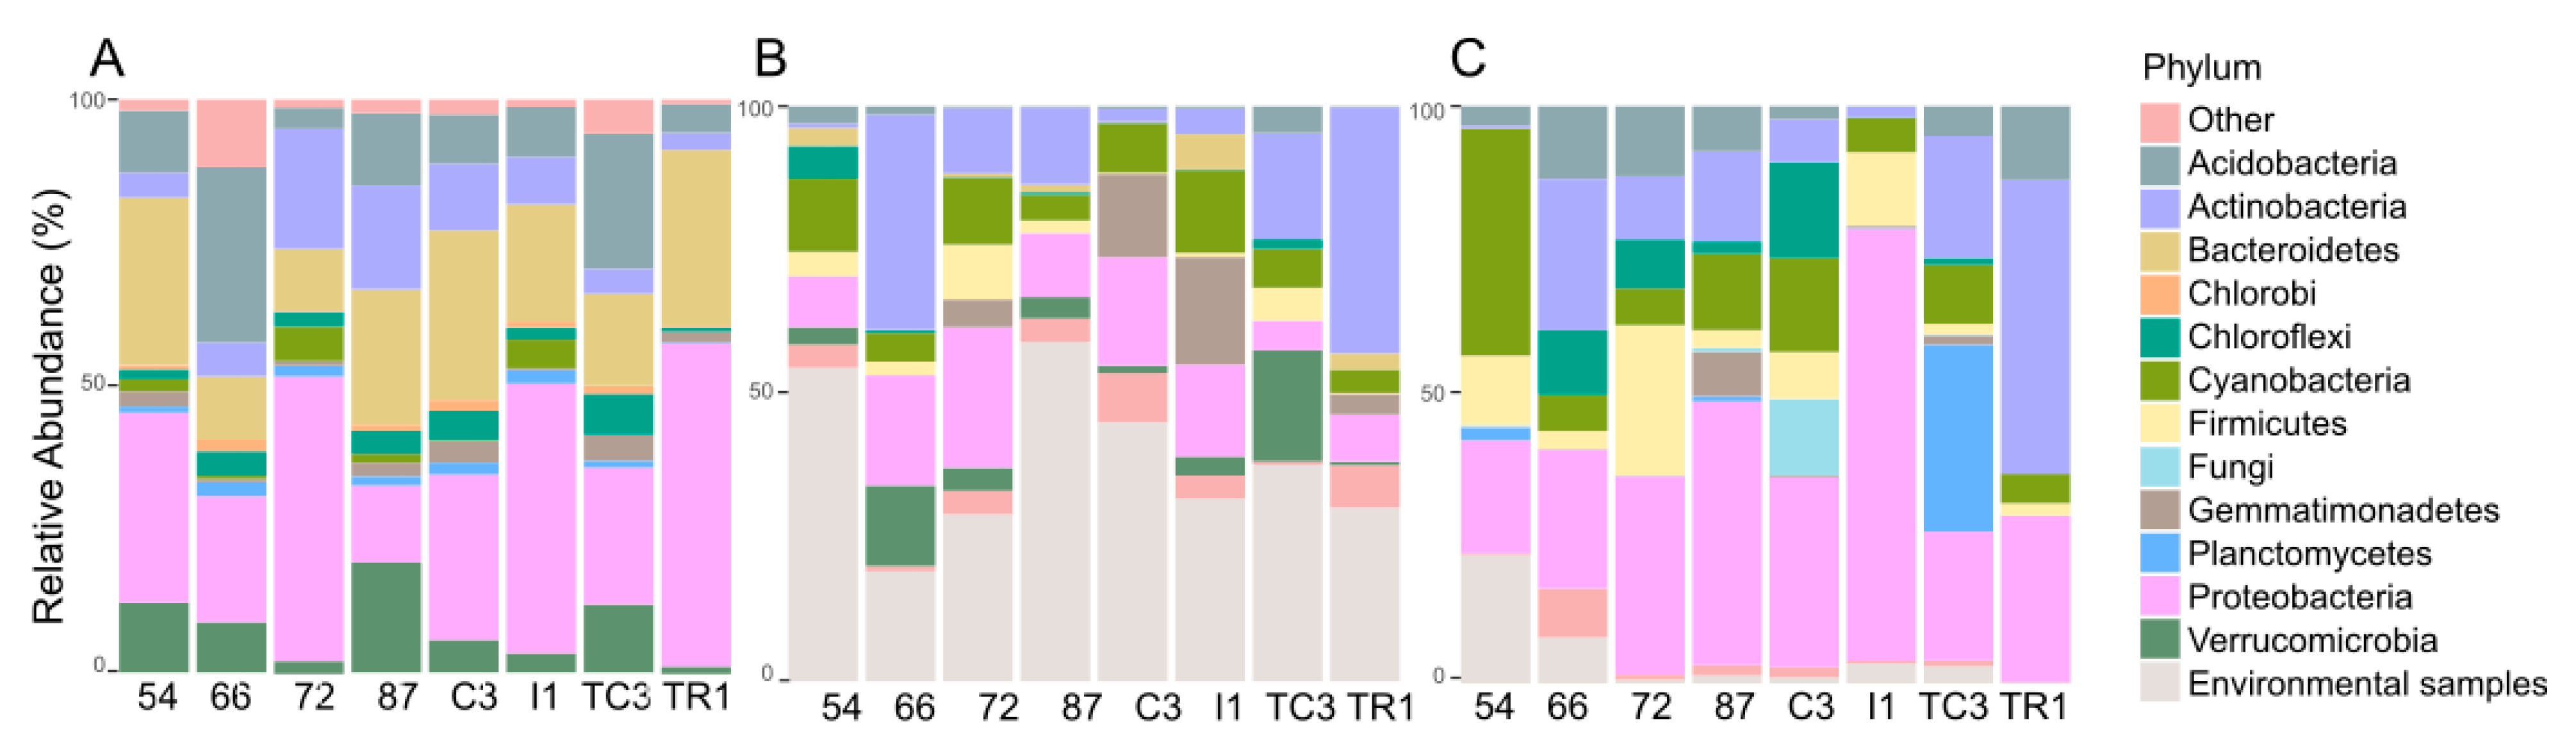
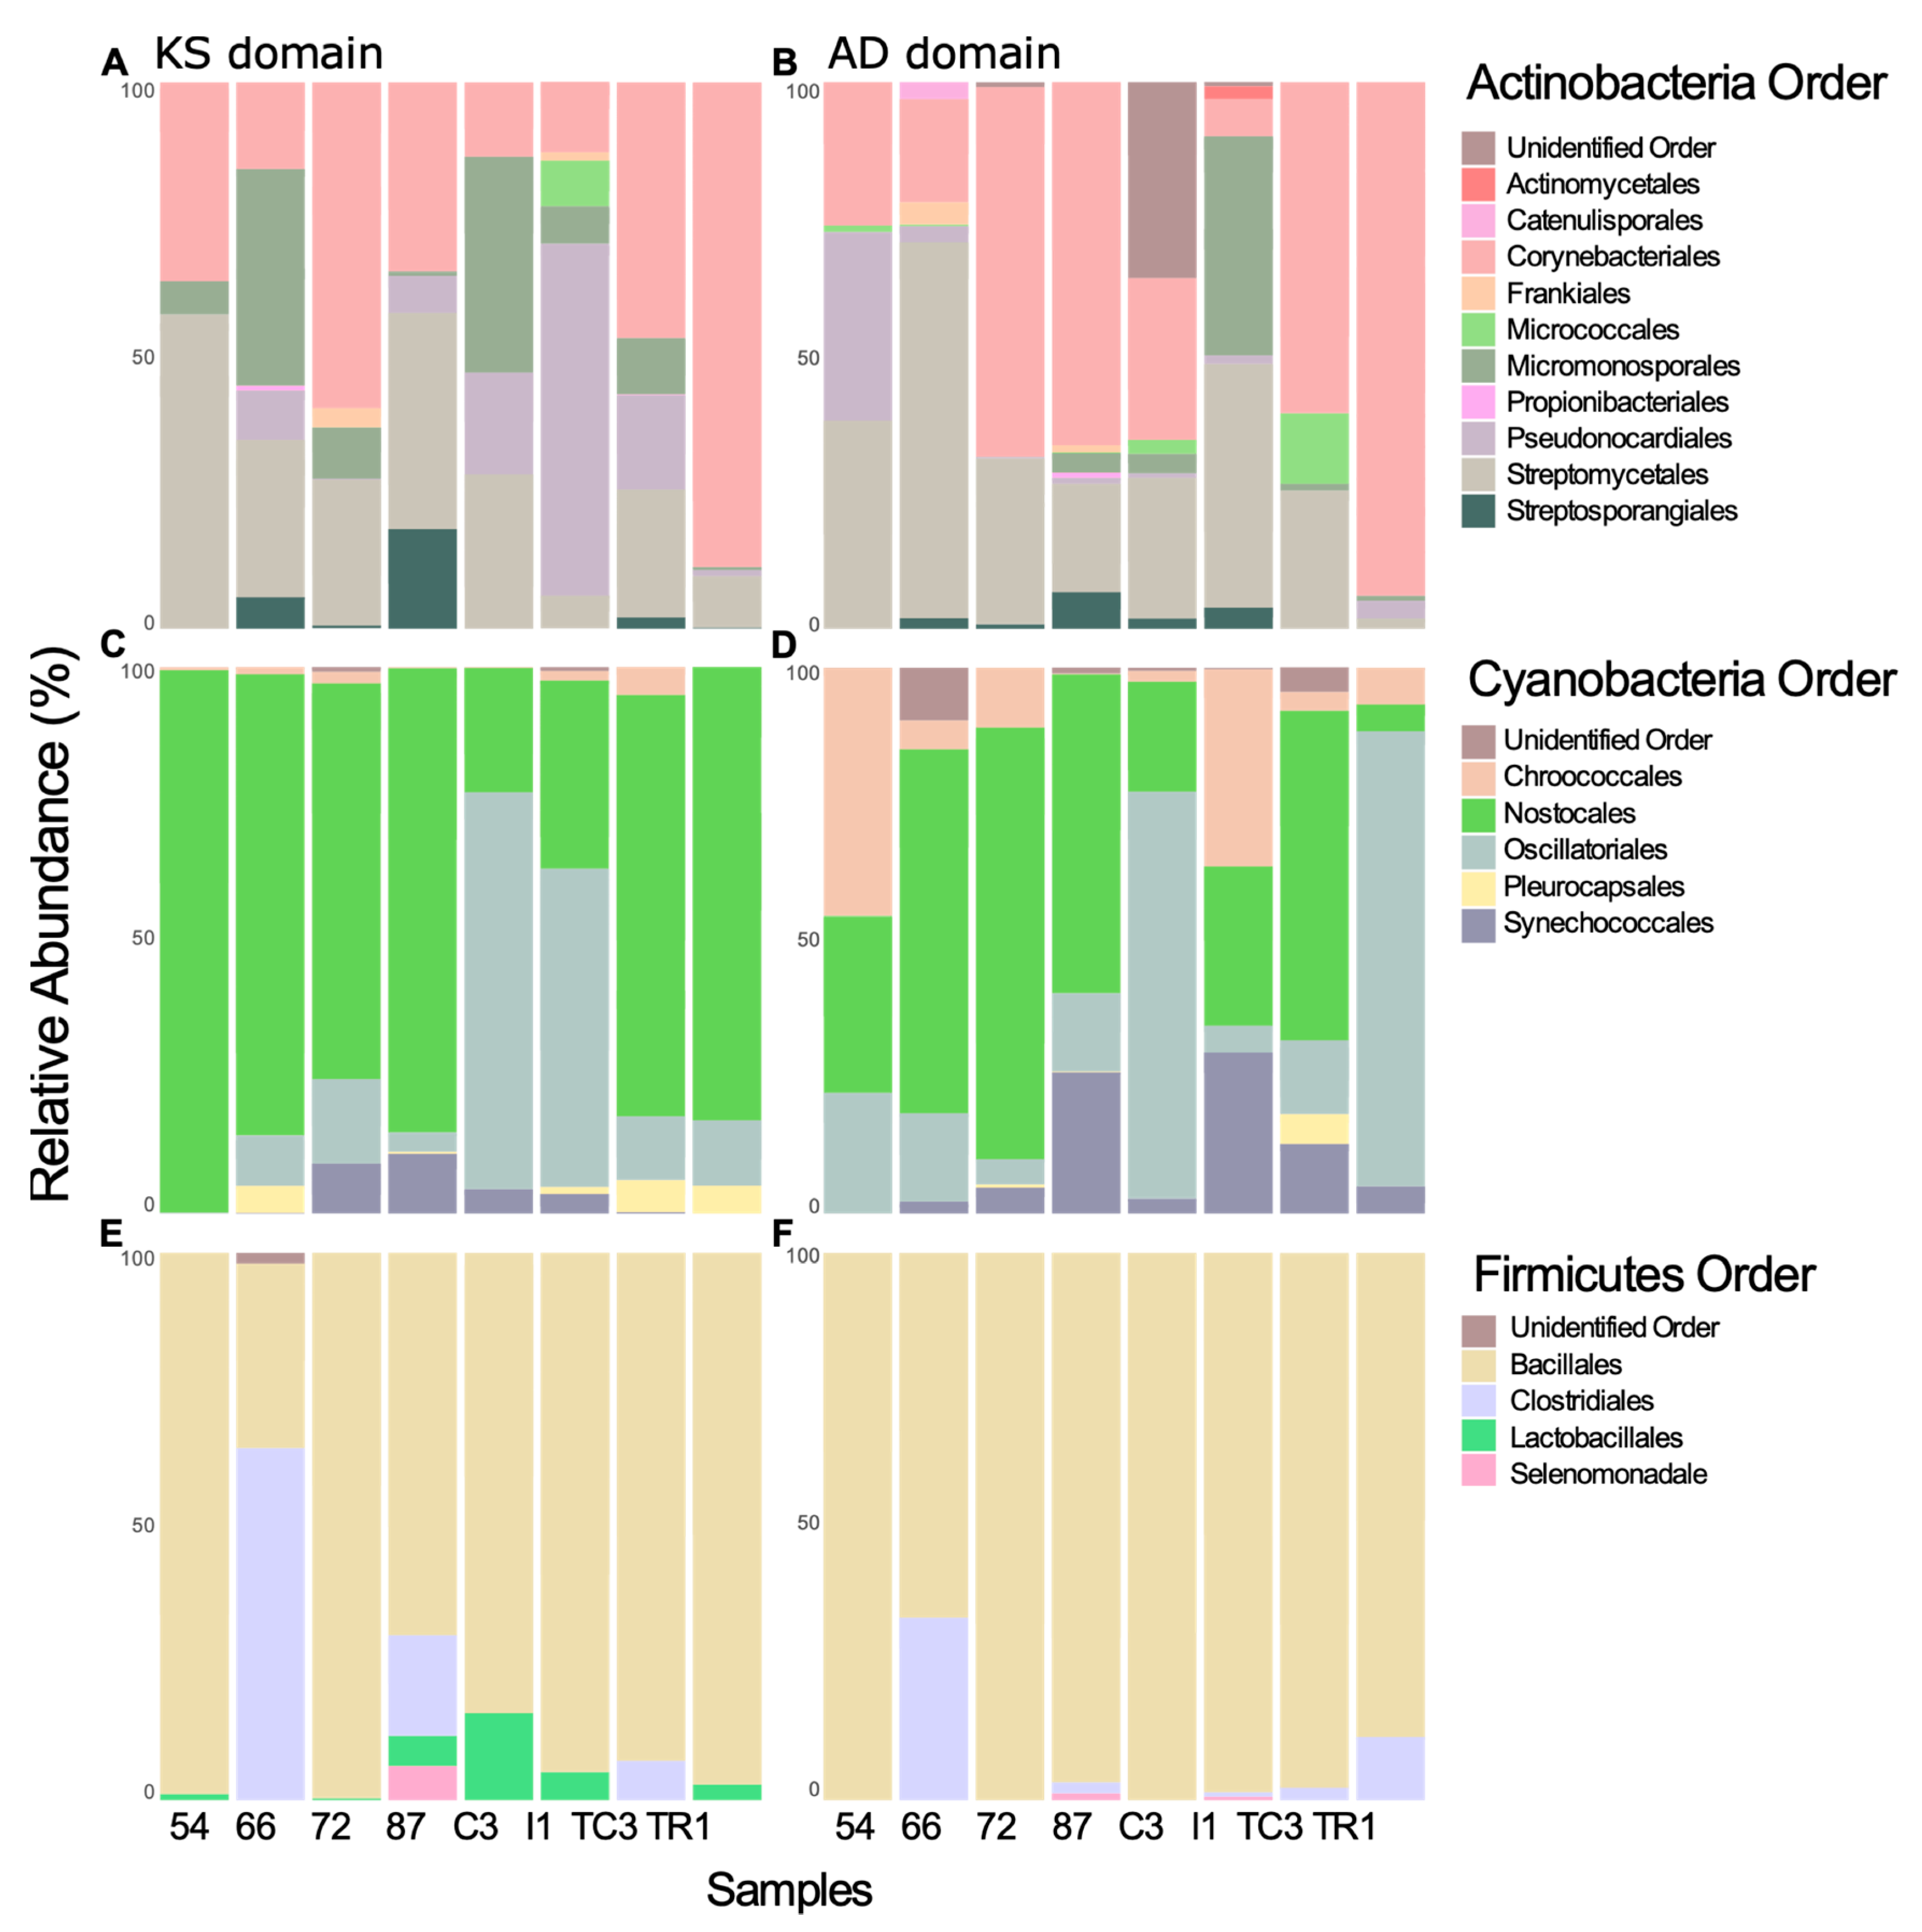
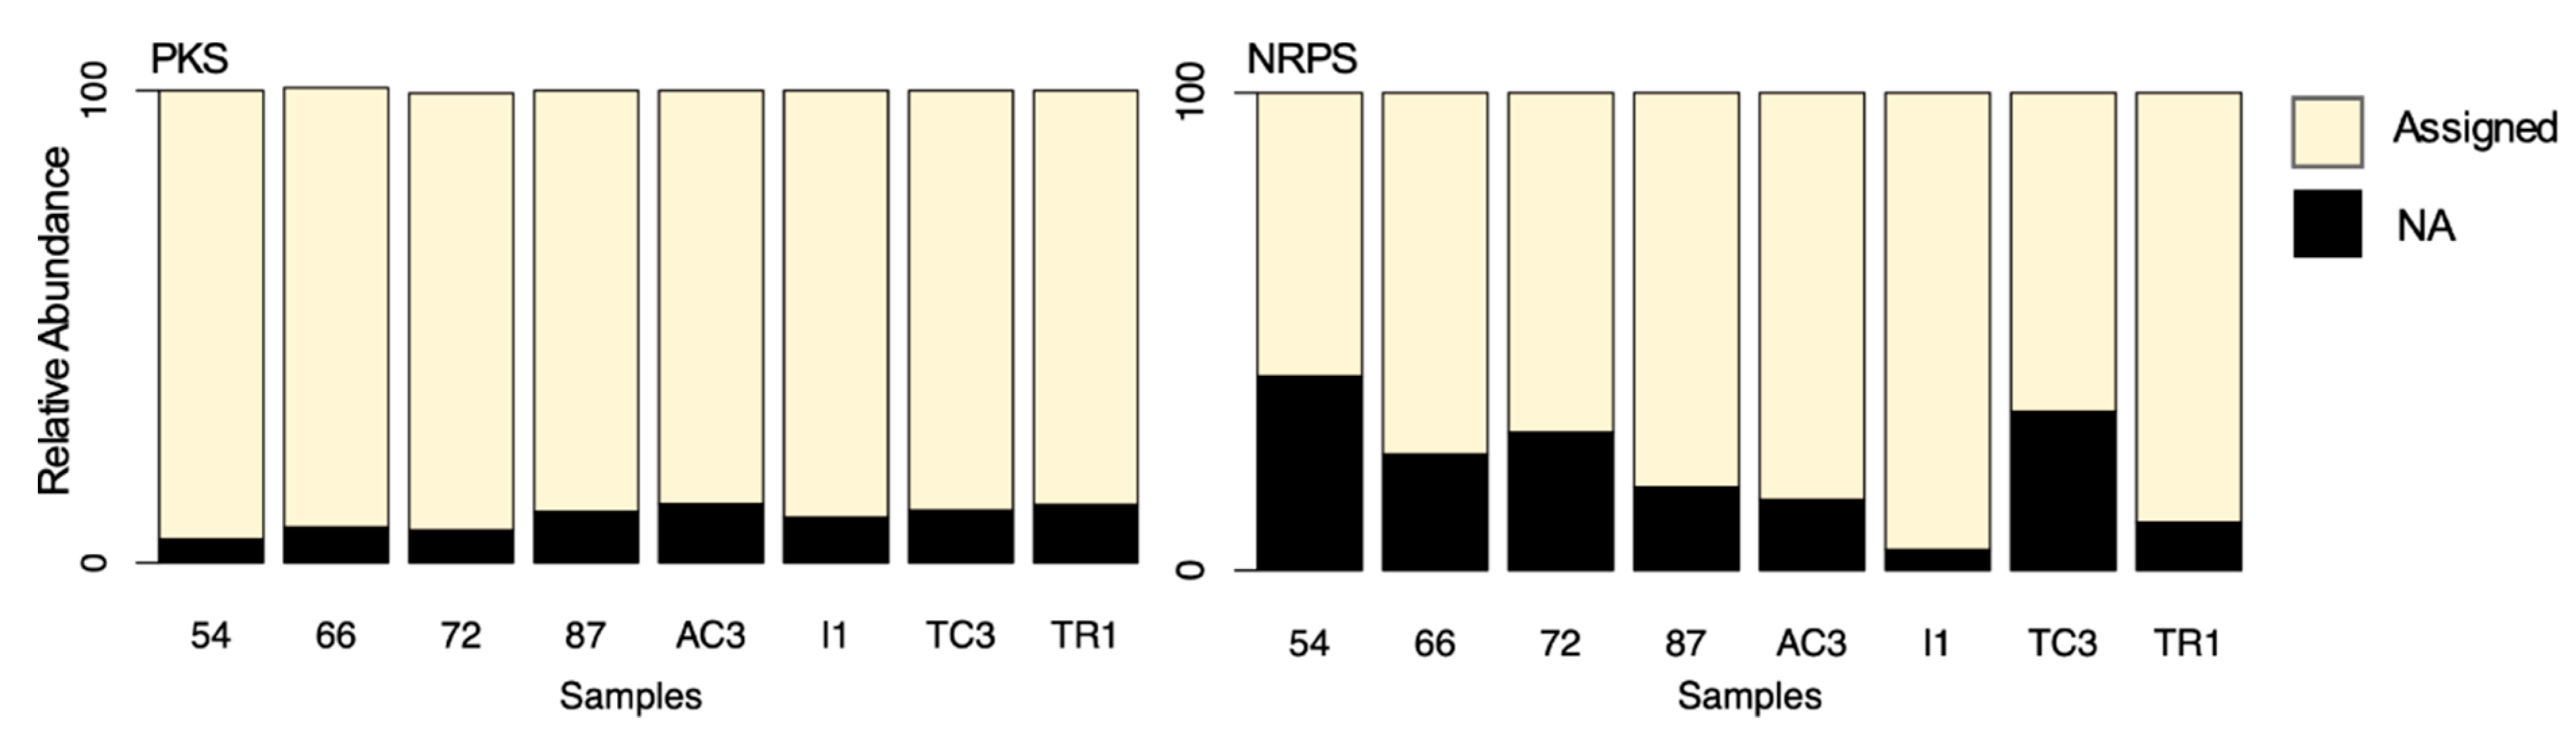
3.2. Taxonomic Provenience of the Recovered Biosynthetic Genes’ Sequences

The comparison between 16S rRNA and biosynthetic genes’ diversity taxonomy can provide clues on the ecological roles of the bacterial phyla associated to the biosynthetic diversity and understand their distribution in the bacterial community.
In this study, no congruence was observed between the most representative phyla according to the 16S rRNA gene and the inferred taxonomic provenience for the KS or AD domains (Figure 4). A similar pattern was previously observed by Reddy and co-workers [8] where the metagenomes assessed shared a similar distribution of the major bacterial phyla, however they contained highly distinct collections of secondary metabolite biosynthetic genes. For example, in our data Chlorobi is represented as one of the 10 most abundant bacterial phyla according to the 16S rRNA gene (Figure 4A), however it was not recovered as a major group either for KS (Figure 4B) or AD domains (Figure 4C). The opposite was observed for the Firmicutes phylum, scarcely represented in the 16S rRNA gene dataset (Figure 4A), and predominating in both KS and AD domains (Figure 4B,C). This phylum is known to contain species rich in PKS and/or NRPS biosynthetic gene clusters [46]. A detailed description of the taxonomic provenience of PKS and NRPS genes recovered in the different samples is described below.

3.2.1. Taxonomic Identity of PKS Genes

Proteobacteria is less represented in the KS domain than in 16S rRNA gene (Figure 4A,B), while the relative abundance of Actinobacteria, Cyanobacteria, and Firmicutes increased in the KS domain dataset (Figure 4A,B). Proteobacteria is also considered a NP-rich phylum but the fact that we used primers originally designed to amplify PKS and NRPS genes from Actinobacteria species [4,5], might explain this difference. Interestingly, Gemmatimonadetes was detected in all samples and its abundance was highly represented in the KS domain comparing with the 16S rRNA dataset (Figure 4A,B). This is particularly evident for AC3 and I1 samples, in which KS domains assigned to Gemmatimonadetes account for 14% and 19% of all sequences, respectively (Figure 4B). The same was observed for Verrumicrobia, with 14% and 19% KS domains in samples 66 and TC3, respectively (Figure 4B). Very recently, Gemmatimonadetes and Verrumocrobia have been highlighted in a study revealing novel soil bacteria as harboring diverse genes for natural products’ biosynthesis [52]. OTUs closely related to KS domain sequences from “Candidatus Melainabacteria” (closely related to the biosynthetically rich Cyanobacteria) and “Candidatus Rukobacteria” were detected in samples I1 and 66 (data not shown, respectively, but no NPs have been reported from these sources).
KS domain provenience was also inspected at lower taxonomic levels to provide information of order and genus associated with the biosynthesis of PKs. Regarding Cyanobacteria, the order Nostocales is widely distributed among the samples and the order Oscillatoriales accounted for 72% and 58% of relative abundance of KS provenience in samples AC3 and I1, respectively (Figure 6C). Oscillatoriales produce the largest number of cyanobacterial metabolites described to date, followed by Nostocales [53]. Interestingly, KS domains sequences identified with high identity to the Cyanobacteria genus Moorea, the most prolific genus of cyanobacterial NPs [53], was detected with high abundance in samples AC3 and I1 (Table S6). Although, to our knowledge there are no reports of Antarctic Moorea strains to date, this result might indicate that the recovered sequences are associated with Moorea or other closely related genera. KS domains closely associated with the genus Nostoc, commonly retrieved from culture-based studies in Antarctica [54], and the second most NP-rich cyanobacterial genus [53], were detected in all samples (Table S6).
Regarding Actinobacteria, the chemically rich order Strepromycetales is widely distributed and accounts for 58% of KS domains sequences in sample 54 (Figure 6C). Sample TR1 is composed of 88% Corynebacteriales order, whereas sample I1 is composed of 64% of Pseudonocardiales (Figure 6C). Sequences matching to KS domains from the rare genera Actinoalloteichus, Kitasatospora, Mycobacterium, and Rhodococcus and to the two most NP-rich genera, Streptomyces and Micromonospora [55], were detected in high abundance across all samples (Table S4).
Matches to enzymes involved in the production of PKs from Firmicutes belong mostly to the order Bacillales, known to harbor genera rich in secondary metabolite gene clusters [56], however the orders Clostridiales, Lactobacillales, and Selenomonadales were also present (Figure 6E). The genus Paenibacillus, commonly retrieved in Antarctica studies [57], is widely distributed across the samples and in sample TR1 is associated with 94% of the KS domains (Table S8).
Regarding Verrucomicrobia phylum, genus Chthoniobacter and Verrucomicrobium are well represented across the samples (Table S10). In fact, recent genomic studies revealed that this phylum harbors biosynthetic gene clusters (BGCs) of PKS origin [58], however their products remain uncharacterized, mostly due to the difficulty of cultivating these bacteria in the laboratory.
A large percentage (from 19% to 59% of relative abundance by sample) of the assembled KS OTUs were most closely related to environmental sample sequences, likely obtained from metagenome surveys as well as biosynthetic gene mining studies across the globe [13,59,60].

3.2.2. Taxonomic Identity of NRPS Genes

The NP-rich Actinobacteria and Cyanobacteria [46] were most closely associated with 50% and 39% of ADs in samples TR1 and 54, respectively (Figure 4C). Proteobacteria-associated AD domain abundance was high across all samples, in this case in agreement with the 16S rRNA gene abundance (Figure 4A,C). The relative abundance of uncultured bacteria is not as high as that observed for KS domains. Additionally, in contrast with the KS domain dataset, several AD domain sequences were associated with Fungi and Planctomycetes, known to be rich in NRPS gene clusters [61,62] (Figure 4C).
At lower taxonomic levels, AD domain sequences associated with the actinobacterial Streptomycetales order were found to be widely distributed across most samples (exception was sample TR1), with the order Corynebacteriales accounting for over 90% of the AD domain closest matches (Figure 6B). Members of the Streptomycetales, specifically the Streptomyces genus are responsible for the synthesis of most of the antibiotics currently in use [63]. However, there are few reports of compounds isolated from Antarctic Streptomyces strains [64,65,66]. AD domain sequences associated with the non-Streptomyces actinobacteria, showed a prevalent distribution (>50% of relative abundance) in some samples: e.g., Mycobacterium in sample 87 and Nocardia in sample 72 (Table S5). Nocardia strains are also very rich producers of bioactive NPs [67] and have been previously isolated in Antarctic studies [68], but, to our knowledge, no compounds have been reported from Antarctic Nocardia strains (Table S5).
Among Cyanobacteria, the orders Chroococales, Nostocales, and Oscillatoriales were associated with AD domains in all samples (Figure 6D). The most abundant association was to the order Chroococales (45% of relative abundance) and, at the genus level, to Plankothrix (Oscillatoriales) (Table S7).
AD domains associated with the Firmicutes relate almost exclusively to the order Bacillales except in samples 66 and TR1, which harbor a higher relative abundance of members of the Clostridiales (Figure 6F). Bacillus, Brevibacillus, Paenibacillus, and Tumebacillus genera are widely distributed across all samples (except Brevibacillus, which is absent in sample TR1) (Table S9).

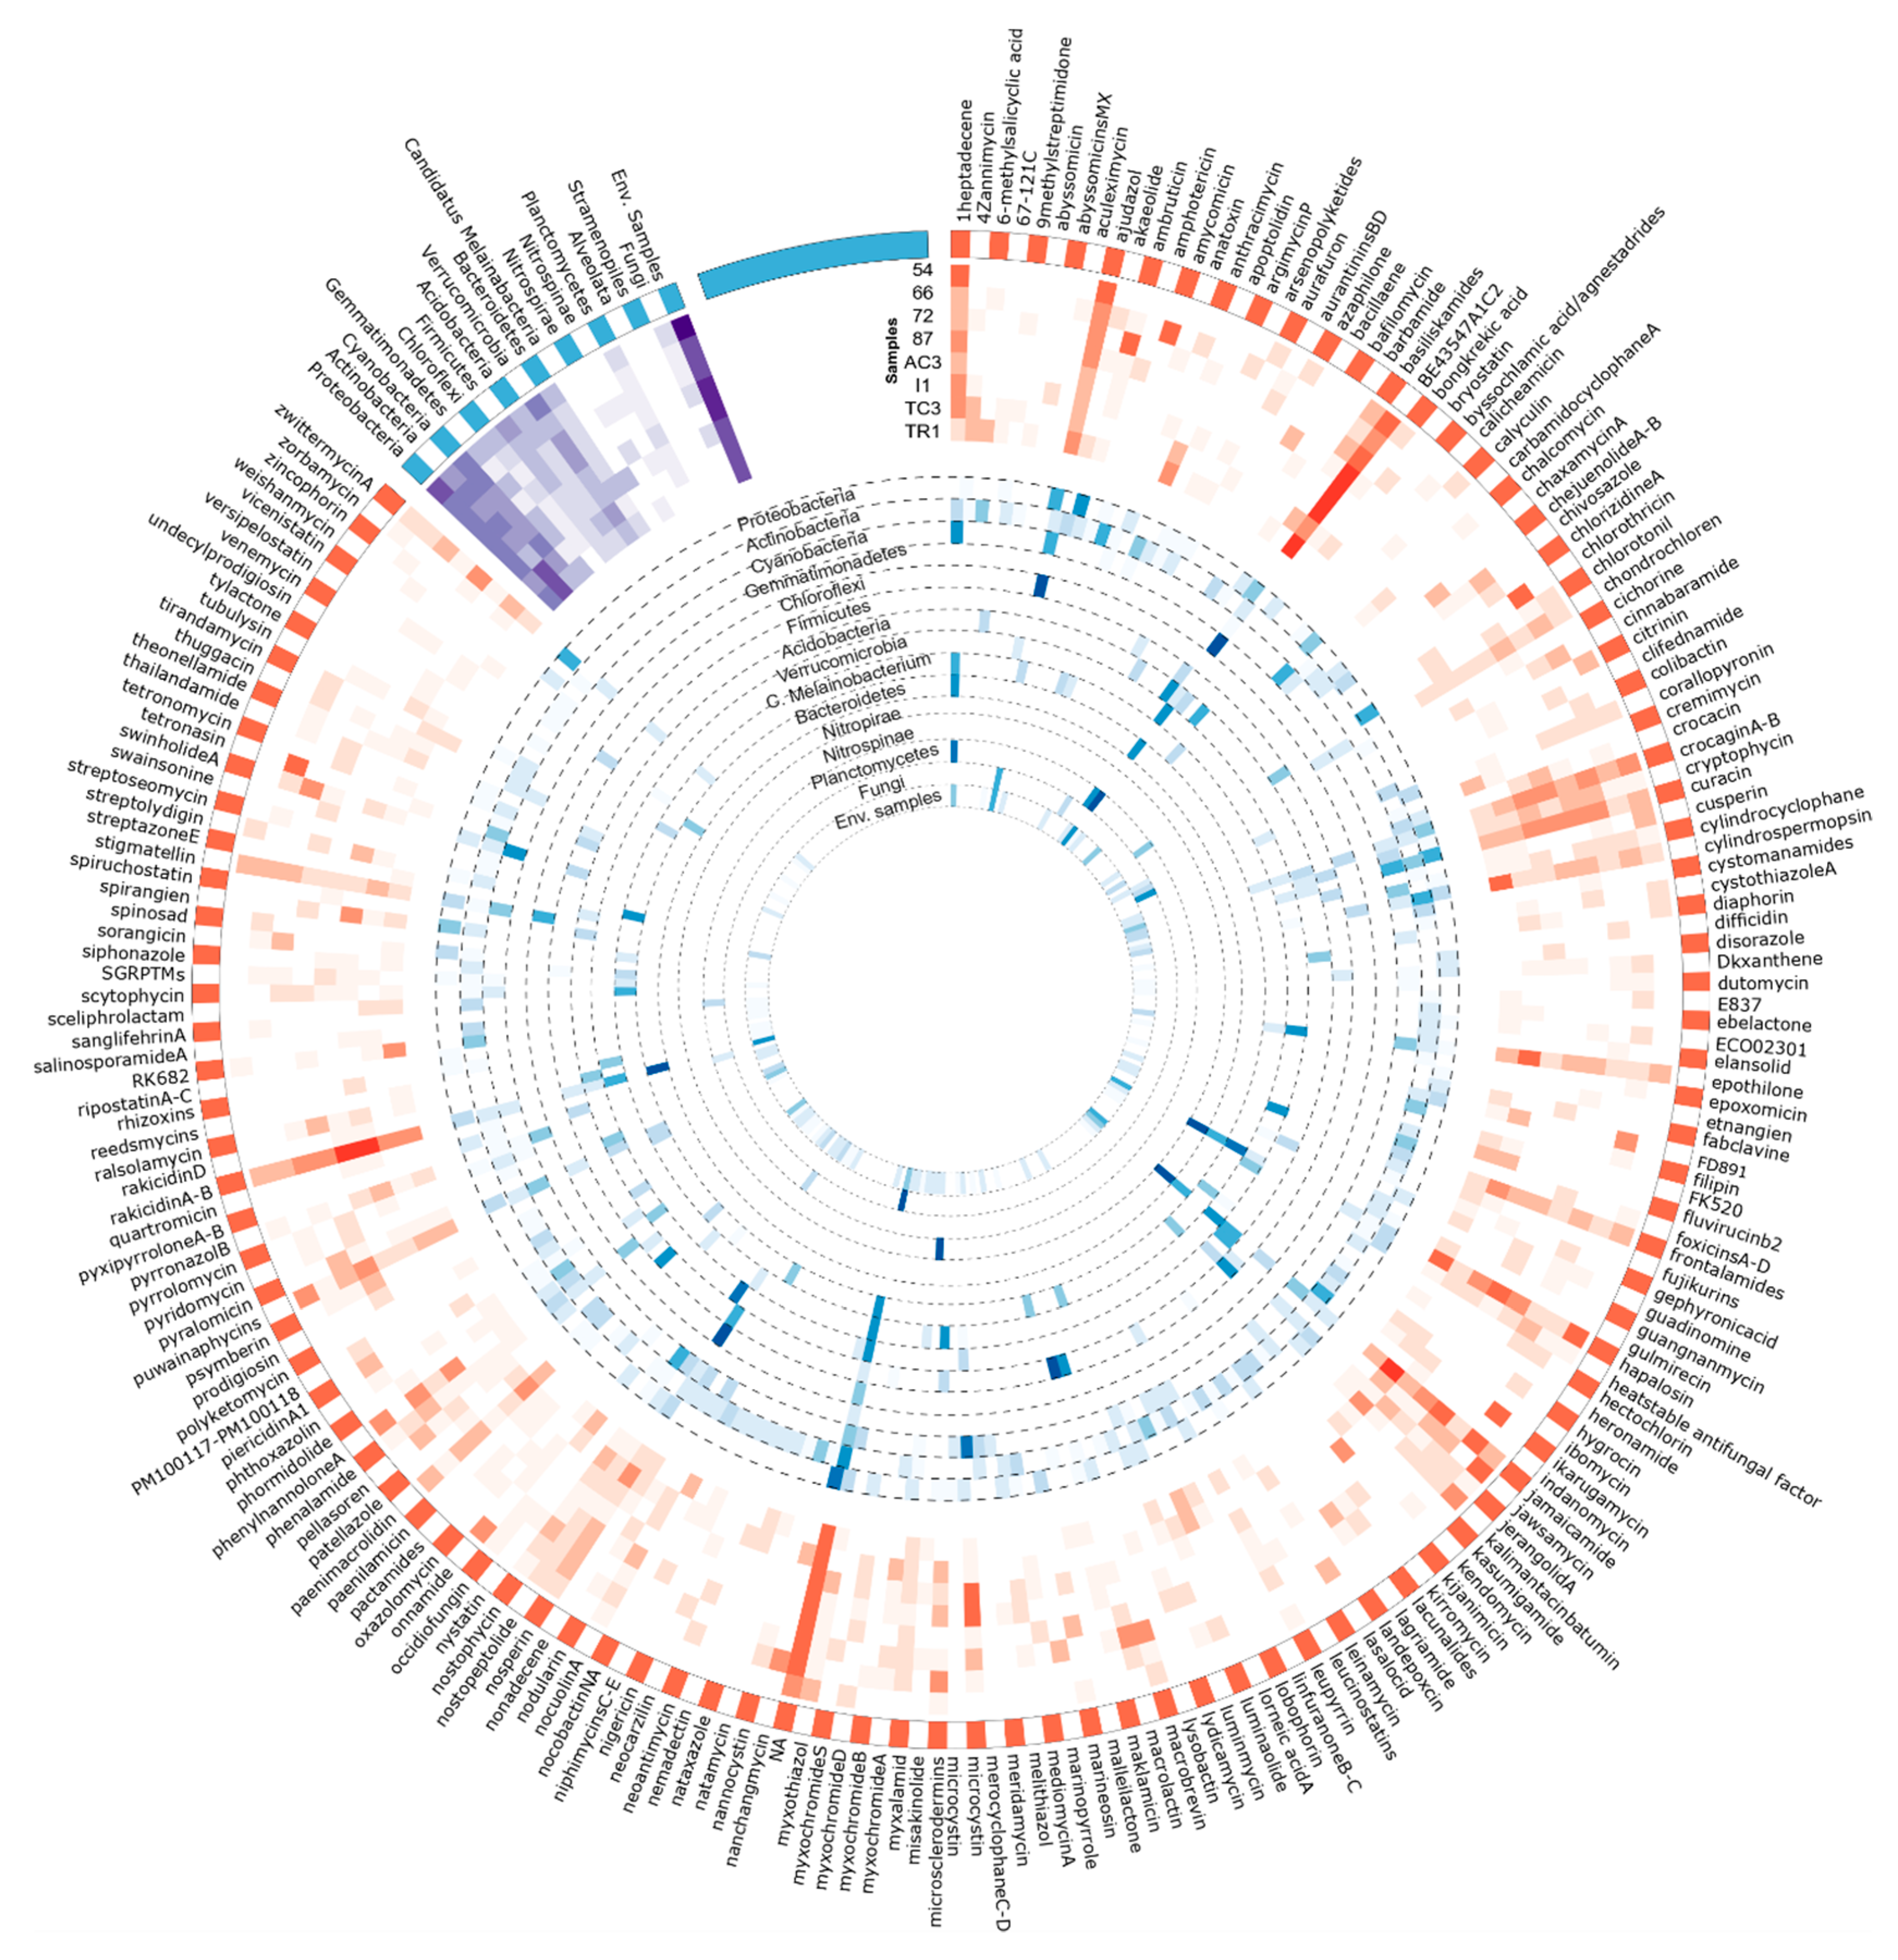
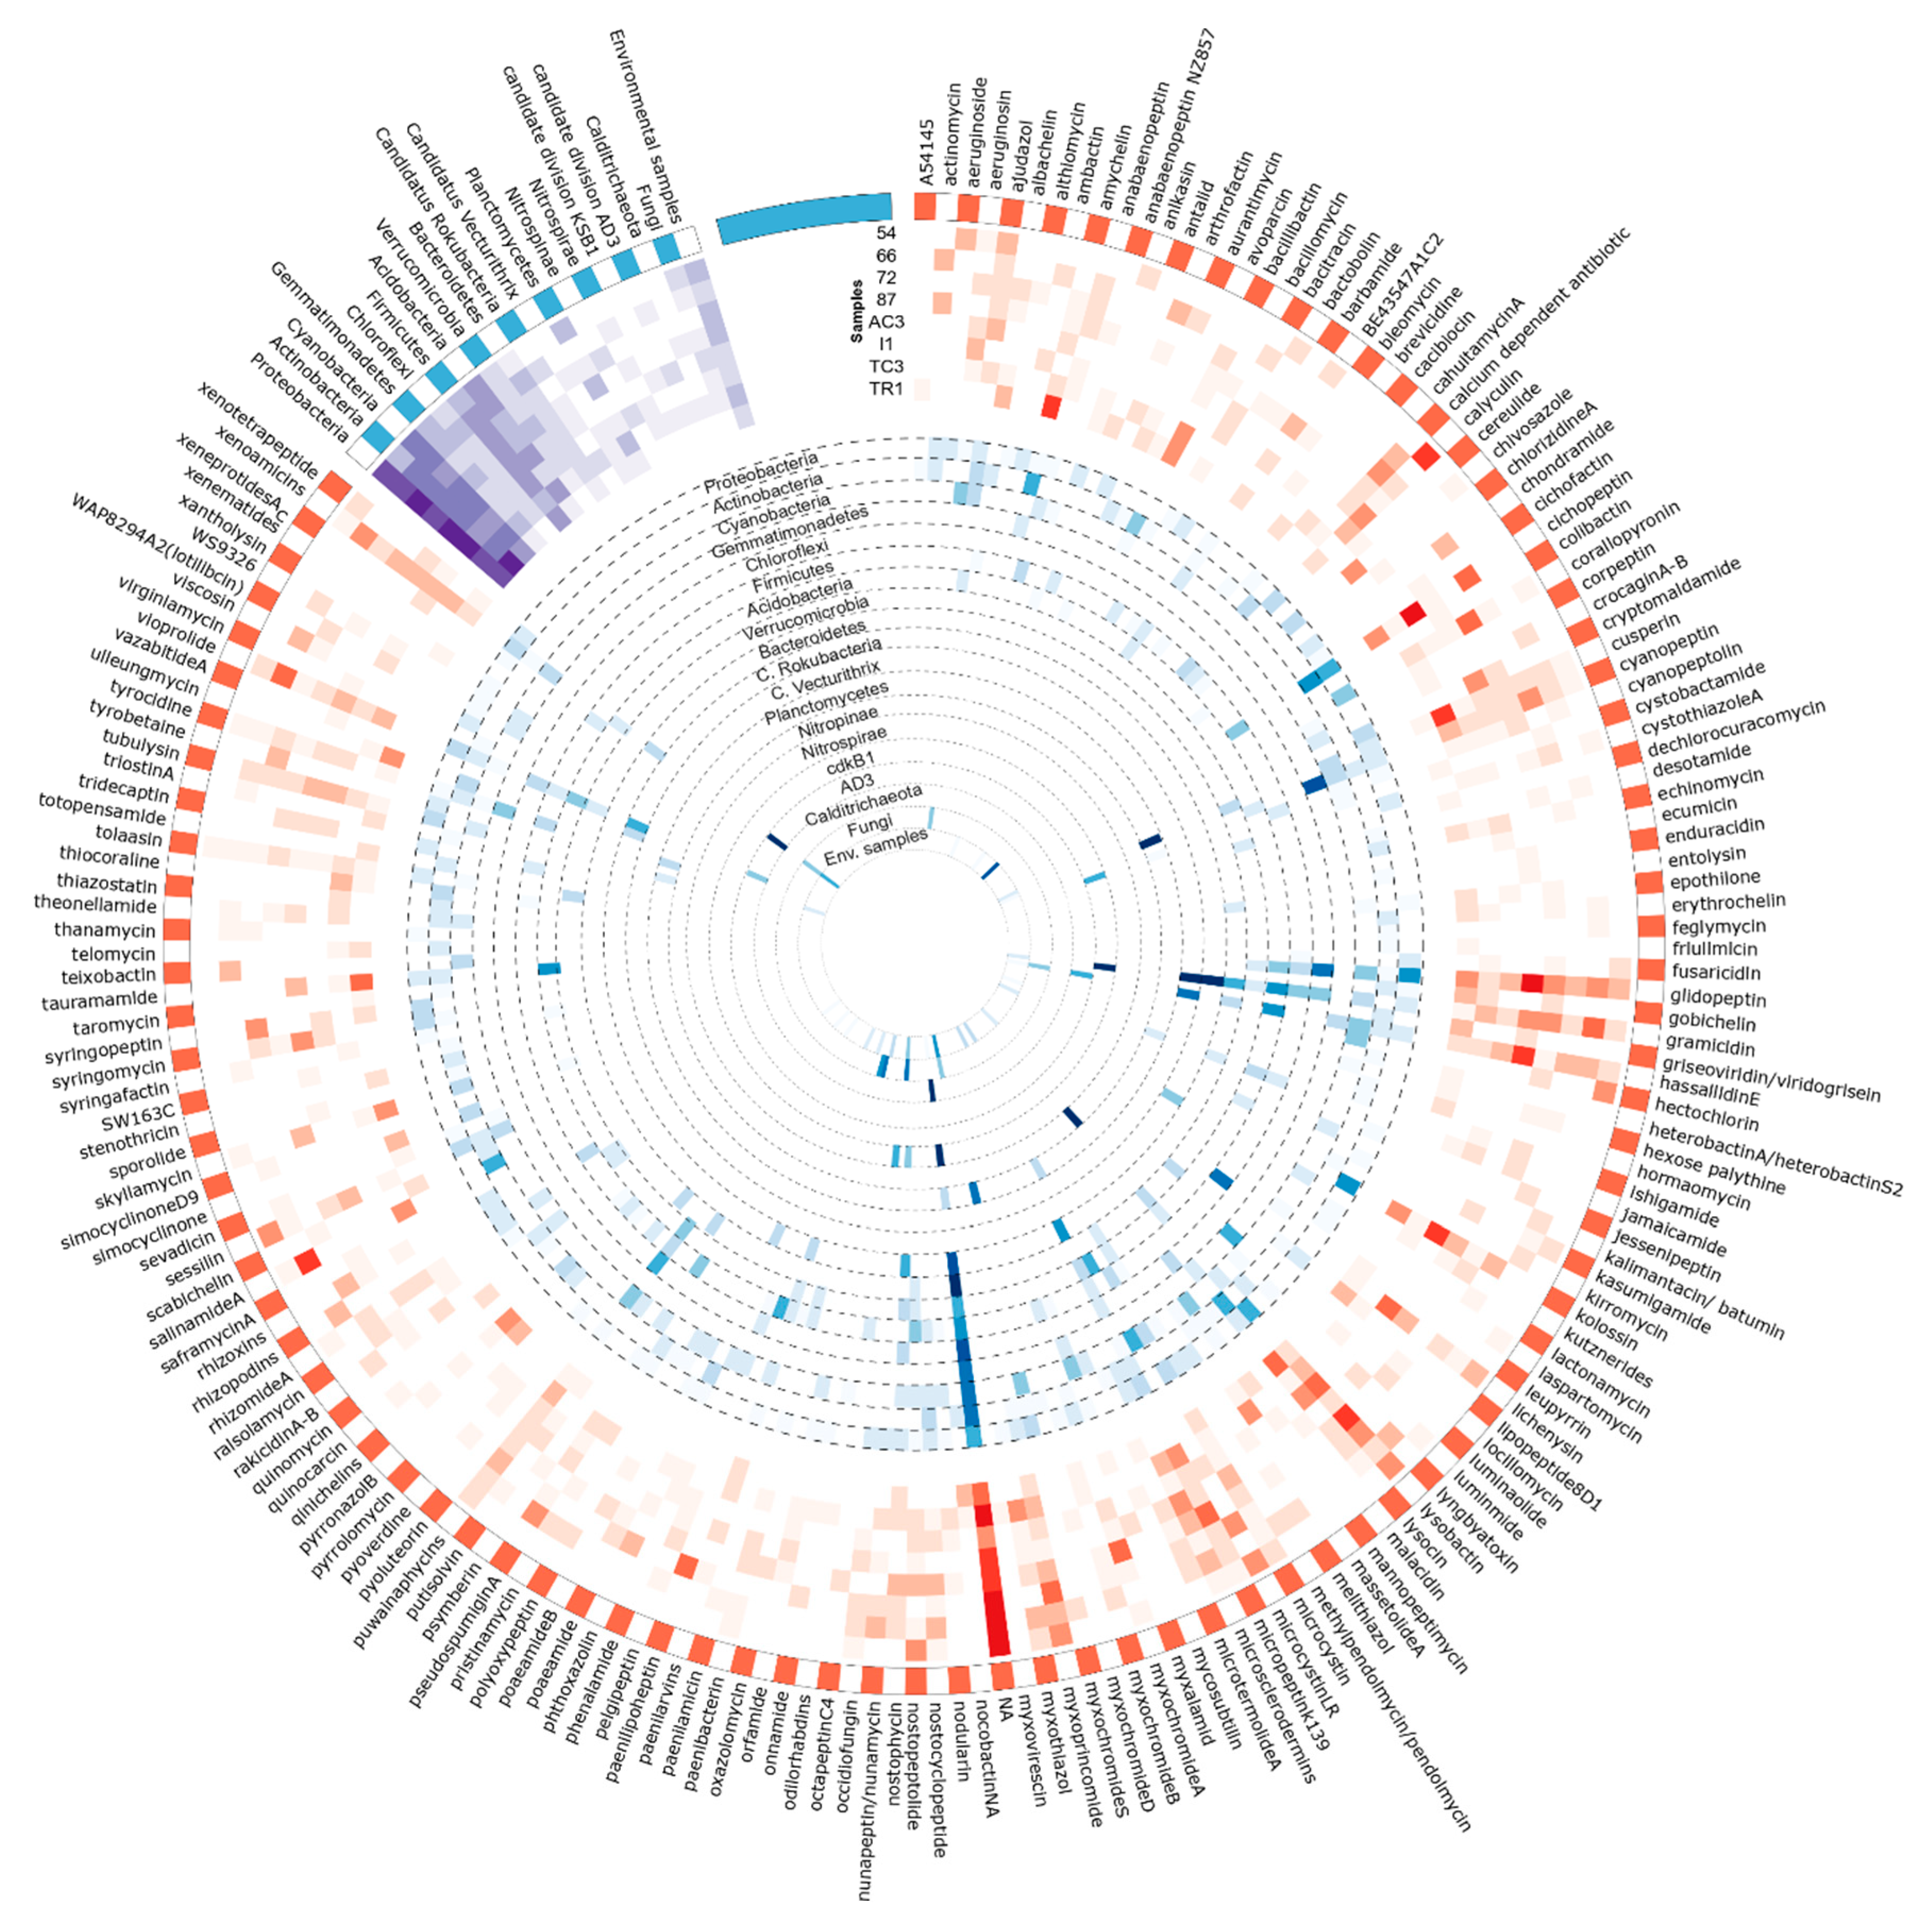
3.3. Metabolites Assignment to KS and AD Domains

One of the ultimate goals of geographically mapping NP biosynthesis genes is to guide the isolation of bioactive compounds [69]. The identification of promising sampling sites, rich in biosynthetic genes encoding for pharmacologically relevant metabolites will ultimately aid the discovery of novel NPs. In this study, 210 and 182 different BGCs from the MiBIG database were assigned to KS and AD domain OTUs, respectively. Sequences that matched with low confidence (e-value above 10−20) were not assigned. The percentage of such unassigned OTUs corresponded to 11% and 20% of OTUs from KS and AD domains, respectively. Still, even for the assigned KS and AD domains, this classification is intended only to provide a tentative subclass of PKs or NRPs or likely substructure that might be associated with a particular domain, rather than proof of the presence of a particular compound in the studied sample.
When comparing both genes, it is clear that for the AD domain, a larger percentage of the OTUs were not assigned, particularly for samples 54 and TC3 (Figure 7). Recently, Borsetto and co-workers [13] have also identified a large proportion of Antarctic AD and KS OTUs not strongly matching to any known sequences in the MiBiG database, which is indicative of extensive novel chemistry being encoded in Antarctica soil microbiota. Interestingly, in Maxwell Bay samples, the percentage of unassigned sequences is higher for AD than the KS domain, while the opposite was observed by Borsetto [13], with a higher percentage of unassigned KS. This can be explained due to the different pair of primers used. While Borsetto and co-workers [13] used primers designed to target rare and divergent PKS and NRPS genes, in this study we used primers that were originally designed to amplify these domains from Actinobacteria [4,5].

3.3.1. Metabolite/BGCs Tentatively Assigned to KS Domains

Among the metabolite/BGC matches of KS domain OTU sequences against the MiBIG database, the cytotoxic agents, BE-43547 A1-C2 [70] and rakidicins [71], which share a similar structure, were the two most abundant across all samples (Table 2 and Figure 8. Cyanobacterial BGCs encoding jamaicamide [72] and hapalosin [73] and the myxobacterial antimicrobial ajudazol [74] were also matched frequently. Each of these highly abundant matches seem to be associated to OTUs obtained from a specific bacterial phylum (Figure 8). Less abundant BGCs, such as those coding for the abyssomicins [75] and barbamide [76] seem to be matching OTUs distributed by a smaller number of samples, or to be sample-specific (Figure 8).
OTUs assigned to BGCs/metabolites with over 80% of identity were assessed in more detail, since they might indicate the presence of structural variants of such compounds.
Eighty-five different KS OTUs were assigned with over 80% of identity (Table S11 and Figure S4) to MiBIG metabolites. These are biosynthesized by four bacterial phyla (Actinobacteria, Cyanobacteria, Firmicutes, and Proteobacteria) and by the Ascomycota (Fungi) phylum (curiously, as mentioned above, fungi-associated KS domain OTUs were not found in BLAST searches). Over 40% of the matches belong to metabolites that have been isolated from Streptomyces species, also likely reflecting the fact that this hyper-prolific genus is strongly represented in the MiBiG database. The OTU assigned with the highest identity (90%) corresponded to spinosad, a non-antibiotic macrocyclic lactone with insecticide activity, isolated from a rare actinobacterial genus, Saccharopolyspora [77]. The second highest identity match corresponded to the fluvirucins, antifungal and antiviral molecules isolated from the actinobacterial genus Actinomadura [78].
Several other OTU sequences matched with over 85% identity to metabolites produced by Streptomyces, such as the recently discovered antibiotics niphimycins C–E [79] and the polyether ionophore antibiotic lasalocid [80], as well as the antifungal compound ibomycin [81].

3.3.2. Assigned BGC/Metabolites to AD Domain

For the retrieved AD domain OTUs, the distribution of MiBIG-matched BGC/metabolites seems to be sample-specific as observed for amychelin and salinamide A (Figure 9) in sample TR1 and TC3, respectively. However, a few metabolites seem to be associated with all samples in high abundance (Table 3). This is the case of the three most abundant metabolites tentatively assigned to AD domains from our dataset (Table 3)—the phytotoxic cichopeptin [82], the lipopeptide glidopeptin [83], and the antibiotic lysobactin [84].
Nineteen different OTUs were assigned with over 80% of identity to the MiBIG database (Table S12 and Figure S5), corresponding to 13 different BGC/metabolites distributed by three bacterial phyla (Actinobacteria, Cyanobacteria, and Proteobacteria). The top match, with 96% identity to the BGC associated with the production of aurantimycin, was found in sample 66. Aurantimicyns, which are Gram-positive specific antibiotics but are also cytotoxic, were initially isolated from Streptomyces aurantiacus IMET 4391 [85]. The second and third hits were both associated to the BGC involved in the production of erythrochelin, a non-ribossomally assembled siderophore isolated from the actinobacterium, Saccharopolyspora erythraea [86]. Additional matches included pyoverdine [87], also a siderophore and viscosin, a biosurfactant [88] and antibiotic [89] NRP, which were both isolated from Pseudomonas strains.
Several OTU sequences matched BGCs/compounds produced by Cyanobacteria (Figure 9), including cyanopeptolins [90], puwainaphycins [91], nostopeptolides, and nostocyclopeptides [92]. Glidopeptin, matching with 80% of identity to highly abundant OTUs, was recently isolated and described to be encoded by a cryptic BGC from a Burkholderiales species [83].

4. Conclusions

Our study highlights the extensive unexplored chemical diversity at Maxwell Bay, Antarctica. We identified PKS and NRPS OTUs closely related to metabolites that have only very recently been described, are biosynthesized by cryptic genes or by uncultured and candidate phyla. Furthermore, a considerable fraction of the studied domains—most prominently AD domains—show very low identity to sequences within characterized BGCs. Hence, samples from this location show promise for the discovery of new natural products. In addition, despite being geographically very close to each other, the soil samples included in this study seem to contain a very distinct genetic repertoire, an observation that is relevant for planning bioprospection sampling campaigns. Despite the limited number of samples, collected in a short time period and in a limited geographic area, the approach used in this study has proved to be useful to detect both genes closely related to known biosynthetic compounds as well as those potentially linked to novel chemical diversity. A considerable proportion of matches to biosynthetic genes comes from rare and/or genera only recently described and that are usually recalcitrant to laboratory cultivation. Thus, new approaches to microbial cultivation [93] together with metagenomic strategies involving capture/heterologous expression of cryptic BGCs [94] will be useful to recover this hidden chemistry.

Supplementary Materials

Supplementary materials can be found at https://www.mdpi.com/2076-2607/8/2/279/s1.

Author Contributions

A.R., C.M., and P.N.L. designed and conceived the research study and experiments. A.R. and J.P.S. developed the experimental work. A.R., A.G.G.S., and F.P. analyzed the data. A.R. wrote the main manuscript text with support of C.M. and P.N.L., J.C. coordinated the Antarctica sampling campaign. All authors improved, reviewed, and approved the final manuscript. All authors have read and agreed to the published version of the manuscript.

Funding

Fundação para a Ciência e a Tecnologia (FCT) funded this study through the grant PTDC/CTA-AMB/30997/2017 to CM, the IF research contract IF/01358/2014 to PNL, a PhD scholarship to AR (SFRH/BD/140567/2018) and within the scope of UIDB/04423/2020 and UIDP/04423/2020. The authors acknowledge the Portuguese Polar Program (PROPOLAR) and the Chilean Antarctic Institute (INACH) for providing logistics and traveling financial support during CONTANTARC-3 campaign in Maxwell Bay/King George Island.

Conflicts of Interest

The authors declare no conflict of interest. The funders had no role in the design of the study; in the collection, analyses, or interpretation of data; in the writing of the manuscript, or in the decision to publish the results.

References

  1. Cragg, G.M.; Newman, D.J. Natural Products: a continuing source of novel drug leads. Biochim. Biophys. Acta 2013, 1830, 3670–3695. [Google Scholar] [CrossRef] [PubMed] [Green Version]
  2. Cimermancic, P.; Medema, M.H.; Claesen, J.; Kurita, K.; Wieland, B.; Laura, C.; Mavrommatis, K.; Pati, A.; Godfrey, P.A.; Koehrsen, M.; et al. Insights into secondary metabolism from a global analysis of prokaryotic biosynthetic gene clusters Peter. Cell 2014, 158, 412–421. [Google Scholar] [CrossRef] [PubMed] [Green Version]
  3. Wang, H.; Sivonen, K.; Fewer, D.P. Genomic insights into the distribution, genetic diversity and evolution of polyketide synthases and nonribosomal peptide synthetases. Curr. Opin. Genet. Dev. 2015, 35, 79–85. [Google Scholar] [CrossRef] [PubMed]
  4. Ayuso-Sacido, A.; Genilloud, O. New PCR primers for the screening of NRPS and PKS-I systems in actinomycetes: Detection and distribution of these biosynthetic gene sequences in major taxonomic groups. Microb. Ecol. 2005, 49, 10–24. [Google Scholar] [CrossRef]
  5. Schirmer, A.; Gadkari, R.; Reeves, C.D.; Ibrahim, F.; Delong, E.F.; Richard, C.; Hutchinson, C.R. Metagenomic Analysis Reveals Diverse Polyketide Synthase Gene Clusters in Microorganisms Associated with the Marine Sponge Discodermia dissoluta. Appl. Environ. Microbiol. 2005, 71, 4840–4849. [Google Scholar] [CrossRef] [Green Version]
  6. Owen, J.G.; Charlop-Powers, Z.; Smith, A.G.; Ternei, M.A.; Calle, P.Y.; Reddy, B.V.B.; Montiel, D.; Brady, S.F. Multiplexed metagenome mining using short DNA sequence tags facilitates targeted discovery of epoxyketone proteasome inhibitors. Proc. Natl. Acad. Sci. USA 2015, 112, 4221–4226. [Google Scholar] [CrossRef] [Green Version]
  7. Charlop-Powers, Z.; Owen, J.G.; Reddy, B.V.B.; Ternei, M.A.; Guimarães, D.O.; de Frias, U.A.; Pupo, M.T.; Seepe, P.; Feng, Z.; Brady, S.F. Global biogeographic sampling of bacterial secondary metabolism. Elife 2015, 4, 1–10. [Google Scholar] [CrossRef]
  8. Reddy, B.V.B.; Kallifidas, D.; Kim, J.H.; Charlop-Powers, Z.; Feng, Z.; Brady, S.F. Natural product biosynthetic gene diversity in geographically distinct soil microbiomes. Appl. Environ. Microbiol. 2012, 78, 3744–3752. [Google Scholar] [CrossRef] [Green Version]
  9. Lemetre, C.; Maniko, J.; Charlop-Powers, Z.; Sparrow, B.; Lowe, A.J.; Brady, S.F. Bacterial natural product biosynthetic domain composition in soil correlates with changes in latitude on a continent-wide scale. Proc. Natl. Acad. Sci. USA 2017, 201710262. [Google Scholar] [CrossRef] [Green Version]
  10. Tian, Y.; Li, Y.L.; Zhao, F.C. Secondary metabolites from polar organisms. Mar. Drugs 2017, 15, 28. [Google Scholar] [CrossRef] [Green Version]
  11. Wilson, Z.E.; Brimble, M. a Molecules derived from the extremes of life. Nat. Prod. Rep. 2009, 26, 44–71. [Google Scholar] [CrossRef] [PubMed]
  12. Benaud, N.; Zhang, E.; van Dorst, J.; Brown, M.V.; Kalaitzis, J.A.; Neilan, B.A.; Ferrari, B.C. Harnessing Long-Read Amplicon Sequencing to Uncover NRPS and Type I PKS Gene Sequence Diversity in Polar Desert Soils. FEMS Microbiol. Ecol. 2019. [Google Scholar] [CrossRef] [PubMed]
  13. Borsetto, C.; Amos, G.C.A.; Da Rocha, U.N.; Mitchell, A.L.; Finn, R.D.; Laidi, R.F.; Vallin, C.; Pearce, D.A.; Newsham, K.K.; Wellington, E.M.H. Microbial community drivers of PK / NRP gene diversity in selected global soils. Microbiome 2019, 7, 1–11. [Google Scholar] [CrossRef] [PubMed] [Green Version]
  14. Lambrechts, S.; Willems, A.; Tahon, G. Uncovering the Uncultivated Majority in Antarctic Soils: Toward a Synergistic Approach. Front. Microbiol. 2019, 10, 1–19. [Google Scholar] [CrossRef] [PubMed]
  15. Lloyd, K.G.; Steen, A.D.; Ladau, J.; Yin, J.; Crosby, L. Phylogenetically Novel Uncultured Microbial Cells Dominate Earth Microbiomes. mSystems 2018, 3, 1–12. [Google Scholar] [CrossRef] [PubMed] [Green Version]
  16. Pulschen, A.A.; Bendia, A.G.; Fricker, A.D.; Pellizari, V.H.; Galante, D.; Rodrigues, F. Isolation of uncultured bacteria from antarctica using long incubation periods and low nutritional media. Front. Microbiol. 2017, 8, 1–12. [Google Scholar] [CrossRef] [PubMed]
  17. Pudasaini, S.; Wilson, J.; Ji, M.; van Dorst, J.; Snape, I.; Palmer, A.S.; Burns, B.P.; Ferrari, B.C. Microbial diversity of browning Peninsula, Eastern Antarctica revealed using molecular and cultivation methods. Front. Microbiol. 2017, 8. [Google Scholar] [CrossRef] [Green Version]
  18. Michaud, A.B.; Šabacká, M.; Priscu, J.C. Cyanobacterial diversity across landscape units in a polar desert: Taylor Valley, Antarctica. FEMS Microbiol. Ecol. 2012, 82, 268–278. [Google Scholar] [CrossRef]
  19. Pushkareva, E.; Pessi, I.S.; Wilmotte, A.; Namsaraev, Z.; Elster, J.; Mano, M.-J. Cyanobacteria inhabiting biological soil crusts of a polar desert: Sør Rondane Mountains, Antarctica. Syst. Appl. Microbiol. 2018, 41, 363–373. [Google Scholar] [CrossRef]
  20. Zhang, Y.; Lu, L.; Chang, X.; Jiang, F.; Gao, X.; Yao, Y.; Li, C.; Cao, S.; Zhou, Q.; Peng, F. Small-Scale Soil Microbial Community Heterogeneity Linked to Landform Historical Events on King George Island, Maritime Antarctica. Front. Microbiol. 2018, 9, 1–15. [Google Scholar] [CrossRef] [Green Version]
  21. Amaro, E.; Padeiro, A.; Mão de Ferro, A.; Mota, A.M.; Leppe, M.; Verkulich, S.; Hughes, K.A.; Peter, H.U.; Canário, J. Assessing trace element contamination in Fildes Peninsula (King George Island) and Ardley Island, Antarctic. Mar. Pollut. Bull. 2015, 97, 523–527. [Google Scholar] [CrossRef] [PubMed]
  22. Wang, N.F.; Zhang, T.; Zhang, F.; Wang, E.T.; He, J.F.; Ding, H.; Zhang, B.T.; Liu, J.; Ran, X.B.; Zang, J.Y. Diversity and structure of soil bacterial communities in the Fildes Region (maritime Antarctica) as revealed by 454 pyrosequencing. Front. Microbiol. 2015, 6, 1–11. [Google Scholar] [CrossRef] [PubMed] [Green Version]
  23. González-Rocha, G.; Muñoz-Cartes, G.; Canales-Aguirre, C.B.; Lima, C.A.; Domínguez-Yévenes, M.; Bello-Toledo, H.; Hernández, C.E. Diversity structure of culturable bacteria isolated from the Fildes Peninsula (King George Island, Antarctica): A phylogenetic analysis perspective. PLoS ONE 2017, 12, e0179390. [Google Scholar] [CrossRef] [PubMed] [Green Version]
  24. Padeiro, A.; Amaro, E.; Dos Santos, M.M.C.; Araújo, M.F.; Gomes, S.S.; Leppe, M.; Verkulich, S.; Hughes, K.A.; Peter, H.U.; Canário, J. Trace element contamination and availability in the Fildes Peninsula, King George Island, Antarctica. Environ. Sci. Process. Impacts 2016, 18, 648–657. [Google Scholar] [CrossRef]
  25. Magalhäes, C.M.; Wiebe, W.J.; Joye, S.B.; Bordalo, A.A. Inorganic nitrogen dynamics in intertidal rocky biofilms and sediments of the Douro River estuary (Portugal). Estuaries 2005, 28, 592–607. [Google Scholar] [CrossRef]
  26. R Core Team R: A Language and Environment for Statistical Computing 2019. Available online: https://www.R-project.org/ (accessed on 18 February 2020).
  27. Wickham, H. ggplot2—Elegant Graphics for Data Analysis; Springer: New York, NY, USA, 2009; ISBN 9780387981406. Available online: https://www.biblio.com/9780387981406 (accessed on 18 February 2020).
  28. Pebesma, E. Simple features for R: Standardized support for spatial vector data. R J. 2018, 10, 439–446. [Google Scholar] [CrossRef] [Green Version]
  29. Dunnington, D. ggspatial: Spatial Data Framework for ggplot2 2018. Available online: https://CRAN.R-project.org/package=ggspatial (accessed on 18 February 2020).
  30. South, A. rnaturalearth: World Map Data from Natural Earth 2017. Available online: https://cran.r-project.org/web/packages/rnaturalearth/index.html (accessed on 18 February 2020).
  31. Fierer, N.; Leff, J.W.; Adams, B.J.; Nielsen, U.N.; Bates, S.T.; Lauber, C.L.; Owens, S.; Gilbert, J.A.; Wall, D.H.; Caporaso, J.G. Cross-biome metagenomic analyses of soil microbial communities and their functional attributes. Proc. Natl. Acad. Sci. USA 2012, 109, 21390–21395. [Google Scholar] [CrossRef] [Green Version]
  32. Parada, A.E.; Needham, D.M.; Fuhrman, J.A. Every base matters: Assessing small subunit rRNA primers for marine microbiomes with mock communities, time series and global field samples. Environ. Microbiol. 2016, 18, 1403–1414. [Google Scholar] [CrossRef]
  33. Sousa, A.G.G.; Tomasino, M.P.; Duarte, P.; Fernández-Méndez, M.; Assmy, P.; Ribeiro, H.; Surkont, J.; Leite, R.B.; Pereira-Leal, J.B.; Torgo, L.; et al. Diversity and Composition of Pelagic Prokaryotic and Protist Communities in a Thin Arctic Sea-Ice Regime. Microb. Ecol. 2019, 78, 388–408. [Google Scholar] [CrossRef]
  34. Charlop-Powers, Z.; Pregitzer, C.C.; Lemetre, C.; Ternei, M.A.; Maniko, J.; Hover, B.M.; Calle, P.Y.; McGuire, K.L.; Garbarino, J.; Forgione, H.M.; et al. Urban park soil microbiomes are a rich reservoir of natural product biosynthetic diversity. Proc. Natl. Acad. Sci. USA 2016, 113, 14811–14816. [Google Scholar] [CrossRef] [Green Version]
  35. Callahan, B.J.; McMurdie, P.J.; Rosen, M.J.; Han, A.W.; Johnson, A.J.A.; Holmes, S.P. DADA2: High-resolution sample inference from Illumina amplicon data. Nat. Methods 2016, 13, 581–583. [Google Scholar] [CrossRef] [PubMed] [Green Version]
  36. Wang, Q.; Garrity, G.M.; Tiedje, J.M.; Cole, J.R.; Al, W.E.T. Naıve Bayesian Classifier for Rapid Assignment of rRNA Sequences into the New Bacterial Taxonomy. Appl. Environ. Microbiol. 2007, 73, 5261–5267. [Google Scholar] [CrossRef] [PubMed] [Green Version]
  37. McMurdie, P.J.; Holmes, S. phyloseq: An R Package for Reproducible Interactive Analysis and Graphics of Microbiome Census Data. PLoS ONE 2013, 8. [Google Scholar] [CrossRef] [PubMed] [Green Version]
  38. Edgar, R.C. Search and clustering orders of magnitude faster than BLAST. Bioinformatics 2010, 26, 2460–2461. [Google Scholar] [CrossRef] [Green Version]
  39. Rognes, T.; Flouri, T.; Nichols, B.; Quince, C.; Mahé, F. VSEARCH: a versatile open source tool for metagenomics. PeerJ 2016, 4, e2584. [Google Scholar] [CrossRef]
  40. Oksanen, A.J.; Blanchet, F.G.; Kindt, R.; Legendre, P.; Minchin, P.R.; Hara, R.B.O.; Simpson, G.L.; Solymos, P.; Stevens, M.H.H.; Wagner, H. Package ‘ vegan’. 2015. Available online: https://cran.r-project.org/web/packages/vegan/index.html (accessed on 18 February 2020).
  41. Camacho, C.; Coulouris, G.; Avagyan, V.; Ma, N.; Papadopoulos, J.; Bealer, K.; Madden, T.L. BLAST+: Architecture and applications. BMC Bioinform. 2009, 10, 1–9. [Google Scholar] [CrossRef] [Green Version]
  42. Kumar, S.; Stecher, G.; Li, M.; Knyaz, C.; Tamura, K. MEGA X: Molecular evolutionary genetics analysis across computing platforms. Mol. Biol. Evol. 2018, 35, 1547–1549. [Google Scholar] [CrossRef]
  43. Letunic, I.; Bork, P. Interactive Tree Of Life (iTOL) v4: recent updates and new developments. Nucleic Acids Res. 2019, 47, W256–W259. [Google Scholar] [CrossRef] [Green Version]
  44. Medema, M.H.; Kottmann, R.; Yilmaz, P.; Cummings, M.; Biggins, J.B.; Blin, K.; De Bruijn, I.; Chooi, Y.H.; Claesen, J.; Coates, R.C.; et al. Minimum Information about a Biosynthetic Gene cluster. Nat. Chem. Biol. 2015, 11, 625–631. [Google Scholar] [CrossRef]
  45. Krzywinski, M.; Schein, J.; Birol, I.; Connors, J.; Gascoyne, R.; Horsman, D.; Jones, S.J.; Marra, M.A. Circos: An information aesthetic for comparative genomics. Genome Res. 2009, 19, 1639–1645. [Google Scholar] [CrossRef] [Green Version]
  46. Wang, H.; Fewer, D.P.; Holm, L.; Rouhiainen, L.; Sivonen, K. Atlas of nonribosomal peptide and polyketide biosynthetic pathways reveals common occurrence of nonmodular enzymes. Proc. Natl. Acad. Sci. USA 2014, 111, 9259–9264. [Google Scholar] [CrossRef] [PubMed] [Green Version]
  47. Rego, A.; Raio, F.; Martins, T.P.; Ribeiro, H.; Sousa, A.G.G.; Séneca, J.; Baptista, M.S.; Lee, C.K.; Cary, S.C.; Ramos, V.; et al. Actinobacteria and Cyanobacteria Diversity in Terrestrial Antarctic Microenvironments Evaluated by Culture-Dependent and Independent Methods. Front. Microbiol. 2019, 10. [Google Scholar] [CrossRef] [PubMed]
  48. Charlop-Powers, Z.; Owen, J.G.; Reddy, B.V.B.; Ternei, M.A.; Brady, S.F. Chemical-biogeographic survey of secondary metabolism in soil. Proc. Natl. Acad. Sci. USA 2014, 111, 3757–3762. [Google Scholar] [CrossRef] [PubMed] [Green Version]
  49. Jenke-Kodama, H.; Dittmann, E. Evolution of metabolic diversity: Insights from microbial polyketide synthases. Phytochemistry 2009, 70, 1858–1866. [Google Scholar] [CrossRef] [PubMed]
  50. Ziemert, N.; Podell, S.; Penn, K.; Badger, J.H.; Allen, E.; Jensen, P.R. The natural product domain seeker NaPDoS: A phylogeny based bioinformatic tool to classify secondary metabolite gene diversity. PLoS ONE 2012, 7, 1–9. [Google Scholar] [CrossRef] [Green Version]
  51. Ridley, C.P.; Lee, H.Y.; Khosla, C. Evolution of polyketide synthases in bacteria. Proc. Natl. Acad. Sci. USA 2008, 105, 4595–4600. [Google Scholar] [CrossRef] [Green Version]
  52. Crits-Christoph, A.; Diamond, S.; Butterfield, C.N.; Thomas, B.C.; Banfield, J.F. Novel soil bacteria possess diverse genes for secondary metabolite biosynthesis. Nature 2018, 558, 440–444. [Google Scholar] [CrossRef]
  53. Demay, J.; Bernard, C.; Reinhardt, A.; Marie, B. Natural products from cyanobacteria: Focus on beneficial activities. Mar. Drugs 2019, 17, 320. [Google Scholar] [CrossRef] [Green Version]
  54. Taton, A.; Grubisic, S.; Ertz, D.; Hodgson, D.A.; Piccardi, R.; Biondi, N.; Tredici, M.R. Polyphasic Study of Antarctic Cyanobacterial Strains. J. Phycol. 2006, 42, 1257–1270. [Google Scholar] [CrossRef]
  55. Subramani, R.; Sipkema, D. Marine rare actinomycetes: A promising source of structurally diverse and unique novel natural products. Mar. Drugs 2019, 17, 249. [Google Scholar] [CrossRef] [Green Version]
  56. Aleti, G.; Sessitsch, A.; Brader, G. Genome mining: Prediction of lipopeptides and polyketides from Bacillus and related Firmicutes. Comput. Struct. Biotechnol. J. 2015, 13, 192–203. [Google Scholar] [CrossRef] [PubMed]
  57. Tahon, G.; Willems, A. Isolation and characterization of aerobic anoxygenic phototrophs from exposed soils from the Sør Rondane Mountains, East Antarctica. Syst. Appl. Microbiol. 2017, 40, 357–369. [Google Scholar] [CrossRef] [PubMed]
  58. Vollmers, J.; Frentrup, M.; Rast, P.; Jogler, C.; Kaster, A.K. Untangling genomes of novel Planctomycetal and Verrucomicrobial species from monterey bay kelp forest metagenomes by refined binning. Front. Microbiol. 2017, 8. [Google Scholar] [CrossRef] [PubMed] [Green Version]
  59. Cuadrat, R.R.C.; Ionescu, D.; Dávila, A.M.R.; Grossart, H.P. Recovering genomics clusters of secondary metabolites from lakes using genome-resolved metagenomics. Front. Microbiol. 2018, 9, 1–13. [Google Scholar] [CrossRef] [Green Version]
  60. Undabarrena, A.; Beltrametti, F.; Claverías, F.P.; González, M.; Moore, E.R.B.; Seeger, M.; Cámara, B. Exploring the diversity and antimicrobial potential of marine actinobacteria from the comau fjord in Northern Patagonia, Chile. Front. Microbiol. 2016, 7, 1–16. [Google Scholar] [CrossRef]
  61. Graça, A.P.; Calisto, R.; Lage, O.M. Planctomycetes as Novel Source of Bioactive Molecules. Front. Microbiol. 2016, 7, 1241. [Google Scholar] [CrossRef]
  62. Sayari, M.; van der Nest, M.A.; Steenkamp, E.T.; Soal, N.C.; Wilken, P.M.; Wingfield, B.D. Distribution and Evolution of Nonribosomal Peptide Synthetase Gene Clusters in the Ceratocystidaceae. Genes (Basel) 2019, 10, 328. [Google Scholar] [CrossRef] [Green Version]
  63. Clardy, J.; Fischbach, M.A.; Walsh, C.T. New antibiotics from bacterial natural products. Nat. Biotechnol. 2006, 24, 1541–1550. [Google Scholar] [CrossRef]
  64. Kim, D.; Lee, E.J.; Lee, J.; Leutou, A.S.; Shin, Y.H.; Choi, B.; Hwang, J.S.; Hahn, D.; Choi, H.; Chin, J.; et al. Antartin, a cytotoxic zizaane-type Sesquiterpenoid from a Streptomyces sp. Isolated from an antarctic marine sediment. Mar. Drugs 2018, 16, 130. [Google Scholar] [CrossRef] [Green Version]
  65. Bringmann, G.; Lang, G.; Maksimenka, K.; Hamm, A.; Gulder, T.A.M.; Dieter, A.; Bull, A.T.; Stach, J.E.M.; Kocher, N.; Müller, W.E.G.; et al. Gephyromycin, the first bridged angucyclinone, from Streptomyces griseus strain NTK 14. Phytochemistry 2005, 66, 1366–1373. [Google Scholar] [CrossRef]
  66. Bruntner, C.; Binder, T.; Pathom-aree, W.; Goodfellow, M.; Bull, A.T.; Potterat, O.; Puder, C.; Hörer, S.; Schmid, A.; Bolek, W.; et al. Frigocyclinone, a novel angucyclinone antibiotic produced by a Streptomyces griseus strain from Antarctica. J. Antibiot. (Tokyo) 2005, 58, 346–349. [Google Scholar] [CrossRef] [PubMed] [Green Version]
  67. Dhakal, D.; Rayamajhi, V.; Mishra, R.; Sohng, J.K. Bioactive molecules from Nocardia: diversity, bioactivities and biosynthesis. J. Ind. Microbiol. Biotechnol. 2019, 46, 385–407. [Google Scholar] [CrossRef] [PubMed]
  68. Babalola, O.O.; Kirby, B.M.; Le Roes-Hill, M.; Cook, A.E.; Cary, S.C.; Burton, S.G.; Cowan, D.A. Phylogenetic analysis of actinobacterial populations associated with Antarctic Dry Valley mineral soils. Environ. Microbiol. 2009, 11, 566–576. [Google Scholar] [CrossRef] [PubMed]
  69. Charlop-Powers, Z.; Milshteyn, A.; Brady, S.F. Metagomic small molecule discovery methods. Curr. Opin. Microbiol. 2014, 19, 70–75. [Google Scholar] [CrossRef] [Green Version]
  70. Villadsen, N.L.; Jacobsen, K.M.; Keiding, U.B.; Weibel, E.T.; Christiansen, B.; Vosegaard, T.; Bjerring, M.; Jensen, F.; Johannsen, M.; Tørring, T.; et al. Synthesis of ent-BE-43547A 1 reveals a potent hypoxia-selective anticancer agent and uncovers the biosynthetic origin of the APD-CLD natural products. Nat. Chem. 2017, 9, 264–272. [Google Scholar] [CrossRef] [Green Version]
  71. McBrien, K.D.; Berry, R.L.; Lowe, S.E.; Neddermann, K.M.; Bursuker, I.; Steven, S.H.; Klohr, S.E.; Leet, J.E. Rakicidins, New Cytotoxic Lipopeptides from Micromonospora sp. Fermentation, Isolation and Characterization. J. Antibiot. (Tokyo) 1995, 48, 1446–1452. [Google Scholar] [CrossRef] [Green Version]
  72. Edwards, D.J.; Marquez, B.L.; Nogle, L.M.; McPhail, K.; Goeger, D.E.; Robberts, M.A.; Gerwick, W.H. Structure and Biosynthesis of the Jamaicamides, New Mixed Polyketide-Peptide Neurotoxins from the Marine Cyanobacterium Lyngbya majuscula. Chem. Biol. 2004, 11, 817–833. [Google Scholar] [CrossRef] [Green Version]
  73. Stratmann, K.; Burgoyne, D.L.; Moore, R.E.; Patterson, G.M.L.; Smith, C.D. Hapalosin, a Cyanobacterial Cyclic Depsipeptide with Multidrug-Resistance Reversing Activity. J. Org. Chem. 1994, 59, 7219–7226. [Google Scholar] [CrossRef]
  74. Kunze, B.; Jansen, R.; Hofle, G.; Reichenbach, H. Ajudazols, New Inhibitors Mitochondrial of the from Electron Transport. J. Antibiot. 2004, 57, 151–155. [Google Scholar] [CrossRef] [Green Version]
  75. Gottardi, E.M.; Krawczyk, J.M.; Von Suchodoletz, H.; Schadt, S.; Mühlenweg, A.; Uguru, G.C.; Pelzer, S.; Fiedler, H.P.; Bibb, M.J.; Stach, J.E.M.; et al. Abyssomicin Biosynthesis: Formation of an Unusual Polyketide, Antibiotic-Feeding Studies and Genetic Analysis. ChemBioChem 2011, 12, 1401–1410. [Google Scholar] [CrossRef] [Green Version]
  76. Chang, Z.; Flatt, P.; Gerwick, W.H.; Nguyen, V.A.; Willis, C.L.; Sherman, D.H. The barbamide biosynthetic gene cluster: A novel marine cyanobacterial system of mixed polyketide synthase (PKS)-non-ribosomal peptide synthetase (NRPS) origin involving an unusual trichloroleucyl starter unit. Gene 2002, 296, 235–247. [Google Scholar] [CrossRef]
  77. Kirst, H.A.; Michel, K.H.; Mynderase, J.S.; Chio, E.H.; Yao, R.C.; Nakasukasa, W.M.; Boeck, L.D.; Occlowitz, J.L.; Paschal, J.W.; Deeter, J.B.; et al. Discovery, Isolation, and Structure Elucidation of a Family of Structurally Unique, Fermentation-Derived Tetracyclic Macrolides. In Synthesis and Chemistry of Agrochemicals III; American Chemical Society: Washington, DC, USA, 1992; pp. 214–225. [Google Scholar]
  78. Tomita, K.; Oda, N.; Hoshino, Y.; Ohkusa, N.; Chikazawa, H. Fluvirucins A1, A2, B1, B2, B3, B4 and B5, new antibiotics active against influenza a virus. IV. Taxonomy on the producing organisms. J. Antibiot. (Tokyo) 1991, 44, 940–948. [Google Scholar] [CrossRef] [PubMed] [Green Version]
  79. Hu, Y.; Wang, M.; Wu, C.; Tan, Y.; Li, J.; Hao, X.; Duan, Y.; Guan, Y.; Shang, X.; Wang, Y.; et al. Identification and Proposed Relative and Absolute Configurations of Niphimycins C-E from the Marine-Derived Streptomyces sp. IMB7-145 by Genomic Analysis. J. Nat. Prod. 2018, 81, 178–187. [Google Scholar] [CrossRef]
  80. Berger, J.; Rachlin, A.I.; Scott, W.E.; Sternbach, L.H.; Goldberg, M.W. The Isolation of Three New Crystalline Antibiotics from Streptomyces. J. Am. Chem. Soc. 1951, 73, 5295–5298. [Google Scholar] [CrossRef]
  81. Robbins, N.; Spitzer, M.; Wang, W.; Waglechner, N.; Patel, D.J.; O’Brien, J.S.; Ejim, L.; Ejim, O.; Tyers, M.; Wright, G.D. Discovery of Ibomycin, a Complex Macrolactone that Exerts Antifungal Activity by Impeding Endocytic Trafficking and Membrane Function. Cell Chem. Biol. 2016, 23, 1383–1394. [Google Scholar] [CrossRef] [PubMed] [Green Version]
  82. Huang, C.J.; Pauwelyn, E.; Ongena, M.; Debois, D.; Leclère, V.; Jacques, P.; Bleyaert, P.; Höfte, M. Characterization of cichopeptins, new phytotoxic cyclic lipodepsipeptides produced by Pseudomonas cichorii SF1-54 and their role in bacterial midrib rot disease of lettuce. Mol. Plant-Microbe Interact. 2015, 28, 1009–1022. [Google Scholar] [CrossRef] [Green Version]
  83. Wang, X.; Zhou, H.; Chen, H.; Jing, X.; Zheng, W.; Li, R.; Sun, T.; Liu, J.; Fu, J.; Huo, L.; et al. Discovery of recombinases enables genome mining of cryptic biosynthetic gene clusters in Burkholderiales species. Proc. Natl. Acad. Sci. USA 2018, 115, E4255–E4263. [Google Scholar] [CrossRef] [Green Version]
  84. Kato, A.; Nakaya, S.; Ohashi, Y.; Hirata, H.; Fujii, K.; Harada, K. WAP-8294A2, a novel anti-MRSA antibiotic produced by Lysobacter sp. J. Am. Chem. Soc. 1997, 119, 6680–6681. [Google Scholar] [CrossRef]
  85. Gräfe, U.; Schlegel, R.; Ritzau, M.; Ihn, W.; Dornberger, K.; Stengel, C.; Fleck, W.F.; Gutsche, W.; Härtl, A.; Paulus, E.F. Aurantimycins, new depsipeptide antibiotics from Streptomyces aurantiacus IMET 43917. Production, isolation, structure elucidation, and biological activity. J. Antibiot. 1995, 48, 119–125. [Google Scholar] [CrossRef] [Green Version]
  86. Robbel, L.; Knappe, T.A.; Linne, U.; Xie, X.; Marahiel, M.A. Erythrochelin-a hydroxamate-type siderophore predicted from the genome of Saccharopolyspora erythraea. FEBS J. 2010, 277, 663–676. [Google Scholar] [CrossRef]
  87. Stintzi, A.; Pierre, C.; Hohnadel, D.; Meyer, J.; Dean, C.; Poole, K.; Kourambas, S.; Krishnapillai, V. Novel pyoverdine biosynthesis gene(s) of Pseudomonas aeruginosa PA0. Microbiology 1996, 142, 1181–1190. [Google Scholar] [CrossRef] [PubMed] [Green Version]
  88. Laycock, M.V.; Hildebrand, P.D.; Thibault, P.; Walter, J.A.; Wright, J.L.C. Viscosin, a potent peptidolipid biosurfactant and phytopathogenic mediator produced by a pectolytic strain of Pseudomonas fluorescens. J. Agric. Food Chem. 2005, 39, 483–489. [Google Scholar] [CrossRef]
  89. Groupe, V.; Pugh, L.H.; Weiss, D.; Kochi, M. Observations on Antiviral Activity of Viscosin. Exp. Biol. Med. 1951, 78, 354–358. [Google Scholar] [CrossRef] [PubMed]
  90. Martin, C.; Oberer, L.; Ino, T.; König, W.A.; Busch, M.; Weckesser, J. Cyanopeptolins, new depsipeptides from the cyanobacterium Microcystis sp. PCC 7806. J. Antibiot. (Tokyo) 1993, 46, 1550–1556. [Google Scholar] [CrossRef] [PubMed] [Green Version]
  91. Mareš, J.; Hájek, J.; Urajová, P.; Kopecký, J.; Hrouzek, P. A hybrid non-ribosomal peptide/polyketide synthetase containing fatty-acyl ligase (FAAL) synthesizes the β-amino fatty acid lipopeptides puwainaphycins in the Cyanobacterium Cylindrospermum alatosporum. PLoS ONE 2014, 9, e111904. [Google Scholar] [CrossRef] [Green Version]
  92. Herfindal, L.; Myhren, L.; Kleppe, R.; Krakstad, C.; Selheim, F.; Jokela, J.; Sivonen, K.; Døskeland, S.O. Nostocyclopeptide-M1: A potent, nontoxic inhibitor of the hepatocyte drug transporters OATP1B3 and OATP1B1. Mol. Pharm. 2011, 8, 360–367. [Google Scholar] [CrossRef]
  93. Imai, Y.; Meyer, K.J.; Iinishi, A.; Favre-Godal, Q.; Green, R.; Manuse, S.; Caboni, M.; Mori, M.; Niles, S.; Ghiglieri, M.; et al. A new antibiotic selectively kills Gram-negative pathogens. Nature 2019, 576, 459–464. [Google Scholar] [CrossRef]
  94. Hover, B.M.; Kim, S.H.; Katz, M.; Charlop-Powers, Z.; Owen, J.G.; Ternei, M.A.; Maniko, J.; Estrela, A.B.; Molina, H.; Park, S.; et al. Culture-independent discovery of the malacidins as calcium-dependent antibiotics with activity against multidrug-resistant Gram-positive pathogens. Nat. Microbiol. 2018, 3, 415–422. [Google Scholar] [CrossRef] [Green Version]
Figure 1. Location of sampling points in Maxwell Bay. This map was created using R v. 3.6.1 [26], R packages ggplot2 [27], sf [28], ggspatial [29], and rnaturalearth [30]. The map was edited using Inkscape v. 0.92.
Microorganisms 08 00279 g001
Figure 2. Alpha (A) and beta-diversity (B) metrics for 16S rRNA gene, ketosynthase (KS) and adenylation (AD) domains. Alpha diversity metrics used were number of amplicon sequence variants (ASVs) and operational domain units (OTUs) (grouped at 97% and in a second round at 95%) and Shannon diversity index.
Microorganisms 08 00279 g002
Figure 3. Alpha-diversity (number of OTUs grouped at 97% and in a second round at 95%) of KS and AD domains of Actinobacteria, Cyanobacteria, and Proteobacteria phyla.
Microorganisms 08 00279 g003
Figure 4. Relative abundance of the different phyla as revealed by 16S rRNA gene analysis (A) and the relative taxonomic provenience of KS (B) and AD (C) domains by identifying the best taxonomy match of the OTU biosynthetic domains using the NCBI database.
Microorganisms 08 00279 g004
Figure 5. Maximum likelihood phylogenetic tree of KS domain OTU nucleotide sequences. The evolutionary history was inferred by using the maximum likelihood method based on the Tamura–Nei model and involved 1942 nucleotide sequences. KS classes assigned against NaPDOs database were included (color stripes) using iTOL as well as the relative abundances of the 10 most abundant OTUs by sample (represented in circles).
Microorganisms 08 00279 g005
Figure 6. KS and AD domain taxonomic proveniences from Actinobacteria (A,B), Cyanobacteria (C,D), and Firmicutes bacterial phyla (E,F).
Microorganisms 08 00279 g006
Figure 7. Distribution of assigned versus not-assigned polyketide synthase (PKS) and non-ribosomal peptide synthetase (NRPS) sequences by blast to the MiBiG database.
Microorganisms 08 00279 g007
Figure 8. Circular visualization of the distribution of KS domain OTUs identified against the MiBIG database and its correspondent taxonomical provenience. Figure produced using circos software [45]. Read the figure clockwise, from the outside to the interior. The outside represents the metabolites assigned to the KS domain sequences by using the MiBIG database (orange and white). Heatmaps represent the sum of the metabolites assigned to the KS domain sequences for each sample (in red) and the relative abundance of its correspondent taxonomic provenience for each phylum (in blue). A third heatmap (in purple) represents the total number of metabolites from the KS domain with taxonomic provenience of each phyla per sample.
Microorganisms 08 00279 g008
Figure 9. Circular visualization of the distribution of AD domain OTUs identified against MiBIG database and its correspondent taxonomical provenience. Figure produced using circos software [45]. Read the figure clockwise, from the outside to the interior. The outside represents the metabolites assigned to the KS domain sequences by using the MiBIG database (orange and white). Heatmaps represent the sum of the metabolites assigned to the AD domain sequences for each sample (in red) and the relative abundance of its correspondent taxonomic provenience for each phylum (in blue). A third heatmap (in purple) represents the total number of metabolites from KS domain with taxonomic provenience of each phyla per sample.
Microorganisms 08 00279 g009
Table 1. Mantel correlation between the 16S rRNA gene diversity and the most abundant bacterial phyla 16S diversity with the AD and KS domain diversity.
AD DomainKS Domain
Mantel Statistic rSignificanceMantel Statistic rSignificance
16S rRNA 0.6787 0.002* 0.7535 0.001*
Phylum
Proteobacteria0.66160.007*0.36870.053
Bacteroidetes0.52340.018*0.32850.059
Acidobacteria0.6520.003*0.44830.039*
Actinobacteria0.52970.016*0.55610.014*
Verrucomicrobia0.66820.001*0.58080.004*
Chloroflexi0.61920.010.63780.005*
Gemmatimonadetes0.44630.031*0.36710.054
Planctomycetes0.21580.1210.41160.022*
Cyanobacteria0.21580.1020.12210.23
Statistically significant results were considered for p < 0.05 and are identified by * in the table.
Table 2. Distribution of the five most abundant MiBIG metabolites assigned to the KS domain sequences. The distribution (in relative abundance) of each metabolite by sample as well as the total distribution of the metabolite across all the samples is presented.
Distribution in Each Sample (%)
MiBIG Metabolite/BGC54667287AC3I1TC3TR1Total Distribution (%)
BE-43547 A1-C212.23.69.517.319.022.25.718.713.3
NA5.06.97.510.712.59.611.112.39.8
Rakicidin A/Rakicidin B2.31.94.03.414.116.52.72.56.0
Jamaicamide2.18.60.712.03.31.413.30.85.0
Hapalosin11.40.70.35.18.82.50.611.04.3
Ajudazol10.65.73.53.91.81.12.45.43.7
Table 3. Distribution of the five most abundant MiBIG metabolites assigned to the AD domain sequences. The distribution (in relative abundance) of each metabolite by sample as well as the total distribution of the metabolite across all the samples is presented.
Distribution in Each Sample (%)
MiBIG Metabolite54667287AC3I1TC3TR1Total Distribution (%)
NA40.724.328.917.414.84.333.310.020.5
Cichopeptin0.00.09.10.00.129.80.02.77.5
Glidopeptin2.04.31.43.630.42.30.84.46.0
Lysobactin6.00.35.018.70.710.51.20.25.4
Kolossin0.00.01.50.10.920.60.13.14.9
Calyculin21.70.00.30.04.32.20.00.23.3

