Article

Evaluation of Recommended Water Sample Collection Methods and the Impact of Holding Time on Legionella Recovery and Variability from Healthcare Building Water Systems

1
Special Pathogens Laboratory, Pittsburgh, PA 15219, USA
2
Department of Infection Control, UPMC Mercy Hospital, Pittsburgh, PA 15219, USA
3
Department of Civil and Environmental Engineering, University of Pittsburgh, Pittsburgh, PA 15261, USA
*
Author to whom correspondence should be addressed.
Microorganisms 2020, 8(11), 1770; https://doi.org/10.3390/microorganisms8111770
Submission received: 21 October 2020 / Revised: 7 November 2020 / Accepted: 9 November 2020 / Published: 11 November 2020

Abstract

:
Water safety and management programs (WSMP) utilize field measurements to evaluate control limits and monitor water quality parameters including Legionella presence. This monitoring is important to verify that the plan is being implemented properly. However, once it has been determined when and how to sample for Legionella, it is important to choose appropriate collection and processing methods. We sought to compare processing immediate and flushed samples, filtration of different volumes collected, and sample hold times. Hot water samples were collected immediately and after a 2-min flush. These samples were plated directly and after filtration of either 100 mL, 200 mL, or 1 L. Additionally, unflushed samples were collected and processed immediately and after 1, 24, and 48 h of hold time. We found that flushed samples had significant reductions in Legionella counts compared to immediate samples. Processing 100 mL of that immediate sample both directly and after filter concentration yielded the highest concentration and percent sample positivity, respectively. We also show that there was no difference in culture values from time 0 compared to hold times of 1 h and 24 h. At 48 h, there were slightly fewer Legionella recovered than at time 0. However, Legionella counts were so variable based on sampling location and date that this hold time effect was minimal. The interpretation of Legionella culture results depends on the sample collection and processing methods used, as these can have a huge impact on the success of sampling and the validation of control measures.

1. Introduction

Legionella is an opportunistic waterborne pathogen that thrives in warm water environments and typically infects immunocompromised individuals [1]. Environmental surveillance has been found to be critical for evaluating the risk of healthcare-acquired Legionnaires’ disease. Additionally, routine environmental monitoring can assist in the management of Legionella in building water systems and can help reduce the chance of nosocomial illness [2]. Development of a water management plan based on ASHRAE Standard 188 is currently the industry standard best practice. However, whether conducting regular testing for Legionella spp. as a validation method to ensure the plan is controlling risk is recommended or required depends on the organization and guideline or standard [3,4,5,6,7,8].
In addition to there being organizationally varied requirements for testing, there are also a variety of sample collection volumes, flushing strategies prior to sampling, and sample holding time requirements prior to laboratory processing recommended by different technical guidelines for Legionella recovery (Table 1) [6,9,10,11,12,13]. Additionally, different sample volumes, sampling approaches, and sample holding times have been reported in numerous experimental laboratory studies [14,15,16,17,18]. Once it is determined that testing is going to be performed, there is unfortunately a lack of consensus for sampling and sample handling protocols, which can create confusion and impact the Legionella culture results [9]. Different methods may also answer different questions about the building water system, including what would a person expect to encounter when turning on the faucet or shower for use versus what is the water quality downstream in the cold water distribution system or the hot water recirculating system?
It is important to understand how these variables will affect the downstream Legionella results. Assessing risk is dependent upon reliable and accurate test results whether interpreting concentration (colony forming units (CFU) recovered) or proportion of outlets positive [19]. Therefore, we evaluated the effect of sample volume processed and use of flushing prior to sample collection on the presence of Legionella and the percentage of positive samples based on these standard recommendations. In addition, we evaluated the variability of Legionella concentrations based on sample hold time and sample location over time.

2. Materials and Methods

2.1. Effects of Flushing and Volume Tested on Legionella Recovery

Water was collected from 16 sink faucets weekly for 15 weeks in two buildings. Building A had expected concentrations of Legionella at >50 average colony forming units per milliliter (CFU/mL), while Building B had expected concentrations of <50 CFU/mL. Two samples were taken from each sink once the hot water outlet was opened: a 300 mL sample collected immediately and a 1000 mL sample after a 2-min flush. All collection bottles had sodium thiosulfate tablets present for chlorine neutralization. After collection, samples were immediately transported to the lab in an insulated cooler.
Legionella culture was conducted using a modified ISO method [21] with culture media plates prepared in-house from dehydrated media noted below, and 0.1 mL aliquots of the immediate, unflushed and post-flush samples were directly plated on buffered charcoal yeast extract agar (BCYE) (Remel, Lenexa, KS, USA) and BCYE with dyes, glycine, vancomycin, and polymyxin B (DGVP) [22]. The immediate samples were divided into a 100 mL portion and 200 mL portion that were concentrated by filtration using a 0.2 µm pore sized polycarbonate membrane. The entire liter of the post-flush samples was concentrated using the same protocol. The membranes were transferred to 10 mL tubes of sterile deionized water and vortexed, and 0.1 mL aliquots were plated to BCYE and DGVP. This filter concentrated 1 L sample collected after a 2-min flush, and was considered the ‘’reference method’’ for analytical comparisons. All culture plates were incubated 7 days in a humidified incubator at 36.5 ± 1 °C. During the incubation period, plates were examined two times, initially at 3–4 days and finally at 7 days. Latex agglutination (Oxoid Limited, Basingstoke, UK) and direct fluorescent antibody (DFA) staining were used to identify representative isolates of recovered Legionella.

2.2. Effects of Sample Holding Time on Legionella Recovery

Water was collected from 12 sink faucets in a hospital administrative and outpatient building, twice a week over 6.5 weeks for 13 sampling dates, for a total of 156 samples. The hot water outlets were opened, and 500 mL of the immediate water flow was collected into sterile bottles containing sodium thiosulfate to neutralize any residual chlorine in the water. The samples were cultured using a modified ISO method [21] immediately on site (T0), then again at 1 h (T1), 24 h (T24), and 48 h (T48) from collection for a total of 624 cultures. Water samples were held at room temperature throughout the testing period. On site at T0, 0.1 mL aliquots of each sample were plated onto two selective agar media: DGVP and BCYE with colistin, cephalothin, vancomycin, and cycloheximide (CCVC) (Becton, Dickinson, and Company, Franklin Lakes, NJ, USA). Upon returning to the laboratory, the T0 agar plates were placed into a humidified incubator at 36.5 ± 1 °C. After holding times of 1 h, 24 h, and 48 h (T1, T24, and T48), each water sample was plated directly and after filter concentration (100 mL was concentrated as above) onto BCYE and to DGVP agar plates. If the initial culture plates were overgrown, the filter concentrates were re-plated after pre-treatment with acid (0.2 M KCl, pH 2.2 ± 1). All sets of cultures were incubated for 7 days and examined for Legionella as above.

2.3. Statistical Analyses

2.3.1. Flushing and Volume Analysis

Regression analysis was used to examine the variability in CFU counts as a function of building, sample processing, and water collection method (flushing). Given CFU is a count variable and not normally distributed, generalized linear regression modeling was used to examine the variability in CFU counts. The appropriateness of Linear, Poisson, and Negative Binomial probability density functions were compared using fit statics (e.g., Log Likelihood, Akaike’s Information Criterion, and Bayesian Information Criteria), and the negative binomial models were found to provide the most appropriate fit. Legionella counts were capped at 1000 CFU/mL based on the presence of outliers in the data. Chi-Square Test and Fisher’s Exact test were used to compare the proportion of positive samples by building, processing method, and collection method.

2.3.2. Sample Holding Time and Location Analysis

Regression analysis was used to examine the variability in CFU counts as a function of hold time and sink location. Given CFU is a count variable and not normally distributed, generalized linear regression modeling was used to examine the variability in CFU counts. The appropriateness of Linear, Poisson, and Negative Binomial probability density functions was assessed using fit statics (e.g., Log Likelihood, Akaike’s Information Criterion, and Bayesian Information Criteria), and the negative binomial models were found to provide the most appropriate fit.

3. Results

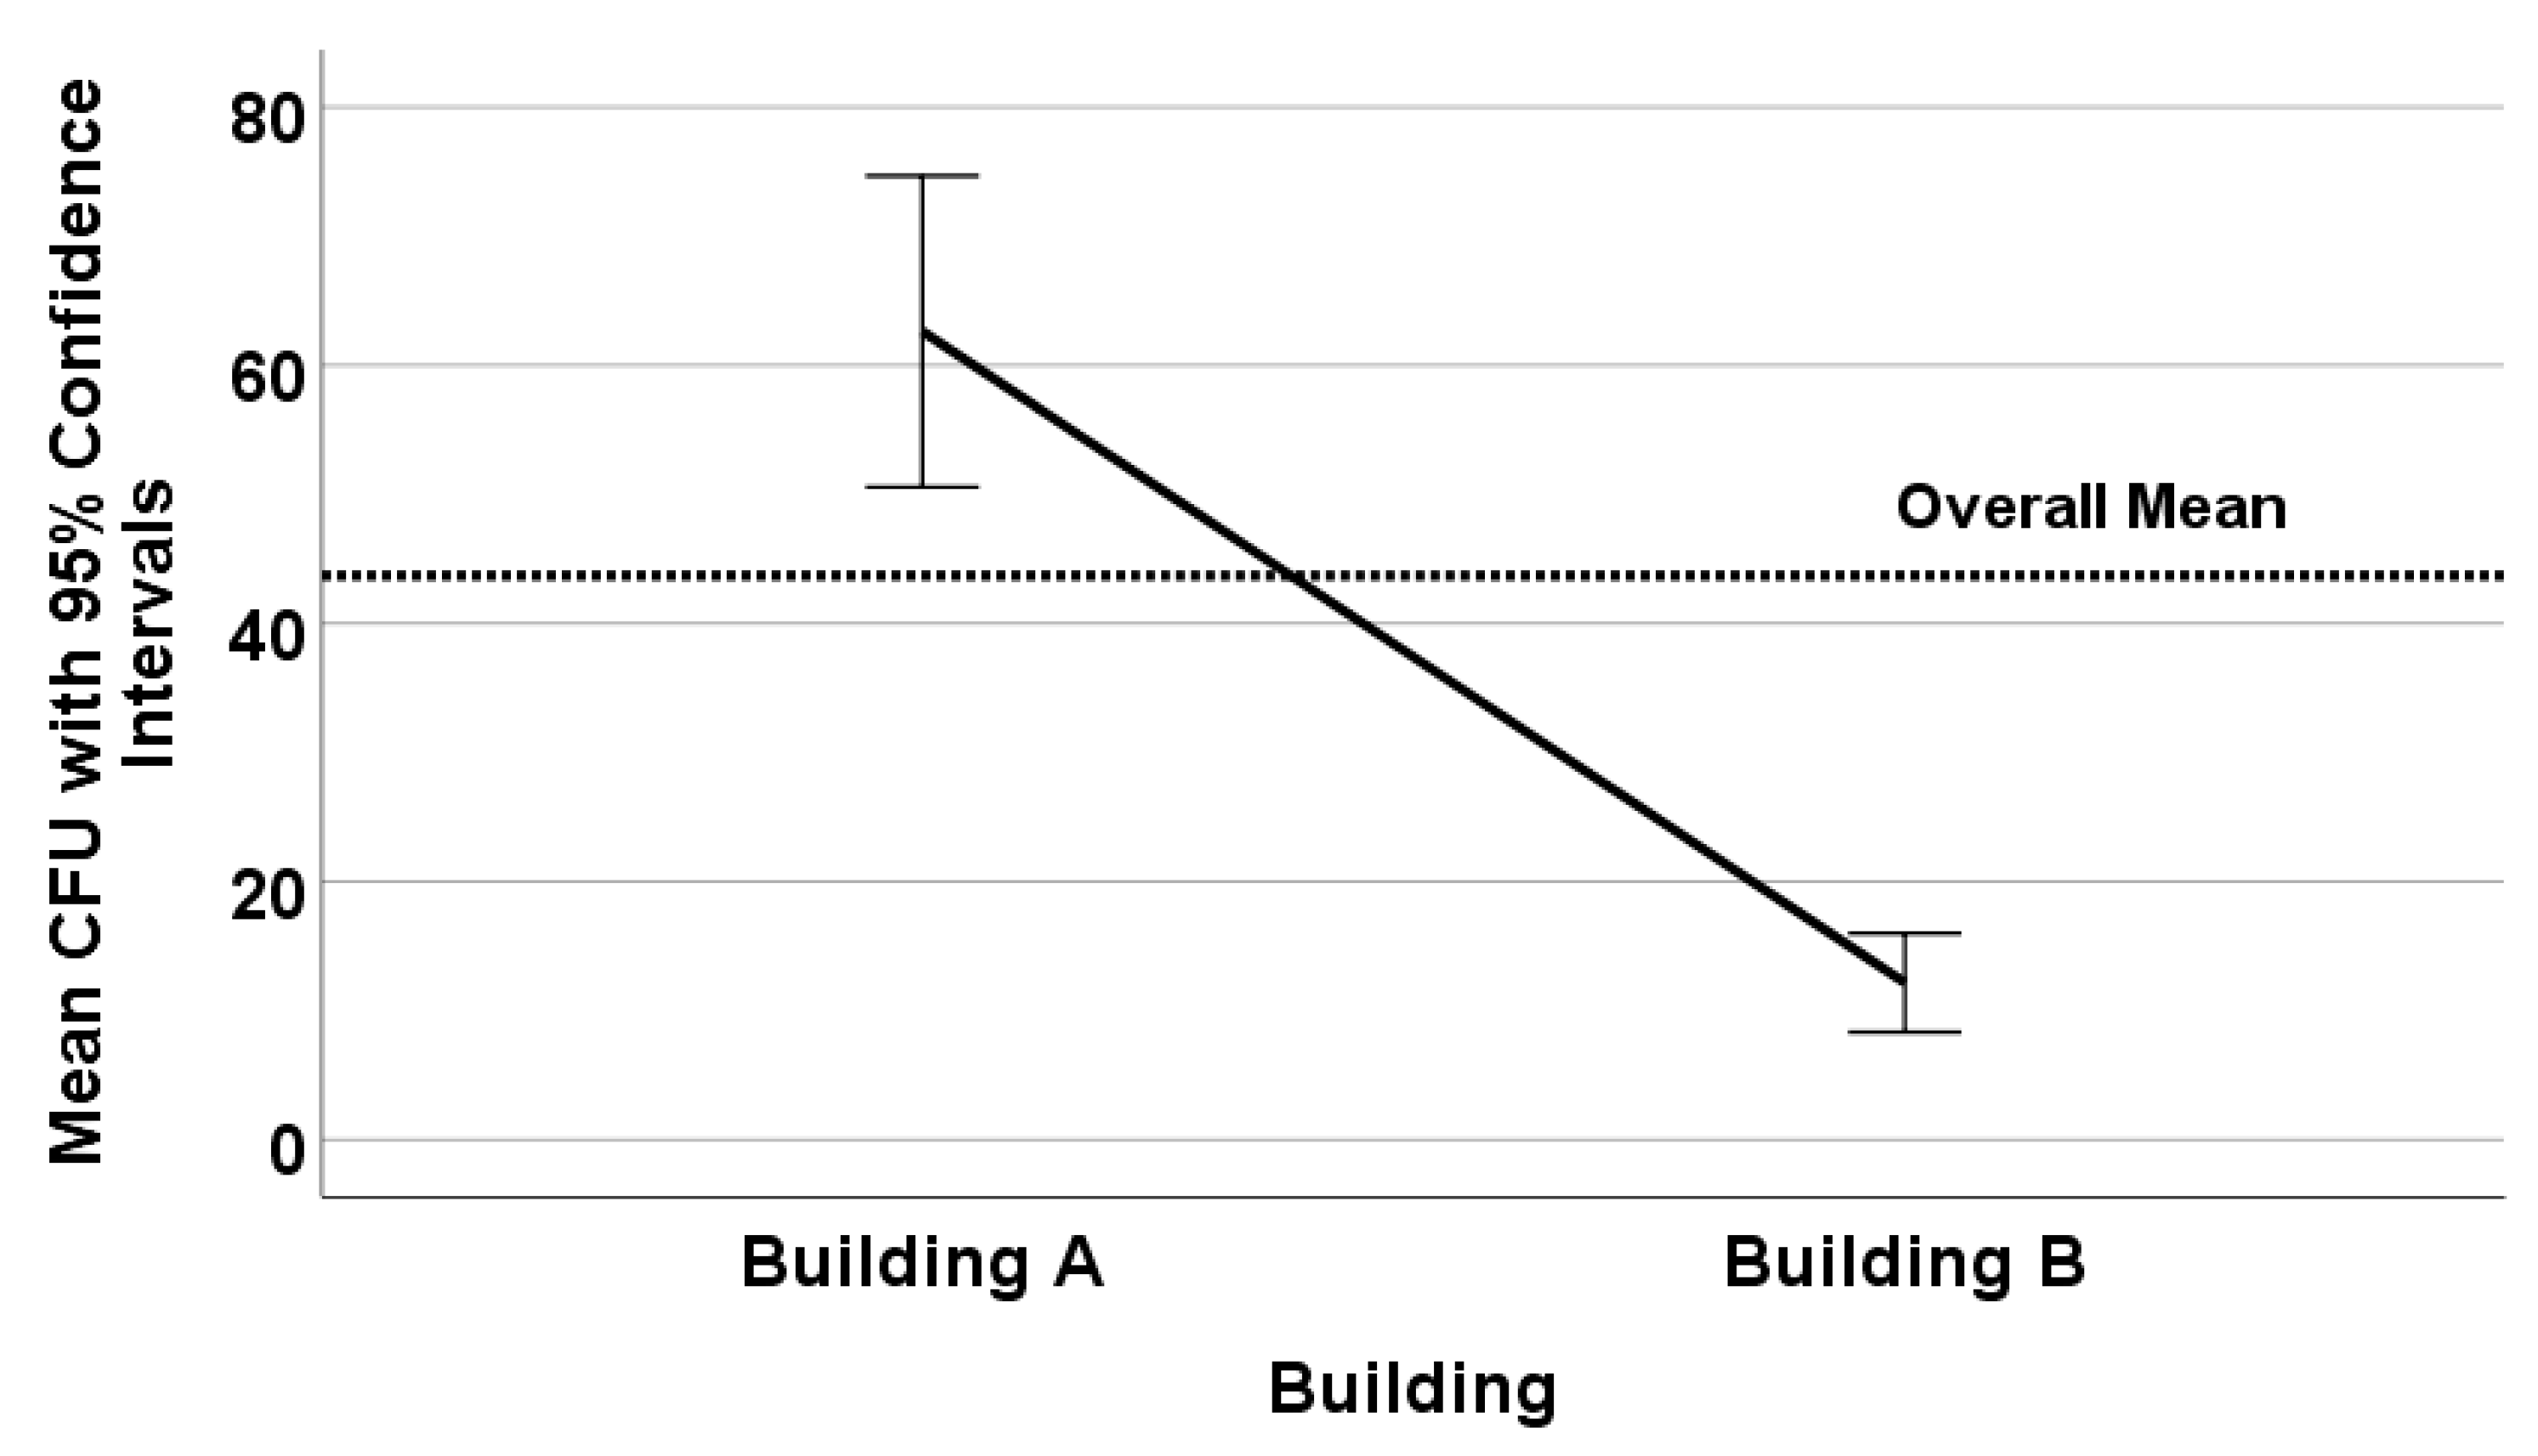
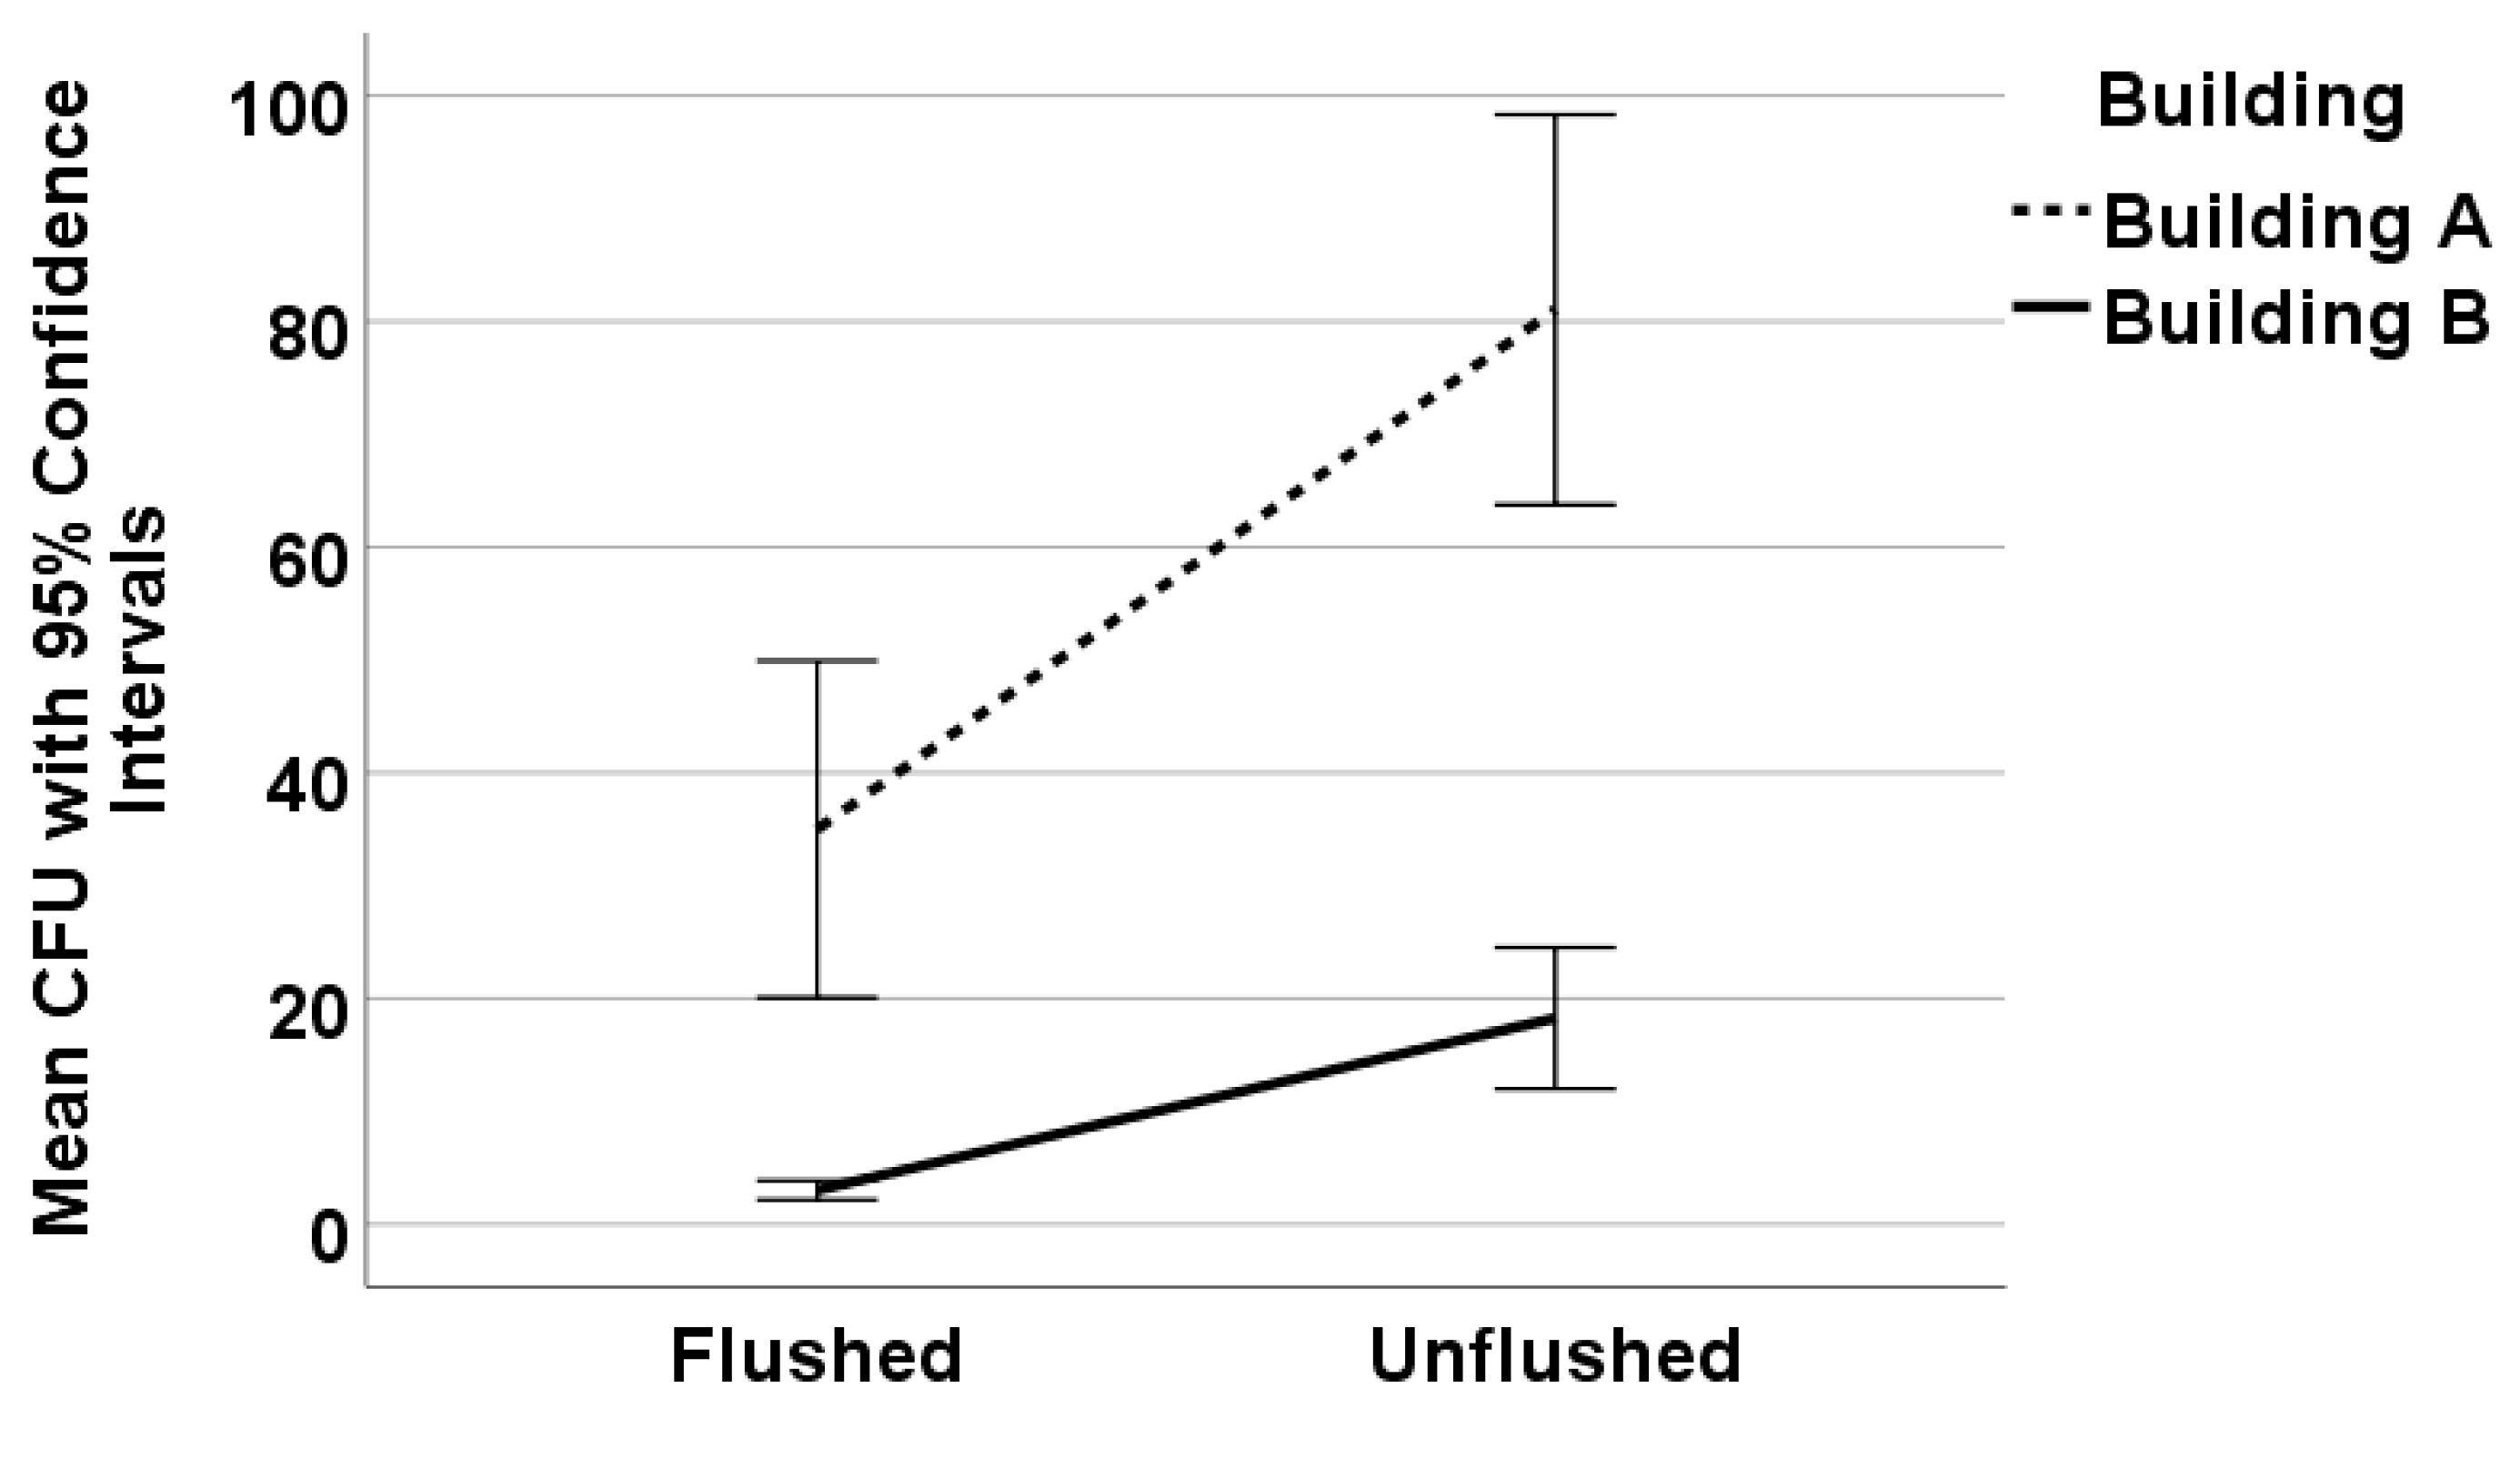
3.1. Effects of Flushing and Volume Tested on Legionella Recovery

Over the course of this study, Legionella pneumophila serogroups 1, 4, and 5 were recovered and identified along with Legionella blue-white fluorescing species. A total of 240 water samples were collected and tested in this study: 150 from Building A and 90 from Building B. On average, the amount of Legionella recovered in all samples was 44 CFU/mL (±4.0 CFU/mL standard error). There was a statistically significant difference in counts from Building A (mean 63 CFU/mL ± 6.1 CFU/mL standard error) and Building B (mean 12 CFU/mL ± 1.9 CFU/mL standard error) (p < 0.0001) (Figure 1). On average, 75% of the samples were positive in Building A and 65% of the samples in Building B. There were significantly more positive samples per building than negatives (p < 0.001).
There was a statistically significant difference between the mean Legionella CFU/mL obtained from flushed and unflushed immediate samples, 23 CFU/mL vs. 57 CFU/mL, respectively (p < 0.0001). Flushed samples had an overall reduction in Legionella counts of 60% compared to unflushed samples. Additionally, there were significantly more positive unflushed samples on average (82%) than flushed (54%) (p < 0.001).
At the building level, the mean Legionella counts in Building A were significantly higher, 81 CFU/mL compared to 35 CFU/mL, in unflushed and flushed samples, respectively (p < 0.001) (Figure 2). There was overall a 63% reduction in Legionella concentrations based on flushing. In Building A, there was on average 60% positivity of flushed samples compared to 85% positivity in unflushed (p < 0.001).
In Building B, the average unflushed Legionella concentration (18 CFU/mL) was significantly higher than in flushed samples (3 CFU/mL) (p < 0.01) (Figure 2). Flushing resulted in an 87% reduction in Legionella species. On average, in Building B, 45% of flushed samples were positive, compared to 78% unflushed samples (p < 0.001).
Comparing all five processing methods demonstrated that the reference method, filter concentration of 1000 mL of the flushed sample, resulted in the lowest recovered Legionella concentration (Table 2). In general, the direct sample processing resulted in higher Legionella counts than the related filtered volume (p < 0.01) (Table 2). The other sample processing methods resulted in between 4.806 (filtered 200 mL unflushed) and 19.691 (direct unflushed) times higher Legionella concentrations than the reference method (Table 2). The percent positivity of samples ranged from 42% (direct flushed) to 90% (filtered 100 mL unflushed) (Table 2). Filtration of 100 mL or 200 mL of unflushed water samples resulted in statistically significant higher Legionella counts (p < 0.001) and positivity (p < 0.001) than filtration of 1000 mL of flushed water. There was a significant difference in the average CFU/mL between filtration of 100 mL and 200 mL (p < 0.001) but there was no significant difference between the percentage of positive samples (p = 0.567 Chi-Square test; p = 0.283 Fisher’s Exact test).
There were significant differences in the distribution of samples based on Legionella concentration category depending on the processing method (p < 0.001). Direct processed water samples were more likely to be non-detect for Legionella (28–54%) than any volume filtered (4–10%), whereas there were no low category direct processed samples. Additionally, direct processed water samples had more moderate concentrations of Legionella (22–33%) than the different volumes filtered (11–18%). High category concentration samples were not obtained using the reference method. These high category concentration samples were mostly observed in the direct unflushed samples (37%) (Table 3).

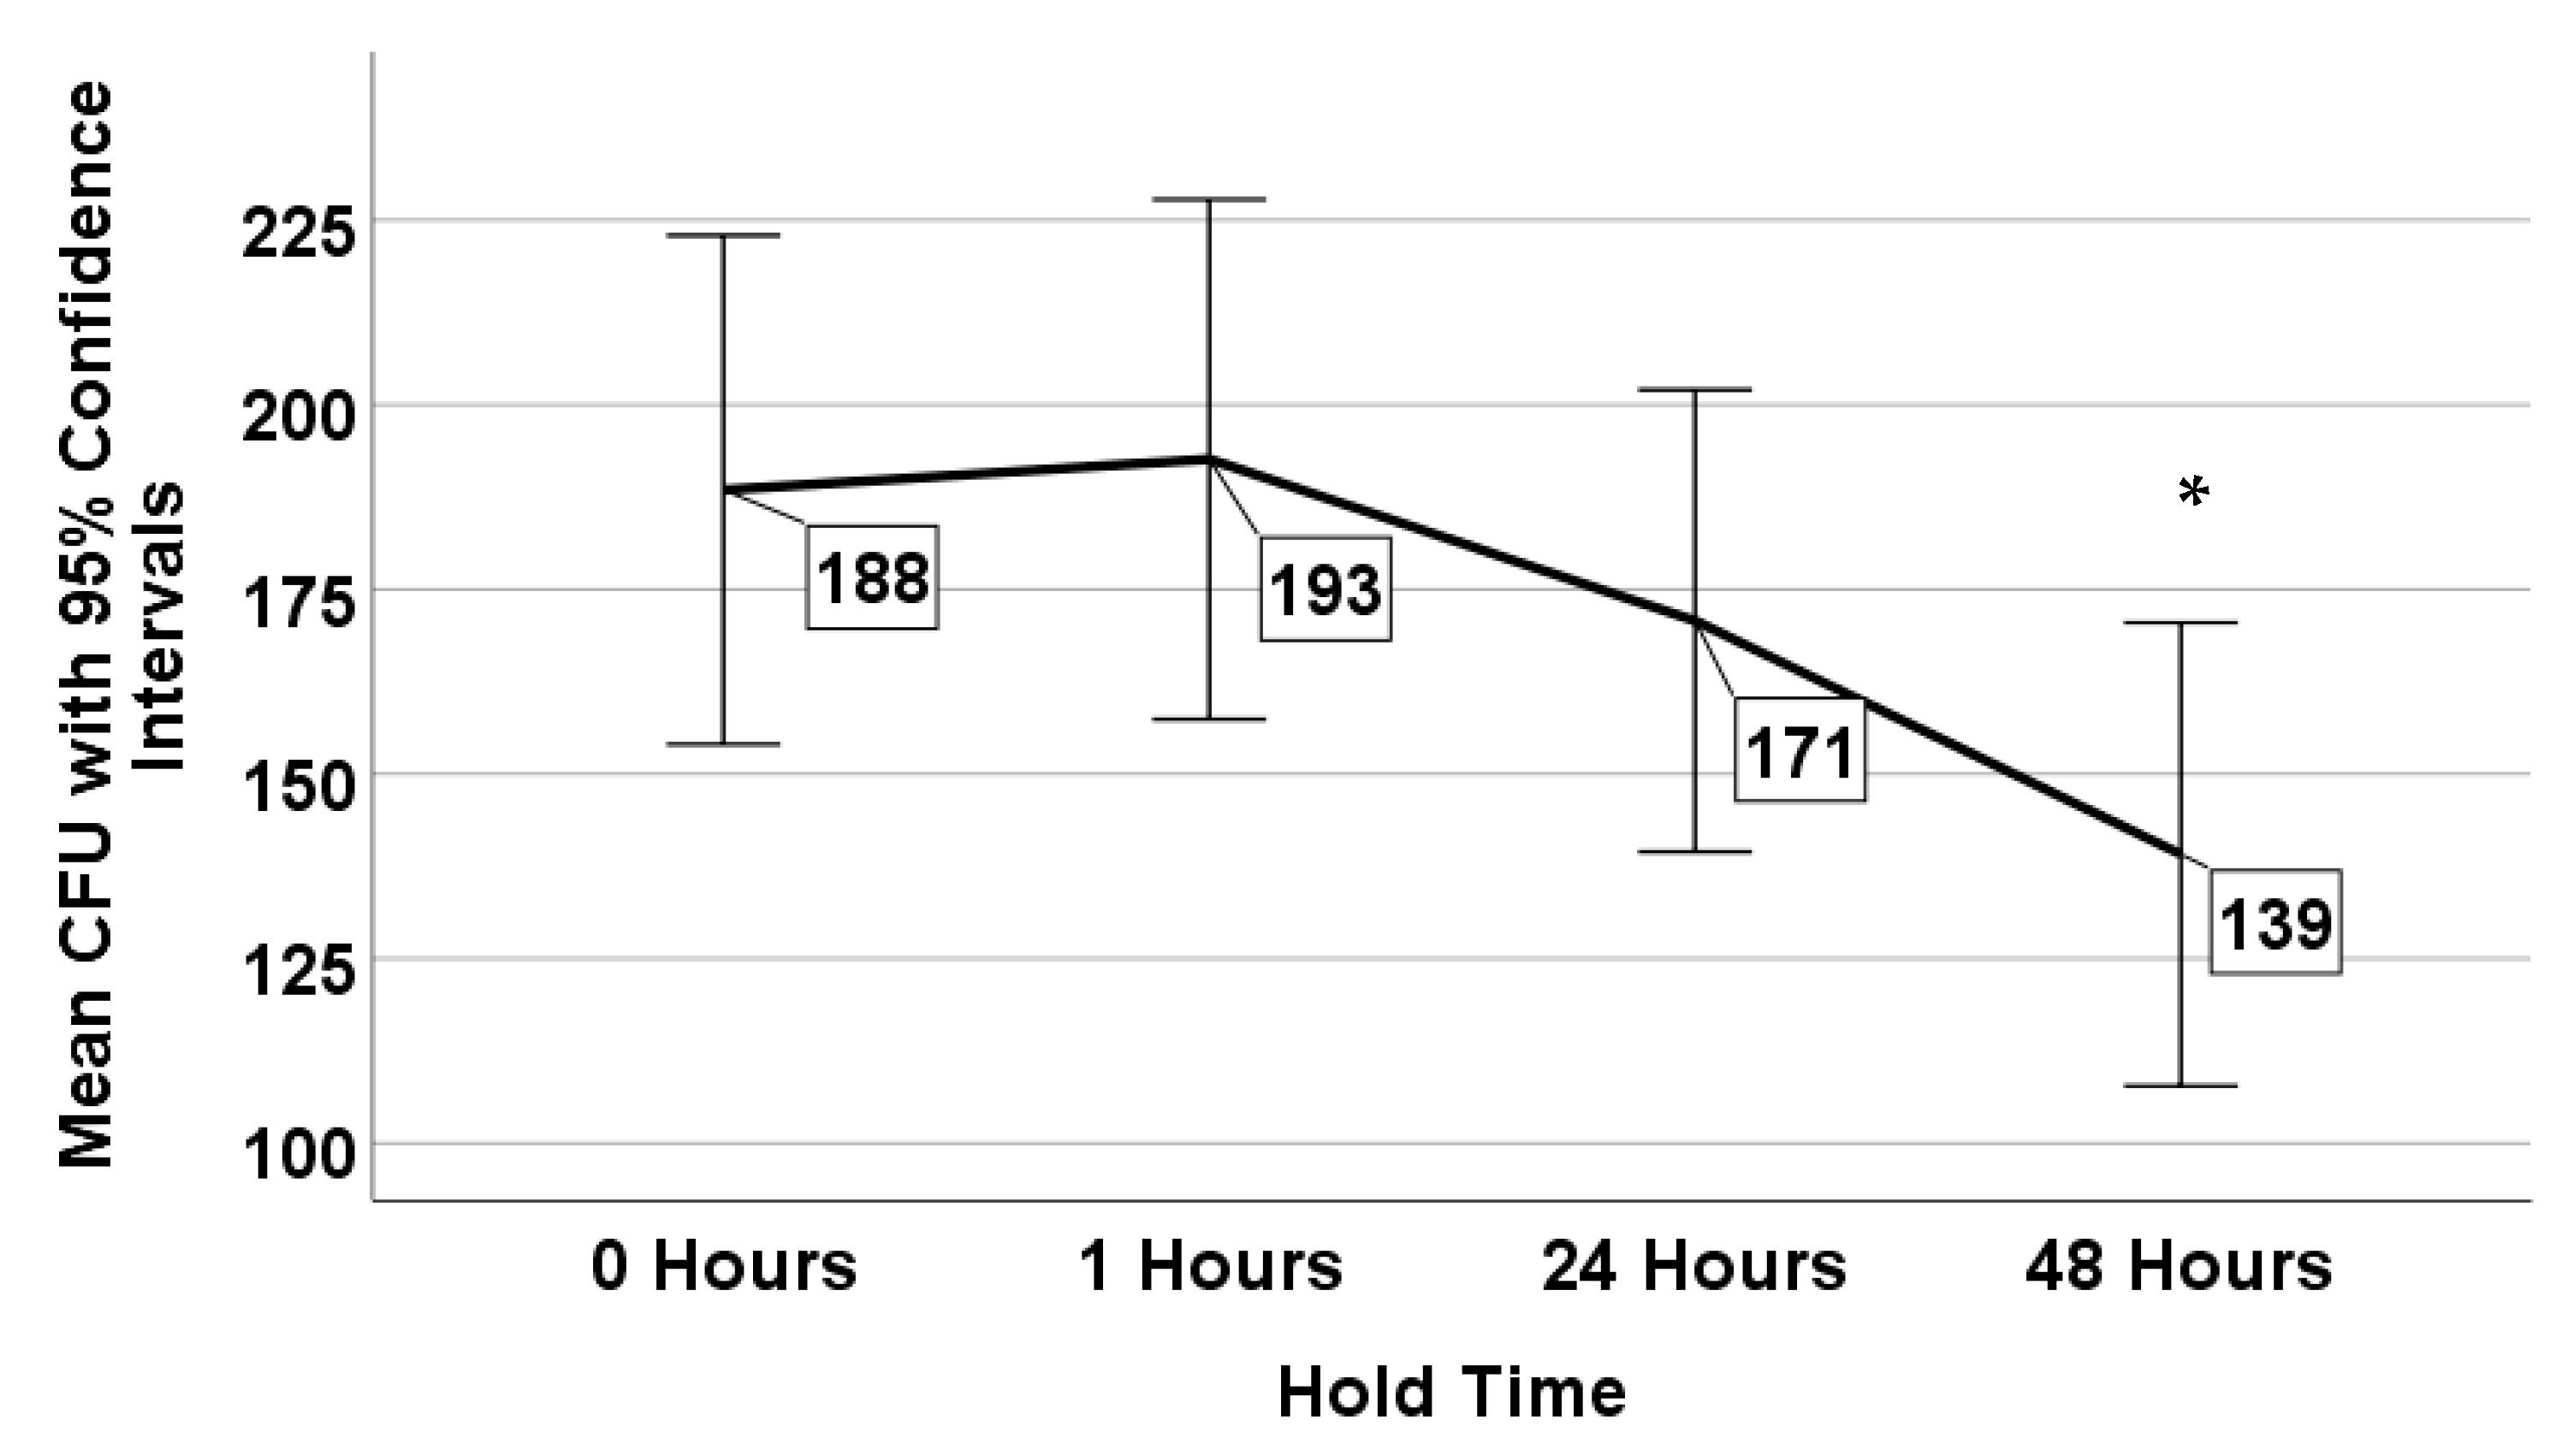
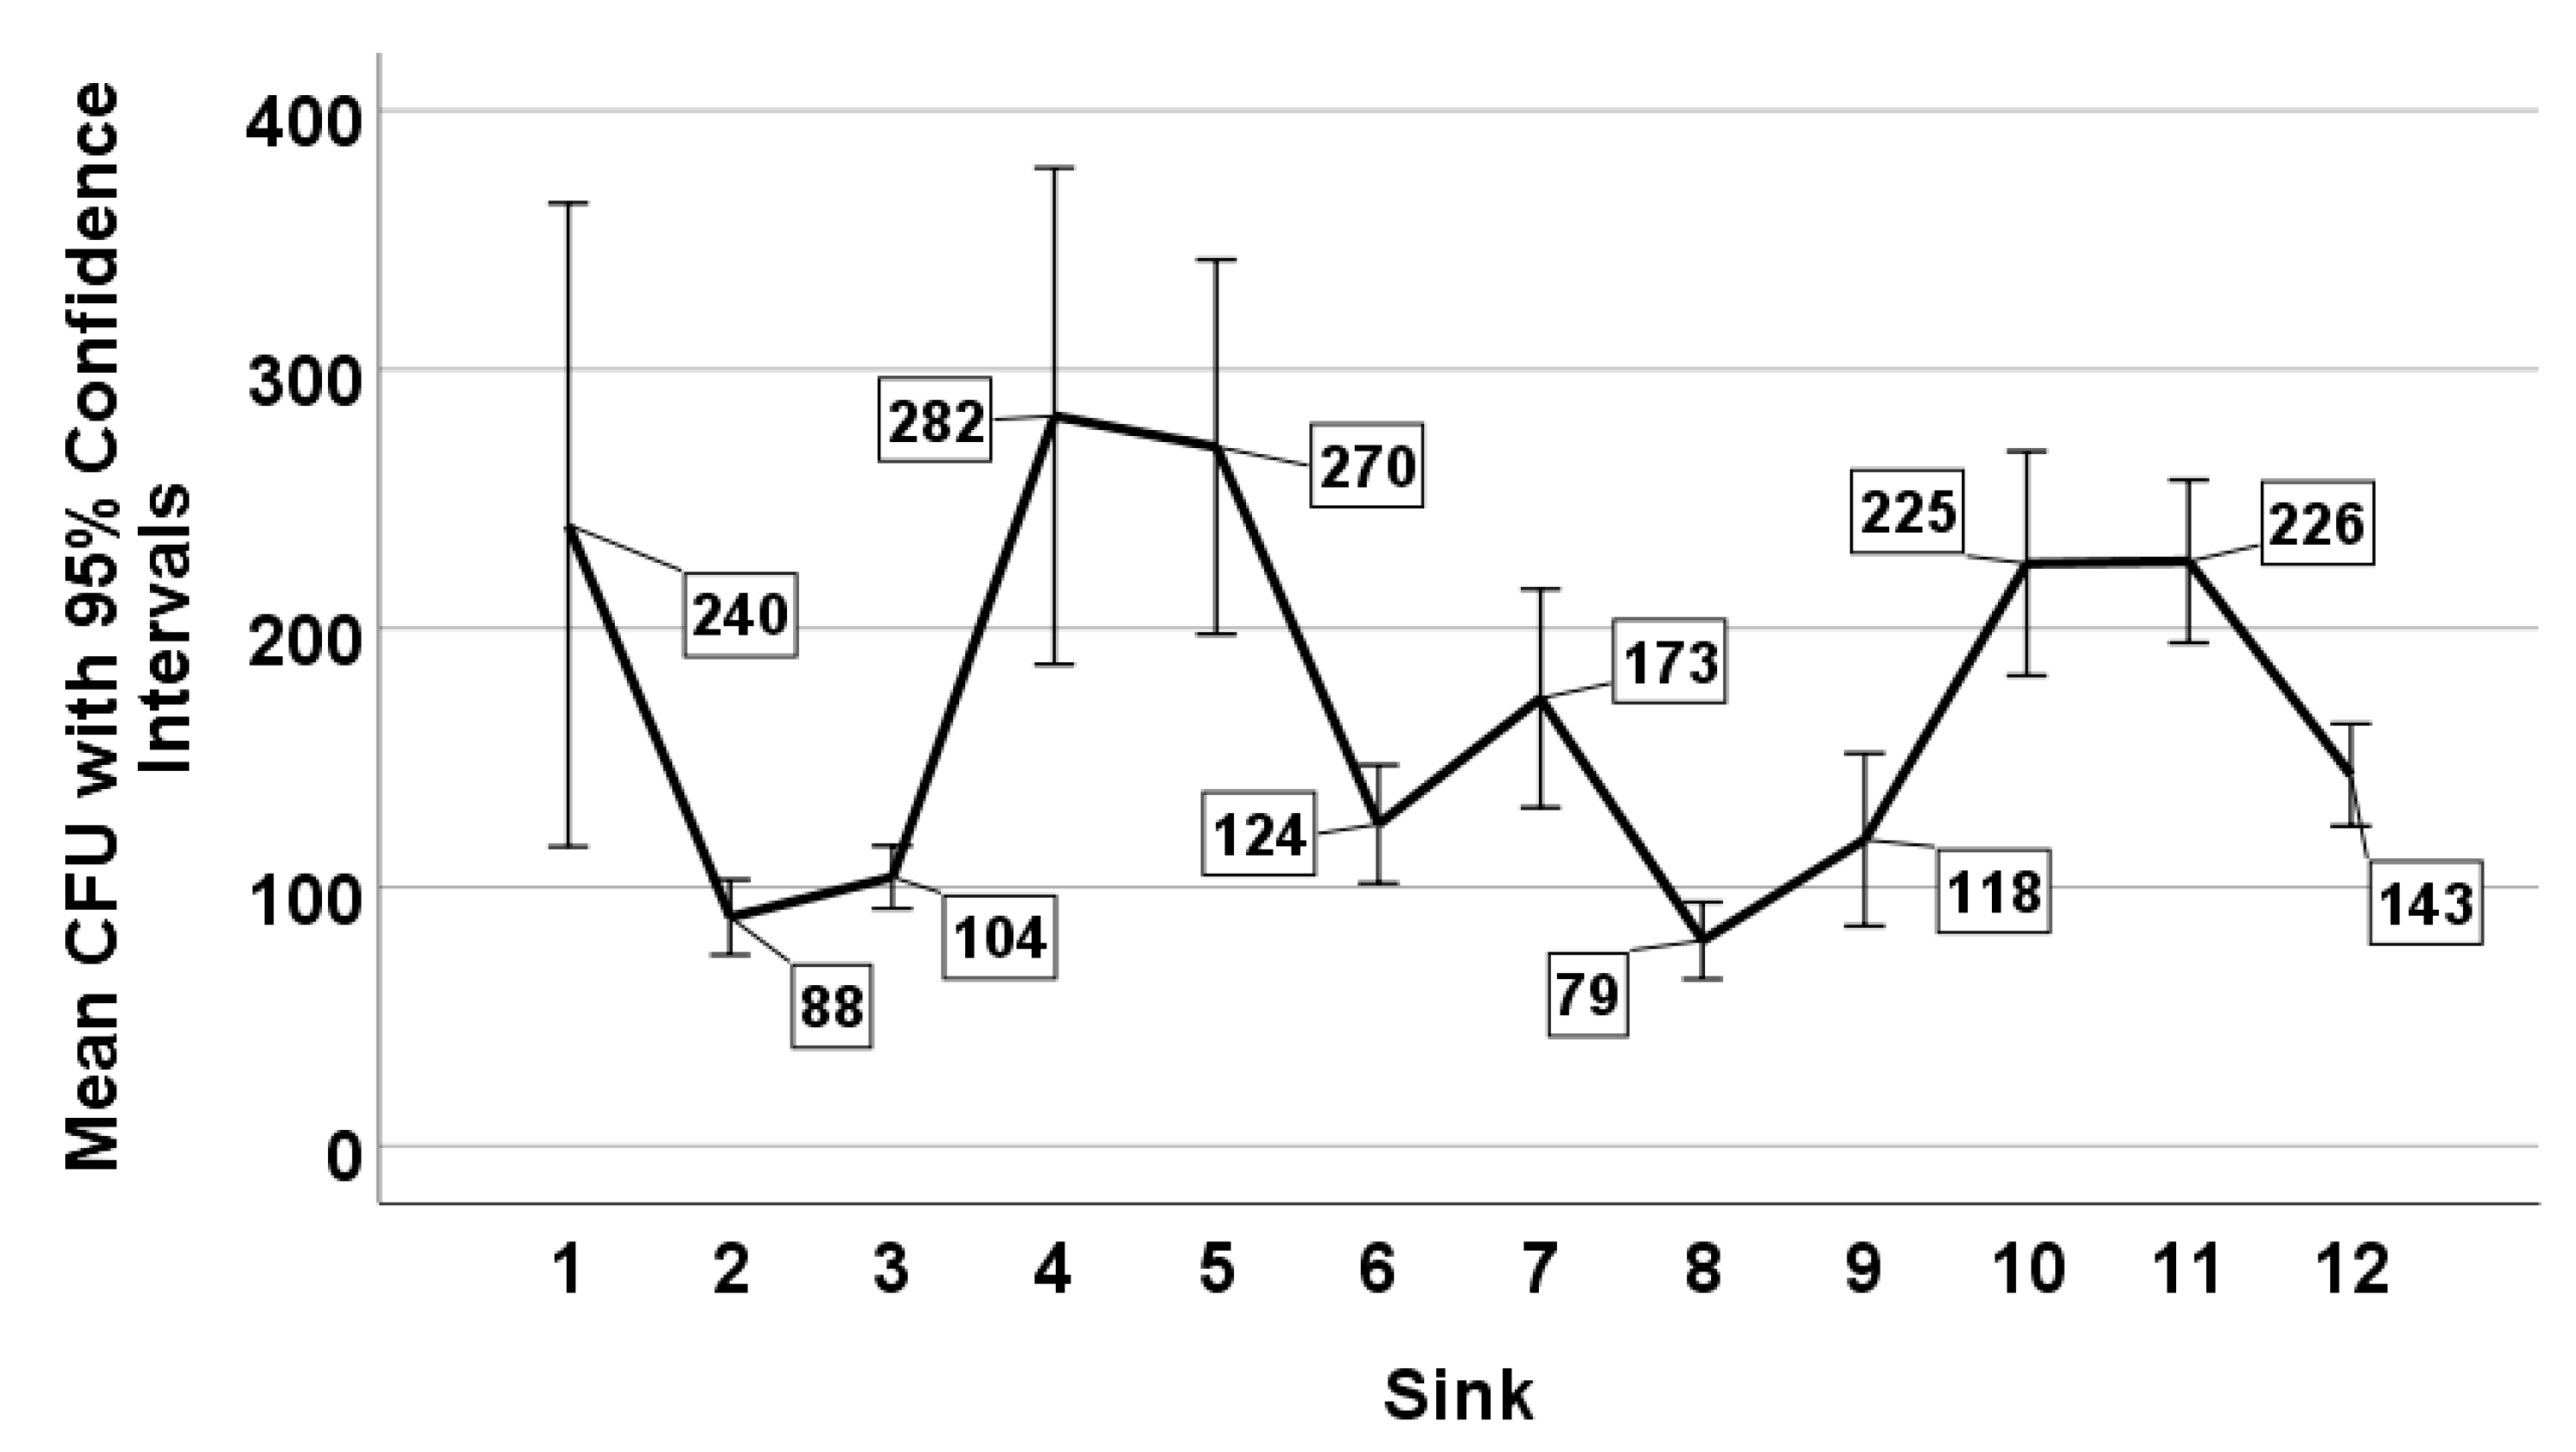
3.2. Effects of Sample Holding Time on Legionella Recovery

L. pneumophila was consistently recovered from 4 holding times of the 12 sinks throughout the 13 sampling dates. There was no significant difference in the colony counts between samples that were immediately processed (mean 188 CFU/mL ± 15.1 CFU/mL standard error) and those that were processed after 1 h (mean 193 CFU/mL ± 15.5 CFU/mL standard error) (p = 0.848) and 24 h of hold time (mean 171 CFU/mL ± 13.7 CFU/mL standard error) (p = 0.384) (Figure 3). However, there was a statistically significant reduction in colony counts after 48 h of holding time (mean 139 CFU/mL ± 11.2 CFU/mL standard error) (p = 0.008) compared to T0 (Figure 3).
Legionella concentrations were highly variable throughout the building, with the mean counts recovered ranging from 79 CFU/mL (sink 8) to 282 CFU/mL (sink 4) (Figure 4).
When comparing holding time and sink for their effect on the generalized linear model, sample location was found to account for more of the variability in Legionella concentrations than holding time (Table 4). To further analyze this finding and check for robustness, an ANOVA was also done. The effect size of holding time was not significant on Legionella counts (0.011 partial eta squared) (p = 0.073) but sink location was (0.111 partial eta squared) (p < 0.0001).
The average difference between the minimum and maximum mean recoveries for the 4 holding times was 54 CFU/mL (mean range 139–193 CFU/mL) (Figure 3), whereas the average difference based on the 12 sampling locations was 203 CFU/mL (mean range 79–282 CFU/mL) (Figure 4).

4. Discussion

Sample collection and processing are critical steps for environmental monitoring of Legionella in water systems [2,9]; however, a consensus regarding sample collection and processing approaches is still lacking across many technical guidelines [6,9,10,11,12,13,23]. Contradictions exist regarding whether to use first draw or post-flushing samples, various volumes of sample to filter concentrate, and how long the sample can be held after collection without compromising testing results. Additionally, thresholds or category levels of Legionella concentration have been proposed for specific action levels [6]. Few studies have been conducted to evaluate the effect of these variables on the Legionella results in terms of concentration or sample positivity.
Numerous previous studies suggest that the first draw sample without flushing maximizes the likelihood to recover Legionella from water samples and affects the concentration recovered [9,24,25,26]. The first 15 mL has been found to account for more than 50% of all the culturable bacteria found in the first liter [24]. This has been attributed to stagnation, which causes higher number of microorganisms due to microbial regrowth and disinfectant decay [9]. We also found that the Legionella counts were reduced, by 60% overall, after flushing the hot water for 2 min prior to sample collection. At the building level, this varied from a 63% to an 87% reduction in Building A versus Building B, respectively. Previous studies have seen similar reductions in the Legionella concentrations in hot water taps from sampling immediately and after a 3 min flush from 226 CFU/100 mL versus 45 CFU/100 mL (an 80% reduction) in the first liter and flushed samples, respectively [26]. Another study found a statistically significant reduction in total L. pneumophila concentration from 27,383 CFU/L vs. 19,462 CFU/L (a 28% reduction), including L. pneumophila serogroup 1 637 CFU/L versus 7 CFU/L (a 99% reduction), and L. pneumophila serogroups 2-14 26,746 CFU/L vs. 19,455 CFU/L (a 27% reduction) in the outlet versus a 2-min flush [25]. In the building with low expected counts (<50 CFU/mL), this could have a large impact on being able to recover any Legionella at all when collecting a flushed sample. If the building was the potential source of an outbreak and only flushed samples were collected, it may take multiple sampling attempts to recover an isolate to compare epidemiologically to a case of disease. As a public health measure, it may be useful for the public to flush water for several minutes prior to use for drinking or showering to reduce the load of Legionella present, especially in outlets with low or no prior use. Although this information is specific to Legionella species, this flushing may also provide benefit in reducing the concentration of other waterborne pathogens and potential exposure.
The overall sample positivity in the building was also found to be reduced by flushing, though not as much as the reduction in concentration. In Building A, positivity was reduced from 85% to 60% and in Building B from 78% to 45% after flushing. Positivity has been observed to be reduced after flushing previously. Samples positive for Legionella species were reduced from 35% positivity to 23%, comparing the hot water samples collected immediately and after a 3 min flush [26]. Cristina et al. noted a reduction in L. pneumophila serogroup 1 from 15.79% to 2.63% in hot water samples from the outlet versus 2-min flushed samples representing the plumbing system. Interestingly, this difference was not as pronounced for L. pneumophila serogroups 2-14, 42.11% outlet versus 40.79% flushed [25]. In our study, the low count building was again more affected by flushing than the higher count building, which can have implications for evaluation of risk. Collection of the first draw hot water also better represents a potential exposure event to an individual using that water source by capturing the initial slough off of bacteria from the biofilm in that specific outlet, which can allow for more targeted intervention if needed [27]. Sampling 15 mL instead of 1 L in first draw samples yielded 10 fold higher total bacterial counts, and after stagnation overnight, this was increased to 100 fold higher [24].
Directly plated cultures had the highest counts of Legionella in their collection method grouping (flushed versus unflushed) but the lowest sample positivity. This is likely due to a combination of effects including previously noted loss of recovery due to filter concentration [28]; that filter concentration allows for detection of low levels of Legionella in the samples. The ISO 11731:2017 [11] recommends multiple processing methods by sample type for the optimal recovery of Legionella in samples. The processing method also affected the category level that the Legionella concentration was found to be in. Most often, samples that were non-detect for Legionella were found in the direct plating whereas the low (<10 CFU/mL) concentration was only found in filtered samples. This evidence lends more support to the combination of effects noted and the advantage of using multiple processing methods. Processing an unflushed environmental water sample by both plating directly and after filter concentration of 100 mL yields both the best Legionella concentration and percent sample positivity. All sample positivity values exceeded 30%; however, the range within a collection method (42–67% flushed and 70–90% unflushed) varied by 20–25 percent. Depending on the collection and processing method selected, the Legionella concentration and positivity rate may artificially or incorrectly be found to be within regulatory limits. Interestingly, all concentrations of Legionella were significantly higher than the reference method (filtration of 1L after flushing), both in direct and filtered processing methods. No high concentration (≥100 CFU/mL) samples were recovered from this reference method. It has been noted that flushing reduces the probability of recovering Legionella if it is present in a sample [9,25,26], so this finding was expected but the magnitude (almost 20 times higher in directly plated, unflushed samples) was not. Although specific methods and studies have recommended larger sample volume for improving detection sensitivity, large sample volume often results in additional sampling costs, including supplies, labor, equipment, and shipment to the laboratory [9].
Previous studies evaluating effects of sample holding time on Legionella culture recovery observed competing results [17,18]. Holding water samples prior to processing was found to increase Legionella culture recovery [17]. However, a subsequent study observed that sample hold time had a small effect on Legionella culture results when compared to inherent methodology error, thus concluding that holding samples up to 48 h did not generate erroneous results [18]. The current study found there was no significant difference in Legionella culture results between time zero and up to 24 h of hold time. We found, however, a statistically significant reduction in Legionella counts after 48 h of holding time, not an increase. To reduce bias, we modeled from 12 sinks and 13 sampling dates to maximize the variability in these results. The Legionella concentration variability based on sampling location was significantly greater than the variability due to the hold time. The culture counts based on sampling location were so variable, they spanned 203 CFU/mL across the 12 sinks within the same building. For this reason, collection of multiple samples within the building is needed to allow for a more representative sampling. If too few samples are collected, a regulatory limit based on Legionella counts alone may be incorrectly met or missed. Previous studies have identified this variability in Legionella concentrations as a limitation of predicting disease risk based on counts alone. They have independently validated, based on environmental and clinical data, that when >30% of distal sites are positive for Legionella there is an increased risk of disease in individuals exposed to that water system [19,29,30,31,32,33].
Our results demonstrate that processing an immediate, unflushed 100 mL water sample produces the best possibility of recovering Legionella both based on count and sample positivity with direct and filter concentration processing, respectively. This sample processing can identify Legionella counts in all four defined category levels (non-detect, low, moderate, and high) [6]. Water samples processed within 24 h of collection show no change in Legionella counts due to hold time. As recommended by several organizations noted in Table 1, these samples should be received by the laboratory as soon after collection as possible for processing. While counts after 48 h were significantly less than in immediate processing, this change in concentration was substantially less than the variability of sampling locations in a building. To account for the extreme volatility in Legionella counts within a building, multiple sampling locations throughout the building should be analyzed and the percentage of positive distal sites should be considered in addition to the concentration. We recommend that in order to get a thorough picture of the Legionella risk in the building water system that immediate, unflushed hot water samples are collected from at least 10 distal outlets in the system that are then processed within 48 h of sample collection. Our results support educating the general public to allow water for drinking or showering to flush for several minutes, especially in outlets with suspected stagnation, to reduce the burden of waterborne organisms prior to use.

Author Contributions

Conceptualization, M.B.H., S.M.M., J.D.R., M.H.Y., and J.E.S.; formal analysis, M.B.H. and J.L.B.; funding acquisition, J.E.S.; investigation, M.B.H., S.M.M., J.D.R., and M.H.Y.; methodology, S.M.M., J.D.R., M.H.Y., and J.E.S.; project administration, J.L.B., S.M.M., and J.D.R.; resources, M.H.Y.; supervision, J.L.B., M.H.Y., and J.E.S.; validation, M.B.H., J.L.B., S.M.M., and J.D.R.; visualization, M.B.H. and J.L.B.; writing—original draft preparation, M.B.H., J.L.B., and S.M.M.; writing—review and editing, M.B.H., J.L.B., S.M.M., J.D.R., M.H.Y., and J.E.S. All authors have read and agreed to the published version of the manuscript.

Funding

This research received no external funding.

Acknowledgments

The authors would like to thank Patrick L. Yorio for his expert statistical analyses and Andrea J. Schaeffer for her assistance with sample collection and processing. We would also like to thank Xiao Ma for his assistance with initial drafts and revisions of this manuscript.

Conflicts of Interest

The authors declare no conflict of interest.

References

  1. Stout, J.E.; Yu, V.L. Legionellosis. N. Engl. J. Med. 1997, 337, 682–687. [Google Scholar] [CrossRef] [PubMed]
  2. Stout, J.E.; Muder, R.R.; Mietzner, S.; Wagener, M.M.; Perri, M.B.; DeRoos, K.; Goodrich, D.; Arnold, W.; Williamson, T.; Ruark, O.; et al. Role of environmental surveillance in determining the risk of hospital-acquired legionellosis: A national surveillance study with clinical correlations. Infect. Control Hosp. Epidemiol. 2007, 28, 818–824. [Google Scholar] [CrossRef] [PubMed]
  3. Stout, J.E.; Yu, V.L. Legionella in the Hospital Water Supply: A Plea for Decision Making Based on Evidence-Based Medicine. Infect. Control Hosp. Epidemiol. 2001, 22, 670–672. [Google Scholar] [CrossRef] [PubMed]
  4. ANSI/ASHRAE Standard 188-2018. Legionellosis: Risk Management for Building Water Systems; American Society of Heating, Refrigerating and Air-Conditioning Engineers: Atlanta, GA, USA, 2018. [Google Scholar]
  5. Government of New York. Part 4—Protection Against Legionella. In New York Codes, Rules and Regulations; Title 10; Government of New York: New York, NY, USA, 2016. [Google Scholar]
  6. Kerbel, W.; Krause, J.D.; Shelton, B.G.; Springston, J. (Eds.) Recognition, Evaluation, and Control. of Legionella in Building Water Systems; American Industrial Hygiene Association: Falls Church, VA, USA, 2015. [Google Scholar]
  7. Clancy, C.M.; Department of Veterans Affairs; Veterans Health Administration. VHA Directive 1061: Prevention of Healthcare-Associated Legionella Disease and Scald Injury from Potable Water Distribution Systems; Department of Veterans Affairs: Washington, DC, USA, 2014. [Google Scholar]
  8. Centers for Medicare & Medicaid Services (CMS). Requirement to Reduce Legionella Risk in Healthcare Facility Water Systems to Prevent Cases and Outbreaks of Legionnaires’ Disease (LD); S&C 17-30-Hospitals/CAHs/NHs; Department of Health & Human Services: Baltimore, MD, USA, 2017.
  9. Wang, H.; Bédard, E.; Prévost, M.; Camper, A.K.; Hill, V.R.; Pruden, A. Methodological approaches for monitoring opportunistic pathogens in premise plumbing: A review. Water Res. 2017, 117, 68–86. [Google Scholar] [CrossRef] [PubMed] [Green Version]
  10. D5952-08(2015). Standard Guide for the Inspection of Water Systems for Legionella and the Investigation of Possible Outbreaks of Legionellosis (Legionnaires’ Disease or Pontiac Fever); ASTM International: West Conshohocken, PA, USA, 2015; Available online: www.astm.org (accessed on 14 May 2020).
  11. ISO 11731:2017. Water Quality—Enumeration of Legionella; ISO: Geneva, Switzerland, 2017. [Google Scholar]
  12. Guideline 12-2020. Minimizing the Risk of Legionellosis Associated with Building Water Systems; American Society of Heating, Refrigerating and Air-Conditioning Engineers: Atlanta, GA, USA, 2020. [Google Scholar]
  13. National Center for Immunization and Respiratory Diseases. CDC Laboratory Guidance for Processing Environmental Samples; U.S. Department of Health and Human Services, Ed.; U.S. Department of Health and Human Services: Atlanta, GA, USA, 2005.
  14. Borella, P.; Montagna, M.T.; Romano-Spica, V.; Stampi, S.; Stancanelli, G.; Triassi, M.; Neglia, R.; Marchesi, I.; Fantuzzi, G.; Tato, D.; et al. Legionella infection risk from domestic hot water. Emerg. Infect. Dis. 2004, 10, 457–464. [Google Scholar] [CrossRef] [PubMed]
  15. Flannery, B.; Gelling, L.B.; Vugia, D.J.; Weintraub, J.M.; Salerno, J.J.; Conroy, M.J.; Stevens, V.A.; Rose, C.E.; Moore, M.R.; Fields, B.S.; et al. Reducing Legionella colonization of water systems with monochloramine. Emerg. Infect. Dis. 2006, 12. [Google Scholar] [CrossRef] [Green Version]
  16. Bargellini, A.; Marchesi, I.; Righi, E.; Ferrari, A.; Cencetti, S.; Borella, P.; Rovesti, S. Parameters predictive of Legionella contamination in hot water systems: Association with trace elements and heterotrophic plate counts. Water Res. 2011, 45, 2315–2321. [Google Scholar] [CrossRef]
  17. McCoy, W.F.; Downes, E.L.; Leonidas, L.F.; Cain, M.F.; Sherman, D.L.; Chen, K.; Devender, S.; Neville, M.J. Inaccuracy in Legionella tests of building water systems due to sample holding time. Water Res. 2012, 46, 3497–3506. [Google Scholar] [CrossRef]
  18. Dana Flanders, W.; Kirkland, K.H.; Shelton, B.G. Effects of holding time and measurement error on culturing Legionella in environmental water samples. Water Res. 2014, 62, 293–301. [Google Scholar] [CrossRef] [Green Version]
  19. Nagy, D.J.; Dziewulski, D.M.; Codru, N.; Lauper, U.L. Understanding the distribution of positive Legionella samples in healthcare-premise water systems: Using statistical analysis to determine a distribution for Legionella and to support sample size recommendations. Infect. Control Hosp. Epidemiol. 2020. [Google Scholar] [CrossRef]
  20. ISO 19458:2006. Water Quality- Sampling for Microbiological Analysis; ISO: Geneva, Switzerland, 2006. [Google Scholar]
  21. ISO 11731:1998. Water Quality Detection and Enumeration of Legionella; ISO: Geneva, Switzerland, 1998. [Google Scholar]
  22. Vickers, R.M.; Brown, A.; Garrity, G.M. Dye-containing buffered charcoal yeast extract medium for the differentiation of members of the family Legionellaceae. J. Clin. Microbiol. 1981, 13, 380–382. [Google Scholar] [CrossRef] [PubMed] [Green Version]
  23. Kozak, N.A.; Lucas, C.E.; Winchell, J.M. Identification of Legionella in the Environment. In Legionella: Methods and Protocols; Buchrieser, C., Hilbi, H., Eds.; Humana Press: Totowa, NJ, USA, 2013; pp. 3–25. [Google Scholar]
  24. Bédard, E.; Laferrière, C.; Déziel, E.; Prévost, M. Impact of stagnation and sampling volume on water microbial quality monitoring in large buildings. PLoS ONE 2018, 13, e0199429. [Google Scholar] [CrossRef] [PubMed] [Green Version]
  25. Cristina, M.L.; Spagnolo, A.M.; Casini, B.; Baggiani, A.; Del Giudice, P.; Brusaferro, S.; Poscia, A.; Moscato, U.; Perdelli, F.; Orlando, P. The impact of aerators on water contamination by emerging gram-negative opportunists in at-risk hospital departments. Infect. Control Hosp. Epidemiol. 2014, 35, 122–129. [Google Scholar] [CrossRef] [PubMed]
  26. Serrano-Suárez, A.; Dellundé, J.; Salvadó, H.; Cervero-Aragó, S.; Méndez, J.; Canals, O.; Blanco, S.; Arcas, A.; Araujo, R. Microbial and physicochemical parameters associated with Legionella contamination in hot water recirculation systems. Environ. Sci. Pollut Res. Int. 2013, 20, 5534–5544. [Google Scholar] [CrossRef]
  27. Bédard, E.; Fey, S.; Charron, D.; Lalancette, C.; Cantin, P.; Dolcé, P.; Laferrière, C.; Déziel, E.; Prévost, M. Temperature diagnostic to identify high risk areas and optimize Legionella pneumophila surveillance in hot water distribution systems. Water Res. 2015, 71, 244–256. [Google Scholar] [CrossRef]
  28. Smith, L.; Carroll, K.; Mottice, S. Comparison of membrane filters for recovery of legionellae from water samples. Appl. Environ. Microbiol. 1993, 59, 344–346. [Google Scholar] [CrossRef] [Green Version]
  29. Best, M.; Yu, V.L.; Stout, J.; Goetz, A.; Muder, R.R.; Taylor, F. Legionellaceae in the hospital water supply—Epidemiological link with disease and evaluation of a method of control of nosocomial Legionnaires’ disease and Pittsburgh pneumonia. Lancet 1983, 2, 307–310. [Google Scholar] [CrossRef]
  30. Johnson, J.T.; Yu, V.L.; Best, M.; Vickers, R.M.; Goetz, A.; Wagner, R.; Wicker, H.; Woo, A. Nosocomial legionellosis uncovered in surgical patients with head and neck cancer: Implications for epidemiologic reservoir and mode of transmission. Lancet 1985, 2, 298–300. [Google Scholar] [CrossRef]
  31. Kool, J.L.; Bergmire-Sweat, D.; Butler, J.C.; Brown, E.W.; Peabody, D.J.; Massi, D.S.; Carpenter, J.C.; Pruckler, J.M.; Benson, R.F.; Fields, B.S. Hospital characteristics associated with colonization of water systems by Legionella and risk of nosocomial Legionnaires’ disease: A cohort study of 15 hospitals. Infect. Control Hosp. Epidemiol. 1999, 20, 798–805. [Google Scholar] [CrossRef]
  32. Sabria, M.; Modol, J.M.; Garcia-Nunez, M.; Reynaga, E.; Pedro-Botet, M.L.; Gimeno, J.M.; Sopena, N.; Rey-Joly, C. Environmental cultures and hospital-acquired legionnaires’ disease. A 5-year prospective study in 20 hospitals in Catalonia, Spain. Infect. Control Hosp. Epidemiol. 2004, 25, 1072–1076. [Google Scholar] [CrossRef] [Green Version]
  33. Boccia, S.; Laurenti, P.; Borella, P.; Moscato, U.; Capalbo, G.; Cambieri, A.; Amore, R.; Quaranta, G.; Boninti, F.; Orsini, M.; et al. Prospective 3-year surveillance for nosocomial and environmental Legionella pneumophila: Implications for infection control. Infect. Control Hosp. Epidemiol. 2006, 27, 459–465. [Google Scholar] [CrossRef] [PubMed]
Figure 1. Mean Legionella counts (colony forming units per milliliter (CFU/mL)) as a function of building.
Microorganisms 08 01770 g001
Figure 2. Mean Legionella counts (CFU/mL) as a function of flushing by building.
Microorganisms 08 01770 g002
Figure 3. Mean Legionella counts (CFU/mL) as a function of hold time. * denotes a statistically significant difference (p < 0.05).
Microorganisms 08 01770 g003
Figure 4. Mean Legionella counts (CFU/mL) as a function of sampling location.
Microorganisms 08 01770 g004
Table 1. Summary of sample collection, holding time, and shipping recommendations.
CDC [13]ISO 1 [11]AIHA [6]ASTM [10]ASHRAE [12]
CollectionFlush hot water for a few minutes until water is warm but not hotNo flushImmediate and 2-min minimum flushNo flushNo flush to represent outlet conditions; flush to represent system water
Volume1 L1 L125 mL–1 L for potable; 125 mL minimum for non-potable10–100 mL for non-potable; >1 L for potable250 mL for routine monitoring; 1 L for investigations
Holding Time or Shipping RecommendationsNot specified; Refrigerate if not processed within 72 hHold time 24 h–2 days; transport at 5 ± 3 °C is recommended, ambient temperature is acceptableShip overnight in an insulated container without iceShip overnight; Process within 48 h; Refrigerate if not processed in 72 hShip at ambient temperature within 24 h from collection; if time must exceed 48 h, consult with lab
CDC: Centers for Disease Control and Prevention; ISO: International Organization for Standardization; AIHA: American Industrial Hygiene Association; ASTM: American Society for Testing and Materials; ASHRAE: formerly the American Society of Heating, Refrigerating and Air-Conditioning Engineers. 1 The ISO 11731:2017 cites ISO 19458 “Water Quality—Sampling for Microbiological Analysis” for these recommendations [20].
Table 2. Descriptive statistics of Legionella based on processing and collection method.
Processing MethodCollection MethodMean Legionella (CFU/mL)Standard Error (CFU/mL)Exp(B) 1p-ValueSample Positivity
DirectUnflushed106.0815.619.691<0.000170%
DirectFlushed40.679.47.548<0.000142%
Filtered 100 mLUnflushed40.735.47.559<0.000190%
Filtered 200 mLUnflushed25.672.94.806<0.000188%
Filtered 1000 mLFlushed5.340.581n/a67%
n/a = Filtered 1000 mL was selected as the reference method. 1 Exp(B) is the exponential regression coefficient and represents the expected multiplicative effect on Legionella counts.
Table 3. Category level of Legionella concentration based on processing and collection method.
Processing MethodCollection MethodNon-DetectLow (<10 CFU/mL)Moderate (10–99 CFU/mL)High (≥100 CFU/mL)
DirectUnflushed73 (28%)0 (0%)124 (33%)43 (37%)
DirectFlushed139 (54%)0 (0%)82 (22%)19 (16%)
Filtered 100 mLUnflushed25 (10%)118 (26%)69 (18%)28 (24%)
Filtered 200 mLUnflushed11 (4%)140 (31%)62 (16%)27 (23%)
Filtered 1000 mLFlushed10 (4%)190 (43%)40 (11%)0 (0%)
Table 4. Omnibus test for model effects of sample holding time and sampling location.
Independent VariableWald Chi-SquareDegrees of Freedomp-Value
Sink114.66011<0.0001
Holding Time11.05530.011
Publisher’s Note: MDPI stays neutral with regard to jurisdictional claims in published maps and institutional affiliations.

