Article

Combined Use of Diagnostic Fumarate Addition Metabolites and Genes Provides Evidence for Anaerobic Hydrocarbon Biodegradation in Contaminated Groundwater

Department of Biological Sciences, University of Calgary, 2500 University Drive NW, Calgary, AB T2N 1N4, Canada
*
Author to whom correspondence should be addressed.
Microorganisms 2020, 8(10), 1532; https://doi.org/10.3390/microorganisms8101532
Submission received: 14 September 2020 / Revised: 28 September 2020 / Accepted: 28 September 2020 / Published: 6 October 2020

Abstract

:
The widespread use of hydrocarbon-based fuels has led to the contamination of many natural environments due to accidental spills or leaks. While anaerobic microorganisms indigenous to many fuel-contaminated groundwater sites can play a role in site remediation (e.g., monitored natural attenuation, MNA) via hydrocarbon biodegradation, multiple lines of evidence in support of such bioremediation are required. In this study, we investigated two fuel-contaminated groundwater sites for their potential to be managed by MNA. Microbial community composition, biogeochemical indicators, fumarate addition metabolites, and genes diagnostic of both alkane and alkyl-monoaromatic hydrocarbon activation were assessed. Fumarate addition metabolites and catabolic genes were detected for both classes of hydrocarbon biodegradation at both sites, providing strong evidence for in situ anaerobic hydrocarbon biodegradation. However, relevant metabolites and genes did not consistently co-occur within all groundwater samples. Using newly designed mixtures of quantitative polymerase chain reaction (qPCR) primers to target diverse assA and bssA genes, we measured assA gene abundances ranging from 105–108 copies/L, and bssA gene abundances ranging from 105–1010 copies/L at the sites. Overall, this study demonstrates the value of investigating fuel-contaminated sites using both metabolites and genes diagnostic of anaerobic hydrocarbon biodegradation for different classes of hydrocarbons to help assess field sites for management by MNA.

1. Introduction

The use of petroleum-based fuels to serve our global energy needs has resulted in the contamination of many pristine environments with hydrocarbons due to failing infrastructure or accidental spills. Hydrocarbons, compounds that are composed solely of carbon and hydrogen, are the primary components of refined fuel mixtures such as gasoline and diesel. Such mixtures are often stored in metal tanks either above-ground or underground which can corrode, potentially leaking hydrocarbons into the environment. Once introduced to groundwater, hydrocarbon contaminants can be carried away from the source due to groundwater flow and potentially enter drinking water sources, other bodies of water, or housing infrastructure. Exposure to these chemicals may lead to the development of chronic illnesses, such as nasal and renal cancers, leukemia, and lower quality of life [1,2].
Research within the last 3 decades has clearly demonstrated that microorganisms inhabiting anoxic environments such as deep subsurface petroliferous reservoirs and shallow groundwater aquifers can utilize hydrocarbons as their carbon and energy sources [3,4,5]. In the absence of oxygen that serves as both a terminal electron acceptor and a powerful oxidant, anaerobic microorganisms employ distinct mechanisms for overcoming the stability of hydrocarbons for use as carbon and energy sources [6]. For unsubstituted hydrocarbons, such as benzene, naphthalene, or phenanthrene, evidence is increasingly pointing to carboxylation as an important activation step [7,8,9,10], although the mechanism is not fully understood. Alkyl-substituted monoaromatic hydrocarbons (such as toluene, ethylbenzene, and xylene, [TEX]), alkyl-substituted polycyclic aromatic compounds (PAHs), and n-alkanes are activated by addition to fumarate [5,6], aside from a few exceptions [11]. This mechanism, commonly referred to as ‘fumarate addition’, is the most well-studied mechanism of hydrocarbon activation under anoxic conditions, and will be the focus of the work described here.
To date, three fumarate addition enzymes (FAEs) have been characterized to varying extents. Benzylsuccinate synthase (BSS) catalyzes the addition of fumarate to toluene [12,13] and potentially, closely related alkylated monoaromatic hydrocarbons such as o-, m-, and p-xylene and ethylbenzene [14,15]. Alkylsuccinate synthase (ASS, also known as 1-methylalkylsuccinate synthase, MAS) catalyzes the addition of the subterminal carbon of an alkane to the double bond of fumarate, forming an ‘alkylsuccinate’ [16,17]. Naphthylmethylsuccinate synthase (NMS) is the presumed paralog to BSS catalyzing fumarate addition to methyl-substituted PAHs [18]. These reactions, best understood for BSS and ASS, produce initial ‘succinate’ intermediates that are further metabolized by beta-oxidation-like reactions. Genes for catalytic subunits of these enzymes, denoted as bssA or assA (masD), have also been identified [14,16,17,19], and are known to be highly diverse across multiple environments and clades [19,20,21,22,23,24].
Many techniques can be used to determine whether a hydrocarbon-contaminated groundwater site is undergoing in situ bioremediation [25] and it is critical to use a combined approach to provide multiple lines of evidence in support of such natural attenuation [4,26]. Since being proposed as unique indicators of anaerobic hydrocarbon biodegradation in contaminated groundwater [27], fumarate addition metabolites have been detected at many fuel-impacted field sites [5]. As these metabolites have a specific relationship to their parent hydrocarbon and are not found in fuel mixtures, their detection in contaminated groundwater provides strong evidence that the associated microbial community members are capable of in situ anaerobic hydrocarbon biodegradation. However, the transient nature of these biodegradation pathway intermediates can make their detection difficult as they rarely accumulate to higher than nanomolar concentrations in situ [5,28]. As an alternate approach, polymerase chain reaction (PCR)-based assays targeting a dedicated gene that encodes a subunit of BSS (or more rarely, ASS) have also been applied to contaminated groundwater aquifers to indicate anaerobic hydrocarbon degradation potential via fumarate addition [19,29,30,31,32]. These assays only measure the potential for fumarate addition, as the presence of or quantity of a gene (e.g., number of copies per unit volume) does not denote its actual expression or the activity of the translated protein [4]. Two previous studies have sought both fumarate addition metabolites and associated genes as biomarkers to garner evidence for anaerobic hydrocarbon biodegradation in groundwater environments, focussing on the bssA gene [30,32]. Oka et al. [32] detected the bssA gene at one well location, while metabolites were detected in multiple wells at the contaminated groundwater site under study. Using two test lanes (distinct paths of groundwater flow) to examine the effects of ethanol (a gasoline oxygenate) on benzene, toluene, and o-xylene biodegradation (one lane injected with ethanol and BTX, one lane injected with BTX only), Beller et al. [30] detected bssA genes in all groundwater wells tested. However, fumarate addition metabolites were primarily detected only in the ethanol-supplemented lane, presumably because the presence of this labile substrate led to slower rates of hydrocarbon biodegradation and higher benzylsuccinate concentrations [30]. Both of these studies showed that interrogating contaminated sites for both known biodegradation genes and metabolites can help to overcome the limitations of using one approach alone in order to provide evidence in support of in situ hydrocarbon biodegradation.
In this study, we evaluated two hydrocarbon-contaminated groundwater sites for their potential to be managed by in situ bioremediation (e.g., by monitored natural attenuation, MNA) by investigating each site using multiple approaches that included measurements of fumarate addition metabolites and FAE genes. Metabolites and genes diagnostic of both anaerobic alkane and alkyl-monoaromatic hydrocarbon biodegradation were sought. As part of this study, we also designed new quantitative polymerase chain reaction (qPCR) primer mixtures for broad capture of both assA and bssA genes, and used these to quantify these biodegradation genes in groundwater samples. As the two sites examined were distinct in their levels of hydrocarbon concentrations (comparatively low and high), the study also provided the opportunity to assess whether there were any relationships between biodegradation gene abundances and hydrocarbon concentrations.

2. Materials and Methods

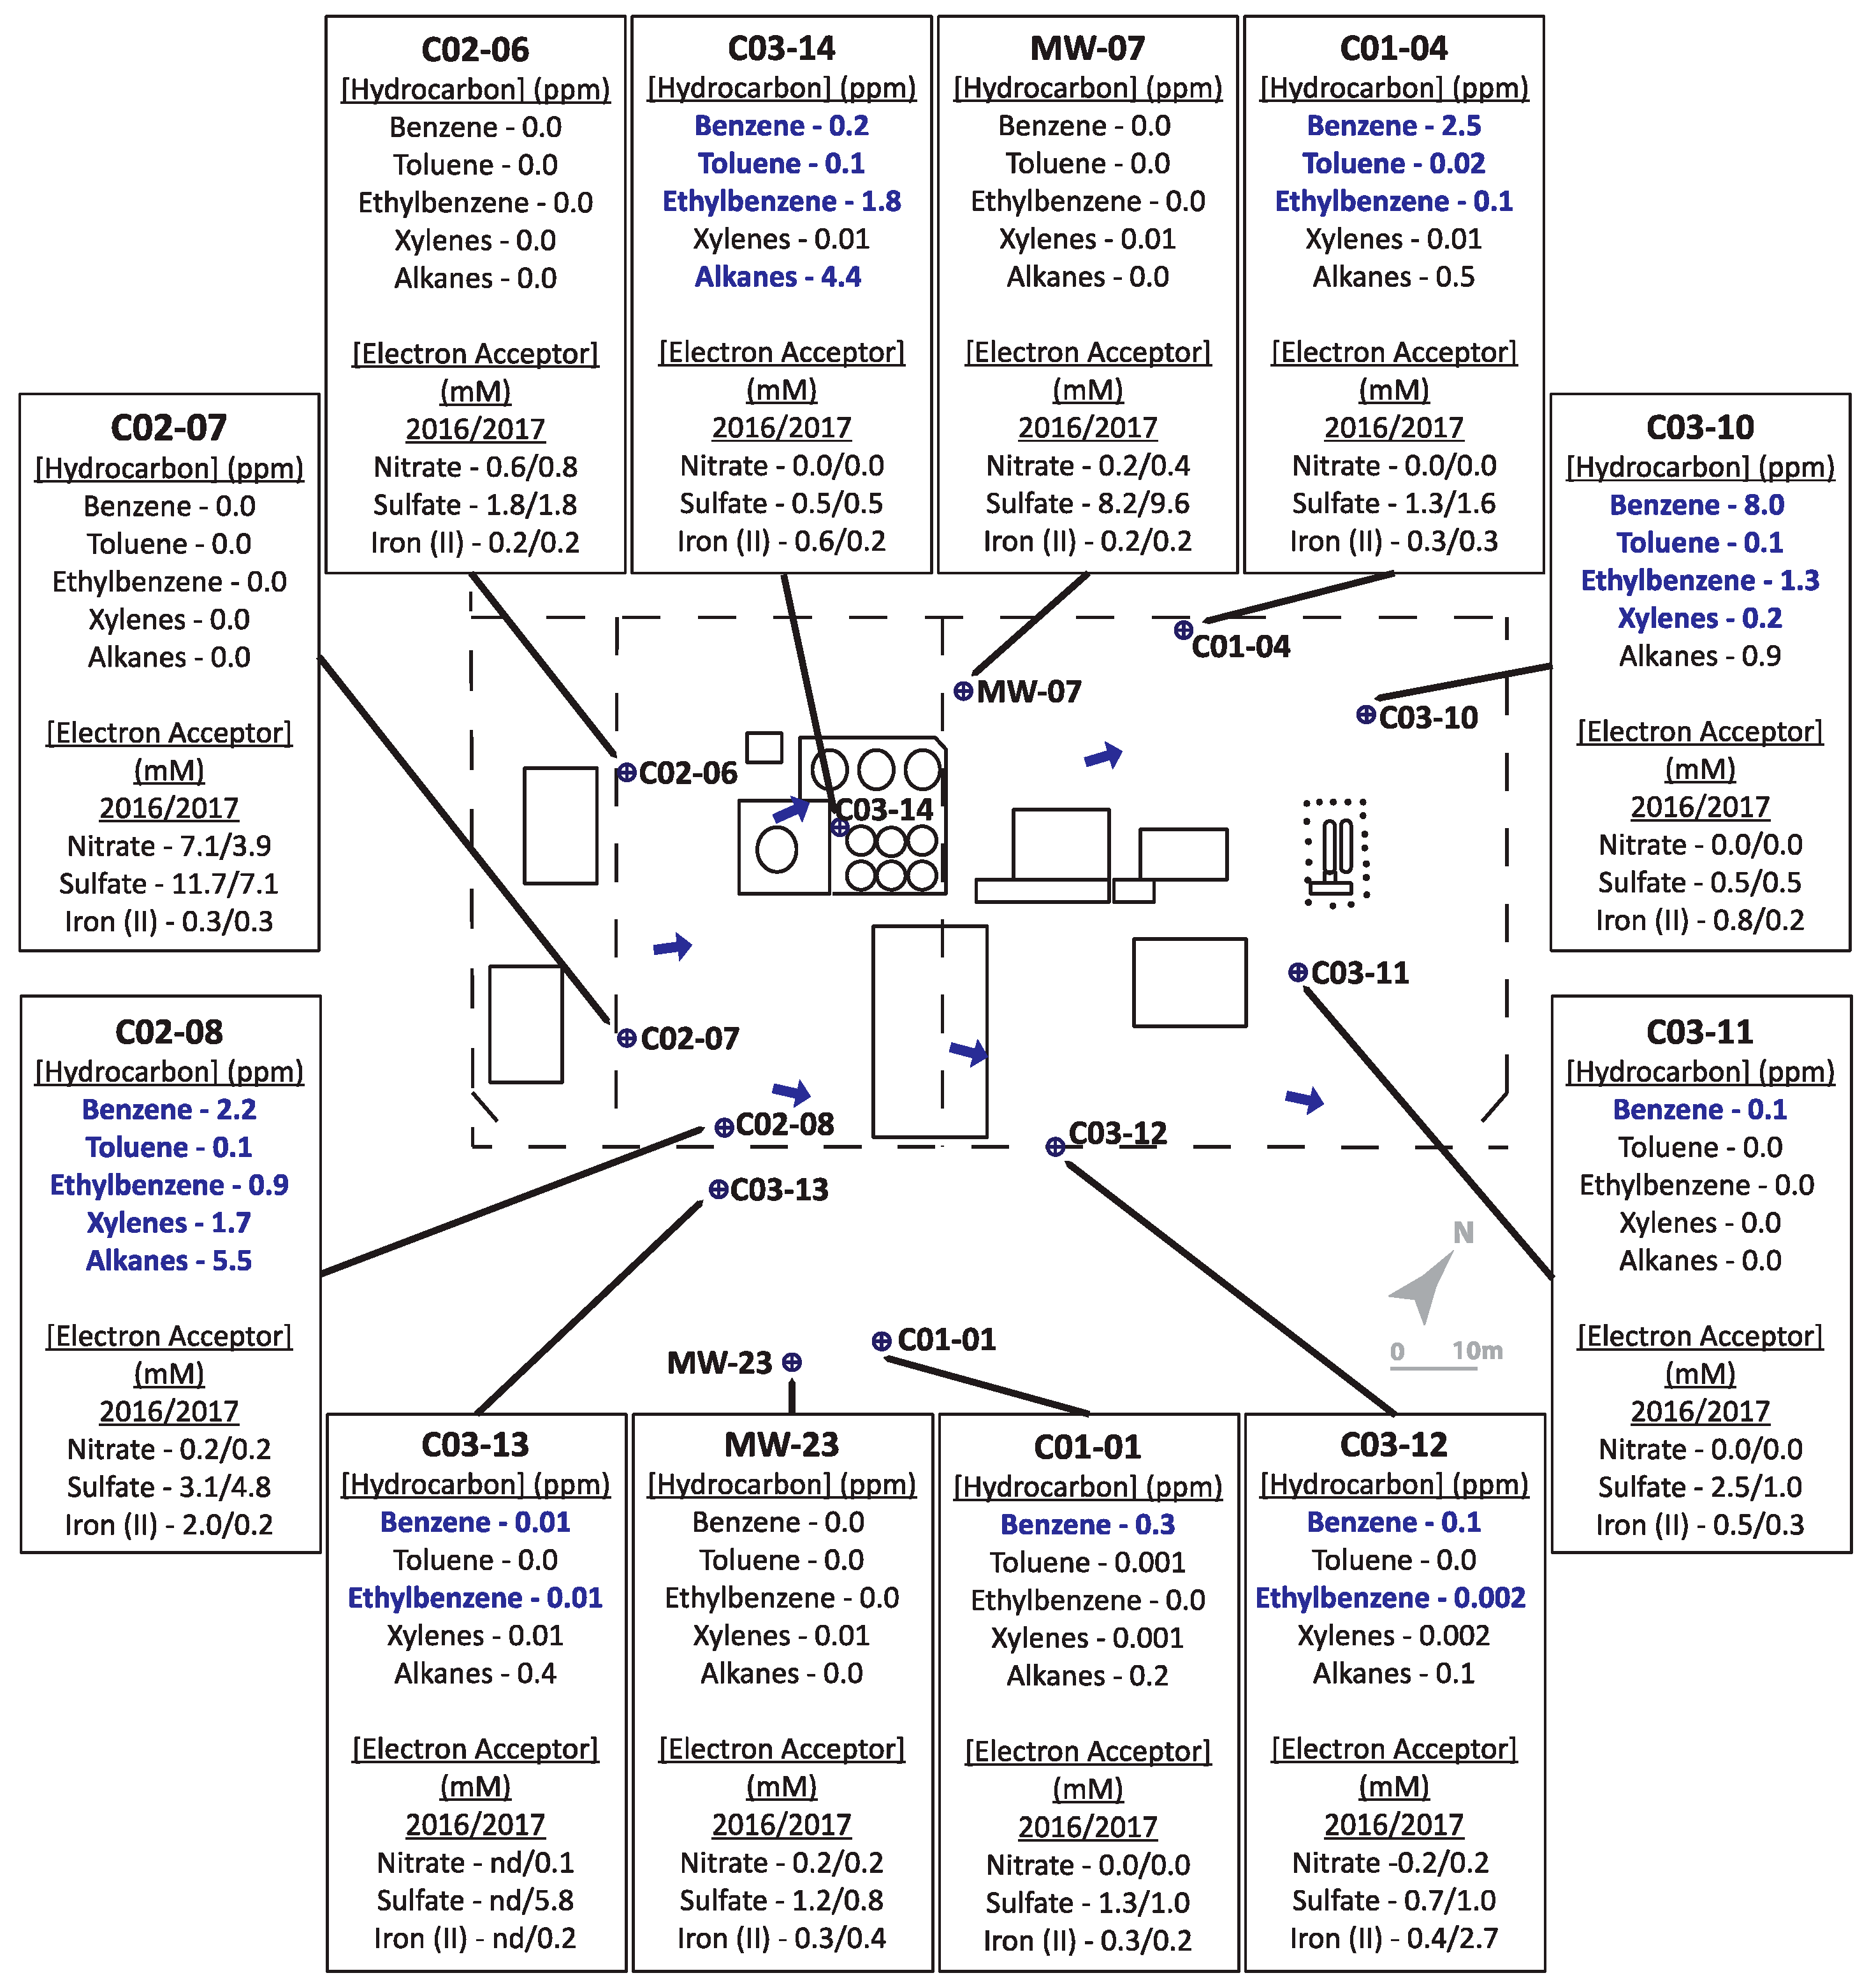
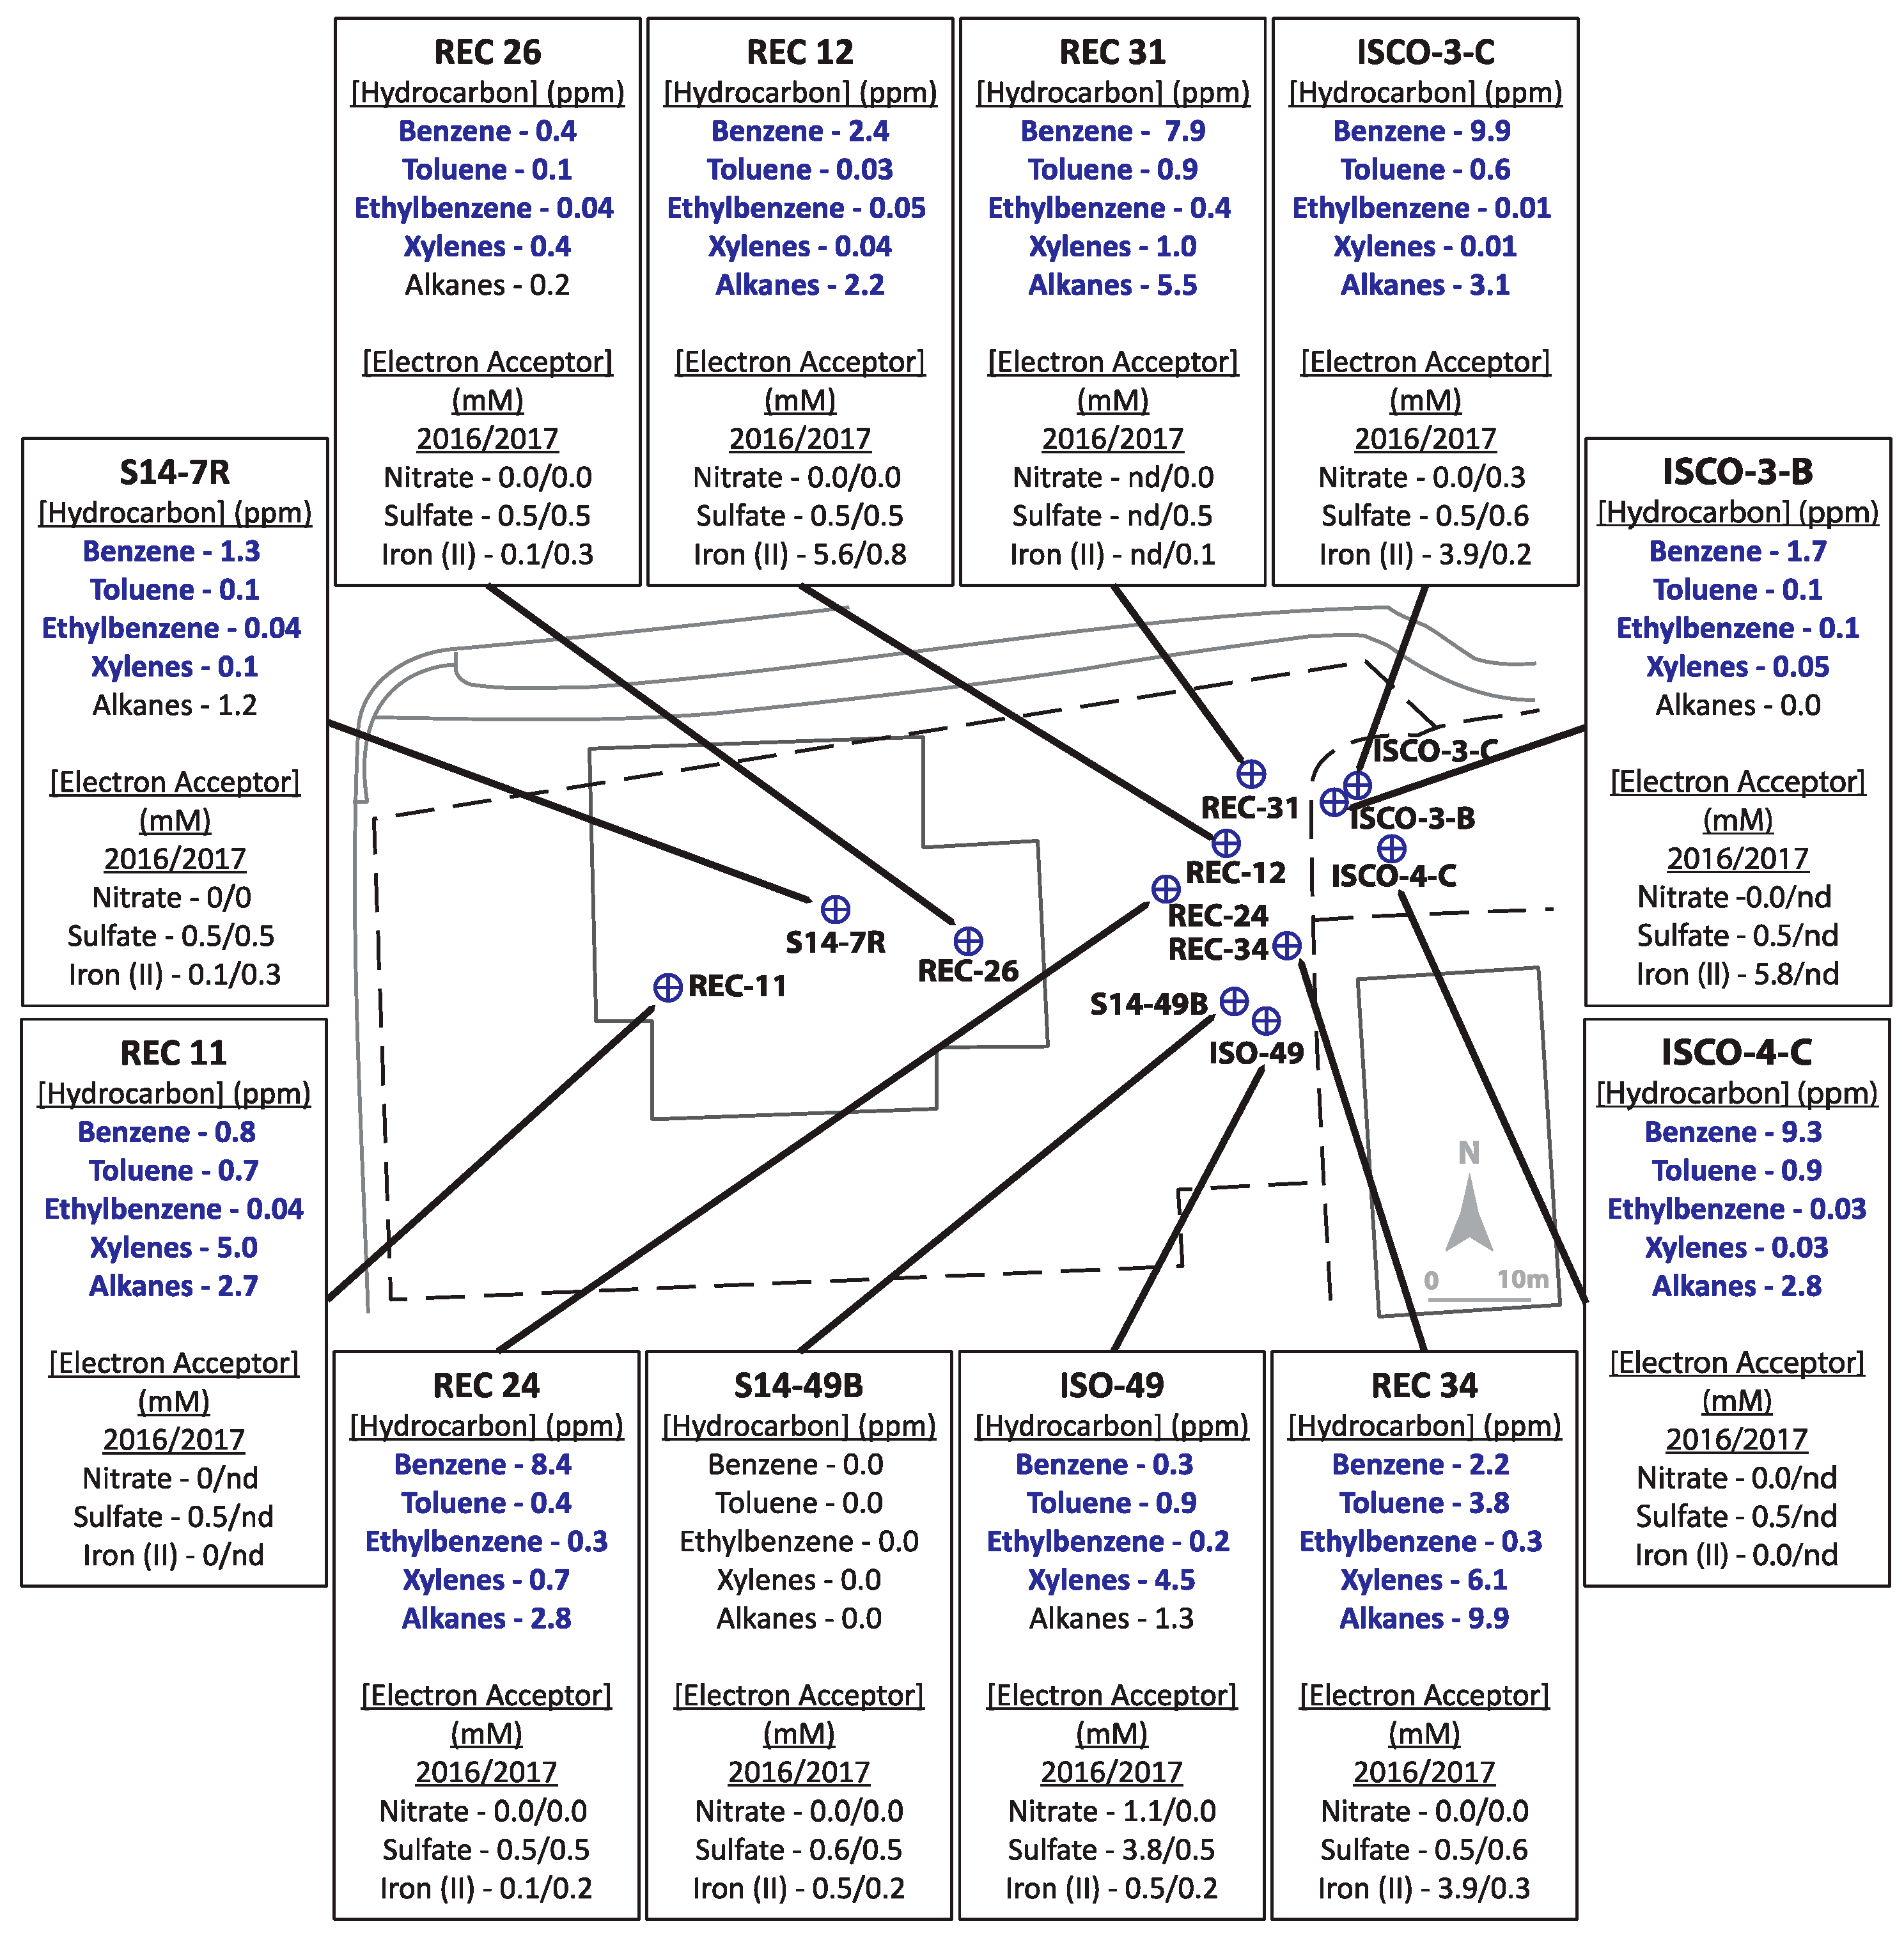
2.1. Site Descriptions

The two hydrocarbon-contaminated sites under study (designated Site A and Site B) are located in Alberta, Canada. Both field sites are former gasoline and diesel storage and dispensing stations that leaked these fuel mixtures into their underlying shallow groundwater aquifers. For Site A (Figure 1), a leak was initially discovered in the early 1990s in an above-ground fuel storage tank. The bulk fuel facility was decommissioned in 2003. Land farming and other in situ bioremediation efforts were undertaken at least 10 years prior to this investigation yielding inconclusive clean-up results due to limited sampling. The geology of Site A is considered predominantly clayey-silt, with groundwater levels averaging ~1.4 metres below ground surface (mBGS), underlain by bedrock at ~2 mBGS. Groundwater flow is generally towards the northeast (Figure 1). Site B (Figure 2) is primarily clay to silty-clay in composition, with groundwater levels ranging between 0.5–1.7 mBGS. Hydrocarbon releases occurred from above ground and underground storage tanks at different times, resulting in two hydrocarbon plumes and complex groundwater flow patterns, though groundwater flow was generally eastward (towards structures shown on right of the Figure 2 schematic). Numerous undisclosed remediation strategies had been used at Site B prior to the initiation of this study. Both sites were selected for study by industry partners as they were potential candidates for monitored natural attenuation or other bioremediation approaches but had not been microbiologically characterized. Twelve groundwater monitoring wells, that included both non-contaminated and hydrocarbon-contaminated locations, were selected from each site for the study based on prior monitoring efforts.

2.2. Sample Collection

Groundwater sampling was carried out by initially removing 6 L of groundwater to purge the wells. Two 1 L volumes of water sample from each groundwater well were then taken, completely filling 1 L glass bottles to minimize air ingress. One bottle contained 5 mL 6 M HCl such that the water sample became acidified to pH 2; this bottle was used for hydrocarbon metabolite analysis. The other bottle was left unchanged, and was used for hydrocarbon biodegradation gene analysis and microbial community profiling. A ‘trip blank’, composed of tap water (municipal drinking water), was included at sampling events to account for any background hydrocarbon contamination due to sampling vessels or equipment. All sample bottles were placed on ice and transported to the University of Calgary. Upon arrival, all sample bottles were kept at 4 °C until they were processed. Samples for hydrocarbon measurements were taken at the same time but in separate collection vessels, and concentrations were measured by a third party (AGAT Laboratories, Calgary, AB; conducted in 2016 only based on limited resources). Nitrate and sulfate concentrations were measured by ion chromatography [33], while Fe(II) levels were measured using the ferrozine assay [34].

2.3. Hydrocarbon Metabolite Analysis

Acidified groundwater samples were extracted and processed for hydrocarbon metabolite analysis as previously described [35]. Briefly, ethyl acetate was used as the organic solvent, and concentrated extracts were silylated using N,O-bis(trimethylsilyl)trifluoroacetamide. These prepared samples were analyzed by gas chromatography coupled with mass spectrometry (GC/MS) as per reported methods [35]. Qualitative identification of alkylsuccinates were identified based on characteristic MS fragmentation ion profiles [5,36]. Benzylsuccinate was identified based on GC retention time and mass spectral comparison to a commercially-available standard (Alfa Aesar, Tewksbury, MA, USA), while synthesized m-methylbenzylsuccinate and ethylbenzylsuccinate [36] were used to identify fumarate addition metabolites from xylenes and ethylbenzene, respectively.

2.4. Biomass Collection and DNA Extraction

Non-acidified samples were centrifuged at 10,000 rpm for 10 min using a Beckman Coulter Avanti J-E series centrifuge unit (Beckman Coulter, Brea, CA, USA). Collected pellets were re-suspended in approximately 10 mL of supernatant and stored at −80 °C. DNA from pellet biomass was extracted using the MP Bio FastDNA Extraction Kit for Soil (MP Biomedicals, Solon, OH, USA) as per the manufacturer’s instructions. Extracted gDNA was quantified using fluorometry (Qubit 2.0 fluorometer; sample volume 1 μL). Sample gDNA concentrations were not normalized to preserve possible less abundant taxa.

2.5. 16S rRNA Gene Analysis for Microbial Community Profiling

Microbial community analysis was done using the same DNA preparation procedure as described above. Microbial community composition was assessed using Illumina MiSeq sequencing of the V6-V8 hypervariable region, amplified using primers Illumina926f (TCGTCGGCAGCGTCAGATGTGTATAAGAGACAGAAACTYAAAKGAATTGRCGG) and Illumina1392r (GTCTCGTGGGCTCGGAGATGTGTATAAGAGACAGACGGGCGGTGTGTRC) [37]. Amplification was undertaken using the following protocol: first-round PCR reactions contained: 12.5 µL polymerase mastermix (Fermentas Taq (ThermoFisher Scientific, Waltham, MA, USA) or KAPA Hi-Fi (Roche, Basel, Switzerland), 0.5 µL each forward and reverse primer (200 nM), 1, 2, 5, or 10 µL of DNA template, with remaining volume of PCR-grade water up to 25 μL final volume. Second-round PCR reactions contained: 25 μL polymerase mastermix (Fermentas Taq or KAPA Hi-Fi), 1 μL each of forward and reverse primer (Illumina NexteraXT Indexes (Illumina, San Diego, CA, USA); 200 nM), 10 μL of purified first-round DNA amplicon, and 13 μL of PCR-grade water for a total reaction volume of 50 μL. Thermocycling conditions for both first- and second-round amplification were as described in Toth and Gieg [35], using either Fermantas Taq polymerase or KAPA Hi-Fi polymerase. Purifications of the first- and second-round PCR amplicons were undertaken using AMPure Magnetic beads or a Qiagen PCR Purification kit (AMPure: Beckman Coulter, Brea, CA; Qiagen, Hilden, Germany). Samples were then normalized to 2 ng/µL and pooled into a sequencing library. Samples were loaded onto the Illumina MiSeq sequencing platform (2 × 300) kit at the International Microbiome Centre (University of Calgary, Calgary, Alberta, Canada). The resulting sequencing reads were assembled using PEAR 0.9.6 (50 bp overlap, 350 bp truncation) and given taxonomic rank through MetaAmp Version 2.0 using the SILVA 132 database at a species 97% similarity cutoff [38,39]. Microbial community analyses were undertaken using a 2% relative read abundance cut-off. This was done to limit the amount of less abundant reads, ultimately simplifying the analysis to the most highly abundant taxa. 16S rRNA gene sequences have been deposited in the NCBI Short Read Archive (SRA) database with assigned accession numbers SAMN 15459469 to SAMN 15459510.

2.6. Qualitative and Quantitative Assays for assA and bssA Genes

Assaying field samples for the presence/absence of the assA and bssA genes (i.e., qualitative detection) through PCR was done using primer sets and thermocycling conditions as previously reported [19,20,22,40]. Primer sets used to interrogate all field samples were: assA = 7757af/8543r [22]; bssA = 7772f/8546r [19]. The protocol for the assay was as follows: 12.5 µL of KAPA Hi-Fi PCR MasterMix, 10.5 µL PCR-grade H2O, 0.5 µL each of forward and reverse primer (200 nM), and 1 µL of gDNA template. Confirmation of amplification was undertaken using gel electrophoresis (1% agarose) by comparing PCR products with the bssA or assA gene amplified from organisms known to harbour these genes (assA, Desulfospirillum alkenivorans AK-01 [16]; bssA, Thauera aromatica [12]) as positive controls. Amplicons were Sanger sequenced, and their identities were confirmed via BLASTn.
Quantification assays targeting the assA and bssA genes were performed using newly designed qPCR primer mixtures (Table 1). Details regarding primer design and validation/comparison against published primer sets are described in the Supplementary Materials. Primer mixtures used for assA gene quantification contained an equimolar mixture of forward primers assOri, assMsd, assEx, and assSml, with reverse primer 8543r, with an amplicon length of 486 bp (Table 1). Likewise, bssA gene quantification used a forward primer mixture containing an equimolar mixture of forward primers bssOil, bssMys, bssSuf, and bssWin, with reverse primer bssHitr, resulting in an amplicon length of 141 bp (Table 1). The qPCR protocol was as follows: 12.5 µL of KAPA Hi-Fi PCR MasterMix, 10.5 µL PCR-grade H2O, 0.5 µL each of forward and reverse primer mixtures (200 nM), and 1 µL of gDNA template. Quantification was conducted using a Bio-Rad CFX96 thermocycler, with analysis using the Bio-Rad CFXManager software, running a single threshold Cq evaluation. Thermocycling conditions for the assA qPCR assay were as follows: 95 °C for 3 min, 39 cycles of 95 °C for 15 s, 62 °C for 25 s (each cycle ending with a plate read), 62 °C for 2 min, followed by a melt curve (65 °C to 95 °C, increasing in 0.5 °C increments, held for 5 s, then plate read). The annealing temperature for bssA was adjusted to 65 °C otherwise following the same method. Amplicons used for generating standard curves were amplified using the 7772f/8546r primers [19] and gel extracted (Qiagen Gel Extraction Kit, Qiagen, Hilden, Germany) in preparation for use in a 7 log standard curve (1:10 serial dilution). Amplicon sequences were confirmed via Sanger sequencing. All qPCR amplicons were verified using the same gel electrophoresis method as described above for qualitative assA and bssA analysis, but instead using the assA and bssA qPCR primers. Those samples that did not have the appropriate length DNA bands were not included in subsequent analyses.

2.7. Illumina Sequencing of assA and bssA Amplicons

Those samples which matched the amplicon lengths of the standard curve amplicons using the newly designed primer mixtures were gel extracted (Qiagen Gel Extraction Kit). Primers containing the Illumina MiSeq adapter sequences (for addition of sequencing barcodes) were taken from 16S rRNA gene primers commonly used in our studies (926f/1392r) [37] and added to the 5′ end of each primer constituting the primer mix for both assA and bssA genes. MiSeq primer mix was prepared to the same concentration as the qPCR primer mix (20 μM). Thermocycling conditions were as described above for 16S amplification. Second-round PCR amplicons were gel purified the same way as in the first round. Samples were then normalized and pooled into a 2 ng/μL library. assA amplicons were submitted to the International Microbiome Centre (University of Calgary) for Illumina sequencing (via 2 × 300 bp sequencing kit). bssA amplicon sequencing was done at the University of Calgary Cumming School of Medicine Centre for Genomics and Informatics, using an Illumina MiSeq 150 × 2 kit.
Resulting sequences were assembled using PEAR 0.9.6 (50 bp overlap, 350 bp truncation) and analyzed through MetaAmp using the ‘non-16S’ option (which does not assign taxonomy) at 97% similarity [38,39]. Resulting sequences were analyzed through BLASTn [41]. Sequences matching assA annotated sequences or those in whole genomes of putative alkane-degrading microorganisms were selected, disregarding any sequence that returned matches with <70% coverage and identity. Sequences that passed this quality control step and thus selected for analysis were 6 of 86 for assA and 13 of 65 for bssA. Examples of remaining sequences that were neither present in the genomes of putative alkane-degrading microorganisms, nor annotated as alkylsuccinate synthase, are shown in Table S4. Selected sequences were then compiled into a Multiple Sequence Alignment (MSA) in UGENE software and aligned using ClustalW to determine similarity to other sequenced reads [42]. A maximum likelihood dendrogram was built using approximate likelihood ratio test (aLRT) tree branch support (to estimate correct placement of internal branches) and a combination of nearest neighbor interchanges (NNI) and sub-tree pruning and regrafting (SPR) tree building methods (for initial tree building when choosing which possible tree is the most likely result from given nucleotide data) [43,44]. assA and bssA amplicon sequences have been deposited in GenBank, with accession numbers MT722950 to MT722968.

3. Results

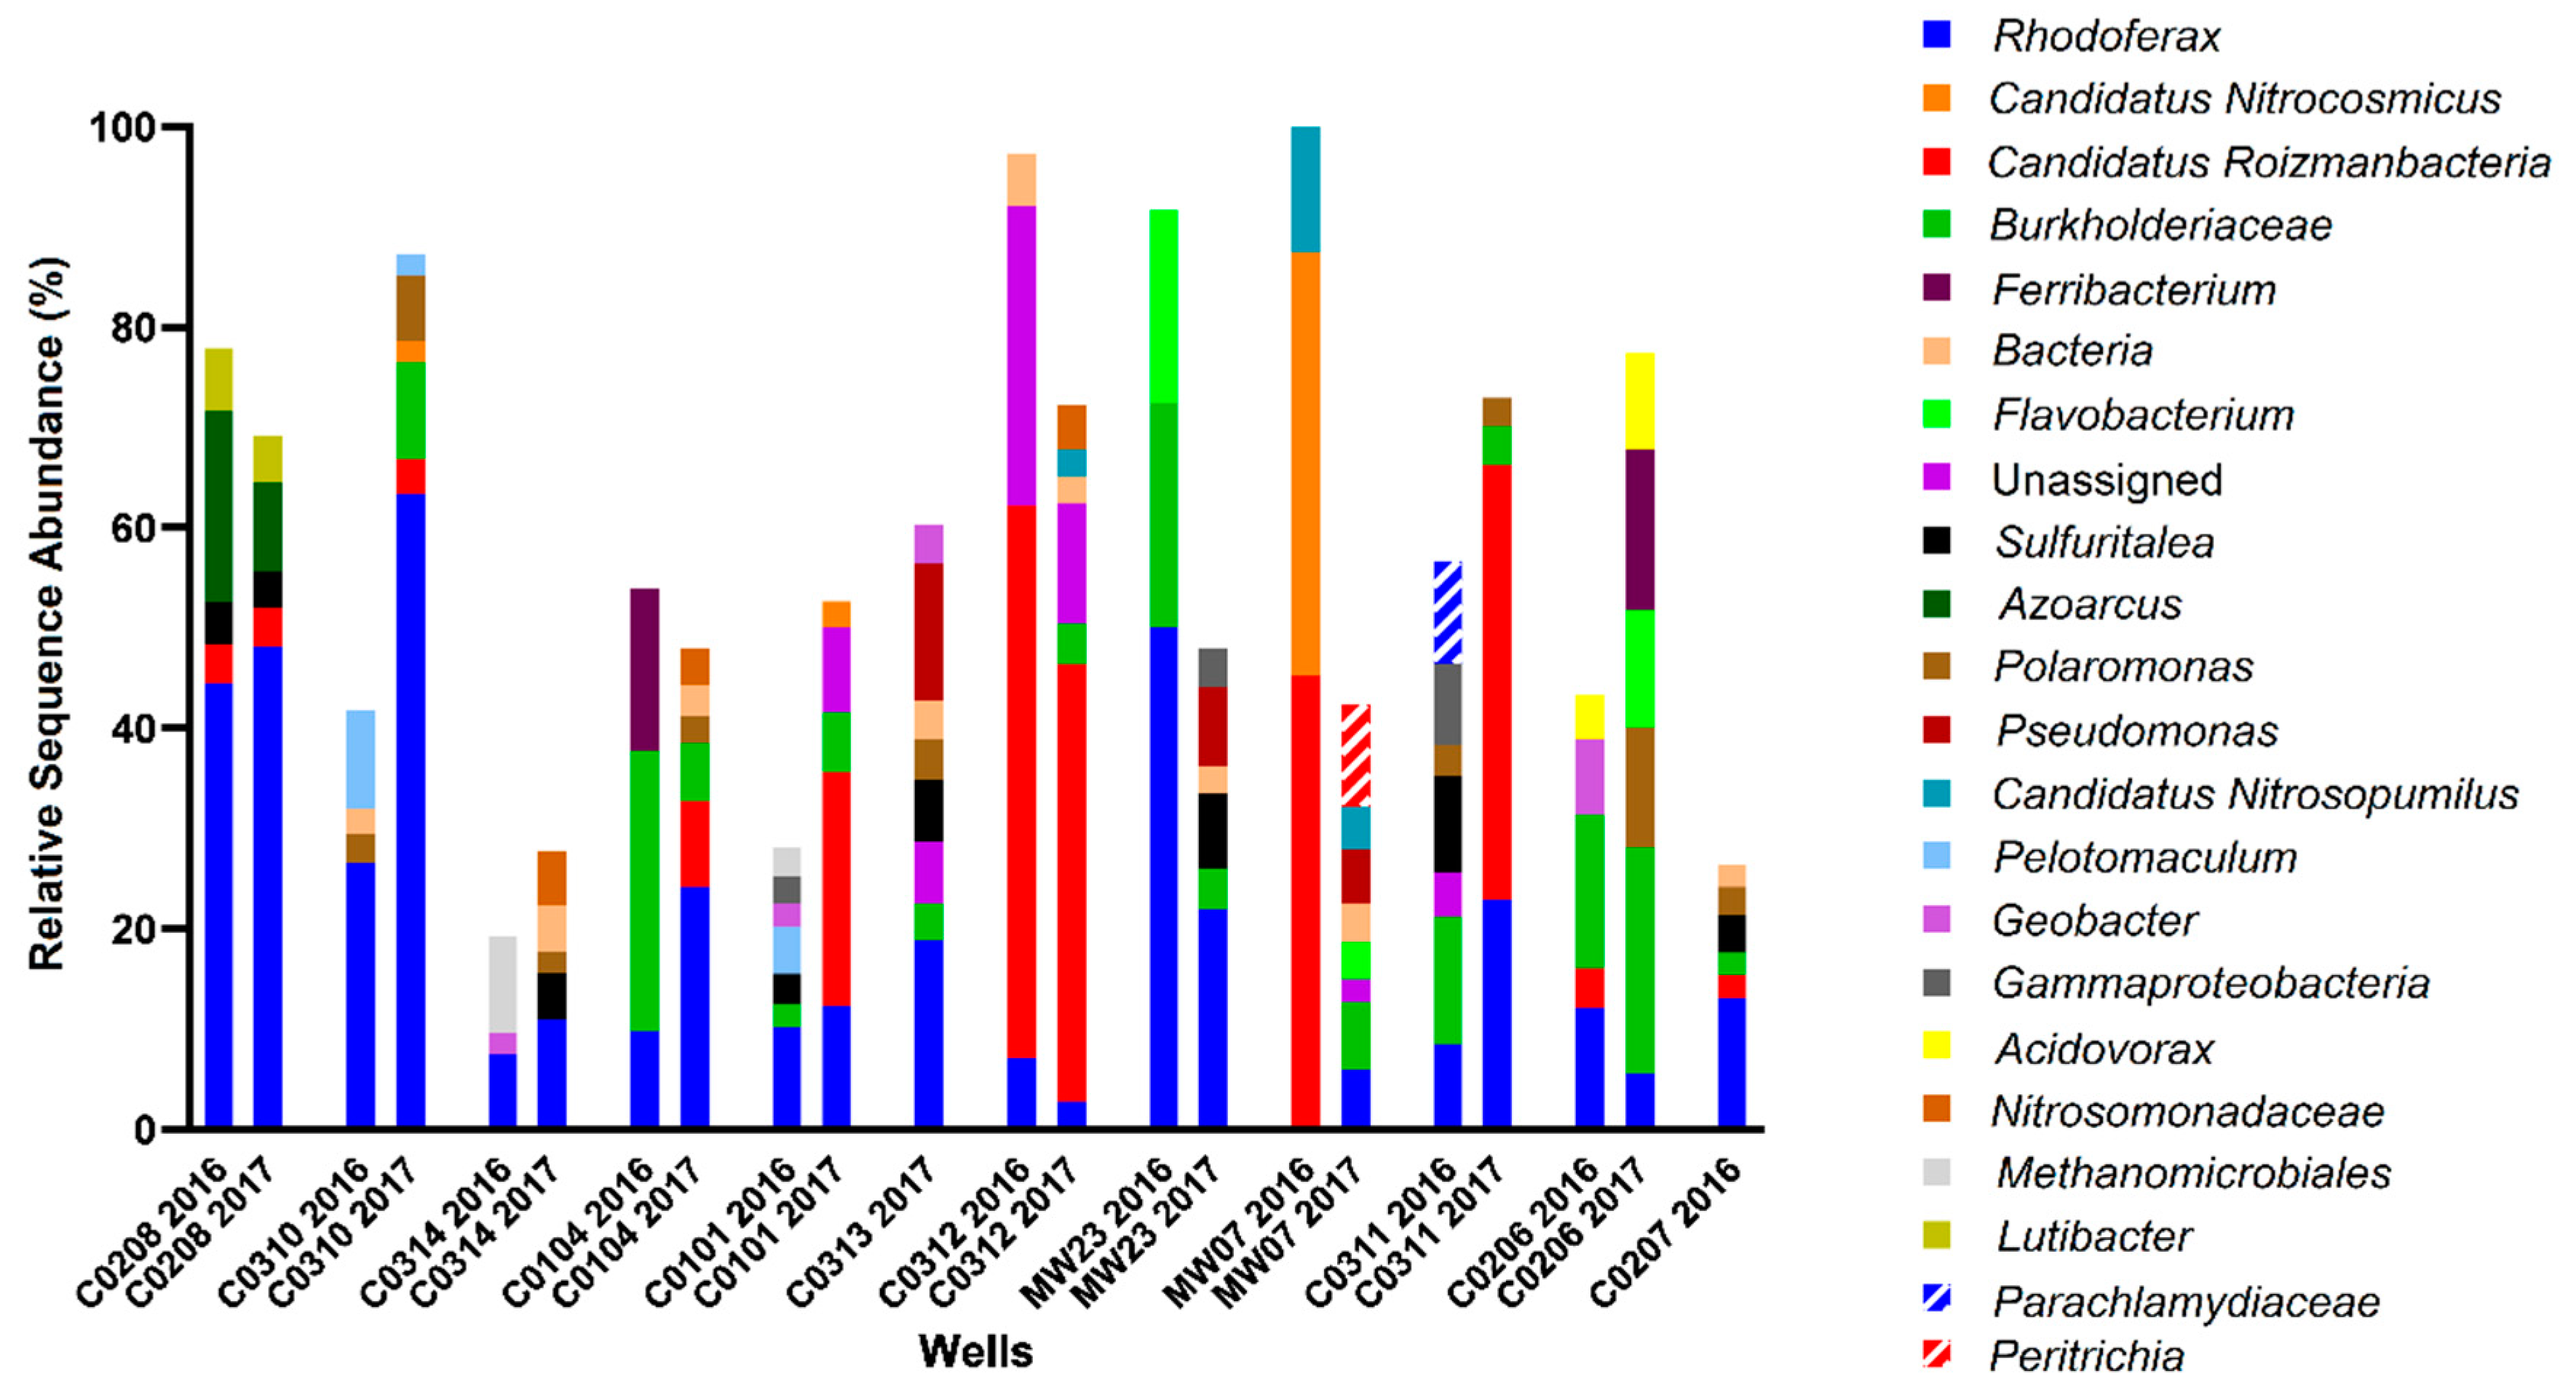
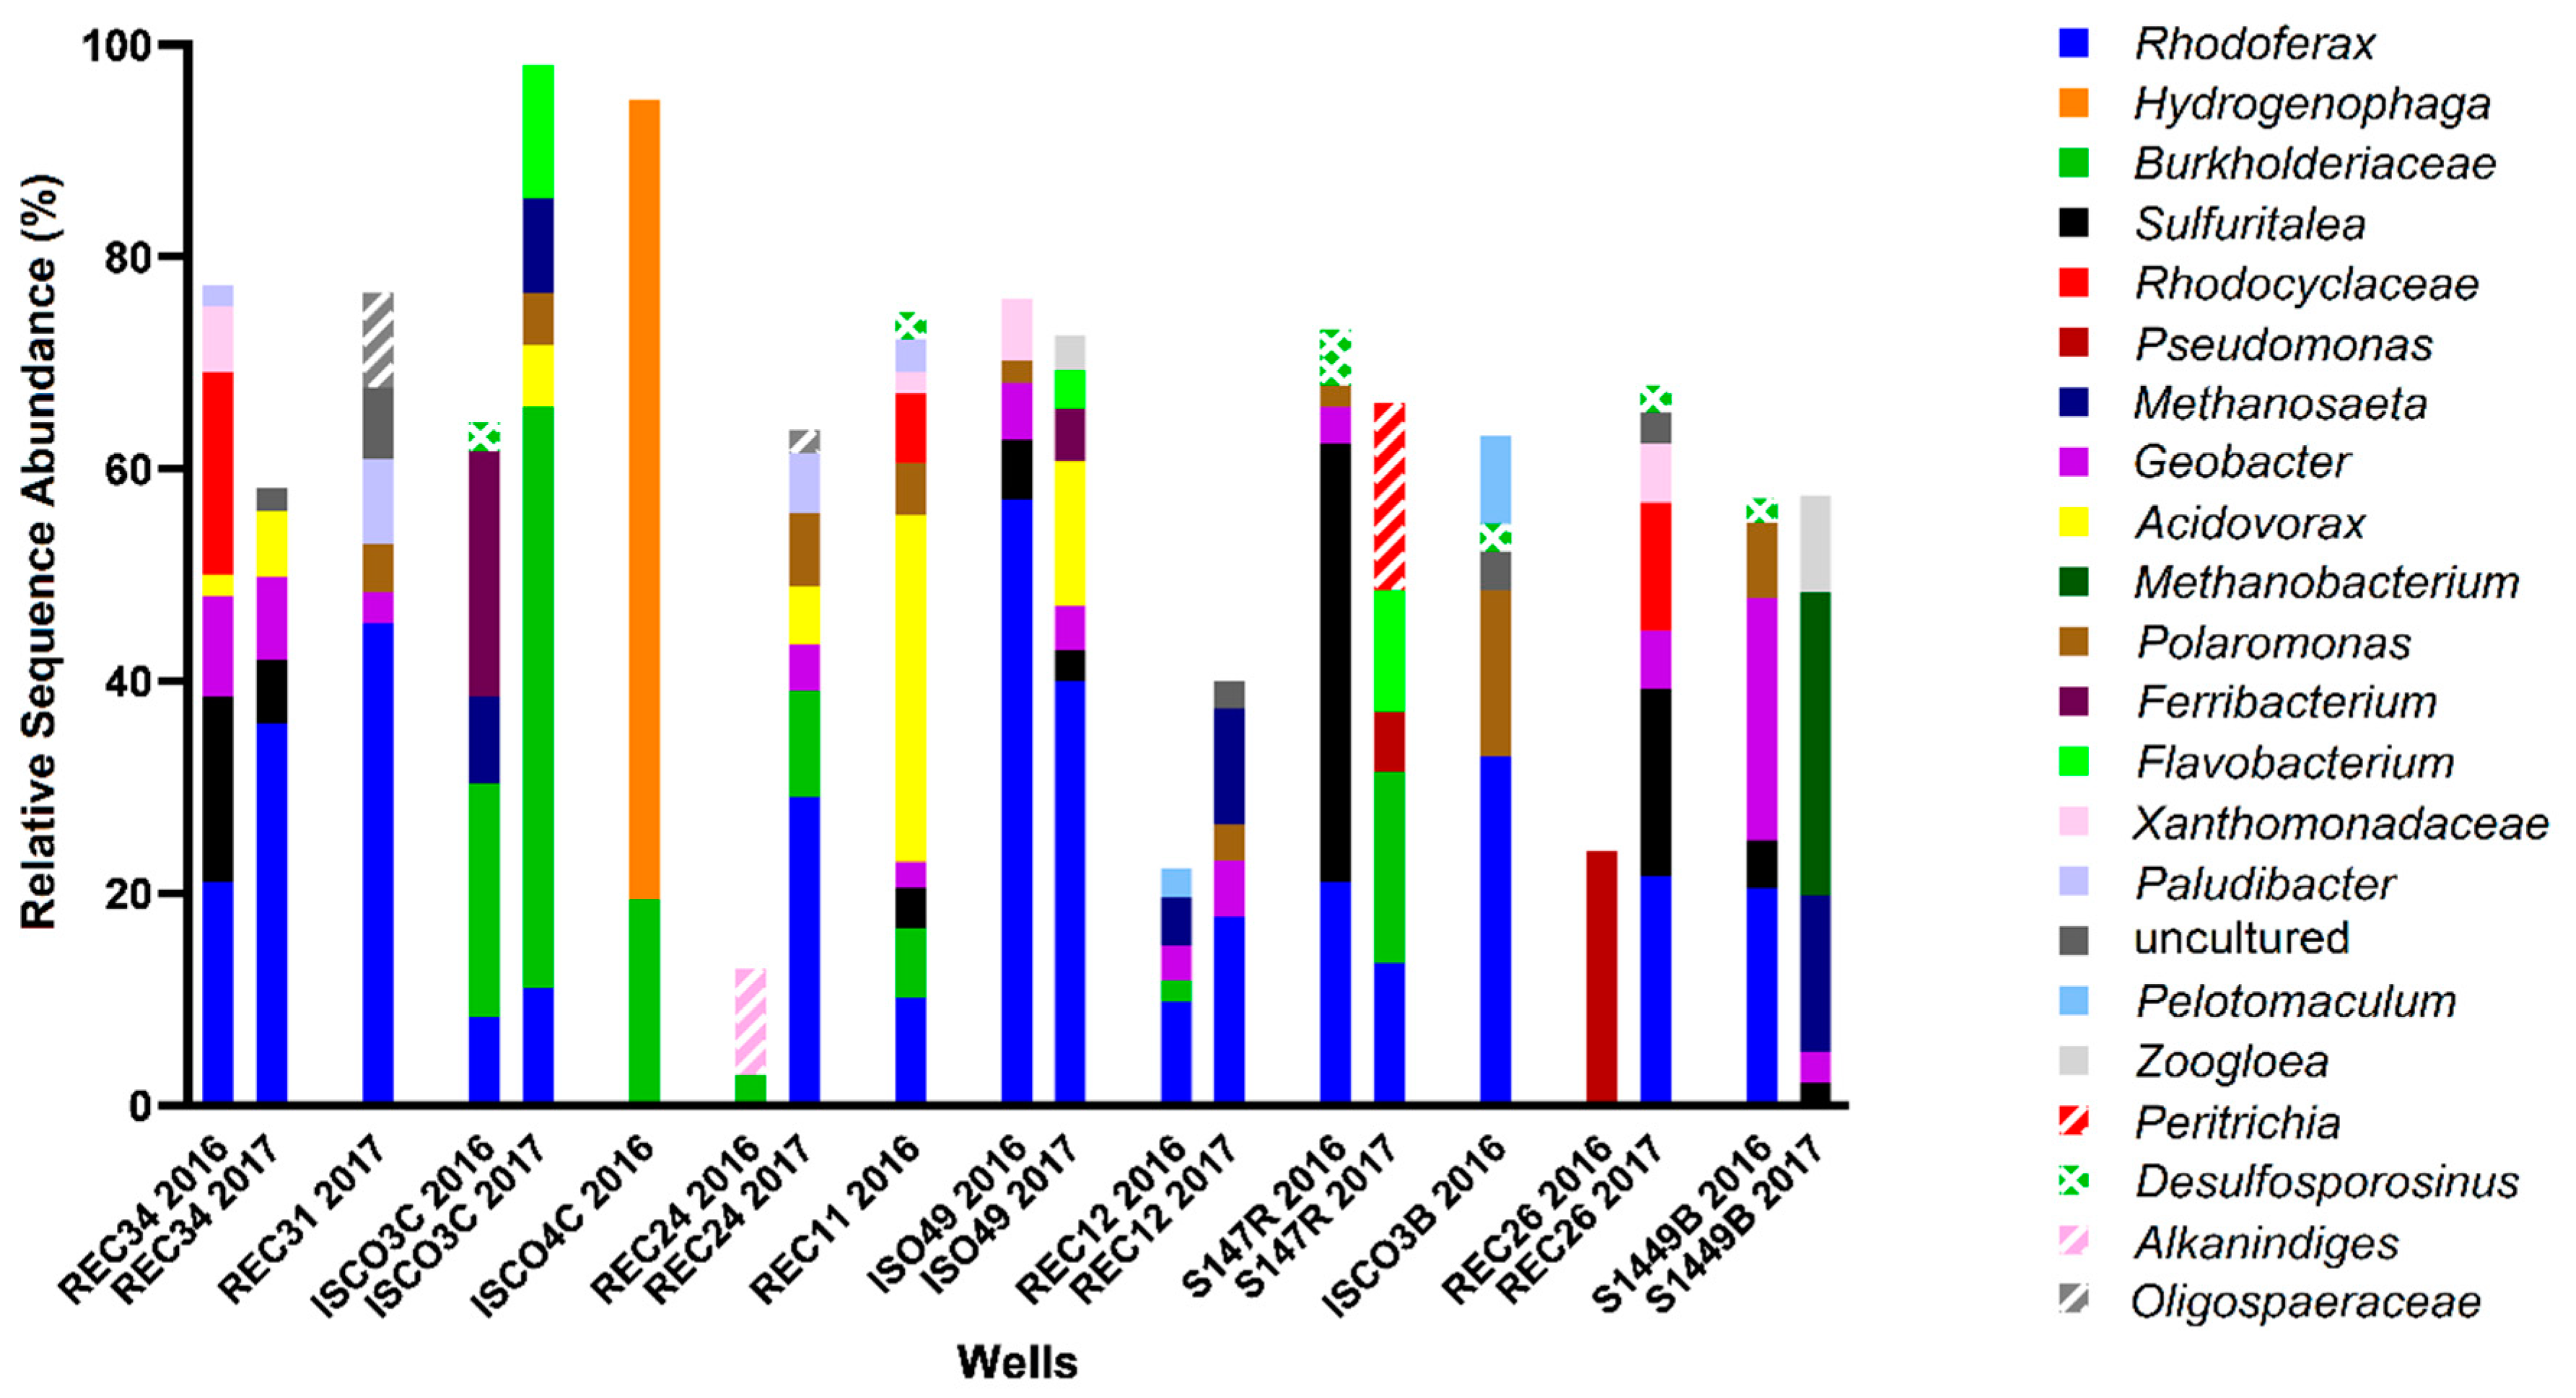
3.1. Hydrocarbons, Putative Electron Acceptors, and Microbial Community Profiles

Several sampled wells collected from both sites A (Figure 1) and B (Figure 2) were characterized by BTEX (benzene, toluene, ethylbenzene, and xylenes (all isomers)) and alkane concentrations above the Alberta guidelines for allowable concentrations in non-drinking groundwater (benzene = 0.005 ppm (mg/L); toluene = 0.024 ppm; ethylbenzene = 0.0016 ppm; xylenes (all isomers) = 0.02 ppm; alkanes = 2.2 ppm; [45]; see Table S1 in Supplementary Materials for tabulated hydrocarbon concentrations measured at both sites). Overall, Site A (Figure 1) groundwater samples were characterized by substantially lower hydrocarbon concentrations than Site B (Figure 2).
For Site A, hydrocarbon concentrations measured in the monitored wells in 2016 ranged between 0–8 ppm. Four of the 12 wells, located on the periphery of the site (MW-07, C02-06, C02-07, MW-23) were considered non-contaminated, as no hydrocarbons were detected above analytical limits. Well C03-10 contained the highest total BTEX concentration, while Wells C02-08 and C03-14 had the highest alkane concentrations. The remaining contaminated sampled wells contained comparatively lower, but detectable, hydrocarbon concentrations. In terms of the potential electron acceptors that were measured, one uncontaminated well contained substantial levels of nitrate (4–7 mM; well C02-07) while nitrate was comparatively low in all other contaminated wells and low or non-contaminated wells. Sulfate concentrations ranged from 5–12 mM in two of the non-contaminated wells (C02-07 and MW-07) but were lower (1–2 mM) in other non-contaminated wells (C02-06 and MW-23), suggesting that sulfate could serve as a potential electron acceptor in some locations at the site. Fe(II), the product of microbial Fe(III) reduction, was measured at less than 1 mM in most sampled wells except at two locations: C02-08 with comparatively high hydrocarbon concentrations, and C03-12 with comparatively low hydrocarbon concentrations. While the biogeochemical measurements suggested that nitrate, sulfate, or iron reduction could be electron acceptors in different portions of the site, it was difficult to discern clear trends or patterns that relate hydrocarbon concentrations with anaerobic electron accepting processes across the site. This heterogeneity was further exemplified by the microbial community profiling results, where microbial community compositions were different in each well sampled (Figure 3). While some groundwater samples showed similar taxonomic profiles in 2016 and 2017 (such as C02-08 and C03-12), most had very different taxonomic profiles across the two years. The most consistently detected taxon in all samples collected from Site A in 2016 and 2017 was Rhodoferax, present in all wells in the range of 3–44% (in 2016) and 5–62% (in 2017) relative sequence abundance. Members of this genus are known to have nitrate- and iron-reducing abilities, aligning with some of the terminal electron acceptor data. Many of the taxa present in some of the contaminated well samples affiliate with known hydrocarbon degraders, such as Azoarcus, Geobacter, Polaromonas, and some members of the Burkholderiaceae and Rhodocyclaceae families. Although sulfate was present as a putative electron acceptor in some groundwater samples, sulfate-reducing microorganisms were not prevalent at >2% relative abundance.
Site B was more highly contaminated site than Site A, with maximum total hydrocarbon concentrations reaching ~35 ppm (REC 34) with 7 wells above 10 ppm (ISCO-3-C, ISCO-4-C, ISO49, REC 11, REC 24, REC 31, and REC 34) (Figure 2, Table S1). Of the 12 wells sampled at Site B, only well S14-49B was non-contaminated, with all measured hydrocarbons below detection levels. The groundwater in all other wells surpassed the 0.005 ppm benzene guideline, the 0.024 ppm toluene guideline, the 0.0016 ppm ethylbenzene guideline, and the 0.02 ppm xylenes guideline (except for well ISCO-3-C at 0.01 ppm xylenes). In 2016, all wells except ISCO-3-B and REC 26 were above the 2.2 ppm alkane guideline. Nitrate and sulfate concentrations for almost all samples collected from in Site B were at or below 0.5 mM, aside from one well (ISO-49 in 2016). Four contaminated wells (REC12, ISCO-3-C, ISCO-3-B, and REC34) had elevated Fe(II) concentrations (4–6 mM), suggesting that iron-reducing microorganisms may be present at the site. The single non-contaminated groundwater well (S14-49B) did not show substantial concentrations of measured electron acceptors. The microbial community profiles of Site B samples collected in 2016 and 2017 are shown in Figure 4. Similar to Site A, Rhodoferax was present in most groundwater samples analyzed, and the microbial community profiles were different in each well sampled (Figure 4). Several taxa detected in the contaminated wells are known to have members capable of hydrocarbon biodegradation, such as Burkholderiaceae, Xanthomonadaceae, Polaromonas, Geobacter, Acidovorax, and Desulfosporosinus. Distinct from Site A, some methanogens were detected in Site B samples, including Methanosaeta and Methanobacterium; these taxa were most abundant in the single non-contaminated groundwater sample at Site B, S14-49B, aligning with the low levels of other potential electron acceptors (Figure 2 and Figure 4). As with Site A, no clear trends in hydrocarbon concentrations, potential electron acceptors, and taxonomic profiles could be discerned for Site B based on these measured parameters.

3.2. Fumarate Addition Metabolites and Biodegradation Genes

While microbial community profiling results and biogeochemical measurements revealed the presence of some putative hydrocarbon degraders and anaerobic electron acceptors at Sites A and B, heterogeneity at these sites precluded definitive evidence supporting in situ anaerobic hydrocarbon biodegradation. Therefore, additional evidence was sought based on diagnostic fumarate metabolites and genes across each site.

3.2.1. Alkylsuccinates and assA Genes

Table 2 overviews the detection of alkylsuccinates and the assA gene at sampled locations across both Sites A and B. Measured alkane concentrations in each well are also indicated on Table 2. Alkylsuccinates that originated from the anaerobic biodegradation of C5 to C9 alkanes were detected at Site A, generally correlating with the qualitative detection of the assA gene (Table 2). One exception was for well C01-01, where the assA gene was not detected in the 2017 samples despite the detection of alkylsuccinates. In all sampled wells, alkylsuccinates were detected when the C6-C10 alkane concentrations were 0.1 ppm or greater. While neither the assA gene nor alkylsuccinates were detected in the majority of the non-contaminated wells (wherein alkanes were below the detection limit of <0.1 ppm), two anomalies were observed (Table 2). Two alkylsuccinates were detected in non-contaminated well C03-11 in both 2016 and 2017, although no assA genes could be qualitatively detected; for this well, it is possible that groundwater flow transported alkylsuccinates produced elsewhere in aquifer into the vicinity of the groundwater well. The assA gene was detected in well C02-07 in the 2016 sampling event, although corresponding metabolites were not found.
At Site B, fumarate addition metabolites derived from alkanes were detected in 10 of the 12 wells sampled (Table 2). The alkylsuccinates identified were primarily derived from C5 to C7 linear or cyclic alkanes. As with the results from Site A, a co-occurrence of alkylsuccinates and the assA gene (as determined qualitatively) was observed for the majority of the sample wells at Site B, with a few exceptions. Some groundwater samples revealed the presence of the assA gene, but not the corresponding alkylsuccinates (ISO-49 in 2016, REC 12 in 2017, REC 26 in 2016 and 2017). Alkylsuccinates nor the assA gene could be qualitatively detected at the lone non-contaminated well sampled at Site B, well S14-49B (Table 2). Despite the lack of universal co-occurrence of alkylsuccinates and the assA gene, the results on balance offer strong evidence that the microbial communities indigenous to the groundwater at both Sites A and B are capable of in situ anaerobic alkane biodegradation.
In addition to the presence/absence analysis of the assA gene based on PCR, we also quantified assA gene abundances using a mixture of newly designed qPCR primers (Figure 5, Table 2). Using these qPCR primers, the assA gene (verified by Sanger sequencing) was detected in 9 of the 12 wells at Site A (Figure 5A). At Site A, qPCR analyses showed that assA gene abundances increased from log 5–6 copies/L in non-contaminated groundwater wells to log 7–8 copies/L in wells with measurable alkane concentrations. Quantification of the assA gene showed that the highest alkane-contaminated wells, C02-08 (5.5 ppm total alkanes) and C03-14 (4.4 ppm total alkanes) had assA abundances of 107copies/L and 108 copies/L, respectively. The qPCR primer mixture revealed between 105 and 106 copies/L in three of the five wells with non-detectable alkane concentrations (wells C02-07, C03-11, and MW-07). In general, increased abundances of the assA gene positively correlated with increased alkane concentrations at Site A (Figure 5A).
Quantification of the assA gene in Site B samples showed a range of almost 4 orders of magnitude difference across the site (Figure 5B). Well S14-49B, the sole uncontaminated well, harboured 106 copies/L of the assA gene, the lowest abundance measured at Site B. Of the 16 wells (both years) from which assA could be quantified, nine harboured 107 copies/L, spanning alkane concentrations from approximately 2 ppm (REC 12) to 10 ppm (REC 34, 2016 sample only) (Figure 5B). However, the highest assA gene abundance of 109 copies/L was found in well REC 26, where only 0.2 ppm alkanes were measured. In contrast, REC 34, the groundwater well having the highest measured alkane concentration of all the sampled wells (~10 ppm), had 106 and 107 assA gene copies/L, differing in an order of magnitude between sampling years (Figure 5B). The majority of the wells sampled at Site B harboured between 5 × 10⁶ and 108 assA gene copies/L, with only a single well harbouring 109 copies/L. At Site B, the assA gene abundance appears to increase with increasing alkane concentrations up to a limit of approximately 5 ppm alkanes; after this concentration, this trend is no longer seen. Additional samples with >5 ppm alkanes would be needed to verify this observation (Figure 5B).

3.2.2. Benzylsuccinates and bssA Genes

Table 3 summarizes the fumarate addition metabolites and bssA genes detected from Sites A and B. The frequency of benzylsuccinate (or an alkylated analog) detection in all sampled wells was comparatively lower than for alkylsuccinates for both sites (Table 2). For site A, methylbenzylsuccinates were detected only in the two most highly contaminated wells (C02-08 and C03-14). For well C02-08, the metabolites and bssA gene (qualitative detection) co-occurred, while this was only the case in 2017 from well C03-14 (Table 2). Fumarate addition metabolites derived from alkylbenzenes were not detected in any other samples from this site, although bssA was present almost universally, including in the samples wherein alkylbenzenes were below detection.
A similar lack of alkyl aromatic metabolite detection was seen for Site B groundwater samples (Table 3). While a co-occurrence of benzylsuccinates and the bssA gene was evident in three samples (REC 34, ISO-49 in 2016, S14-7R in both years), this was not the case for the majority of the samples. Furthermore, for two contaminated groundwater samples at Site B (REC 31 and ISCO-04-C), neither a fumarate addition metabolite nor the bssA gene were detected using a qualitative approach (Table 3).
Figure 5C shows the quantification of the bssA gene plotted against TEX concentrations in Site A. False positives (those with non-specific amplicons) and zero value quantifications were not plotted. Only 4 wells had quantifiable bssA with the qPCR primers used. Wells C03-12 and C03-10 revealed the most abundant bssA per litre groundwater (C03-12 2016 = 1010 copies/L, 2017 = 109 copies/L; C03-10 2016 and 2017 = 109 copies/L). With this limited data, there was no correlation between TEX concentration and bssA gene copies, as wells C03-12 and C03-10 harboured a similar bssA gene abundance, despite a 10-fold difference in TEX concentrations (Figure 5C, Table 3).
Quantification of the bssA gene in Site B samples plotted against TEX concentration shows that the minimum abundance of bssA, regardless of TEX concentration, was approximately 1 × 10⁶ copies/L (Figure 5D). Only one well, S14-7R, had tested positive in both 2016 and 2017, which saw a 138-fold increase in bssA copies/L from 2016 to 2017. As with Site A, there did not appear to be any correlation between TEX concentrations and quantities of the bssA gene; wells with similar TEX concentrations exhibited at least 2 orders of magnitude difference in bssA abundance. Overall, the quantification of the bssA gene in the two field sites suggests that bssA gene abundances are independent of aromatic hydrocarbon concentrations using the designed qPCR primers.

3.3. assA and bssA Amplicon Sequencing Results

Figure 6 shows the relationship of sequenced assA and bssA amplicons present in the site groundwaters following amplification of these genes with the newly designed qPCR primers. After read preparation and quality control of amplicons, a BLASTn search of 86 sequences returned 6 that matched NCBI entries annotated as assA with >70% identity and coverage. Clustering of the various sequences shows that 2 main clusters of assA sequences were present in these samples, all within the deltaproteobacteria; those that affiliated with sulfate-reducers (such as Desulfatibacillum alkenivorans, and Desulfatibacillum aliphaticivorans) and those affiliating with methanogenic/syntrophic cultures (with Smithella sp.) or oilfield-derived clones [19,22,46,47]. Some BLASTn results affiliated with the assA genes of the organisms from which the primers were designed. For example, primer ‘assOri’ was designed from D. alkenivorans, and primer ‘assSml’ was designed to capture Smithella SCADC sequences; sequences closely related to the assA genes from these taxa were found (Figure 6). The other primers in the primer mix, ‘assMsd’ and ‘assEx’ were designed from an annotated masD sequence and Desulfoglaeba alkenexedens, respectively. An assA sequence similar to that of D. alkenexedens was detected in these samples. It is likely that the directed design of the primers in the primer mix influenced the types of assA sequences that resulted from the analysis. Many of the BLASTn matches were not annotated as assA yet had coverage and identity above 70%. These were instead annotated to be involved in protein catabolism, ribosomes, or other metabolic functions (Table S4). Many of the organisms harbouring the sequence mismatches are known as aerobic/microaerophilic and are present in hydrocarbon-contaminated sites such as Variovorax (aerobic, aromatics), Polaromonas (aerobic, aromatics), Azoarcus (facultative, aromatic and alkane), Massilia (aerobic, PAH), and others [48,49,50,51]. This suggests that either the assA gene is present in these genomes but is currently uncharacterized, or non-specific binding is amplifying non-assA genes from these organisms, or many sequences annotated in silico may not be annotated as FAE genes. Notably, this non-specific binding explanation has an additional consequence of inflating gene abundances in quantification assays, which we cannot rule out here. Previous groups have not used next-generation sequencing platforms for their assA or bssA identifications, and thus such non-specific binding has not been reported [19,20,22,23,40]. Future work that comprehensively examines the possible explanations for sequence mismatches (that includes additional sequences retrieved from other sites) is warranted.
For the bssA gene, a BLASTn search yielded 13 OTUs (operational taxonomic units) with matches to bssA sequences from 65 quality assessed sequences. A maximum likelihood analysis shows that 2 main clusters of bssA formed, one clustering within the Clostridia, and the other clustering within the Alphaproteobacteria and Betaproteobacteria, such as Thauera (tut operon) [52], Azoarcus, and Magnetospirillum. No bssA sequences were retrieved from Deltaproteobacteria. The tut operon found in Thauera aromatica was also a dominant match in many of the sequences. Such clustering across betaproteobacterial species like Azoarcus and Thauera, suggests that these sequences are very similar, and are also similar to Magnetospirillum spp. bssA sequences. Compared to non-specific matches using the assA primer mix, few bssA non-matches were seen. These included matches to an acyl-CoA dehydrogenase (which is involved in β-oxidation of fatty acids), a 30S rRNA gene (smaller subunit of prokaryotic ribosome), and surprisingly, an assA match.

4. Discussion

A multitude of approaches can be used to determine whether a hydrocarbon-contaminated groundwater site is undergoing bioremediation, each with advantages and limitations [25]. For example, measuring concentration differences of potential electron acceptors (such as O2, nitrate, sulfate) or respiration products (such as CO2, Fe(II), sulfide, CH4), or changes in microbial numbers and/or taxonomic compositions in contaminated areas versus uncontaminated areas can indicate microbial changes in response to hydrocarbon presence [25,26]. However, these measurements do not directly indicate that hydrocarbons are being biodegraded in situ. Compound-specific isotope analysis (CSIA) which measures isotopic changes in hydrocarbons themselves as they are being biotransformed, is a powerful approach for proving biodegradation, but isotopic fractionation can vary in heterogeneous sites and large isotopic changes are needed [25]. Similarly, identifying known hydrocarbon metabolites in hydrocarbon-contaminated groundwater provides direct evidence that the extant microorganisms are indeed biotransforming hydrocarbons in situ [5,27], but requires prior knowledge of such degradation pathways. Thus, coupling multiple approaches to assess sites for their bioremediation potential can help overcome methodological limitations. In this study, two hydrocarbon-contaminated groundwater sites, candidates for management by MNA, were interrogated using measurements of biogeochemical indicators, microbial community profiling, and diagnostic hydrocarbon metabolites and genes in order to garner evidence in support of in situ hydrocarbon biodegradation.
While biogeochemical measurements indicated that nitrate, sulfate, and/or Fe(III) reduction may be operating at both sites, no clear trends were seen that suggested any dominant electron accepting process occurring at either site. Similarly, microbial community profiling based on the 16S rRNA gene indicated the presence of several anaerobic taxa and/or putative hydrocarbon-degraders, but taxonomic variation between all sampled groundwater wells precluded any clear conclusions that hydrocarbon-biodegrading taxa may have been stimulated in one site location versus another. Of note, both H2- and acetate-using methanogens were also identified via 16S rRNA gene sequencing, with the highest relative sequence abundance found in the uncontaminated well sampled at Site B. Although H2 and acetate were not measured in this study, we can speculate that they were formed in uncontaminated groundwater during the decomposition of dissolved organic matter by syntrophic bacteria acting in concert with methanogens. Previous reports describing microbial communities and biogeochemical transformations in pristine groundwater have suggested such interactions stimulated by dissolved organic matter decomposition [53,54].
Fumarate addition metabolites known to originate from the anaerobic biodegradation of both alkanes and alkyl monoaromatics were detected at several locations at both sites. The corresponding diagnostic biodegradation genes, assA and bssA, were also widely detected at both sites. Collectively, these results clearly demonstrated that both sites harbour anaerobic hydrocarbon-degrading microbial populations; as such, MNA could be a remedial option at these sites. Fumarate addition metabolites have been detected in many hydrocarbon-contaminated groundwater aquifers [5]. Most previous studies have focused on the identification of (methyl)benzylsuccinates originating from alkyl-substituted monoaromatic hydrocarbons, with fewer reports describing the detection of alkylsuccinates derived from alkanes in contaminated groundwater environments [36,55,56]. Refined fuel mixtures, such as the gasoline and diesel contaminants relevant to this study, are composed of low molecular weight alkanes and cyclic alkanes in addition to monoaromatic hydrocarbons. Thus, detecting fumarate addition metabolites from both classes of hydrocarbons is not unexpected in groundwater systems contaminated with such fuels [36,55].
The bssA gene, encoding the FAE benzylsuccinate synthase, has also been sought and detected in numerous groundwater sites as an indicator of hydrocarbon biodegradation and bioremediation potential [19,21,22,29,30,31,32,57,58]. In contrast, the assA gene (encoding alkylsuccinate synthase) has rarely been used to interrogate hydrocarbon-contaminated groundwater environments [20], although it is being increasingly sought and detected in marine systems such as hydrocarbon seeps and sediments [22,24,31,59]. We also detected both of these genes in many of the groundwater sampling locations at both sites under study, augmenting the metabolite findings (Table 2 and Table 3). With two exceptions (Site A, well C02-07 and Site B, well ISCO-03-B), the assA gene was detected only in wells also having detectable alkane concentrations (Table 2). In contrast, the bssA gene was detected in several wells having no detectable TEX concentrations (Table 3). Gittel et al. [23] detected assA genes in both pristine and alkane-containing marine seep samples, suggesting the ubiquity of such genes and supporting the notion that pristine environments naturally harbor microorganisms capable of hydrocarbon metabolism when exposed to hydrocarbons. Such a hypothesis may pertain to terrestrial groundwater environments as well, in light of the findings in this present study and that by Brow et al. [60]. These latter authors reported bssA transcripts on the order of log 4–5 /mL in groundwater samples showing no detectable toluene, suggesting a basal/constitutive level of bssA expression in groundwater-associated microbial communities.
Although we observed a co-occurrence of both fumarate addition metabolites and relevant genes in many of the groundwater wells sampled for this study, this was not always the case. Alkylsuccinates were detected in parallel with qualitative assA gene detection in most wells (Table 2), although only one of these diagnostic indicators was detected in a small number of samples. The simultaneous detection of both (methyl)benzylsuccinate and the bssA gene was much less pronounced than for the alkane degradation indicators. At Site A, only 2 of the 12 sampled wells showed the detection of both relevant metabolite and gene, only 3 of the 12 wells at Site B showed a co-occurrence of a (methyl)benzylsuccinate and the bssA gene. Such discrepancies were also noted in other studies that analyzed for both the bssA gene and related metabolites [30,32], where only one or the other diagnostic indicator was detected in many sampled wells. While the reasons for these disparities are not completely clear, some explanations can be considered. For example, the lack of detection of a given diagnostic metabolite in a contaminated groundwater system does not necessarily mean that the microbial community does not have the ability to biodegrade the parent hydrocarbon. As fumarate addition metabolites are metabolic intermediates, they may not accumulate to levels above that of the analytical detection limits, thus preventing their identification. Furthermore, as these metabolites have limited solubility at the low concentrations in which they may be detected (nM levels), it is also possible that they were transported in groundwater away from the location where they were initially produced and thus were not detected in the sampled locations. This may be especially true for benzylsuccinates which were not detected in the majority of the wells. However, because the relative aqueous solubilities of benzylsuccinates versus alkylsuccinates are not known, this explanation remains speculative. Similarly, metabolite assays as conducted here represent a ‘snapshot’ of the groundwater chemistry at the time of sampling [36,55], and thus the activity of the microbial community, along with dilution effects due to groundwater flow, can impact the positive detection of metabolites such as benzylsuccinates.
Similarly, the lack of detection of bssA or assA, despite metabolite detection, may be due to limitations with the primer sets used for their amplification and detection. Both of these genes are known to be highly diverse, spanning multiple taxa and environments [22,23,24]. As such, no single primer pair designed to date has captured assA or bssA diversity comprehensively [19,20,29,30]. Such may be the case in the present study, where a single primer set designed for each gene was used for its qualitative detection.
Owing to the limitation in diversity capture, few primer sets have been designed for the quantification of assA or bssA genes. Those that have been designed have a limited detection scope, either specific for sulfate-reducing or nitrate-reducing strains or for taxa in specific enrichments [22,23,40,60,61]. For example, widely used qPCR bssA primers were designed exclusively from betaproteobacterial bssA sequences, namely from Thauera aromatica strains K172 and T1, and Azoarcus sp. strain T [61]. As such, the sequences from other phyla may not be detected, an acknowledged limitation [61]. Other primer sets were subsequently designed to target additional taxa such as sulfate-reducing members of the Deltaproteobacteria and Clostridia [19,22]. Stagars et al. [24] designed 4 fluorescence FISH (fluorescence in-situ hybridization) probes which would allow for quantification of different clusters of assA sequences identified in their study examining this gene in marine environments, however the prevalence of non-specific probe annealing reinforced the difficulty in accurately detecting FAE genes. Using the qPCR primer set designed here and sequencing the resulting amplicons, we positively identified bssA genes affiliating with the Clostridia, Alphaproteobacteria, and Betaproteobacteria and assA genes associated with organisms in the Deltaproteobacteria.
The qPCR primers newly designed for this study used a mixture of 4 forward primers and 1 reverse primer for each of the assA and bssA genes (Table 1). To our knowledge, this primer mixture approach, designed to capture broad diversity (see Supplementary Materials), has not been previously attempted for assA nor bssA gene quantification. Using the qPCR primer mixture, we obtained gene abundances approximately 2 orders of magnitude greater than any other gene abundance value reported by other groups (Table 4). Generally, in contaminated aquifers, the gene abundance of bssA genes has been found to be between 103 to 108 copies/g sediment or copies/L water (Table 4). The large difference in the abundances of the bssA gene, ranging across 5 orders of magnitude, may also be dependent upon experimental differences, such as the primers used, the type of sample, toluene degradation activity, and the extent to which BSS-harbouring microorganisms were enriched in laboratory cultures or groundwater environments. Studies relating the abundance of bssA to 16S rRNA gene abundances found that while the 16S rRNA gene abundances were relatively consistent, the abundances of the bssA genes varied across orders of magnitude [30]. Other groups have detected background abundances (e.g., in uncontaminated samples) of bssA to be approximately 104 copies/L, while the lowest abundance captured in this study was 105 copies/L (Table 4). With this higher detection limit, we may not have adequately quantified the bssA gene, especially in the Site A samples where we were not able to quantify this gene in many samples even though it was detected using the qualitative PCR assay (Table 3). Based on the limited number of wells wherein the bssA gene was quantified, no relationships between the bssA gene abundances and TEX concentrations were discernible.
In comparison with the few reported assA quantification studies, the overall abundances are similar, up to ~8 log per unit sample in higher contaminated samples (Table 4). To our knowledge, very few studies have quantified assA gene abundances in environmental samples, much less than for bssA (Table 4), thus it is not known how our results compare to other field sites. Further studies of assA gene abundances in contaminated groundwater environments are needed. In contrast to bssA and TEX concentrations, there did appear to be a relationship between assA gene abundances and alkane concentrations wherein assA levels increased as alkane concentrations increased, at least up to 5 ppm alkanes. However, many more samples would need to be analyzed across many different sites to verify this trend.
The overall results using the newly designed qPCR primers for assA and bssA showed that they did capture a diversity of taxa within the Alphaproteobacteria, Betaproteobacteria, Deltaproteobacteria, and Clostridia, offering a proof-of-concept demonstration of a customized primer mix for quantifying FAE genes in a groundwater environment. These data suggest that the use of a primer mix to target specific diversity can work, if prior knowledge allows a directed and purposeful design. As additional assA and bssA gene sequences become available in databases, adding these to and/or further optimizing the primer mix should aid in improved amplification and quantification of these indicative biodegradation genes in hydrocarbon-associated environments.

5. Conclusions

Analyses of two hydrocarbon-contaminated groundwater systems, focused on combining assays for signature metabolite detection and FAE gene detection and quantification, revealed that both sites investigated showed strong potential for management by MNA. Newly designed qPCR primer mixtures revealed up to 109 assA gene copies/L and up to 1010 bssA gene copies/L at the study sites. While previous studies have reported the quantification of the bssA gene in hydrocarbon-contaminated groundwater, this present study has now also demonstrated the detection and quantification of assA genes in groundwater systems. While both metabolites and genes indicative of in situ hydrocarbon biodegradation were detected in some of the wells investigated, this was not always the case, similar to previous reports [30,32]. Thus, assessing field sites for evidence of in situ anaerobic hydrocarbon biodegradation should minimally use both approaches (in addition to other site assessments) to overcome any limitations each method may have in order to demonstrate the potential for hydrocarbon-contaminated groundwater to be naturally remediated by microorganisms.

Supplementary Materials

The following are available online at https://www.mdpi.com/2076-2607/8/10/1532/s1: Supplementary Methods: Design of assA and bssA primer mixture, Table S1: Total hydrocarbon concentrations in groundwater collected from various wells from Site A and Site B, Table S2: Sequences used in assA and bssA primer design with description and accession number from NCBI database, Table S3: Designed Illumina MiSeq adapter primers for assA and bssA qPCR primers, Table S4: Examples of sequenced assA assay products that passed quality control analysis but that were not annotated as alkylsuccinate synthase genes using a BLASTn analysis.

Author Contributions

Conceptualization, L.M.G. and G.K.; Methodology, L.M.G. and G.K.; Investigation, G.K. and G.S.; Data Curation, L.M.G., G.K., and G.S.; Writing—Original Draft Preparation, G.K.; Writing—Review and Editing, L.M.G., G.K., and G.S.; Supervision, L.M.G.; Project Funding Acquisition, L.M.G. All authors have read and agreed to the published version of the manuscript.

Funding

This research was funded by an NSERC Engage grant in partnership with the United Farmers of Alberta Co-operative Ltd., and an NSERC Discovery grant, both awarded to L.M.G.

Acknowledgments

We gratefully acknowledge the United Farmers of Alberta Co-operative Ltd. for the samples used in this study, AGAT Laboratories for hydrocarbon analysis, and Nuno Fragoso for help in creating field site schematics.

Conflicts of Interest

The authors declare no conflict of interest.

References

  1. Lynge, E.; Andersen, A.; Nilsson, R.; Barlow, L.; Pukkala, E.; Nordlinder, R.; Boffetta, P.; Grandjean, P.; Heikkilä, P.; Hörte, L.G.; et al. Risk of cancer and exposure to gasoline vapors. Am. J. Epidemiol. 1997, 145, 449–458. [Google Scholar] [PubMed] [Green Version]
  2. Hilpert, M.; Mora, B.A.; Ni, J.; Rule, A.M.; Nachman, K.E. Hydrocarbon release during fuel storage and transfer at gas stations: Environmental and health effects. Curr. Environ. Health Rep. 2015, 2, 412–422. [Google Scholar]
  3. Head, I.M.; Gray, N.D.; Larter, S.R. Life in the slow lane; biogeochemistry of biodegraded petroleum containing reservoirs and implications for energy recovery and carbon management. Front. Microbiol. 2014, 5, 566. [Google Scholar] [PubMed] [Green Version]
  4. Lueders, T. The ecology of anaerobic degraders of BTEX hydrocarbons in aquifers. FEMS Microbiol. Ecol. 2017, 93, fiw220. [Google Scholar] [PubMed]
  5. Gieg, L.M.; Toth, C.R.A. Signature metabolite analysis to determine in situ anaerobic hydrocarbon biodegradation. In Anaerobic Utilization of Hydrocarbons, Oils, and Lipids; Handbook of Hydrocarbon and Lipid Microbiology Book Series; Boll, M., Ed.; Springer: Cham, Switzerland, 2017; Volume 30, 30p. [Google Scholar]
  6. Rabus, R.; Boll, M.; Heider, J.; Meckenstock, R.U.; Buckel, W.; Einsle, O.; Ermler, U.; Golding, B.T.; Gunsalus, R.P.; Kroneck, P.N.H.; et al. Anaerobic microbial degradation of hydrocarbons: From enzymatic reactions to the environment. J. Mol. Microbiol. Biotechnol. 2016, 26, 5–28. [Google Scholar] [PubMed] [Green Version]
  7. Zhang, X.; Young, L.Y. Carboxylation as an initial reaction in the anaerobic metabolism of naphthalene and phenanthrene by sulfidogenic consortia. Appl. Environ. Microbiol. 1997, 63, 4759–4764. [Google Scholar]
  8. Davidova, I.A.; Gieg, L.M.; Duncan, K.E.; Suflita, J.M. Anaerobic phenanthrene mineralization by a carboxylating sulfate-reducing bacterial enrichment. ISME J. 2007, 1, 436–442. [Google Scholar] [PubMed]
  9. Mouttaki, H.; Johannes, J.; Meckenstock, R.U. Identification of naphthalene carboxylase as a prototype for the anaerobic activation of non-substituted hydrocarbons. Environ. Microbiol. 2012, 14, 2770–2774. [Google Scholar]
  10. Luo, F.; Gitiafroz, R.; Devine, C.E.; Gong, Y.; Hug, L.A.; Raskin, L.; Edwards, E.A. Metatranscriptome of an anaerobic benzene-degrading enrichment culture reveals involvement of carboxylation in benzene ring activation. Appl. Environ. Microbiol. 2014, 80, 4095–4107. [Google Scholar]
  11. Callaghan, A.V. Enzymes involved in the anaerobic oxidation of n-alkanes: From methane to long chain alkanes. Front. Microbiol. 2016, 4, 89. [Google Scholar]
  12. Biegert, T.; Fuchs, G.; Heider, J. Evidence that anaerobic oxidation of toluene in the denitrifying bacterium Thauera aromatica is initiated by formation of benzylsuccinate from toluene and fumarate. Eur. J. Biochem. 1996, 238, 661–668. [Google Scholar]
  13. Heider, J.; Szaleniec, M.; Martins, B.M.; Seyhan, D.; Buckel, W.; Golding, B.T. Structure and function of benzylsuccinate synthase and related fumarate-adding glycyl radical enzymes. J. Mol. Microbiol. Biotechnol. 2016, 26, 29–44. [Google Scholar]
  14. Achong, G.R.; Rodriguez, A.M.; Spormann, A.M. Benzylsuccinate synthase of Azoarcus sp. strain T: Cloning, sequencing, transcriptional organization, and its role in anaerobic toluene and m-xylene mineralization. J. Bacteriol. 2001, 183, 6763–6770. [Google Scholar]
  15. Kniemeyer, O.; Fischer, T.; Wilkes, H.; Glockner, F.O.; Widdel, F. Anaerobic degradation of ethylbenzene by a new type of marine sulfate-reducing bacterium. Appl. Environ. Microbiol. 2003, 69, 760–768. [Google Scholar]
  16. Callaghan, A.V.; Wawrik, B.; Ni Chadain, S.M.; Young, L.Y.; Zylstra, G.J. Anaerobic alkane-degrading strain AK-01 contains two alkylsuccinate synthase genes. Biochem. Biophys. Res. Commun. 2008, 3366, 142–148. [Google Scholar]
  17. Grundmann, O.; Behrends, A.; Rabus, R.; Amann, J.; Halder, T.; Heider, J.; Widdel, F. Genes encoding the candidate enzyme for anaerobic activation of n-alkanes in the denitrifying bacterium, strain HxN1. Environ. Microbial. 2008, 10, 376–385. [Google Scholar]
  18. Meckenstock, R.U.; Boll, M.; Mouttaki, H.; Koelschbach, J.S.; Cunha Tarouco, P.; Weyrauch, P.; Dong, X.; Himmelburg, A.M. Anaerobic degradation of benzene and polycyclic aromatic hydrocarbons. J. Mol. Microbiol. Biotechnol. 2016, 26, 92–118. [Google Scholar]
  19. Winderl, C.; Schaefer, S.; Lueders, T. Detection of anaerobic toluene and hydrocarbon degraders in contaminated aquifers using benzylsuccinate synthase (bssA) genes as a functional marker. Environ. Microbiol. 2007, 9, 1035–1046. [Google Scholar]
  20. Callaghan, A.V.; Davidova, I.A.; Savage-Ashlock, K.; Parisi, V.A.; Gieg, L.M.; Suflita, J.M.; Kukor, J.J.; Wawrik, B. Diversity of benyzl- and alkylsuccinate synthase genes in hydrocarbon-impacted environments and enrichment cultures. Environ. Sci. Technol. 2010, 44, 7287–7294. [Google Scholar]
  21. Acosta-Gonzáles, A.; Rosselló-Móra, R.; Marqués, S. Diversity of benzylsuccinate synthase-like (bssA) genes in hydrocarbon-polluted marine sediments suggests substrate-depending clustering. Appl. Environ. Microbiol. 2013, 79, 3667–3676. [Google Scholar]
  22. Von Netzer, F.; Pilloni, G.; Kleindienst, S.; Krüger, M.; Knittel, K.; Gründger, F.; Lueders, T. Enhanced gene detection assays for fumarate-adding enzymes allow uncovering of anaerobic hydrocarbon degraders in terrestrial and marine systems. Appl. Environ. Microbiol. 2013, 79, 543–552. [Google Scholar]
  23. Gittel, A.; Donhauser, J.; Roy, H.; Girguis, P.R.; Jorgensen, B.B.; Kjeldsen, K.U. Ubiquitous presence and novel diversity of anaerobic alkane degraders in cold marine sediments. Front. Microbiol. 2015, 6, 1414. [Google Scholar] [PubMed] [Green Version]
  24. Stagars, M.H.; Ruff, S.E.; Amann, R.; Knittel, K. High diversity of anaerobic alkane-degrading microbial communities in marine seep sediments based on (1-methylalkyl)succinate synthase genes. Front. Microbiol. 2016, 6, 1511. [Google Scholar]
  25. Bombach, P.; Richnow, H.H.; Kästner, M.; Fischer, A. Current approaches for the assessment of in situ biodegradation. Appl. Microbiol. Biotechnol. 2010, 86, 839–852. [Google Scholar] [PubMed]
  26. Gieg, L.M.; Kolhatkar, R.V.; McInerney, M.J.; Tanner, R.S.; Harris, S.H., Jr.; Sublette, K.; Sulfita, J.M. Intrinsic bioremedation of petroleum hydrocarbons in a gas condensate-contaminated groundwater. Environ. Sci. Technol. 1999, 33, 2550–2560. [Google Scholar]
  27. Beller, H.R.; Ding, W.H.; Reinhard, M. By-products of anaerobic alkylbenzene metabolism useful as indicators of in-situ bioremediation. Environ. Sci. Technol. 1995, 29, 2864–2870. [Google Scholar]
  28. Jobelius, C.; Ruth, B.; Griebler, C.; Meckenstock, R.U.; Hollender, J.; Reineke, A.; Frimmel, F.H.; Zwiener, C. Metabolites indicate hot spots of biodegradation and biogeochemical monitoring well gradients in a high-resolution monitoring well. Environ. Sci. Technol. 2011, 45, 474–481. [Google Scholar]
  29. Winderl, C.; Anneser, B.; Griebler, C.; Meckenstock, R.U.; Lueders, T. Depth-resolved quantification of anaerobic toluene degraders and aquifer microbial community patterns in distinct redox zones of a tar oil contaminant plume. Appl. Environ. Microbiol. 2008, 74, 792–801. [Google Scholar]
  30. Beller, H.R.; Kane, S.R.; Legler, T.C.; McKelvie, J.R.; Sherwood Lollar, B.; Pearson, F.; Balser, L.; Mackay, D.M. Comparative assessments of benzene, toluene, and xylene natural attenuation by quantitative polymerase chain reaction analysis of a catabolic gene, signature metabolites, and compound-specific isotope analysis. Environ. Sci. Technol. 2008, 42, 6065–6072. [Google Scholar]
  31. Johnson, J.M.; Wawrik, B.; Isom, C.; Boling, B.; Callaghan, A.V. Interrogation of Chesapeake Bay sediment microbial communities for intrinsic alkane-utilizing potential under anaerobic conditions. FEMS Microbiol. Ecol. 2015, 91, 1–14. [Google Scholar] [PubMed]
  32. Oka, A.R.; Phelps, C.D.; Zhu, X.; Saber, D.L.; Young, L.Y. Dual biomarkers of anaerobic hydrocarbon degradation in historically contaminated groundwater. Environ. Sci. Technol. 2011, 45, 3407–3414. [Google Scholar]
  33. Okpala, G.N.; Chen, C.; Fida, T.; Voordouw, G. Effect of thermophilic nitrate reduction on sulfide production in high temperature oil reservoir samples. Front. Microbiol. 2017, 8, 1573. [Google Scholar]
  34. Lovley, D.R.; Phillips, E.J.P. Rapid assay for microbially reducible ferric iron in aquatic sediments. Appl. Environ. Microbiol. 1987, 53, 1536–1540. [Google Scholar] [PubMed]
  35. Toth, C.R.A.; Gieg, L.M. Time-course dependent methanogenic crude oil biodegradation: Dynamics of fumarate addition metabolites, biodegradative genes, and microbial community composition. Front. Microbiol. 2018, 8, 2610. [Google Scholar] [PubMed]
  36. Gieg, L.M.; Suflita, J.M. Detection of anaerobic metabolites of saturated and aromatic hydrocarbons in petroleum-contaminated aquifers. Environ. Sci. Technol. 2002, 36, 3755–3762. [Google Scholar] [CrossRef]
  37. An, D.; Caffrey, S.M.; Soh, J.; Agrawal, A.; Brown, D.C.; Budwill, K.; Dong, X.; Dunfield, P.F.; Foght, J.; Gieg, L.M.; et al. Metagenomics of hydrocarbon resource environments indicates aerobic taxa and genes to be unexpectedly common. Environ. Sci. Technol. 2013, 47, 10708–10717. [Google Scholar]
  38. Zhang, J.; Kobert, K.; Flouri, T.; Stamatakis, A. PEAR: A fast and accurate Illumina Paired-End reAd merger. Bioinformatics 2014, 30, 614–620. [Google Scholar]
  39. Dong, X.; Kleiner, M.; Sharp, C.E.; Thorson, E.; Li, C.; Liu, D.; Strous, M. Fast and simple analysis of MiSeq amplicon sequencing data with MetaAmp. Front. Microbiol. 2017, 8, 1461. [Google Scholar] [PubMed]
  40. Aitken, C.M.; Jones, D.M.; Maguire, M.J.; Gray, N.D.; Sherry, A.; Bowler, B.F.J.; Ditchfield, A.K.; Larter, S.R.; Head, I.M. Evidence that crude oil alkane activation proceeds by different mechanisms under sulfate-reducing and methanogenic conditions. Geochim. Cosmochim. Acta 2013, 109, 162–174. [Google Scholar]
  41. Altschul, S.F.; Madden, T.L.; Schäffer, A.A.; Zhang, J.; Zhang, Z.; Miller, W.; Lipman, D.J. Gapped BLAST and PSI-BLAST: A new generation of protein database search programs. Nucleic Acids Res. 1997, 25, 3389–3402. [Google Scholar]
  42. Thompson, J.D.; Higgins, D.G.; Gibson, T.J. CLUSTALW: Improving the sensitivity of progressive multiple sequence alignment through sequence weighting, position-specific gap penalties and weight matrix choice. Nucleic Acids Res. 1994, 22, 4673–4680. [Google Scholar]
  43. Guindon, S.; Dufayard, J.F.; Lefort, V.; Anisimova, M.; Hordijk, W.; Gascuel, O. New algorithms and methods to estimate maximum-likelihood phylogenies: Assessing the performance of PhyML 3.0. Syst. Biol. 2010, 59, 307–321. [Google Scholar] [PubMed] [Green Version]
  44. Hordijk, W.; Gascuel, O. Improving the efficiency of SPR moves in phylogenetic tree search methods based on maximum likelihood. Bioinformatics 2005, 21, 4338–4347. [Google Scholar] [PubMed] [Green Version]
  45. Alberta Environment and Parks (AEP). Alberta Tier 1 Soil and Groundwater Remediation Guidelines; Land Policy Branch, Policy and Planning Division: Edmonton, AB, Canada, 2019.
  46. Cravo-Laureau, C.; Grossi, V.; Raphel, D.; Matheron, R.; Hirschler-Réa, A. Anaerobic n-alkane metabolism by a Desulfatibacillum aliphaticivorans strain CV2803 T. Appl. Environ. Microbiol. 2005, 71, 3458–3467. [Google Scholar]
  47. Cravo-Laureau, C.; Matheron, R.; Cayol, J.L.; Joulian, C.; Hirschler-Réa, A. Desulfatibacillum aliphaticivorans gen. nov., sp. nov., an n-alkane- and n-alkene-degrading, sulfate-reducing bacterium. Int. J. Syst. Evol. Microbiol. 2004, 54, 77–83. [Google Scholar] [PubMed]
  48. Jeon, C.O.; Park, W.; Ghiorse, W.C.; Madsen, E.L. Polaromonas naphthalenivorans sp. nov., a naphthalene-degrading bacterium from naphthalene-contaminated sediment. Int. J. Syst. Evol. Microbiol. 2004, 54, 93–97. [Google Scholar]
  49. Sun, W.; Xie, S.; Luo, C.; Cupples, A.M. Direct link between toluene degradation in contaminated-site microcosms and a Polaromonas strain. Appl. Environ. Microbiol. 2010, 76, 956–959. [Google Scholar]
  50. Ehrenreich, P.; Behrends, A.; Harder, J.; Widdel, F. Anaerobic oxidation of alkanes by newly isolated denitrifying bacteria. Arch. Microbiol. 2000, 173, 58–64. [Google Scholar] [PubMed]
  51. Iffis, B.; St-Arnaud, M.; Hijri, M. Bacteria associated with arbuscular mycorrhizal fungi within roots of plants growing in a soil highly contaminated with aliphatic and aromatic petroleum hydrocarbons. FEMS Microbiol. Lett. 2014, 358, 44–54. [Google Scholar]
  52. Coschigano, P.W. Transcriptional analysis of the tutE tutFDGH gene cluster from Thauera aromatica strain T1. Appl. Environ. Microbiol. 2000, 66, 1147–1151. [Google Scholar]
  53. Flynne, T.M.; Sanford, R.A.; Ryu, H.; Bethke, C.M.; Levine, A.D.; Ashbolt, N.J.; Santo Domingo, J.W. Functional microbial diversity explains groundwater chemistry in a pristine aquifer. BMC Microbiol. 2013, 13, 146. [Google Scholar]
  54. Benk, S.A.; Yan, L.; Lehmann, R.; Roth, V.-N.; Schwab, V.F.; Totsche, K.U.; Küsel, K.; Gleixner, G. Fueling diversity in the subsurface: Composition and age of dissolved organic matter in the critical zone. Front. Earth Sci. 2019, 7, 296. [Google Scholar]
  55. Parisi, V.A.; Brubaker, G.R.; Zenker, M.J.; Prince, R.C.; Gieg, L.M.; da Silva, M.L.B.; Alvarez, P.J.J.; Suflita, J.M. Field metabolomics and laboratory assessments of anaerobic intrinsic bioremediation of hydrocarbons at a petroleum-contaminated site. Microb. Biotechnol. 2009, 2, 202–212. [Google Scholar] [PubMed]
  56. Agrawal, A.; Gieg, L.M. In situ detection of anaerobic alkane metabolites in subsurface environments. Front. Microbiol. 2013, 4, 140. [Google Scholar]
  57. Kazy, S.K.; Monier, A.L.; Alvarez, P.J.J. Assessing the correlation between anaerobic toluene degradation activity and bssA concentrations in hydrocarbon-contaminated aquifer material. Biodegradation 2010, 21, 793–800. [Google Scholar] [PubMed]
  58. Da Silva, M.L.B.; Alvarez, P.J.J. Enhanced anaerobic biodegradation of benzene-toluene-ethylbenzene-xylene-ethanol mixtures in bioaugmented aquifer columns. Appl. Environ. Microbiol. 2004, 70, 4720–4726. [Google Scholar]
  59. Kimes, N.E.; Callaghan, A.V.; Aktas, D.R.; Smith, W.L.; Sunner, J.; Golding, B.T.; Drozdowska, M.; Hazen, T.C.; Suflita, J.M.; Morris, P.J. Metagenomic analysis and metabolite profiling of deep-sea sediments from the Gulf of Mexico following the Deepwater Horizon oil spill. Front. Microbiol. 2013, 4, 50. [Google Scholar]
  60. Brow, C.N.; Johnson, R.O.; Johnson, R.L.; Simon, H.M. Assessment of anaerobic toluene biodegradation activity by bssA transcript/gene ratios. Appl. Environ. Microbiol. 2013, 79, 5338–5344. [Google Scholar]
  61. Beller, H.R.; Kane, S.R.; Legler, T.C.; Alvarez, P.J.J. A real-time polymerase chain reaction method for monitoring anaerobic, hydrocarbon-degrading bacteria based on a catabolic gene. Environ. Sci. Technol. 2002, 36, 3977–3984. [Google Scholar] [CrossRef]
  62. Oberding, L.K.; Gieg, L.M. Methanogenic paraffin biodegradation: Alkylsuccinate synthase gene quantification and dicarboxylic acid production. Appl. Environ. Microbiol. 2018, 84, e01773-17. [Google Scholar]
  63. Pilloni, G.; Bayer, A.; Ruth-Anneser, B.; Fillinger, L.; Engel, M.; Griebler, C.; Lueders, T. Dynamics of hydrology and anaerobic hydrocarbon degrader communities in a tar-oil contaminated aquifer. Microorganisms 2019, 7, 46. [Google Scholar]
  64. Müller, J.B.; Ramos, D.T.; Larose, C.; Fernandes, M.; Lazzarin, H.S.C.; Vogel, T.M.; Corseuil, H.X. Combined iron and sulfate reduction biostimulation as a novel approach to enhance BTEX and PAH source-zone biodegradation in biodiesel blend-contaminated groundwater. J. Hazard. Mater. 2017, 326, 229–236. [Google Scholar] [PubMed]
Figure 1. Schematic of Site A, with pop-outs summarizing hydrocarbon concentrations (analyzed in 2016 only) and indicators of potential electron accepting processes (analyzed in 2016 and 2017). Bolded text indicates hydrocarbon concentrations above allowable limits for hydrocarbons in non-drinking groundwater sources. ‘nd’ = no data available as well was not sampled.
Microorganisms 08 01532 g001
Figure 2. Schematic of Site B, with pop-outs summarizing hydrocarbon concentrations (analyzed in 2016 only) and indicators of potential electron accepting processes (analyzed in 2016 and 2017). Bolded text indicates hydrocarbon concentrations above allowable limits for hydrocarbons in non-drinking groundwater sources. ‘nd’ = no data available as well was not sampled.
Microorganisms 08 01532 g002
Figure 3. Microbial community profiles found with Site A groundwater wells in 2016 and 2017, with wells arranged in order of decreasing total hydrocarbon concentration, from left to right. Analysis was performed using MetaAmp 2.0 and the SILVA 132 database, with the 2% most abundant taxa shown to the lowest taxonomic level identified.
Microorganisms 08 01532 g003
Figure 4. Microbial community profiles found with Site B groundwater wells in 2016 and 2017, with wells arranged in order of decreasing total hydrocarbon concentration, from left to right. Analysis was performed using MetaAmp 2.0 and the SILVA 132 database, with the 2% most abundant taxa shown to the lowest taxonomic level identified.
Microorganisms 08 01532 g004
Figure 5. Quantifications of the assA and bssA genes in Sites A and B across 2 years (2016, red circles; 2017, black squares), plotted as a function of alkane or TEX (toluene, ethylbenzene, and xylene) concentrations, respectively. (A) assA gene abundances in Site A wells; (B) assA gene abundances in Site B wells; (C) bssA gene abundances in Site A wells; (D) bssA gene abundances in Site B wells. Linear regression trend lines are matched in colour. Only those samples whose amplicons matched the length of standard amplicons are plotted. Error bars represent the standard deviation of technical replicates (n = 3).
Microorganisms 08 01532 g005
Figure 6. Maximum likelihood phylogram of sequenced assA and bssA amplicons. Nucleic acid sequences were aligned with ClustalX (30 iterations). Tree-building via PhyML 3.0 Maximum Likelihood using TN93 substitution model, fast likelihood-based method aLRT (approximate likelihood ratio test) for branch supporting, and SPR (subtree pruning and re-grafting) tree improvement model. The outgroup is pyruvate formate lyase (pfl) from sulfate-reducing strain D. alkenivorans strain AK-01.
Microorganisms 08 01532 g006
Table 1. Primers designed and used in this study for quantitative detection of the bssA and assA genes in Site A and B groundwater samples. Melting temperature Tm was calculated via the IDT OligoAnalyzer 3.1 online tool using default quantitative polymerase chain reaction (qPCR) parameters.
NameSequence (5’-3’)Tm (°C)Reference
bssA forward
bssOilGAA TCC CTG GTT ACA GGT CCA C64.1This study
bssMysCAA TCC GTG GCA CAA CTG CAT G66.3This study
bssSufGAA TAC GTG GAG CGA CCC GCT C68.1This study
bssWinCAA TCC GTG GCT TCA GGT TCA T65This study
bssA reverse
bssHitrTCC TCG TAG CCT TCC CAG TT64.6This study
assA forward
assOriCTC CGC CAC GGC CAA CTG67.4This study
assMsdCTC AGC CAC CGC CAA CTG65This study
assExCTC TGC GAC CGC GAA TTG63This study
assSmlTAG CGC CAC GGC CAA CTG67This study
assA reverse
8543rTCG TCR TTG CCC CAY TTN GG 65.7[22]
Table 2. Detection of alkane/cyclic alkane-derived fumarate addition metabolites and assA genes (qualitatively and quantitatively determined) in Site A and B groundwater wells sampled in 2016 and 2017. “2016” or “2017” indicates that the metabolite was detected in that year, while “assA” denotes gene detection. A blank space denotes absence of metabolite or gene.
AlkanesDetected AlkylsuccinatesassA Gene PresenceassA Gene Abundance
(copies/L GW) 5
WellC6-C10 Alkanes (ppm)C5C5 unsat 1C6C6 unsatC7C7 unsatC8C8 unsatC9C9 unsat2016201720162017
Site AC02-085.5 2016 20162017 2016/201720162016 assAassA1.09 × 1071.17 × 107
C03-144.4 2016 2016/2017 2016 2016assAassA2.43 × 1082.86 × 108
C03-100.92016/20172016 2016/2017 2016/2017 2016/2017 2017assAassA1.57 × 1072.45 × 107
C01-040.52016/2017 2016/2017 2016/2017 2016 assAassA
C03-13 30.4 2017 2017 2017 assA-4.64 × 10⁶
C01-010.2 20162016/2017 2016/20172016/20172016/20172016/2017assA 3.15 × 10⁷
C03-120.1 2016 2016 2017assAassA3.81 × 1051.45 × 106
C02-06<0.1 2
C02-07<0.1 assA 3.27 × 10⁶
C03-11<0.1 2016/2017 2016/2017 2.25 × 1064.34 × 105
MW 07<0.1 1.86 × 1052.72 × 105
MW23<0.1
TRIP BLANK<0.1
Site BREC-349.92016/20172016/2017 2016/2017 2016 assAassA1.15 × 1071.08 × 106
REC-315.520172016/2017 2016/2017 2016/2017 assA 6.61 × 10⁷
ISCO-03-C3.120162016 2016 2016assAassA
ISCO-04-C 42.820162016 2016 assA 2.61 × 10⁶-
REC-242.82016/20172016/2017 2016/2017 assAassA 1.69 × 10⁷
REC-11 42.720162016 assA 2.21 × 10⁷-
REC-122.22016 2016 assAassA3.00 × 1071.34 × 107
ISO-491.32017 20172017 2017 assAassA1.76 × 1071.03 × 107
S14-7R1.22016/20172016/2017 2016/2017 2017 assAassA3.44 × 1069.80 × 107
REC-260.2 assAassA3.02 × 1091.45 × 109
ISCO-03-B 4<0.1 2016 assA 4.64 × 10⁶-
S14-49B<0.1 1.36 × 1061.42 × 106
Trip Blank<0.1
1 unsat indicates a fumarate addition product with 2 mass units less that an n-alkane, presumably derived from the metabolism of a cyclic alkane; 2 below the analytical detection limit of 0.1 ppm; 3 well not sampled in 2016; 4 well not sampled in 2017; 5 A dash indicates that no quantification was performed as no sample was received that year. A blank space indicates that the gene could not be detected or quantified using the quantitative polymerase chain reaction (qPCR) primer set.
Table 3. Detection of TEX-derived fumarate addition metabolites and bssA genes (qualitatively and quantitatively determined) in Site A and B groundwater wells sampled in 2016 and 2017. “2016” or “2017” indicates that the metabolite was detected in that year, while “bssA” denotes gene detection. A blank space denotes absence of metabolite or gene.
Monoaromatic HydrocarbonBenzylsuccinatesbssA Gene PresencebssA Gene Abundance (copies/L GW) 4
WellToluene (ppm)Ethylbenzene (ppm)Xylenes (ppm)BzSuccEBSuccMeBzSucc2016 2017 20162017
Site AC02-080.0720.8611.71 2016/2017bssAbssA
C03-140.09761.80.0102 2016/2017 bssA
C03-100.1281.260.178 bssAbssA4.48 × 1093.18 × 109
C01-040.01530.09120.0081 bssAbssA3.90 × 1071.13 × 108
C03-13 2<0.00030.0130.0102
C01-010.0014<0.00050.001 bssA 1.09 × 10⁸
C03-12<0.00030.00180.0015 bssAbssA3.84 × 10104.08 × 109
C02-06<0.0003<0.0005<0.0005
C02-07<0.0003<0.0005<0.0005 bssA
C03-11<0.0003<0.0005<0.0005 bssAbssA
MW07<0.0003<0.00050.0102 bssA
MW23<0.0003<0.00050.0102 bssAbssA
TRIP BLANK<0.0003 1<0.0005 1<0.0005
Site BREC-343.830.3256.112016/201720162016/2017bssAbssA2.89 × 1061.06 × 107
REC-310.8670.3940.979 6.17 × 10⁸
ISCO-03-C0.5570.00510.0051 bssAbssA3.30 × 1066.29 × 108
ISCO-04-C 30.920.03230.0323
REC-240.3770.2970.675 bssAbssA
REC-1130.7320.04084.96 bssA 1.05 × 10⁶-
ISO-490.870.2234.462016 2016bssAbssA1.24 × 1074.37 × 108
REC-120.02990.04890.0432 bssA3.51 × 1063.11 × 107
S14-7R0.1250.03650.07542016/2017 bssAbssA1.15 × 1061.59 × 108
ISCO-03-B 30.07130.1080.0454 bssA 1.44 × 10⁶-
REC-260.05230.04210.403 bssA4.53 × 1061.38 × 108
S14-49B<0.0003<0.0005<0.0005 bssA
Trip Blank<0.0003<0.0005<0.0005
1 below the analytical detection limit of 0.0003 ppm for toluene and 0.0005 ppm for ethylbenzene or xylenes; 2 well not sampled in 2016; 3 well not sampled in 2017; 4 A dash indicates that no quantification was performed as no sample was received that year. A blank space indicates that the gene could not be detected or quantified using the qPCR primer set.
Table 4. Comparisons of approximate reported assA and bssA gene abundances reported in literature and in the present study. Note that abundances reported in this study are up to 2 log greater than other studies, in both detection limit and in highest reported abundances.
Targeted FAE GeneReported Detection Limit (copies/L or g)Highest Reported Sample Abundance (copies/L or g)Targeted Electron-Accepting ConditionsCited Primer ReferenceReference
assA~log 5~log 9Sulfate-reducers and methanogenic consortia This Study
not reported~log 6Methanogenic paraffin degrading consortium Oberding and Gieg [62]
~log 3~log 8Sulfate-reducers and methanogenic consortia Aitken et al. [40]
bssA~log 5~log 10Nitrate- and sulfate-reducers This Study
~log 2~log 8Sulfate-reducers Winderl et al. [29]Pilloni et al. [63]
~log 4~log 8Nitrate- and sulfate-reducersWinderl et al. [19]
non-qPCR primers 7772f/8546r
Müller et al. [64]
~log 4~log 4Sulfate-reducers and methanogenic consortiaBeller et al. [30]Oka et al. [32]
~log 2~log 3Nitrate-reducersBeller et al. [61]Oka et al. [32]
~log 1~log 8Nitrate-reducersBeller et al. [61]Kazy et al. [57]
~log 3~log 8Sulfate-reducers Beller et al. [30]
~log 3~log 7Deltaproteobacterial “F1” Winderl et al. [29]
~log 2~log 8Nitrate-reducersBeller et al. [61]Da Silva and Alvarez [58]
~log 3~log 8Nitrate-reducers Beller et al. [61]

