Article

Metabolic Response of Faecalibacterium prausnitzii to Cell-Free Supernatants from Lactic Acid Bacteria

1
Danone Nutricia Research, RD 128 Avenue de la Vauve, 91767 Palaiseau Cédex, France
2
Archer Daniels Midland Co-Biopolis ADM Nutrition, C/Catedratico Agustin Escardino num 9 Edif 2, Paterna, 46980 Valencia, Spain
3
Present Address: Danone Nutricia Research, 30th Biopolis Street Matrix Building, Singapore 138671, Singapore
*
Authors to whom correspondence should be addressed.
Microorganisms 2020, 8(10), 1528; https://doi.org/10.3390/microorganisms8101528
Submission received: 31 August 2020 / Revised: 28 September 2020 / Accepted: 30 September 2020 / Published: 5 October 2020
(This article belongs to the Special Issue The Human Gut Microbiome, Diets and Health)

Abstract

:
Interest in preventive or therapeutic strategies targeting gut microbiota is increasing. Such strategies may involve the direct replenishment of the gut microbiota with single strains or strain mixtures, or the manipulation of strain abundance through dietary intervention, including lactic acid bacteria. A few candidate species associated with health benefits have been identified, including Faecalibacterium prausnitzii. Given its growth requirements, modulation of this bacterium has not been extensively studied. In this investigation, we explored the capacity of cell-free supernatants of different Lactobacillus, Streptococcus, Lactococcus, and Bifidobacterium strains to stimulate the growth of F. prausnitzii A2-165. Modulation by four strains with the greatest capacity to stimulate growth or delay lysis, Lactococcus lactis subsp. lactis CNCM I-1631, Lactococcus lactis subsp. cremoris CNCM I-3558, Lactobacillus paracasei CNCM I-3689, and Streptococcus thermophilus CNCM I-3862, was further characterized by transcriptomics. The response of F. prausnitzii to cell-free supernatants from these four strains revealed several shared characteristics, in particular, upregulation of carbohydrate metabolism and cell wall-related genes and downregulation of replication and mobilome genes. Overall, this study suggests differential responses of F. prausnitzii to metabolites produced by different strains, providing protection against cell death, with an increase in peptidoglycan levels for cell wall formation, and reduced cell mobilome activity.

1. Introduction

Faecalibacterium prausnitzi (F. prausnitzii) is a Gram-negative bacterium that is prevalent and abundant in healthy subjects [1]. It produces butyrate, as a major fermentation end-product, which acts as an energy source for colonocytes. Its presence is generally considered beneficial to intestinal health [2,3]. Interest in F. prausnitzii has increased over the last decade, mostly in response to the pioneering study by Sokol et al. reporting a depletion of F. prausnitzii in Crohn’s disease patients [4]. Since this report, many studies have confirmed that changes in the abundance of F. prausnitzii occur in various other diseases (reviewed by [5]). Depletion of F. prausnitzii in inflammatory conditions may reflect the sensitivity of this bacterium to the high luminal oxygen concentrations resulting from inflammation. F. prausnitzii has been reported to have anti-inflammatory effects in vivo, in models of acute [4] or chronic [6] chemically induced active inflammation and in conditions of low-grade inflammation [7], mediated in part by the secreted metabolites blocking the activation of nuclear factor (NF)-κB [8]. A 15 kDa candidate protein (microbial anti-inflammatory molecule, MAM) was identified and shown to alleviate chemically-induced colitis in mice [9]. These studies support the notion that F. prausnitzii contributes to immune homeostasis in the intestine via its anti-inflammatory activities [10] and suggest that it could be considered a biomarker of healthy ecosystems [11]. A recent study reported co-abundance between F. prausnitzii and multiple species in IBD including negative relationship with Haemophilus parainfluenzae [12].
F. prausnitzii strains are diverse, and two to three phylogroups have been defined [13,14] on the basis of 16S rRNA sequence analysis. These phylogroups were shown to be independent of substrate use, pH tolerance, or bile sensitivity [15]. A recent analysis of 31 genomes identified two “genomogroups” differing in terms of their carbohydrate and amino-acid metabolism and their defense mechanisms [16].
The global nutritional needs of F. prausnitzii have been investigated through a manually curated metabolic reconstruction that identified several amino acids and vitamins as growth factors [17]. In vitro experiments have shown that F. prausnitzii can metabolize fibers, directly or indirectly, through metabolic cross-feeding. Acetate consumption is the major driver of butyrate production by F. prausnitzii [18]. The consumption of acetate released by Bifidobacterium adolescentis has been shown to stimulate F. prausnitzii when these two species are grown together on fructo-oligosaccharides [19]. F. prausnitzii can metabolize substrates from both host and dietary sources, with some variability between strains [13]. One of these substrates, apple pectin, has been reproducibly reported to favor an increase in F. prausnitzii abundance in monoculture [20], complex communities [21,22] and humans [23].
Lactic acid bacteria/bifidobacteria consumption have been shown to modulate gut microbiota [24]). In vitro models have allowed to identify cross-feeding between lactic acid bacteria/bifidobacteria and gut microbiota through short-chain fatty acids (SCFAs) [25,26], cell wall-derived polysaccharides [27,28], and vitamins [29]. Many studies have reported then capacity of lactic acid bacteria to inhibit pathogen growth [30,31] through the production antimicrobial compounds such as bacteriocins [32]. However, the ability of lactic acid bacteria and bifidobacteria to modulate the growth and metabolism of strains of potential interest for human health has been little explored. In this study, we investigated the response of F. prausnitzii A2-165 (DSM 17677) to cell-free supernatants from selected lactic acid bacteria and bifidobacteria in vitro.

2. Materials and Methods

2.1. Bacterial Strains and Media

Faecalibacterium prausnitzii A2-165 was purchased from DSMZ, Braunschweig, Germany (DSM 17677). It was routinely grown in brain–heart infusion (BHI) medium (Becton Dickinson, Le Pont-de-Claix, France) supplemented with 0.5% yeast extract (Becton Dickinson, Le Pont-de-Claix, France) and 5 mg/L hemin chloride (Calbiochem, VWR International, Libourne, France), with cellobiose (1 g/L; Sigma-Aldrich Co. LLC, St. Louis, MO, USA), maltose (1 g/L; Sigma-Aldrich Co. LLC, St. Louis, MO, USA), and cysteine (0.5 g/L; Sigma-Aldrich Co. LLC, St. Louis, MO, USA), under an atmosphere consisting of 80% N2–10% CO2–10% H2. Thirteen lactic acid bacteria/bifidobacteria strains were tested for their impact on growth of F. prausnitzii (Table S1). They were maintained in medium M17 lactose (Streptococcus and Lactococcus) or MRS plus 1 g/L l-cysteine (Bifidobacterium) or MRS (Lactobacillus), AES Laboratoire, Combourg, France.
To test the effect of supernatants on the growth of F. prausnitzii, all strains were cultured in YCFA medium optimized for the growth of all bacterial strains. This medium consisted of glucose (2 or 20 g/L, Sigma-Aldrich Co. LLC, St. Louis, MO, USA), tryptone (10 g/L, Becton Dickinson, Le Pont-de-Claix, France), yeast extract (5 g/L, Becton Dickinson, Le Pont-de-Claix, France), sodium acetate (5 g/L, Sigma-Aldrich Co. LLC, St. Louis, MO, USA), monohydrate lactose (5 g/L, Sigma-Aldrich Co. LLC, St. Louis, MO, USA), sodium bicarbonate (4 g/L, Sigma-Aldrich Co. LLC, St. Louis, MO, USA), cellobiose (2 g/L, Sigma-Aldrich Co. LLC, St. Louis, MO, USA), sodium chloride (0.9 g/L, Sigma-Aldrich Co. LLC, St. Louis, MO, USA), ammonium sulfate (0.9 g/L, Sigma-Aldrich Co. LLC, St. Louis, MO, USA), cysteine (0.5 g/L, Sigma-Aldrich Co. LLC, St. Louis, MO, USA), dibasic potassium phosphate (0.45 g/L, Sigma-Aldrich Co. LLC, St. Louis, MO, USA), magnesium sulfate (0.09 g/L, Sigma-Aldrich Co. LLC, St. Louis, MO, USA), calcium chloride (0.09 g/L, Sigma-Aldrich Co. LLC, St. Louis, MO, USA), hemin chloride (0.01 g/L Sigma-Aldrich Co. LLC, St. Louis, MO, USA), and resazurin sodium salt (0.001 g/L, Alfa Aesar, Kandel, Germany). Vitamins and volatile fatty-acid (except acetate) pools were removed to limit F. prausnitzii growth. We also increased the buffering of the medium, to prevent excessive pH variation that might not be tolerated by the commensal bacteria. We supplemented the medium with lactose (0.5%) to support the growth of the tested lactic acid bacteria and bifidobacterial strains. Final pH was 5.7 to mimic proximal gastrointestinal conditions. This modified medium is referred to as YCFAm.

2.2. Culture of F. prausnitzii A2-165 with Supernatants of Lactic Acid Bacteria and Bidifobacteria

Supernatants were produced as follows: strains were sub-cultured twice in YCFAm before being inoculated in 50 mL of YCFAm at 37 °C for 24 h. Cultures were pelleted by centrifugation at 7500× g for 10 min, and the supernatants were passed through filters with 0.2 µm pores and directly frozen at −20 °C. Before use, supernatants were reduced by incubation in an anaerobic chamber for three hours. Reduced control medium or supernatant from each of 13 bacterial strains was added to YCFAm (8% v/v) for inoculation of a 48-h culture of F. praunistzii, at a concentration of 1%. OD600 and pH were measured at regular intervals during the growth period of 72 h.

2.3. Analysis of Short Chain Fatty Acids

We collected 2 mL of fresh culture, which we then centrifuged at 10,000× g for 15 min. The supernatants were filtered (filter with 0.2 µm pores) and stored at −20°C until analysis. Samples for short-chain fatty acid (SCFA) analyses were collected after 16, 22, and 40 h. SCFAs were extracted from the samples in diethyl ether, after the addition of 2-methyl hexanoic acid as an internal standard. Extracts were analyzed with a GC-2014 gas chromatograph (Shimadzu, ’s-Hertogenbosch, The Netherlands), equipped with a capillary fatty acid-free EC-1000 Econo-Cap column (dimensions: 25 mm × 0.53 mm, film thickness: 1.2 mM; Alltech, Laarne, Belgium), a flame ionization detector and a split injector.

2.4. RNA Isolation and Sequencing (RNA-seq)

We collected 15 mL of F. prausnitzii culture at the end of the exponential growth phase (T22), for each condition and replicate, and added it to 30 mL of RNA Protect bacterial reagent (Qiagen, Hilden, Germany) at pH 6. This mixture was immediately vortexed and incubated for 5 min at room temperature. It was then centrifuged at 5000× g for 10 min and the pellet was recovered and stored at −80 °C until use. RNA was isolated by enzymatic and mechanical lysis followed by use of the RNAeasy Mini Kit (Qiagen, Hilden, Germany). The RNA was concentrated during DNAse treatment with the RNeasy MiniElute Cleanup kit (Qiagen, Hilden, Germany). Quantity and quality of the RNA was assessed with a NanoDrop® photometer (Thermo Scientific, Waltham, MA, USA) and an Agilent 2100 Bioanalyzer (Agilent Technologies, Palo Alto, CA, USA) respectively. We used 1 µg of DNA-free RNA with a RIN value > 8.0 from each sample for ribosomal RNA removal and library construction with Ribo-zero and the Scriptseq v2 RNAseq Library preparation kit (Illumina, San Diego, CA, USA). Quality control was performed on libraries with the Agilent High-Sensitivity DNA Kit (Agilent Technologies, Palo Alto, CA, USA). The 15 total RNA libraries were sequenced in a single lane on a HiSeq 4000 (Illumina, San Diego, CA, USA), in the 50-cycle single-read configuration, according to the manufacturer’s protocol. We used the HiSeq SBS Kit v3 for sequencing, with HiSeq Control Software 3.3.20 and RTA v2.5.2. Reads in bcl format were demultiplexed with the 6 bp Illumina index and CASAVA 1.8, allowing a single base–pair mismatch per library, and were converted to fastq format with bcl2fastq.

2.5. Differential Expression Analysis

The fastQ reads for each condition and replicates were inspected for quality and adapters with CUTADAPT version 1.4.1 [33] and for ribosomal RNA content with SortMeRNA version 2.1 [34]. Clean reads were mapped to the F. prausnitzii A2-165 representative genome (GCF_000162015.1) using STAR version 2.6.0a [35]. HTSeq version 0.11.1 was used to quantify the expression of the 2743 Open Reading Frames, and the R Bioconductor tximport package version 1.10.1 to build a count matrix with all the samples. Only transcripts with more than 1 cpm (Counts Per Million) in at least 3 samples were retained. We performed the differential expression analysis with the DESeq2 version 1.22.2 [36] package, with 3 biological replicates for each sample. We applied cutoffs of P-adj (corrected FDR) < 0.05 and absolute log2FoldChange (log2FC) > 1.5 for the detection of genes differentially expressed between the conditions considered and the negative control.

2.6. Functional Annotation

Extended functional annotation was performed, comparing F. prausnitzii A2-165 (GCF_000162015.1) ORFs with the sequences in various databases. The December 2014 update of the COG (Cluster of Orthologous Groups of proteins) database [37] was used, together with BLAST(p) version 2.7.1 [38] with a cutoff set at 1 × 10⁻⁶ for e-value and 40% for identity and coverage, to assign COG ID, functional classes and COG annotations. COG terms were validated through the CD-Search service from NCBI using RPS-Blast with 1 × 10⁻⁶ as e-value cutoff and the best hits were selected in terms of e-value. Proteins were also scanned for carbohydrate-related domains with the dbCAN2 [39] web server. KEGG Orthology terms and related pathways were identified with the BlastKOALA server [40]. GO terms for the three ontologies were obtained from the F. prausnitzii A2-165 page at BioCyc (https://biocyc.org/). As a result of the re-annotation, 1845 ORFs (67.26% of the total number of 2743 ORFs) were annotated with a known function based on the identification of at least one term from any ontology. F. prausnitzii A2-165 genome assembly (GCF_000162015.1) was inspected for Lagaffe and Mushu phages [41] with GenBank accession codes MG711461 and MG711460, respectively. Genome assembly proteins were compared to the 65 Lagaffe and 54 Mushu phage proteins using Blastp v2.7.1 with default parameters. Only hits with e-value lower than 1 × 10⁻⁵, identity higher than 90% and coverage higher than 60% were considered. Hits were then manually curated according to synteny within the phage genome. As a result, 62 and 47 proteins were identified as Lagaffe and Mushu proteins, respectively.

2.7. Statistics and Graphs

All statistical analyses were done with R version 3.6. Graphs were plotted with the ggplot2 package (version 3.3.1). Linear regression analyses were performed with the lm function of the stats package v 3.6.1 to evaluate the growth curves (OD600), the relation butyrate/OD600 and the relation butyrate/acetate (note that for L. lactis subsp. cremoris CNCM I-3558, a sample at T = 22 h was missing). In one of the regression analyses performed (butyrate/acetate), a correction factor based on the time at which determinations were made was introduced into the model. Growth rates were obtained based on linearity during exponential phase. To obtain decay rates, a linear model was fitted following the maximal growth. Differences in growth rate and decay between conditions were tested by Anova followed by Tukey-hsd. Circos version 0.69-6 [42] was used to produce a circular plot that integrates the differential expression analysis and COG annotation data. An overview of the bioinformatic pipeline used in this study is provided in Figure S1.

2.8. Access to Data and Codes

Raw RNA-seq fastq files are available at ArrayExpress under project E-MTAB-9387.

3. Results and Discussion

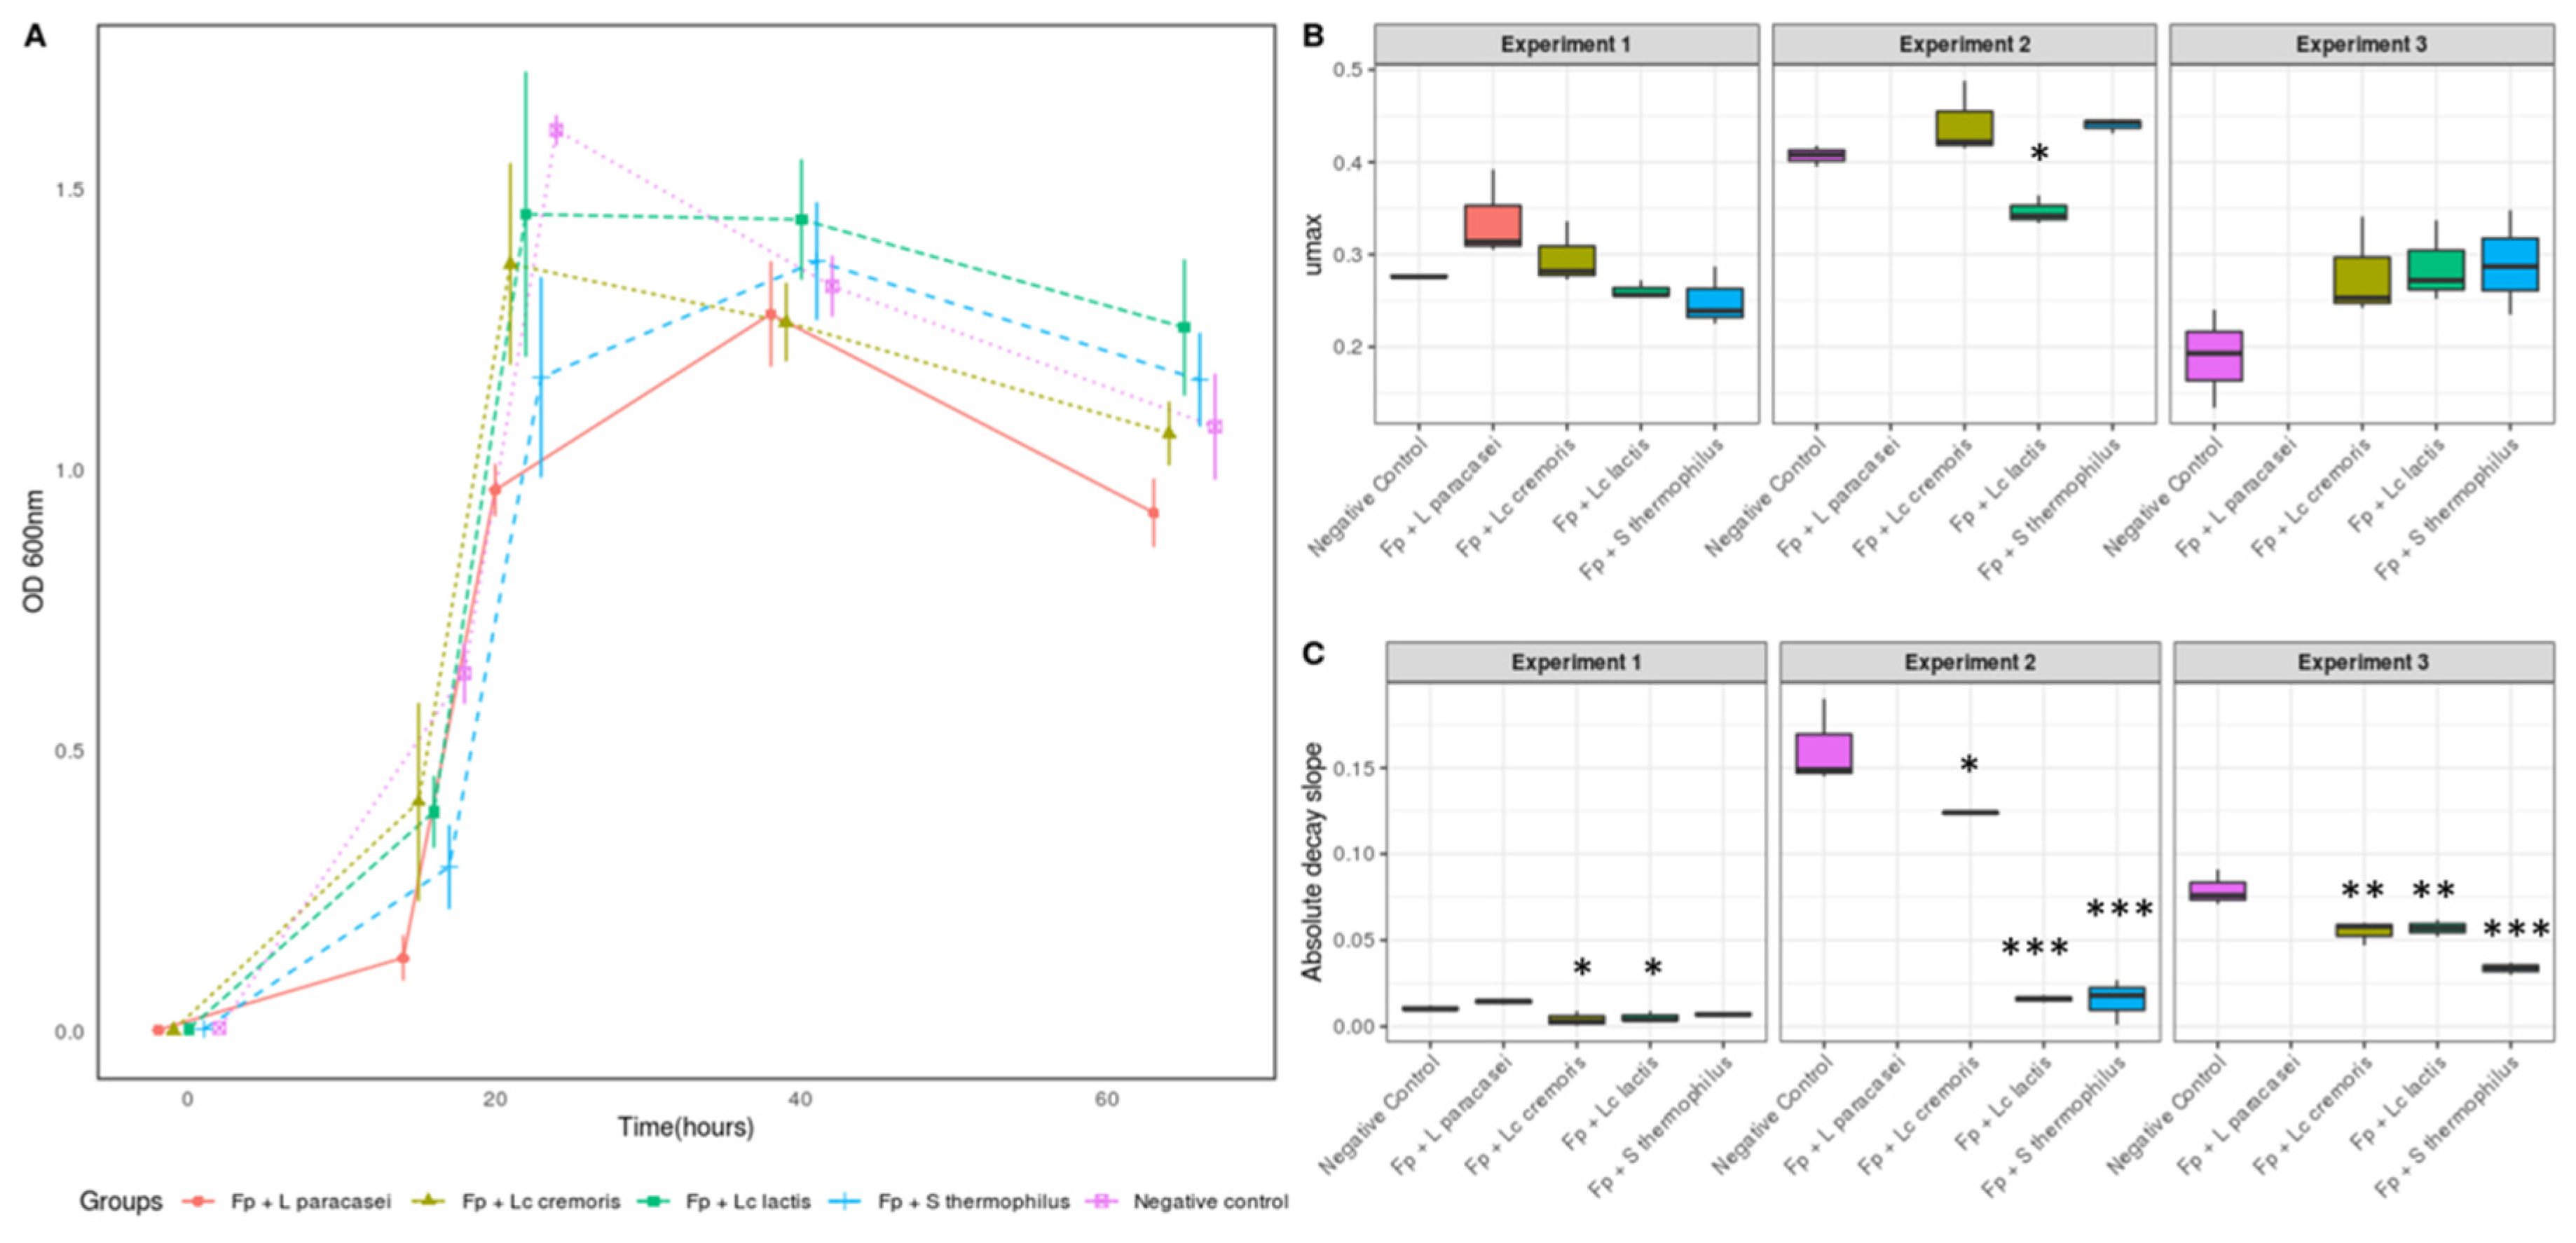
3.1. Selection of Strains Based on the Growth of F. prausnitzii

Thirteen strains of lactic acid bacteria (Lactococcus, Streptococcus, and Lactobacillus) and Bifidobacterium (Table S1) were tested for their capacity to alter F. prausnitzii growth. The effects of the cell-free supernatants from these strains were measured under suboptimal F. prausnitzii growth conditions obtained by removal of the vitamin pool from the growth medium. The F. prausnitzii growth curves (OD600) obtained up to 72 h (Figure S2) allowed us to rank the thirteen strains. We observed that four of them either enhance growth (L. paracasei CNCM I-3689) or delay lysis of F. prausnitzii: L. lactis subsp. lactis CNCM I-1631, L. lactis subsp. cremoris CNCM I-3558, or S. thermophilus CNCM I-3862) compared to the control (F. prausnitzii alone). We selected these four strains to further investigate the metabolic response of F. prausnitzii.

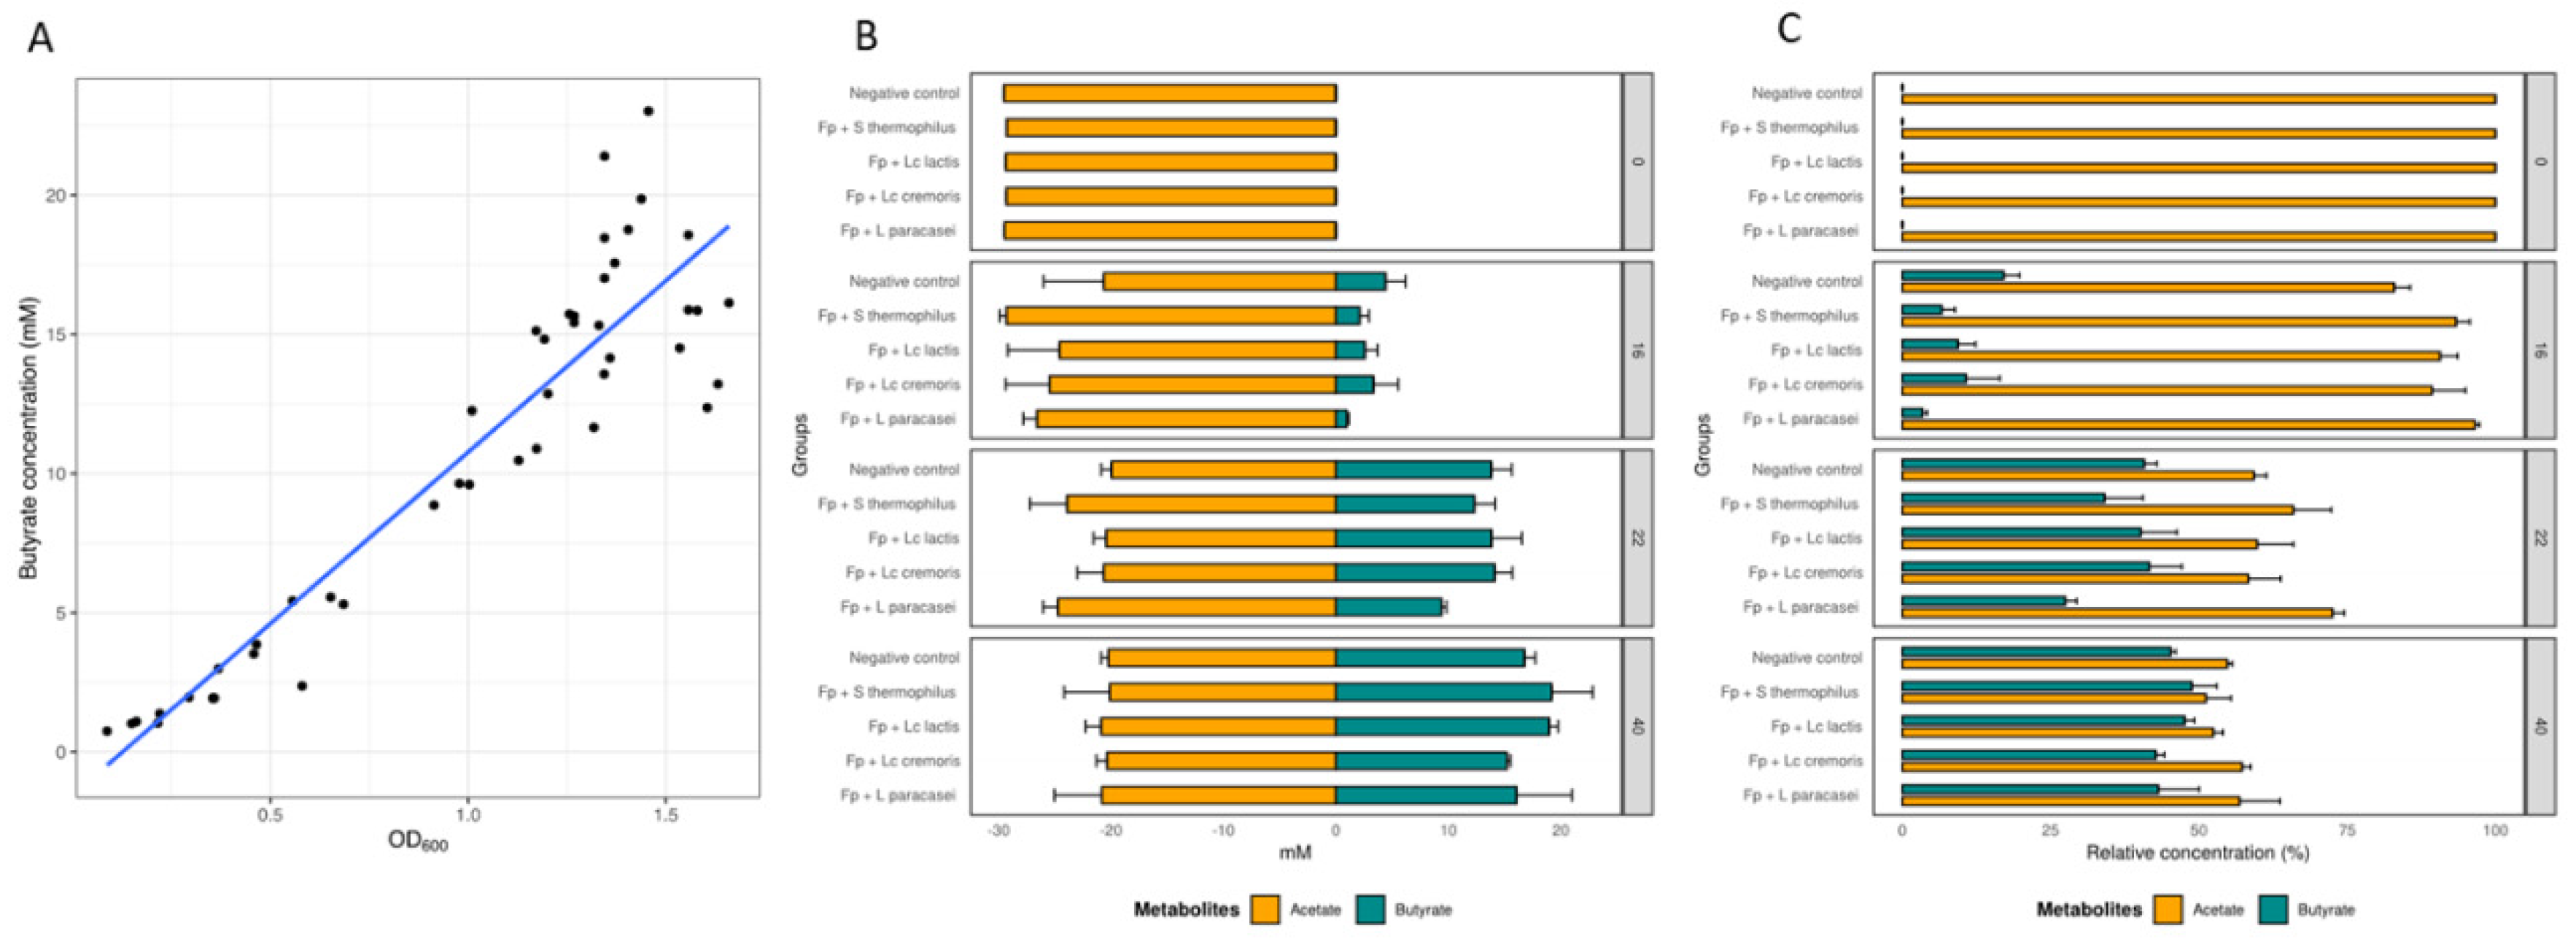
3.2. Growth and Metabolic Response of F. prausnitzii to Cell-Free Supernatants

We co-incubated F. prausnitzii with supernatants of the four selected strains for 65 h and sampled at five timepoints (t = 0 h (T0), t = 16 h (T16), t = 22 h (T22), t = 40 h (T40), and t = 65 h (T65)) (Figure 1A). Maximum growth rate (µmax, ODxh−1) was calculated based on the linear phase of exponential growth (Figure 1B). F. prausnitzii exposed to supernatants of L. paracasei CNCM I-3689 had a higher mean max growth (0.33) followed by L. lactis subsp. cremoris CNCM I-3558 (0.30), Control (0.27), L. lactis subsp. lactis CNCM I-1631 (0.26), and S. thermophilus CNCM I-3862 (0.25). Decay was measured by linear regression between the time point at which maximum growth was reached and the following time point (Figure 1C). The decay was higher for the control and L. paracasei CNCM I-3689, followed by S. thermophilus CNCM I-3862, L. lactis subsp. cremoris CNCM I-3558, and L. lactis subsp. lactis CNCM I-1631. Experiments were reproduced at least three times and yielded similar conclusions that decay was less pronounced following exposure to bacterial supernatants (especially S. thermophilus), than after exposure to control medium.
Recently, a study reported L. paracasei CNCM I-1518 reduced the lysis of F. prausnitzii A2-165 compared to the mono-culture [43]. Other studies based on synthetic communities revealed that F. prausnitzii grows better in presence of other bacterial strains than alone [44,45]. The identification of metabolites able to sustain the growth of butyrate producers is of particular relevance. A recent in vitro study highlighted the auxotrophy of F. prausnitzii for multiple B-vitamins. However, while several auxotrophic butyrate producers for folate or thiamine could benefit from the presence of prototrophic strains, vitamin-independent growth stimulation was observed for F. prausnitzii A2-165, suggesting that it used other growth factors from other bacterial members [29].
Butyrate was measured across cell growth. A regression model was used to assess the correlation between butyrate production and growth. A significant correlation was found between butyrate production and bacterial growth, measured in OD units (R = 0.9233, p-value = 2.2 × 10⁻¹⁶, Figure 2A), consistent with previous findings [14]. Butyrate production in F. prausnitzii is driven mainly by consumption of acetate, and to a smaller degree by other carbon sources (such as glucose) [18]. We therefore monitored the kinetics of acetate consumption, and butyrate production over time (Figure 2B). We found a significant correlation between acetate consumption and butyrate production (R = −0.5179768, p = 0.0001), consistent with the findings of previous studies [14,46]. After adjustment of the linear regression model for time, we found that about 87% (R2 = 0.8664, p= 2.2 × 10⁻¹⁶) of the butyrate produced was generated through acetate consumption in line with other studies (FEEDAP (2012). The rest of the butyrate production (around 13%) may originate from other sources, such as glucose, as previously reported [18]. At T16, most of the butyrate produced by F. prausnitzii originated from acetate for a majority of the supernatants tested. By contrast, F. prausnitzii exposed to S. thermophilus CNCM I-3862 supernatant produced butyrate mostly via an alternative carbon source pathway (such as glucose) at T16, since no change in acetate concentration was observed (Figure 2B). At the final timepoint (T40), acetate consumption and butyrate production were similar in all conditions (p = 0.995 for the acetate and p = 0.373 for the butyrate). Similar findings were observed for their relative abundance (Figure 2C). Butyrate level was the highest in F. prausnitzii exposed to supernatants of S. thermophilus CNCM I-3862 and L. lactis subsp. lactis CNCM I-1631, with butyrate produced by both acetate consumption and via an alternative pathway.
Previous studies reported enhanced butyrate concentrations by different F. prausnitzii strains co-cultured with Bifidobacterium sp including B. adolescentis L2–32 when grown on starch or fructooligosaccharide [19] and B. catenulatum, when grown on fructooligosaccharide [47].

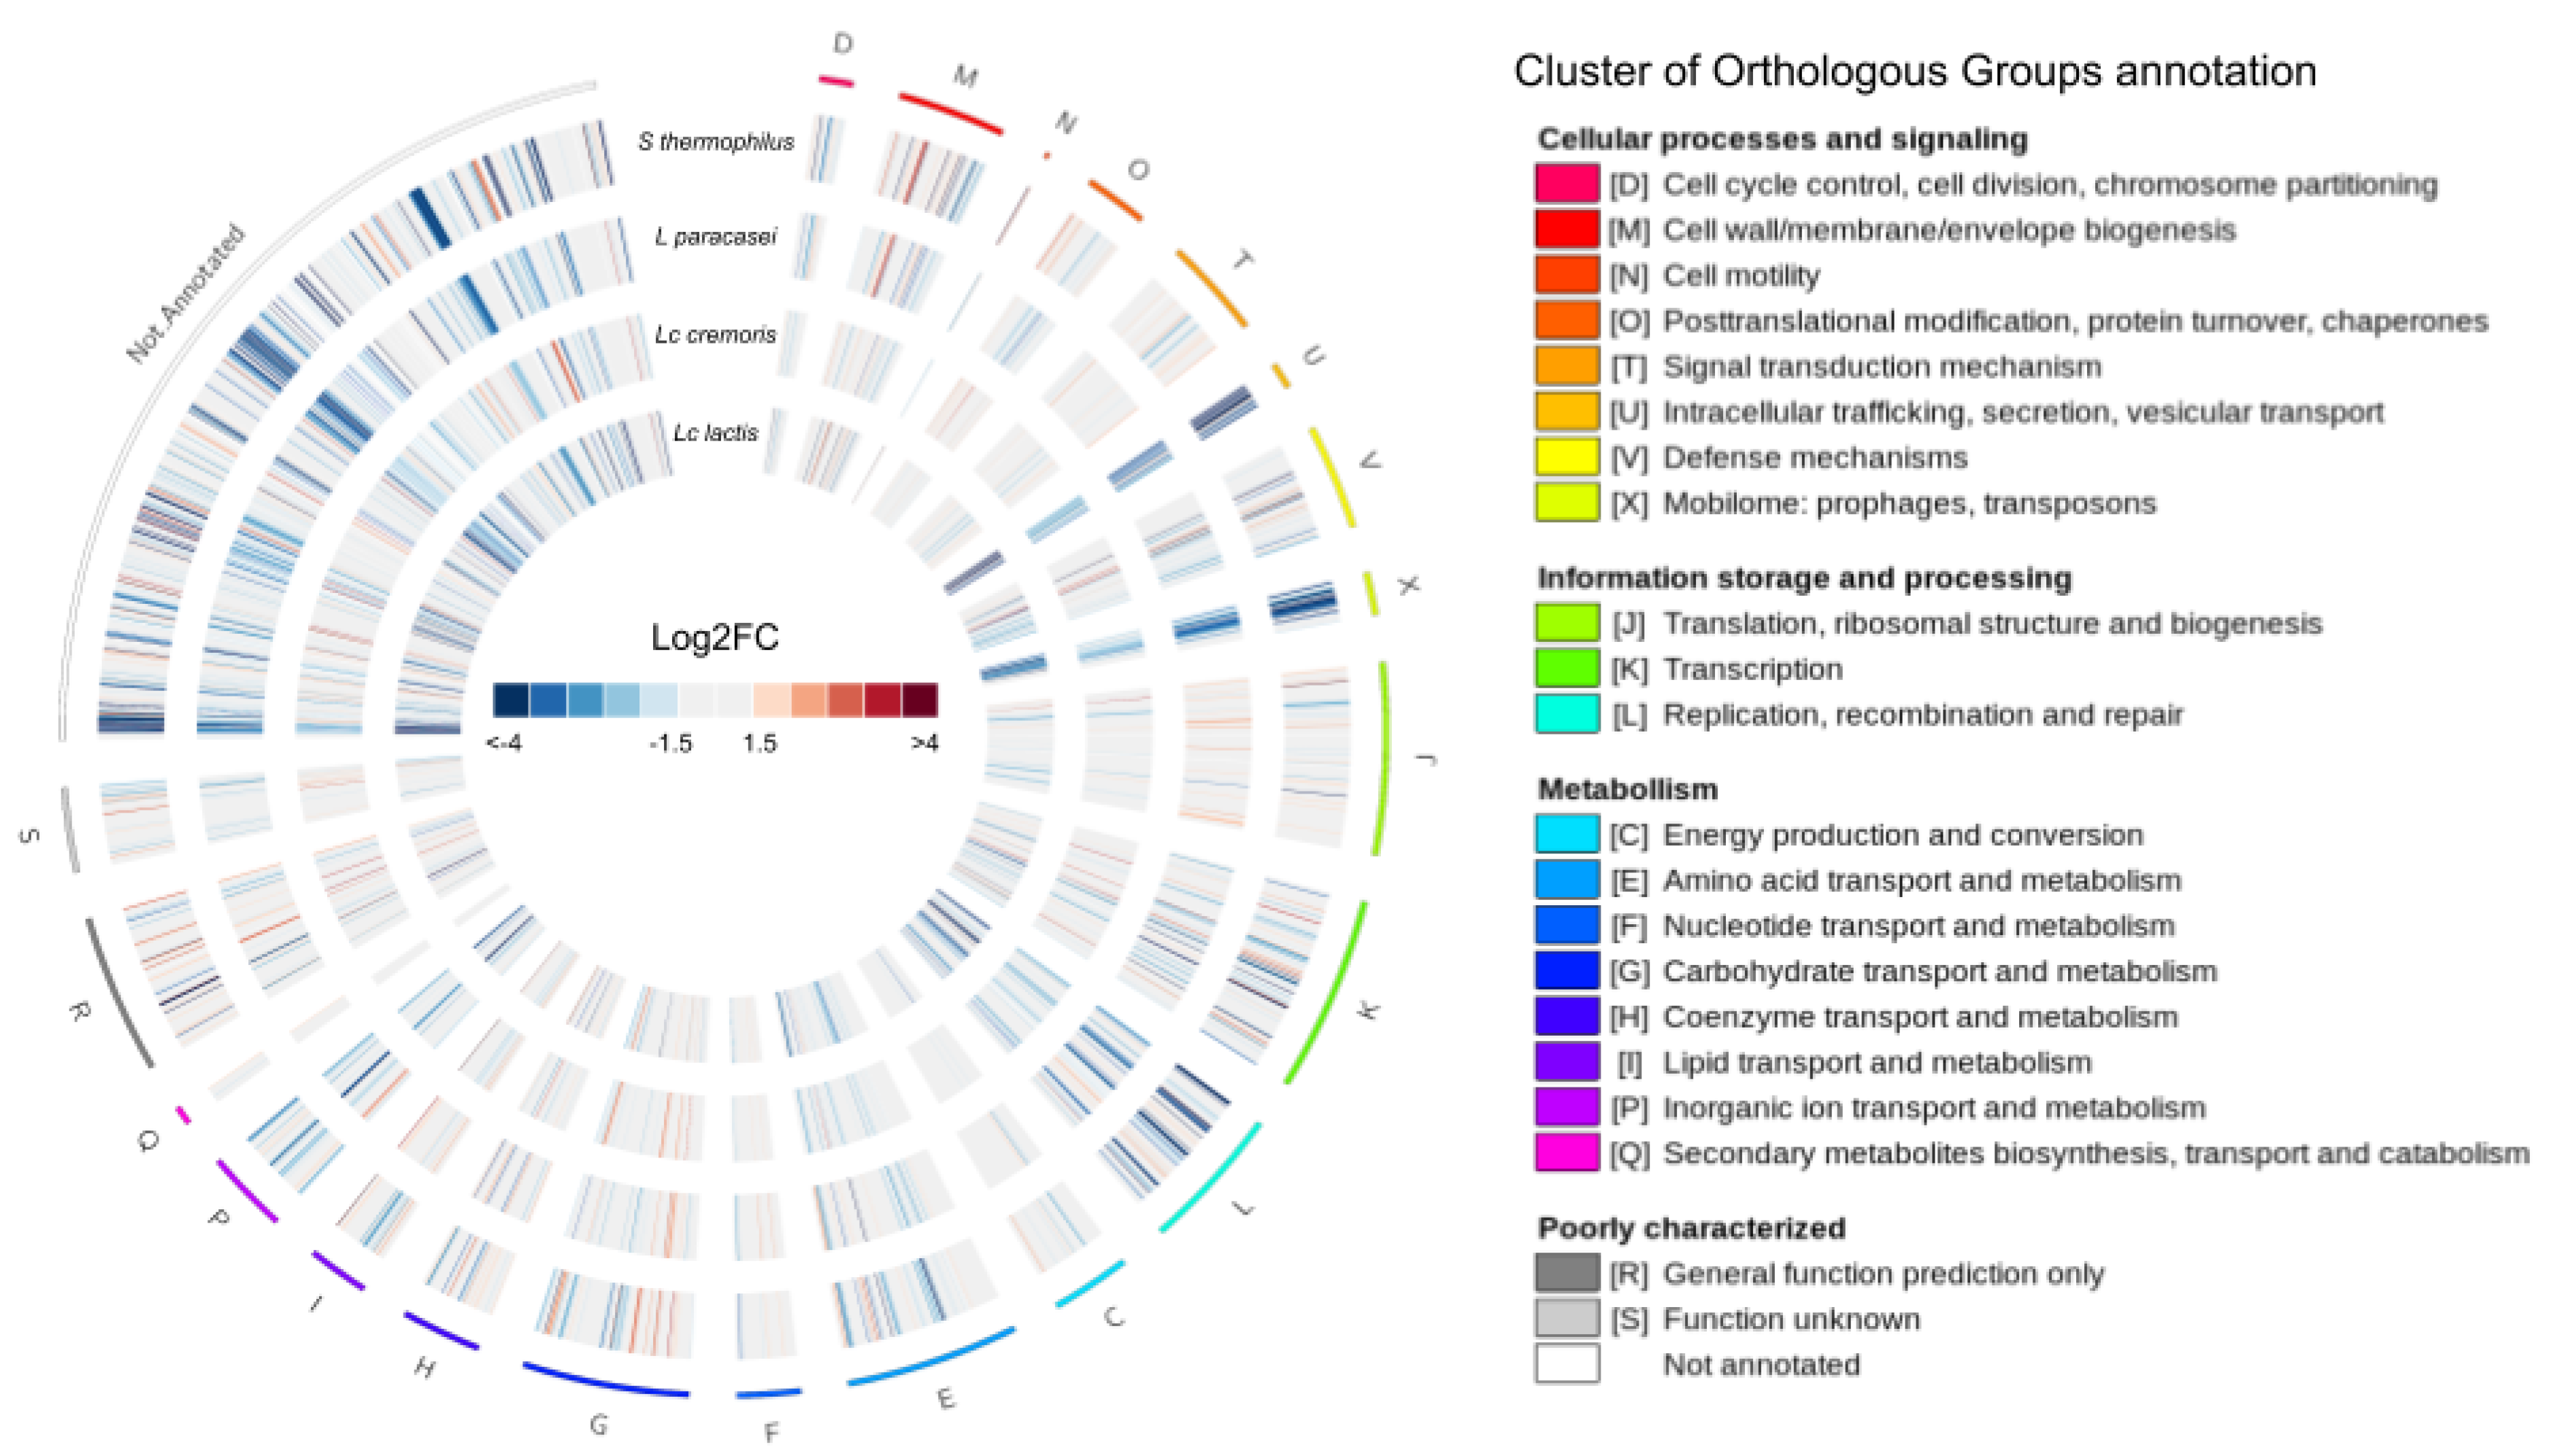
3.3. The Transcriptional Response of F. prausnitzii to Cell-Free Supernatants

We then explored the transcriptional response of F. prausnitzii exposed to different cell-free supernatants, using RNAseq to identify common and specific pathways modulated by cell-free supernatants. We used samples collected at T22 during the exponential growth phase under all five conditions (four supernatants and control).
We performed quality control of the sequences (removal of rRNA, reads with Q < 20 and short reads) and the high-quality reads (around 22.3 ± 1.97 million clean reads per sample or replicate) were mapped against the representative F. prausnitzii A2-165 genome. We were able to map about 98.8 ± 0.46% of the reads onto this genome, of which 85.29 ± 0.98% of reads were mapped against both coding and non-coding annotated RNA elements. However only 63.52 ± 3.57% of the high-quality reads mapped against annotated ORFs in the annotated transcriptome. The fact that almost all the sequences could be mapped onto the genome but that about 15% fewer reads than expected could be mapped onto the whole transcriptome suggests that annotations are still lacking in the GCF_000162015.1 representative genome. Similar observations are found in the literature for other organisms with poorly characterized genomes, such as Akkermansia muciniphila [48].

3.3.1. Differential Expression

2607 of the 2743 genes in the genome (95.04%) were included in the differential expression analysis. A principal component analysis (PCA) plot of normalized counts of the genes included for the differential expression analysis showed separation of the transcriptional response of the F. prausnitzii control from that of F. prausnitzii exposed to supernatants from the four lactic acid bacteria (Figure S3). We chose log2 FC = 1.5, as used in previous studies [49] for detection of differentially expressed genes (DEG). F. prausnitzii exposed to cell-free supernatant from S. thermophilus CNCM I-3862 displayed the strongest transcriptional response, with 22.4% of its genes differentially expressed, followed by L. paracasei CNCM I-3689 (18.8%), L. lactis subsp. lactis CNCM I-1631 (18.7%), and L. lactis subsp cremoris CNCM I-3558 (14.1%) (Table S2 and Figure S4). The magnitude of the DEG response was within the range reported by a similar study of another gut bacterium, Akkermansia muciniphila [48] (Table S3).
Figure 3 summarizes the analysis of differential expression. In this circular plot, the DEGs are circumferentially organized according to the COG functional classification.
The four experimental conditions are presented as concentric rings of log2 FC expression levels. COG families that display the largest numbers of DEGs belonged to the J (Translation, ribosomal structure and biogenesis), K (transcription), L (replication, recombination, and repair), G (carbohydrate transport and metabolism), X (mobilome:prophages, transposons), M (cell wall/membrane/envelope biogenesis), U (intracellular trafficking, secretion, and vesicular transport), and E (amino acid transport and metabolism) categories (Figure S5). A more detailed analysis of the DEGs allowed us to identify common genes and functions affected by exposure of F. prausnitzii to each of the supernatants as well as specific genes and functions only detected as significant in one of the conditions (Figure 4).

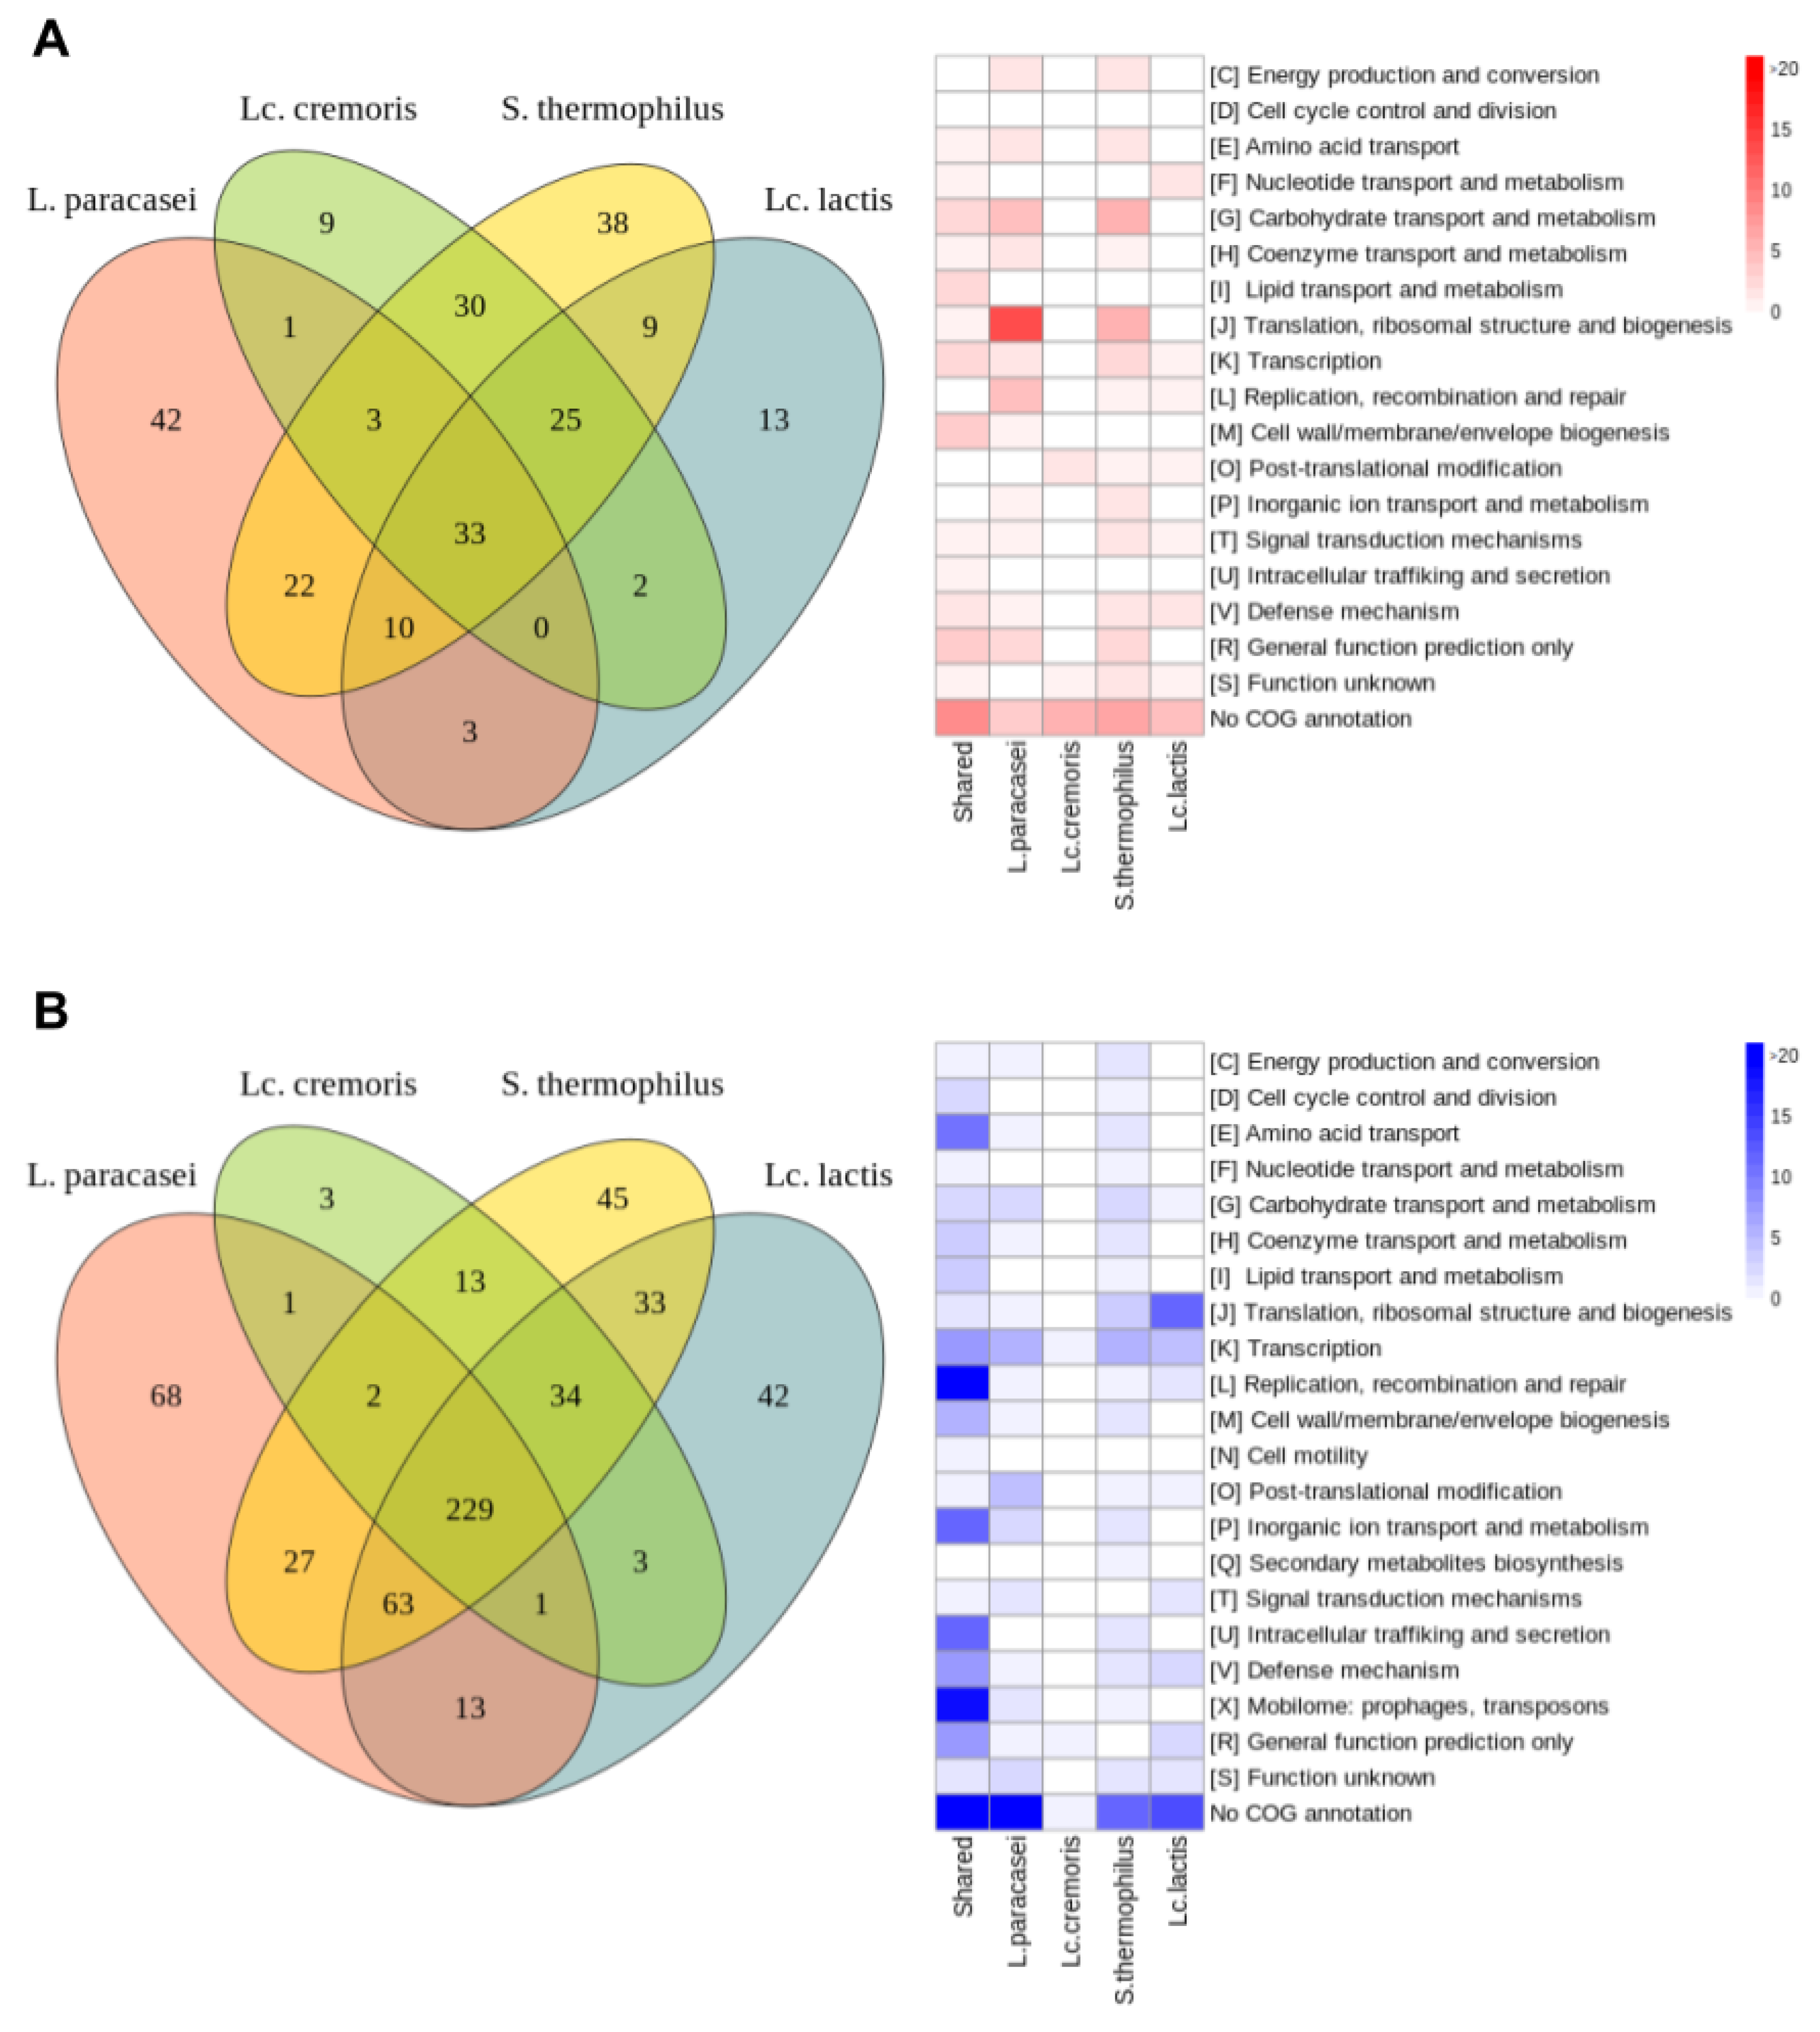
3.3.2. Common Differentially Expressed Genes

We identified 262 genes (9.55% of the 2743 genes in the genome) differentially expressed in all conditions relative to the control (Figure 4). Of these, 33 and 229 were significantly up- and downregulated, respectively. The classification of these genes in COG families revealed that most had no ortholog in the database of annotated genomes, resulting in an unknown/general COG (mostly in the R and S categories) or no annotation (Figure 3). Since some DEG were assigned to known functional categories, we could determine putative impacted functionalities of each of the conditions compared with the control. The most relevant impacted functionalities are described as follows.
  • Common upregulated genes
An analysis of the 33 commonly upregulated DEGs revealed several altered associated functions based on COG family annotation when comparing treatments to control: M (cell wall structure and biogenesis, and outer membrane) with four genes, R (general function) four genes, G (carbohydrate metabolism and transport), I (lipid metabolism) and K (transcription) with three genes each, and V (defense mechanisms) with two genes (Table S4), indicating the effect of the supernatants on metabolism, cell division, and defense of F. prausnitzii.
Focusing on those genes with COG classifications relating to carbohydrate metabolism, we identified the FAEPRAA2165_RS03315 and FAEPRAA2165_RS02585 genes, both encoding beta-galactosidases involved in the metabolism of lactose into galactose. Previous studies showed that F. prausnitzii can metabolize lactose [17]. The MFS transporter annotated FAEPRAA2165_RS03310 gene, and the glycosyltransferase transferase FAEPRAA2165_RS04075, are involved in the putative capsule polysaccharide biosynthesis pathway. Other genes involved in carbohydrate metabolism, including the galactose production pathway and some transporters were affected in all conditions versus control (Table S4).
The significantly up-regulated V genes encoded ABC transporters that might also be involved in other processes, such as capsule polysaccharide biosynthesis, in which they facilitate the transport of molecules. We identified others involved in the putative capsule polysaccharide biosynthesis pathway (FAEPRAA2165_RS04065, a glycosyltransferase) or promoting changes in cell wall composition (FAEPRAA2165_RS09205, D-alanyl-D-alanine carboxypeptidase and FAEPRAA2165_RS09720, N-acetylmuramoyl-L-alanine amidase), suggesting possible modification of the F. prausnitzii cell wall. The cell wall can be remodeled by bacterial hydrolases, amidase, glycosidase (N-acetylglucosaminidases, and lysozymes, or N-acetylmuramidases), or peptidase whose activities are carefully regulated to maintain cell integrity or lead to bacterial lysis [50].
Seven other genes related to carbohydrate metabolism are also involved in the capsule polysaccharide biosynthesis pathway (cell wall, as suggested by Heinken and coworkers [17] (FAEPRAA2165_RS14910, FAEPRAA2165_RS04025, FAEPRAA2165_RS04045, FAEPRAA2165_RS04065, FAEPRAA2165_RS04075, FAEPRAA2165_RS10175, and FAEPRAA2165_RS10180). However, we did not observe a capsule-like structure using India ink staining (data not shown) suggesting that this pathway might be related to other cell wall-related structures. All seven annotated elements had a FC ≥ 1 in all conditions compared to the control, but only some of them were significantly up-regulated (with >1.5 FC and significant p-value, especially in L. paracasei CNCM I-3689 and S. thermophilus CNCM I-3862 supernatants).
The up-regulation of the genes in the putative capsule polysaccharide biosynthesis pathway indicates the relevant role of the cell wall in the stability of the bacteria. The large number of elements related to sugar transport and the aforementioned capsule polysaccharide biosynthesis pathway found to be mainly upregulated, may suggest an increase in the stability of the cell in response to stress, as described in other bacteria [51,52]. Little is currently known about the structure and composition of the cell wall of F. prausnitzii, suggested to either lack lipopolysaccharides (LPS) or have an unusual LPS composition [53,54]. Our results indicate that the cell wall of F. prausnitzii merits further study, especially as the extracellular matrix has been reported to play a role in abolishing the inflammatory response and inflammation on exposure to cultures of dendritic cells and in the mouse model of IBD, respectively [10].
  • Common downregulated genes
About 49.3% of the 229 genes that were downregulated have no known function or are poorly characterized (113 of the 229 genes) (Table S5). The remaining 50.7% of the genes commonly downregulated were related to replication, recombination and repair (COG family L: 23 genes), mobilome (COG family X: 19 genes), inorganic ion transport, and metabolism (COG family P: 12 genes), intracellular trafficking and secretion (COG family U: 12 genes), or amino-acid transport and metabolism (COG family E: 11 genes). Those ORFs involved in the cell division machinery appeared to be less strongly down-regulated than in control conditions compared with other COG category, indicating that the cell adjusted its metabolism towards other functions, such as cell wall biogenesis. Several genes were annotated as TraG and TraD conjugal protein transfer ATPase genes and they were distributed along the F. prausnitzii genome, as previously reported [16]. All of them were found to be downregulated, indicating that secretion and vesicular transport (COG family U) were affected, possibly because these functions are not required at this stage and metabolic efforts are focused on other functions such as extracellular matrix formation. Genes participating in the phage cycle, such as those encoding portal proteins, tail proteins, or integrases are annotated as belonging to the ‘[X] mobilome: phages and transposons’ COG category. They appeared to be commonly downregulated in all four sets of conditions (Table S5). F. prausnitzii is thought to make frequent use of the proteins encoded by these genes, as large numbers of such elements are present in its pangenome [16]. Even though some of these elements are incomplete and inactive, they may play a role in bacterial dynamics through plasticity, by integrating genes from other genomes. Two complete prophages have been described for F. prausnitzii A2-165 (Lagaffe and Mushu). Comparative analysis of the F. prausnitzii A2-165 assembly (GCF_000162015.1) and the reference genomes for both phages revealed that genes ranging from FAEPRAA2165_RS07765 to FAEPRAA2165_RS08075 were assigned to the Lagaffe phage while those from FAEPRAA2165_RS14080 to FAEPRAA2165_RS14325 to the Mushu phage. Interestingly, most of the Lagaffe annotated elements followed the same pattern of down-regulation across all the tested probiotics when compared to the control (39 genes detected as downregulated). We did not find any DEGs commonly downregulated related to the Mushu phage, we only found the transposase FAEPRAA2165_RS14120 down-regulated for the S. thermophilus CNCM I-3862 condition. Interestingly, the observation of reduced mobilome may be relevant as there is an increasing body of evidence that phages are involved in the dynamics of gut microbiota [55] and recent studies call attention to the large number of phages of F. prausnitzii [41].
Overall, these results suggest that the genes commonly upregulated are mostly involved in cell-wall production and modification, whereas those involved in the cell cycle and replication and in the mobilome (phages and transposons) are commonly downregulated, with a specific role for the Lagaffe phage that seems to be less active in all conditions compared with the control culture, consistent with the lower lysis observed.

3.3.3. Specific Differentially Expressed Genes

F. prausnitzii also displayed a specific transcriptome response to bacterial supernatant exposure; specific up- and down-regulated genes designate those elements that are found only significantly up- or down-regulated in one of the four conditions compared to the control condition (Table S6). Despite S. thermophilus supernatant induced the largest number of total DEGs, L. paracasei CNCM I-3689 supernatant induced the strongest specific significant response among all the tested supernatants. In short, F. prausnitzii answer to the exposure of L. paracasei CNCM I-3689 supernatant, may stabilize cell wall formation, through the upregulation some genes involved mainly in peptidoglycan formation, and the inhibition of cell wall degradation genes, as well as reduced stress response due to the repression of several stress-related transcriptional regulators. F. prausnitzii exposed to supernatant of S. thermophilus CNCM I-3862 related to mobilome, defense mechanism based on transporters and cell replication/transcription functions, were more strongly downregulated in this condition than in the others tested, suggesting that the repression of the mobilome could be more pronounced in F. prausnitzii exposed to S. thermophilus CNCM I-3862 supernatant, in line with the lower decay rate observed for the growth curve. While reduced decay observed following L. paracasei CNCM I-3689 might be associated with higher expression of genes related to extracellular matrix, higher repression on mobilome and proteins related to stress response such as chaperones was observed for S. thermophilus CNCM I-3862. F. prausnitzii response to L. lactis subsp. lactis CNCM I-1631 suggests a higher stress response with repressed autophagy genes and chaperone buffering protein. Less specific response was observed for L. lactis subsp. cremoris CNCM I-3558.

4. Conclusions

We have explored the metabolic response of F. prausnitzii to supernatants of a few lactic acid bacteria. Common responses included decrease in expression of genes related to the activity of mobile elements or involved in cell division and increase in expression of genes related to the formation of an extracellular polymer matrix. Our results collectively suggest that metabolites resulting from lactic acid bacteria may modify the metabolism of F. prausnitzii. The responses observed by RNA-seq are consistent with the reduction of decay observed in F. prausnitzii exposed to lactic acid bacteria supernatants. Given the increasing evidence that F. prausnitzii is beneficial to human health, the identification of factors altering its maintenance, both in vitro and in vivo, is of great interest. Finally, our study highlights the relevance of the secretome of lactic acid bacteria as nutritional source for gut microbes. Our findings constitute a first step toward approaches for modulating the growth and metabolic response of F. prausnitzii and pave the way for further high-throughput approaches combined with continuous bacterial growth kinetics.

5. Patents

MD, PG, and ML have a patent application related to this work (International Application No.PCT/EP2015/081148).

Supplementary Materials

The following are available online at https://www.mdpi.com/2076-2607/8/10/1528/s1, Figure S1: Overview of the bioinformatics pipeline used in this study, Figure S2: F. prausnitzii A2-165 growth, as assessed on the basis of the OD600 values for the supernatants with 13 lactic acid bacteria/Bifidobacterium strains. Figure S3: Principal component analysis (PCA) plot of normalized counts of the genes included for the analysis of differential expression for F. prausnitzii exposed to control or cell-free supernatants from the four lactic acid bacteria. Figure S4: Volcano plots representing the differential expression analysis of F. prausnitzii A2-165 genes following exposure to cell-free supernatants. Genes are considered to be differentially expressed in DESeq2 analysis when absolute log2 FoldChange (log 2FC) > 1.5 (red dots). Genes with a significant p-value but a log2 FC < 1.5 are indicated by blue dots and were not considered in the analysis, and genes for which the p-value was not significant are indicated by black dots. Dashed lines indicate the threshold adjusted p-value (y axis) and log2FC (x-axis) for a gene to be classified as indicated above. Figure S5: Bar chart of the number of genes found to be differentially expressed in each condition, classified by COG family. The numbers of genes identified as up- and downregulated are shown in blue and red, respectively. Table S1. List of strains used to generate supernatants and of the commensal strain on which the supernatant was tested. Table S2. Genes identified as differentially expressed (with a log2 FC > 1.5) and the percentage of the total of 2607 genes included in the analysis displaying differential expression in each condition relative to the negative control. The numbers of genes upregulated and downregulated, the total number of genes and the percentage are indicated. Table S3. Genes identified as differentially expressed (with a log2 FC > 2) and the percentage of the total of 2607 genes included in the analysis displaying differential expression in each condition relative to the negative control. The numbers of genes upregulated and downregulated, the total number of genes and the percentage are indicated. Table S4. List of commonly upregulated genes and COG functions. The gene ID, the log2 FC for each of the conditions relative to the negative control, the closest annotated product in the COG database and the COG category of the gene based on the closest annotated product in the COG database are indicated. Table S5. List of commonly downregulated genes and COG functions. The gene ID, the log2 FC for each of the conditions relative to the negative control, the closest annotated product in the COG database and the COG category of the gene based on the closest annotated product in the COG database are indicated. Table S6. List of specific differentially expressed genes (up- and downregulated) and COG functions for each condition. Each sheet shows the gene ID, the log2 FC relative to the negative control, the closest annotated product in the COG database and the COG category of the gene based on the closest annotated product in the COG database and the COG term for each of the conditions.

Author Contributions

Conceptualization, P.G. and M.D.; data curation, D.C. and F.M.C.; formal analysis, M.L. and D.C.; methodology, M.L., P.G., F.M.C., and M.D.; supervision, P.G., F.M.C., and M.D.; writing—original draft, F.M.C. and M.D.; writing—review and editing, M.L., P.G., and D.C. All authors have read and agreed to the published version of the manuscript.

Funding

This research was funded by Danone Nutricia Research.

Acknowledgments

We wish to thank the whole Lifesequencing team for technical and scientific support during this work, Jean-Michel Faurie for helpful discussion.

Conflicts of Interest

M.D., P.G., and M.L. are employees of Danone Nutricia Research. The funder was involved in the design of the study, in the collection, analyses or interpretation of data and in the writing of the manuscript.

References

  1. Qin, J.; Li, R.; Raes, J.; Arumugam, M.; Burgdorf, K.S.; Manichanh, C.; Nielsen, T.; Pons, N.; Levenez, F.; Yamada, T.; et al. A human gut microbial gene catalogue established by metagenomic sequencing. Nature 2010, 464, 59–65. [Google Scholar] [CrossRef] [PubMed] [Green Version]
  2. Hamer, H.M.; Jonkers, D.; Venema, K.; Vanhoutvin, S.; Troost, F.J.; Brummer, R.-J. Review article: The role of butyrate on colonic function. Aliment. Pharmacol. Ther. 2008, 27, 104–119. [Google Scholar] [CrossRef] [PubMed]
  3. Plöger, S.; Stumpff, F.; Penner, G.B.; Schulzke, J.-D.; Gäbel, G.; Martens, H.; Shen, Z.; Günzel, D.; Aschenbach, J.R. Microbial butyrate and its role for barrier function in the gastrointestinal tract. Ann. N. Y. Acad. Sci. 2012, 1258, 52–59. [Google Scholar] [CrossRef] [PubMed] [Green Version]
  4. Sokol, H.; Pigneur, B.; Watterlot, L.; Lakhdari, O.; Bermúdez-Humarán, L.G.; Gratadoux, J.-J.; Blugeon, S.; Bridonneau, C.; Furet, J.-P.; Corthier, G.; et al. Faecalibacterium prausnitzii is an anti-inflammatory commensal bacterium identified by gut microbiota analysis of Crohn disease patients. Proc. Natl. Acad. Sci. USA 2008. [Google Scholar] [CrossRef] [Green Version]
  5. Ferreira-Halder, C.V.; Faria, A.V.d.S.; Andrade, S.S. Action and function of Faecalibacterium prausnitzii in health and disease. Best Pract. Res. Clin. Gastroenterol. 2017, 31, 643–648. [Google Scholar] [CrossRef]
  6. Martín, R.; Chain, F.; Miquel, S.; Lu, J.; Gratadoux, J.-J.; Sokol, H.; Verdu, E.F.; Bercik, P.; Bermúdez-Humarán, L.G.; Langella, P. The commensal bacterium Faecalibacterium prausnitzii is protective in DNBS-induced chronic moderate and severe colitis models. Inflamm. Bowel Dis. 2014, 20, 417–430. [Google Scholar] [CrossRef]
  7. Martín, R.; Miquel, S.; Chain, F.; Natividad, J.M.; Jury, J.; Lu, J.; Sokol, H.; Theodorou, V.; Bercik, P.; Verdu, E.F.; et al. Faecalibacterium prausnitzii prevents physiological damages in a chronic low-grade inflammation murine model. BMC Microbiol. 2015, 15, 67. [Google Scholar] [CrossRef] [Green Version]
  8. Breyner, N.M.; Michon, C.; de Sousa, C.S.; Vilas Boas, P.B.; Chain, F.; Azevedo, V.A.; Langella, P.; Chatel, J.M. Microbial anti-inflammatory molecule (MAM) from Faecalibacterium prausnitzii shows a protective effect on DNBS and DSS-induced colitis model in mice through inhibition of NF-κB pathway. Front. Microbiol. 2017, 8. [Google Scholar] [CrossRef] [Green Version]
  9. Quévrain, E.; Maubert, M.A.; Michon, C.; Chain, F.; Marquant, R.; Tailhades, J.; Miquel, S.; Carlier, L.; Bermúdez-Humarán, L.G.; Pigneur, B.; et al. Identification of an anti-inflammatory protein from Faecalibacterium prausnitzii, a commensal bacterium deficient in Crohn’s disease. Gut 2016, 65, 415–425. [Google Scholar] [CrossRef] [Green Version]
  10. Rossi, O.; Khan, M.T.; Schwarzer, M.; Hudcovic, T.; Srutkova, D.; Duncan, S.H.; Stolte, E.H.; Kozakova, H.; Flint, H.J.; Samsom, J.N.; et al. Faecalibacterium prausnitzii strain HTF-F and its extracellular polymeric matrix attenuate clinical parameters in DSS-Induced colitis. PLoS ONE 2015, 10, e0123013. [Google Scholar] [CrossRef] [Green Version]
  11. Miquel, S.; Martín, R.; Rossi, O.; Bermúdez-Humarán, L.G.; Chatel, J.M.; Sokol, H.; Thomas, M.; Wells, J.M.; Langella, P. Faecalibacterium prausnitzii and human intestinal health. Curr. Opin. Microbiol. 2013, 16, 255–261. [Google Scholar] [CrossRef] [PubMed]
  12. Chen, L.; Collij, V.; Jaeger, M.; van den Munckhof, I.C.L.; Vich Vila, A.; Kurilshikov, A.; Gacesa, R.; Sinha, T.; Oosting, M.; Joosten, L.A.B.; et al. Gut microbial co-abundance networks show specificity in inflammatory bowel disease and obesity. Nat. Commun. 2020, 11, 4018. [Google Scholar] [CrossRef] [PubMed]
  13. Lopez-Siles, M.; Duncan, S.H.; Garcia-Gil, L.J.; Martinez-Medina, M. Faecalibacterium prausnitzii: From microbiology to diagnostics and prognostics. ISME J. 2017, 11, 841–852. [Google Scholar] [CrossRef] [PubMed]
  14. Martín, R.; Miquel, S.; Benevides, L.; Bridonneau, C.; Robert, V.; Hudault, S.; Chain, F.; Berteau, O.; Azevedo, V.; Chatel, J.M.; et al. Functional characterization of novel Faecalibacterium prausnitzii strains isolated from healthy volunteers: A step forward in the use of F. prausnitzii as a next-generation probiotic. Front. Microbiol. 2017, 8, 1226. [Google Scholar] [CrossRef]
  15. Lopez-Siles, M.; Khan, T.M.; Duncan, S.H.; Harmsen, H.J.M.; Garcia-Gil, L.J.; Flint, H.J. Cultured representatives of two major phylogroups of human colonic Faecalibacterium prausnitzii can utilize pectin, uronic acids, and host-derived substrates for growth. Appl. Environ. Microbiol. 2012, 78, 420–428. [Google Scholar] [CrossRef] [Green Version]
  16. Fitzgerald, C.B.; Shkoporov, A.N.; Sutton, T.D.S.; Chaplin, A.V.; Velayudhan, V.; Ross, R.P.; Hill, C. Comparative analysis of Faecalibacterium prausnitzii genomes shows a high level of genome plasticity and warrants separation into new species-level taxa. BMC Genom. 2018, 19, 931. [Google Scholar] [CrossRef] [Green Version]
  17. Heinken, A.; Khan, M.T.; Paglia, G.; Rodionov, D.A.; Harmsen, H.J.M.; Thiele, I. Functional metabolic map of Faecalibacterium prausnitzii, a beneficial human gut microbe. J. Bacteriol. 2014, 196, 3289–3302. [Google Scholar] [CrossRef] [Green Version]
  18. Duncan, S.H.; Holtrop, G.; Lobley, G.E.; Calder, A.G.; Stewart, C.S.; Flint, H.J. Contribution of acetate to butyrate formation by human faecal bacteria. Br. J. Nutr. 2004, 91, 915–923. [Google Scholar] [CrossRef] [Green Version]
  19. Rios-Covian, D.; Gueimonde, M.; Duncan, S.H.; Flint, H.J.; de los Reyes-Gavilan, C.G. Enhanced butyrate formation by cross-feeding between Faecalibacterium prausnitzii and Bifidobacterium adolescentis. Fems Microbiol. Lett. 2015, 362. [Google Scholar] [CrossRef] [Green Version]
  20. Chung, W.S.F.; Meijerink, M.; Zeuner, B.; Holck, J.; Louis, P.; Meyer, A.S.; Wells, J.M.; Flint, H.J.; Duncan, S.H. Prebiotic potential of pectin and pectic oligosaccharides to promote anti-inflammatory commensal bacteria in the human colon. Fems Microbiol. Ecol. 2017, 93. [Google Scholar] [CrossRef]
  21. Chung, W.S.F.; Walker, A.W.; Vermeiren, J.; Sheridan, P.O.; Bosscher, D.; Garcia-Campayo, V.; Parkhill, J.; Flint, H.J.; Duncan, S.H. Impact of carbohydrate substrate complexity on the diversity of the human colonic microbiota. FEMS Microbiol. Ecol. 2018, 95. [Google Scholar] [CrossRef] [PubMed] [Green Version]
  22. Reichardt, N.; Vollmer, M.; Holtrop, G.; Farquharson, F.M.; Wefers, D.; Bunzel, M.; Duncan, S.H.; Drew, J.E.; Williams, L.M.; Milligan, G.; et al. Specific substrate-driven changes in human faecal microbiota composition contrast with functional redundancy in short-chain fatty acid production. ISME J. 2018, 12, 610–622. [Google Scholar] [CrossRef] [PubMed]
  23. Gurry, T.; Dannenberg, P.H.; Finlayson, S.G.; Hughes, T.K.; Macias-Trevino, C.; Owusu-Boaitey, K.; Shomorony, A.; Tuang, S.L.; Valenstein, M.L.; Wang, K.K.; et al. Predictability and persistence of prebiotic dietary supplementation in a healthy human cohort. Sci. Rep. 2018, 8, 12699. [Google Scholar] [CrossRef] [PubMed] [Green Version]
  24. Derrien, M.; van Hylckama Vlieg, J.E.T. Fate, activity, and impact of ingested bacteria within the human gut microbiota. Trends Microbiol. 2015, 23, 354–366. [Google Scholar] [CrossRef] [Green Version]
  25. Belenguer, A.; Duncan, S.H.; Calder, A.G.; Holtrop, G.; Louis, P.; Lobley, G.E.; Flint, H.J. Two routes of metabolic cross-feeding between Bifidobacterium adolescentis and butyrate-producing anaerobes from the human gut. Appl. Environ. Microbiol. 2006, 72, 3593–3599. [Google Scholar] [CrossRef] [Green Version]
  26. Rivière, A.; Selak, M.; Lantin, D.; Leroy, F.; De Vuyst, L. Bifidobacteria and butyrate-producing colon acteria: Importance and strategies for their stimulation in the human gut. Front. Microbiol. 2016, 7. [Google Scholar] [CrossRef] [Green Version]
  27. Castro-Bravo, N.; Wells, J.M.; Margolles, A.; Ruas-Madiedo, P. Interactions of surface exopolysaccharides from Bifidobacterium and Lactobacillus within the intestinal environment. Front. Microbiol. 2018, 9, 2426. [Google Scholar] [CrossRef] [Green Version]
  28. Bello, F.D.; Walter, J.; Hertel, C.; Hammes, W.P. In vitro study of prebiotic properties of levan-type exopolysaccharides from Lactobacilli and non-digestible carbohydrates using denaturing gradient gel electrophoresis. Syst. Appl. Microbiol. 2001, 24, 232–237. [Google Scholar] [CrossRef]
  29. Soto-Martin, E.C.; Warnke, I.; Farquharson, F.M.; Christodoulou, M.; Horgan, G.; Derrien, M.; Faurie, J.M.; Flint, H.J.; Duncan, S.H.; Louis, P. Vitamin biosynthesis by human gut butyrate-producing bacteria and cross-feeding in synthetic microbial communities. mBio 2020, 11. [Google Scholar] [CrossRef]
  30. Kareem, K.Y.; Hooi Ling, F.; Teck Chwen, L.; May Foong, O.; Anjas Asmara, S. Inhibitory activity of postbiotic produced by strains of Lactobacillus plantarum using reconstituted media supplemented with inulin. Gut Pathog. 2014, 6, 23. [Google Scholar] [CrossRef] [Green Version]
  31. Mariam, S.H.; Zegeye, N.; Tariku, T.; Andargie, E.; Endalafer, N.; Aseffa, A. Potential of cell-free supernatants from cultures of selected lactic acid bacteria and yeast obtained from local fermented foods as inhibitors of Listeria monocytogenes, Salmonella spp. and Staphylococcus aureus. BMC Res. Notes 2014, 7, 606. [Google Scholar] [CrossRef] [PubMed] [Green Version]
  32. Zacharof, M.P.; Lovitt, R.W. Bacteriocins produced by lactic acid bacteria a review article. Apcbee Procedia 2012, 2, 50–56. [Google Scholar] [CrossRef] [Green Version]
  33. Martin, M. Cutadapt removes adapter sequences from high-throughput sequencing reads. EMBnet J. 2011, 17, 3. [Google Scholar] [CrossRef]
  34. Kopylova, E.; Noé, L.; Touzet, H. SortMeRNA: Fast and accurate filtering of ribosomal RNAs in metatranscriptomic data. Bioinformatics 2012, 28, 3211–3217. [Google Scholar] [CrossRef] [PubMed]
  35. Dobin, A.; Davis, C.A.; Schlesinger, F.; Drenkow, J.; Zaleski, C.; Jha, S.; Batut, P.; Chaisson, M.; Gingeras, T.R. STAR: Ultrafast universal RNA-seq aligner. Bioinformatics (Oxford, England) 2013, 29, 15–21. [Google Scholar] [CrossRef] [PubMed]
  36. Love, M.I.; Huber, W.; Anders, S. Moderated estimation of fold change and dispersion for RNA-seq data with DESeq2. Genome Biol 2014, 15, 550. [Google Scholar] [CrossRef] [Green Version]
  37. Galperin, M.Y.; Makarova, K.S.; Wolf, Y.I.; Koonin, E.V. Expanded microbial genome coverage and improved protein family annotation in the COG database. Nucleic Acids Res. 2015, 43, D261–D269. [Google Scholar] [CrossRef]
  38. Altschul, S.F.; Gish, W.; Miller, W.; Myers, E.W.; Lipman, D.J. Basic local alignment search tool. J. Mol. Biol. 1990, 215, 403–410. [Google Scholar] [CrossRef]
  39. Zhang, H.; Yohe, T.; Huang, L.; Entwistle, S.; Wu, P.; Yang, Z.; Busk, P.K.; Xu, Y.; Yin, Y. dbCAN2: A meta server for automated carbohydrate-active enzyme annotation. Nucleic Acids Res. 2018, 46, W95–W101. [Google Scholar] [CrossRef] [Green Version]
  40. Kanehisa, M.; Sato, Y.; Morishima, K. BlastKOALA and GhostKOALA: KEGG tools for functional characterization of genome and metagenome sequences. J. Mol. Biol. 2016, 428, 726–731. [Google Scholar] [CrossRef] [Green Version]
  41. Cornuault, J.K.; Petit, M.-A.; Mariadassou, M.; Benevides, L.; Moncaut, E.; Langella, P.; Sokol, H.; De Paepe, M. Phages infecting Faecalibacterium prausnitzii belong to novel viral genera that help to decipher intestinal viromes. Microbiome 2018, 6, 65. [Google Scholar] [CrossRef] [PubMed]
  42. Krzywinski, M.; Schein, J.; Birol, I.; Connors, J.; Gascoyne, R.; Horsman, D.; Jones, S.J.; Marra, M.A. Circos: An information aesthetic for comparative genomics. Genome Res. 2009, 19, 1639–1645. [Google Scholar] [CrossRef] [PubMed] [Green Version]
  43. Fehlbaum, S.; Chassard, C.; Schwab, C.; Voolaid, M.; Fourmestraux, C.; Derrien, M.; Lacroix, C. In vitro study of Lactobacillus paracasei CNCM I-1518 in healthy and Clostridioides difficile colonized elderly gut microbiota. Front. Nutr. 2019, 6. [Google Scholar] [CrossRef] [PubMed]
  44. D’Hoe, K.; Vet, S.; Faust, K.; Moens, F.; Falony, G.; Gonze, D.; Lloréns-Rico, V.; Gelens, L.; Danckaert, J.; De Vuyst, L.; et al. Integrated culturing, modeling and transcriptomics uncovers complex interactions and emergent behavior in a three-species synthetic gut community. eLife 2018, 7, e37090. [Google Scholar] [CrossRef]
  45. Venturelli, O.S.; Carr, A.V.; Fisher, G.; Hsu, R.H.; Lau, R.; Bowen, B.P.; Hromada, S.; Northen, T.; Arkin, A.P. Deciphering microbial interactions in synthetic human gut microbiome communities. Mol. Syst. Biol. 2018, 14, e8157. [Google Scholar] [CrossRef]
  46. Foditsch, C.; Santos, T.M.A.; Teixeira, A.G.V.; Pereira, R.V.V.; Dias, J.M.; Gaeta, N.; Bicalho, R.C. Isolation and characterization of Faecalibacterium prausnitzii from calves and piglets. PLoS ONE 2015, 9, e116465. [Google Scholar] [CrossRef] [Green Version]
  47. Kim, H.; Jeong, Y.; Kang, S.; You, H.J.; Ji, G.E. Co-Culture with Bifidobacterium catenulatum improves the growth, gut colonization, and butyrate production of Faecalibacterium prausnitzii: In vitro and in vivo studies. Microorganisms 2020, 8, 8. [Google Scholar] [CrossRef]
  48. Chia, L.W.; Hornung, B.V.H.; Aalvink, S.; Schaap, P.J.; de Vos, W.M.; Knol, J.; Belzer, C. Deciphering the trophic interaction between Akkermansia muciniphila and the butyrogenic gut commensal Anaerostipes caccae using a metatranscriptomic approach. Antonie Van Leeuwenhoek 2018, 111, 859–873. [Google Scholar] [CrossRef] [Green Version]
  49. Crost, E.H.; Le Gall, G.; Laverde-Gomez, J.A.; Mukhopadhya, I.; Flint, H.J.; Juge, N. Mechanistic insights into the cross-feeding of Ruminococcus gnavus and Ruminococcus bromii on host and dietary carbohydrates. Front. Microbiol. 2018, 9. [Google Scholar] [CrossRef] [Green Version]
  50. Vermassen, A.; Leroy, S.; Talon, R.; Provot, C.; Popowska, M.; Desvaux, M. Cell wall hydrolases in bacteria: Insight on the diversity of cell wall amidases, glycosidases and peptidases toward peptidoglycan. Front. Microbiol. 2019, 10. [Google Scholar] [CrossRef]
  51. Reith, J.; Mayer, C. Peptidoglycan turnover and recycling in Gram-positive bacteria. Appl. Microbiol. Biotechnol. 2011, 92, 1. [Google Scholar] [CrossRef] [PubMed]
  52. Scheffers, D.-J.; Pinho, M.G. Bacterial cell wall synthesis: New insights from localization studies. Microbiol. Mol. Biol. Rev. 2005, 69, 585–607. [Google Scholar] [CrossRef] [PubMed] [Green Version]
  53. Miquel, S.; Martín, R.; Bridonneau, C.; Robert, V.; Sokol, H.; Bermúdez-Humarán, L.G.; Thomas, M.; Langella, P. Ecology and metabolism of the beneficial intestinal commensal bacterium Faecalibacterium prausnitzii. Gut Microbes 2014, 5, 146–151. [Google Scholar] [CrossRef] [PubMed] [Green Version]
  54. Jantzen, E.; Hofstad, T. Fatty acids of Fusobacterium species: Taxonomic implications. J. Gen. Microbiol. 1981, 123, 163–171. [Google Scholar] [CrossRef] [PubMed] [Green Version]
  55. Mills, S.; Shanahan, F.; Stanton, C.; Hill, C.; Coffey, A.; Ross, R.P. Movers and shakers: Influence of bacteriophages in shaping the mammalian gut microbiota. Gut Microbes 2013, 4, 4–16. [Google Scholar] [CrossRef] [PubMed]
Figure 1. F. prausnitzii growth exposed to cell-free supernatants of lactic acid bacteria (A) F. prausnitzii A2-165 growth, as assessed on the basis of the OD600 values for the supernatants with the highest activity (L. paracasei CNCM I-3689, L. lactis subsp. cremoris CNCM I-3558 (Lc. cremoris), L. lactis subsp. lactis CNCM I-1631 (Lc. lactis), and S. thermophilus CNCM I-3862) and the negative control. The mean and SD for replicates are indicated for each timepoint. (B) Maximum growth rate (μmax) and (C) decay observed of F. prausnitzii A2-165 in three independent biological experiments (three technical replicates per experiment). * p < 0.05, ** p ≤ 0.01, *** p ≤ 0.001 versus control group, based on Anova followed by Tukey test.
Microorganisms 08 01528 g001
Figure 2. Acetate and butyrate levels of cultures of F. prausnitzii exposed to cell-free supernatants. (A) Correlation of butyrate production and growth over time (R2 = 0.8664, p= 2.2 × 10⁻¹⁶). (B) Acetate consumption and butyrate production (concentrations in mM) and (C) proportion at 16, 22, and 40 h of incubation. Measurements were performed for three replicates; the mean and SD are shown.
Microorganisms 08 01528 g002
Figure 3. Circular representation of the differentially expressed genes (DEGs) in each of the functional categories. The Cluster of Orthologous Groups of proteins (COG) categories and the log2FC of the genes in each category are indicated. From outside to inside, we have the DEGs for L. paracasei CNCM I-3689, L. lactis subsp. lactis CNCM I-1631, L. lactis subsp. cremoris CNCM I-3558, and S. thermophilus CNCM I-3862.
Microorganisms 08 01528 g003
Figure 4. Transcriptional response of F. prausnitzii to cell-free supernatants. Venn diagrams of differentially expressed (A) upregulated and (B) downregulated genes. Gene functions, based on the COG classification, are shown in a heatmap to the right of the Venn diagrams for the upregulated and downregulated genes. The heatmap colors indicate the number of genes for each category of the COG classification.
Microorganisms 08 01528 g004

