Potential Control of Mycotoxigenic Fungi and Ochratoxin A in Stored Coffee Using Gaseous Ozone Treatment
Abstract
1. Introduction
2. Materials and Methods
2.1. Fungal Species and Strains Used in These Studies
2.2. Spore Suspensions of the Ochratoxigenic Species for Inoculation of Coffee Beans
2.3. Development of the Moisture Adsoprtion Curves for Natural and Irradiated Green Coffee Beans
2.4. Ozone Generation, Measurement, and Exposure of Coffee Treatments
2.5. Effect of Gaseous O3 Treatment on Fungal Populations and Ochratoxin A Contamination of Stored Coffee Beans Inoculated with Each Individual Ochratoxigenic Species
2.6. Effect of O3 on the Total Fungal Populations in Naturally Contaminated Coffee Beans and That Inoculated with a Mixture of the Three Ochratoxigenic Species
2.6.1. Effects of O3 on Fungal Populations in Naturally Contaminated Green Coffee Beans
2.6.2. Effect of O3 on Naturally Contaminated Coffee Beans with Additional Mixed Inoculum of the Three Ochratoxigenic Species
2.7. Ochratoxin A Extraction and Quantification
- Mobile Phase Acetonitrile (57%): Water (41%): Acetic acid (2%)
- Column 120CC-C18 column (Poroshell 120, length 100 mm, diameter 4.6 mm, particle size 2.7 micron; 600 Bar)
- Temperature of column: 25 °C
- Excitation: 330 nm
- Emission: 460 nm
- Flow rate: 1 mL min−l
- Volume of sample injected: 20 µL
- Retention time: Approximately 2.49 min
- Run time: 17 min
- Limit of detection: 0.01 ng g−1
- Limit of Quantification: 0.039 ng g−1
2.8. Statistical Analyses
3. Results
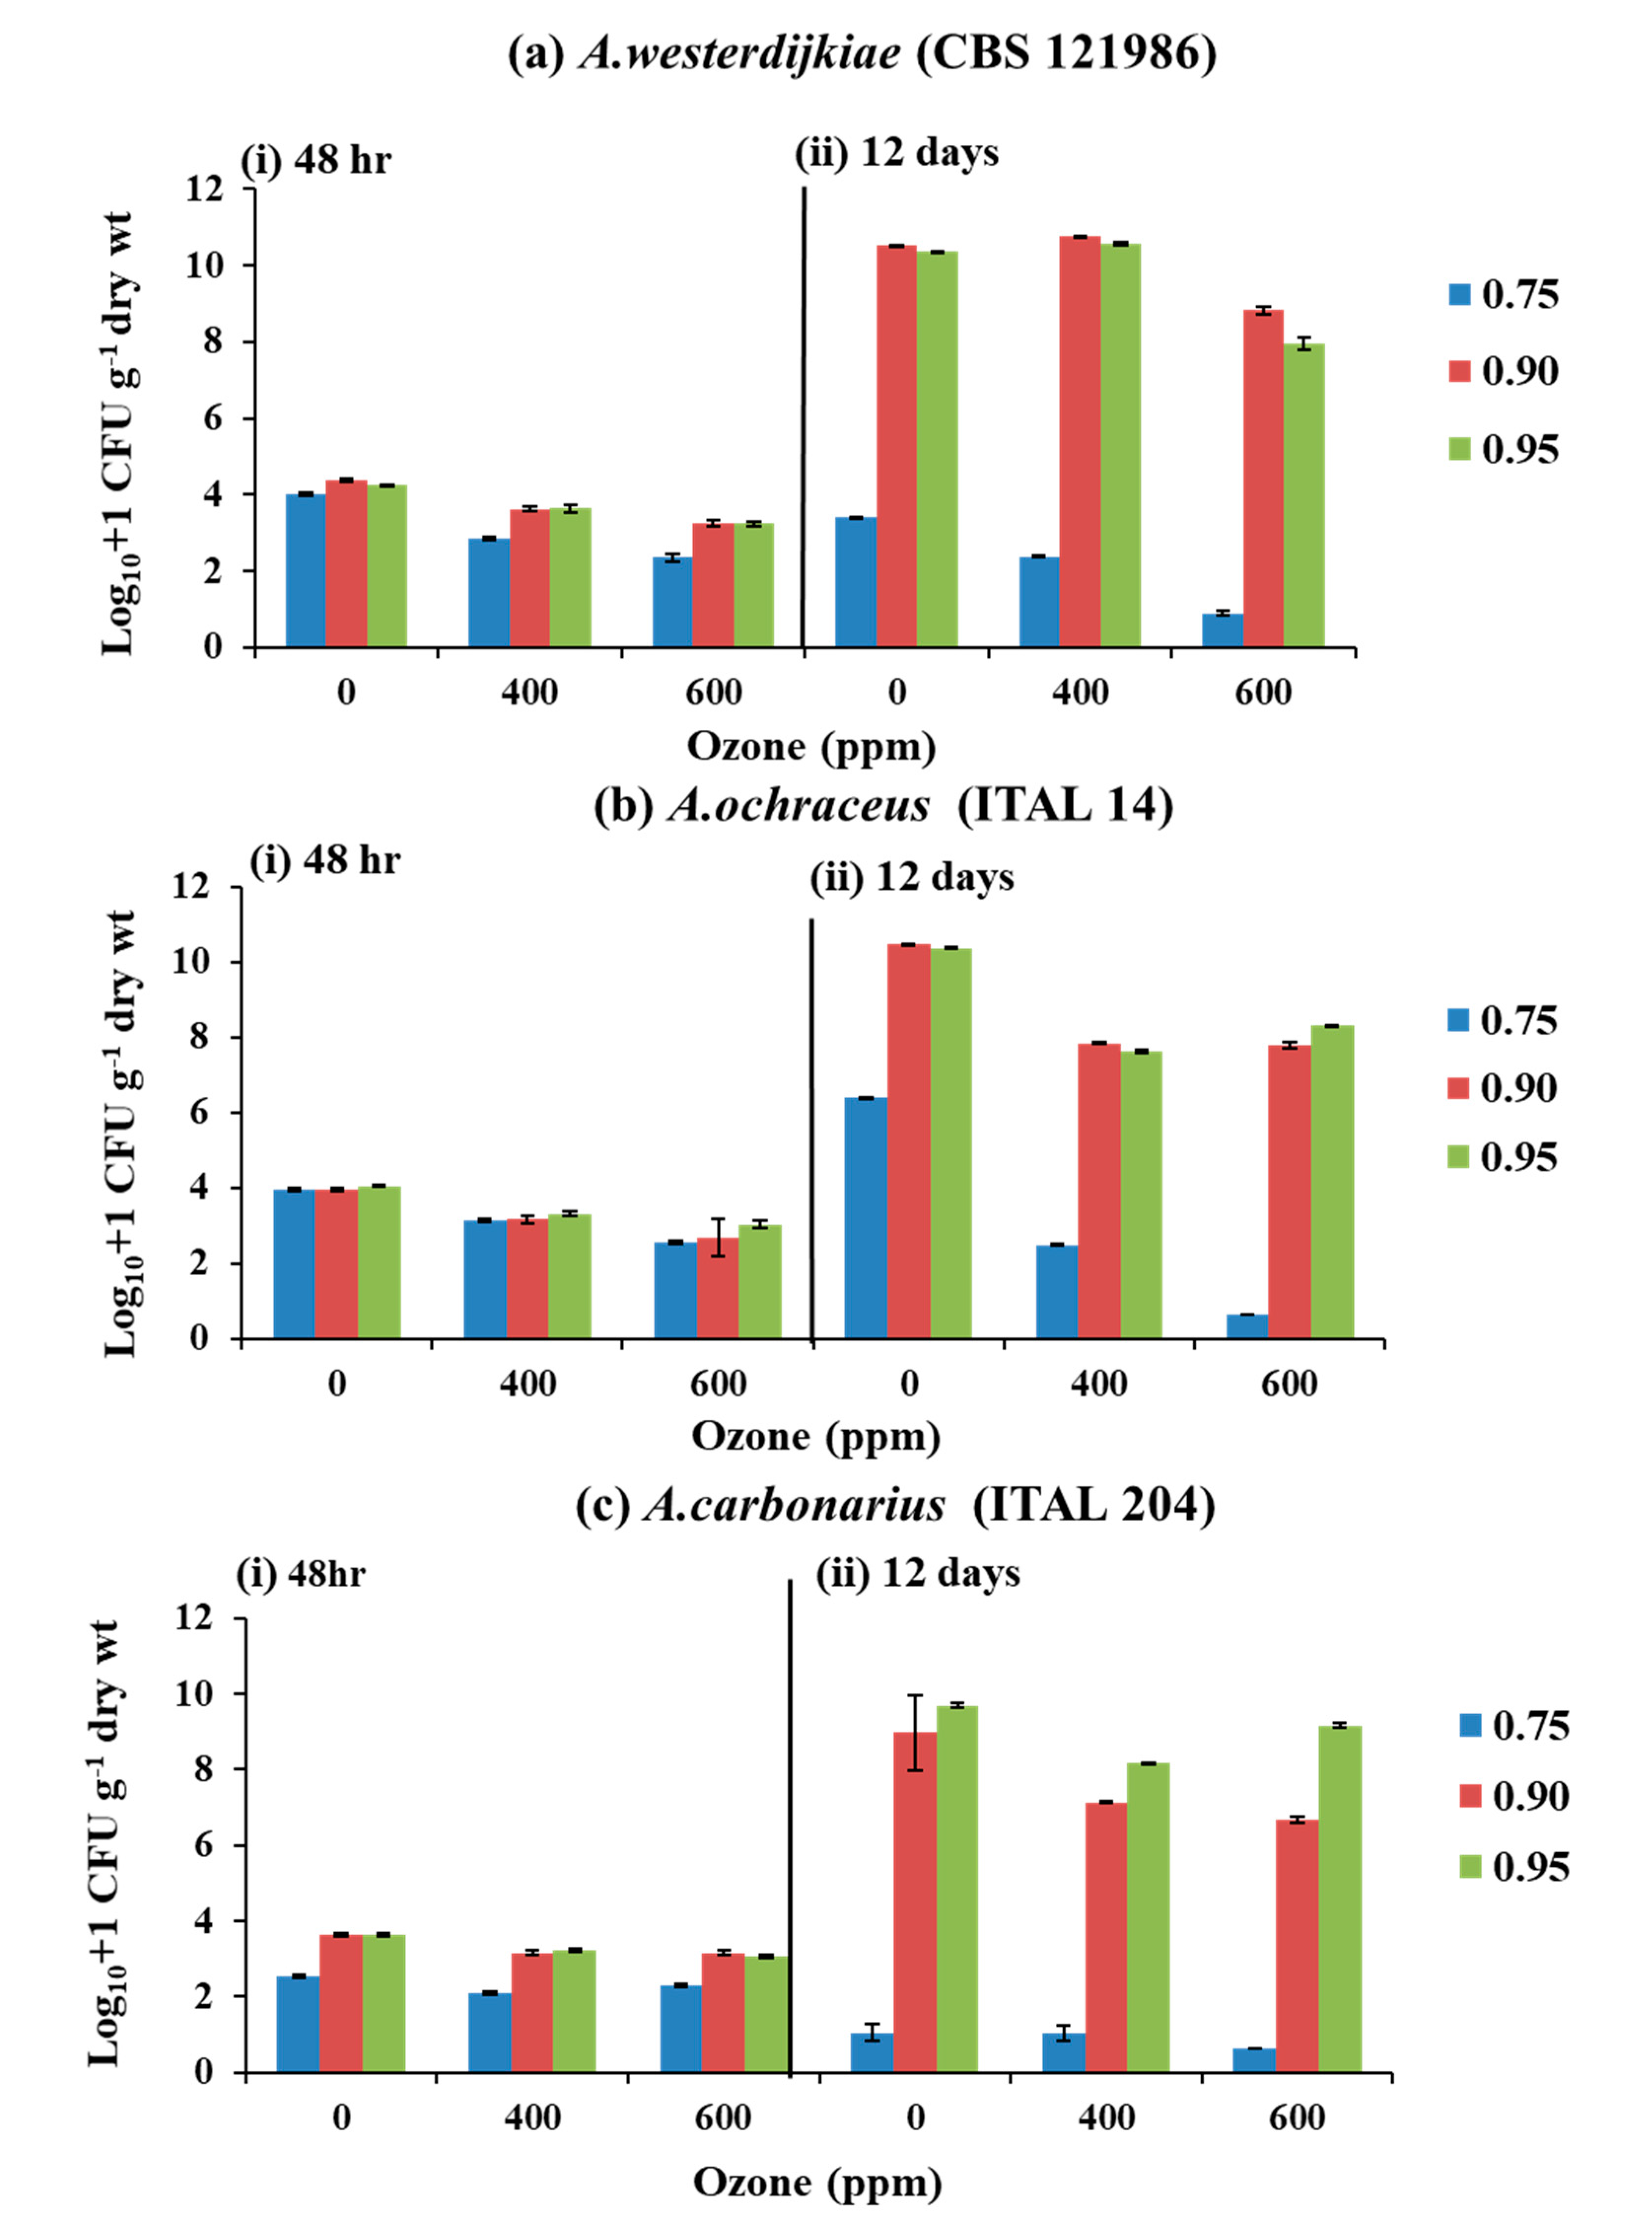
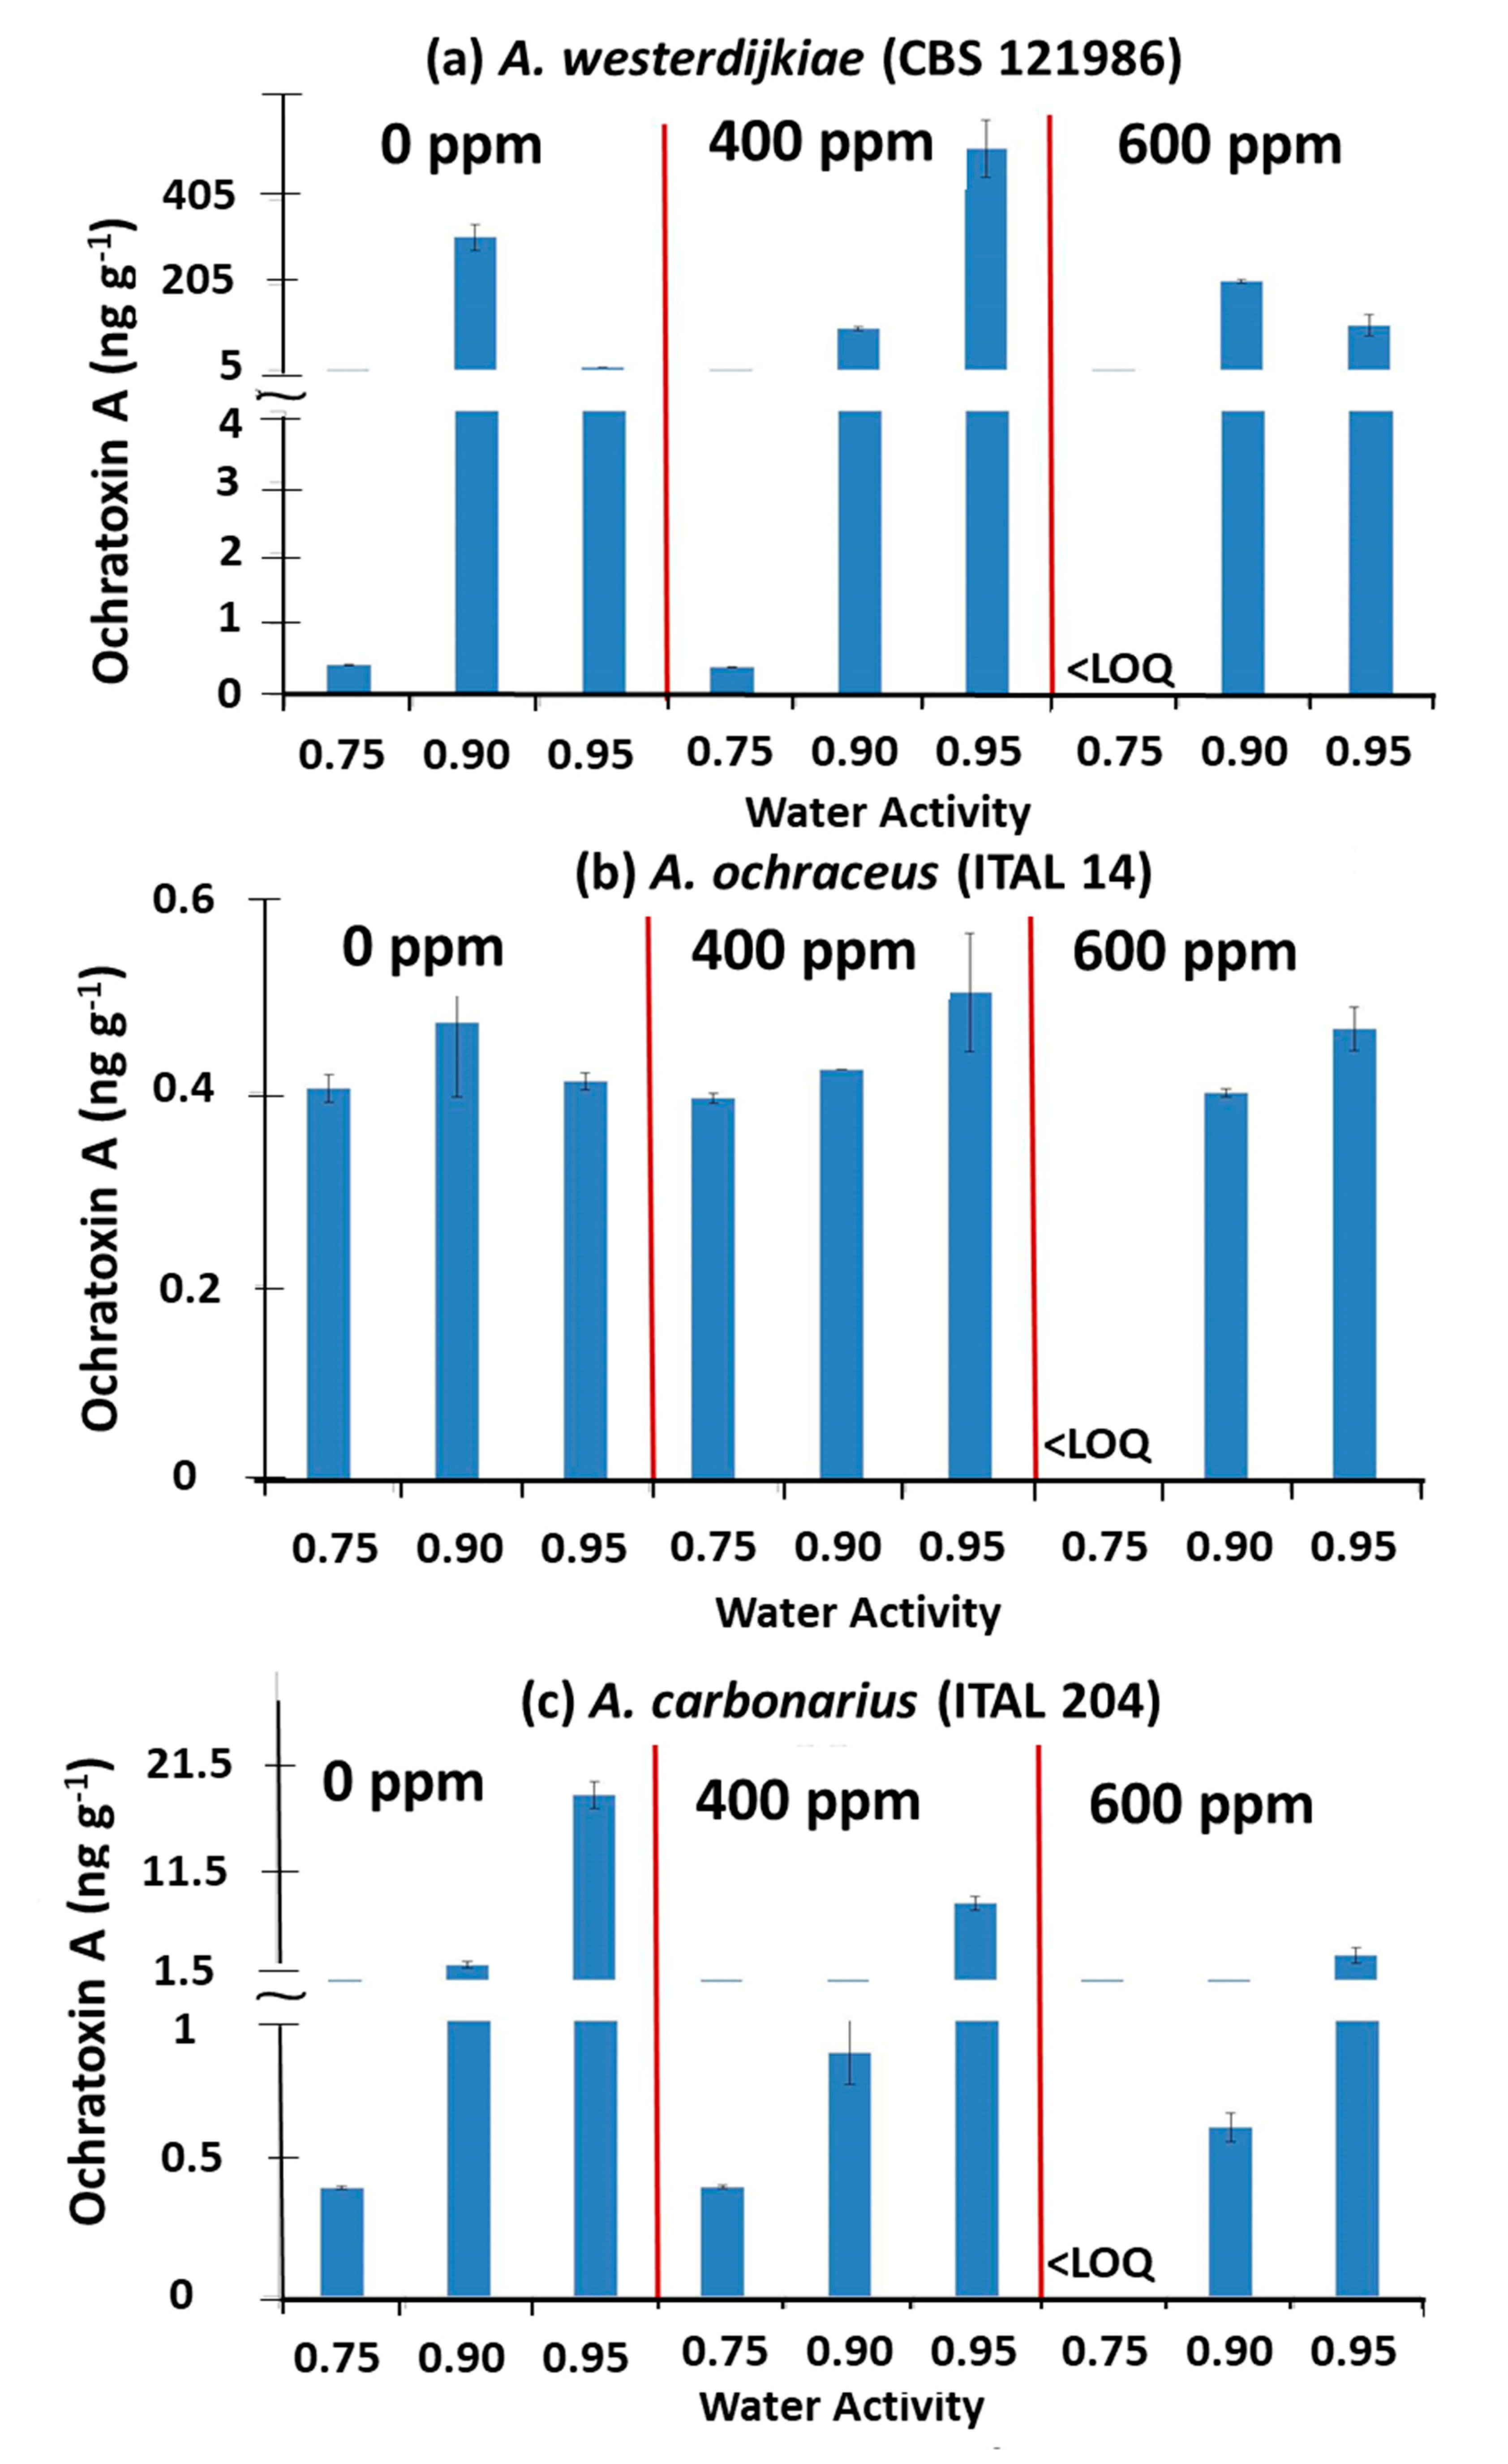
3.1. Effect of O3 × aw on Populations and Ochratoxin A Contamination of Irradiated Stored Coffee Beans Inoculated with Individual Inocula of A. westerdijkiae, A. ochraceus, and A. carbonarius
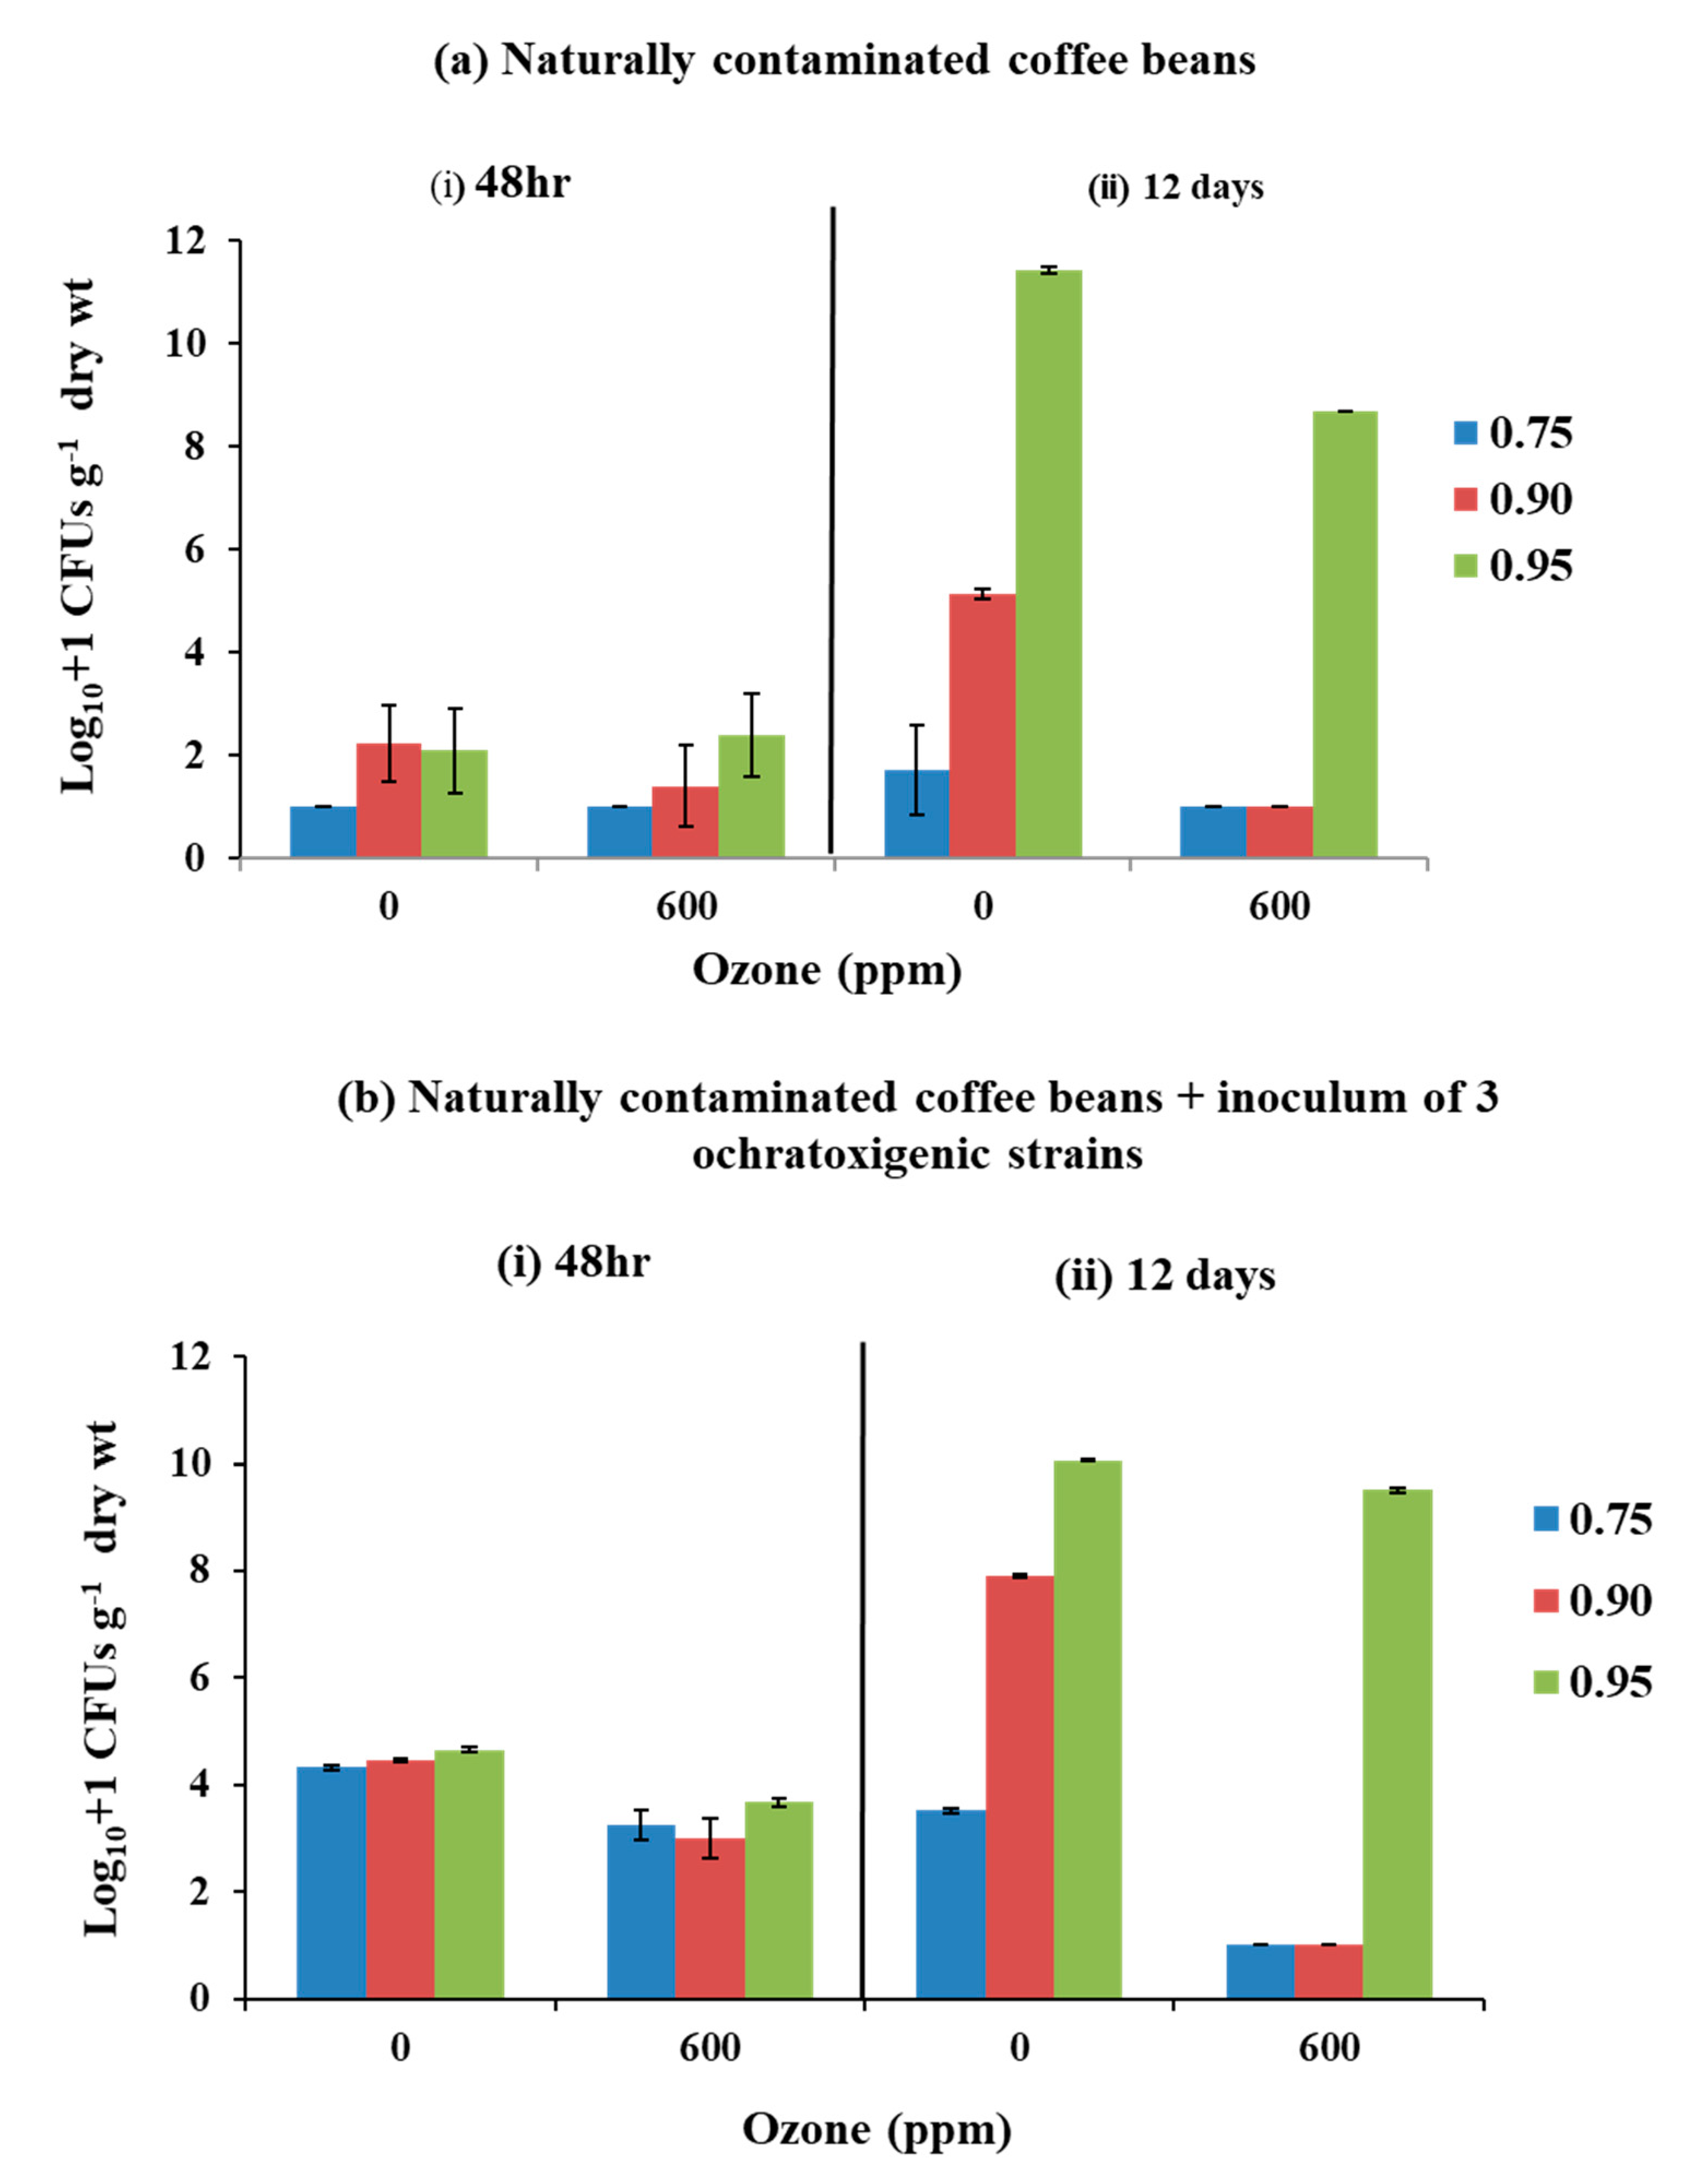
3.2. Efficacy of O3 Treatment on Fungal Populations Isolated from Naturally Contaminated and That Inoculated with a Mixture of the Three Ochratoxigenic Species in Stored Coffee Beans
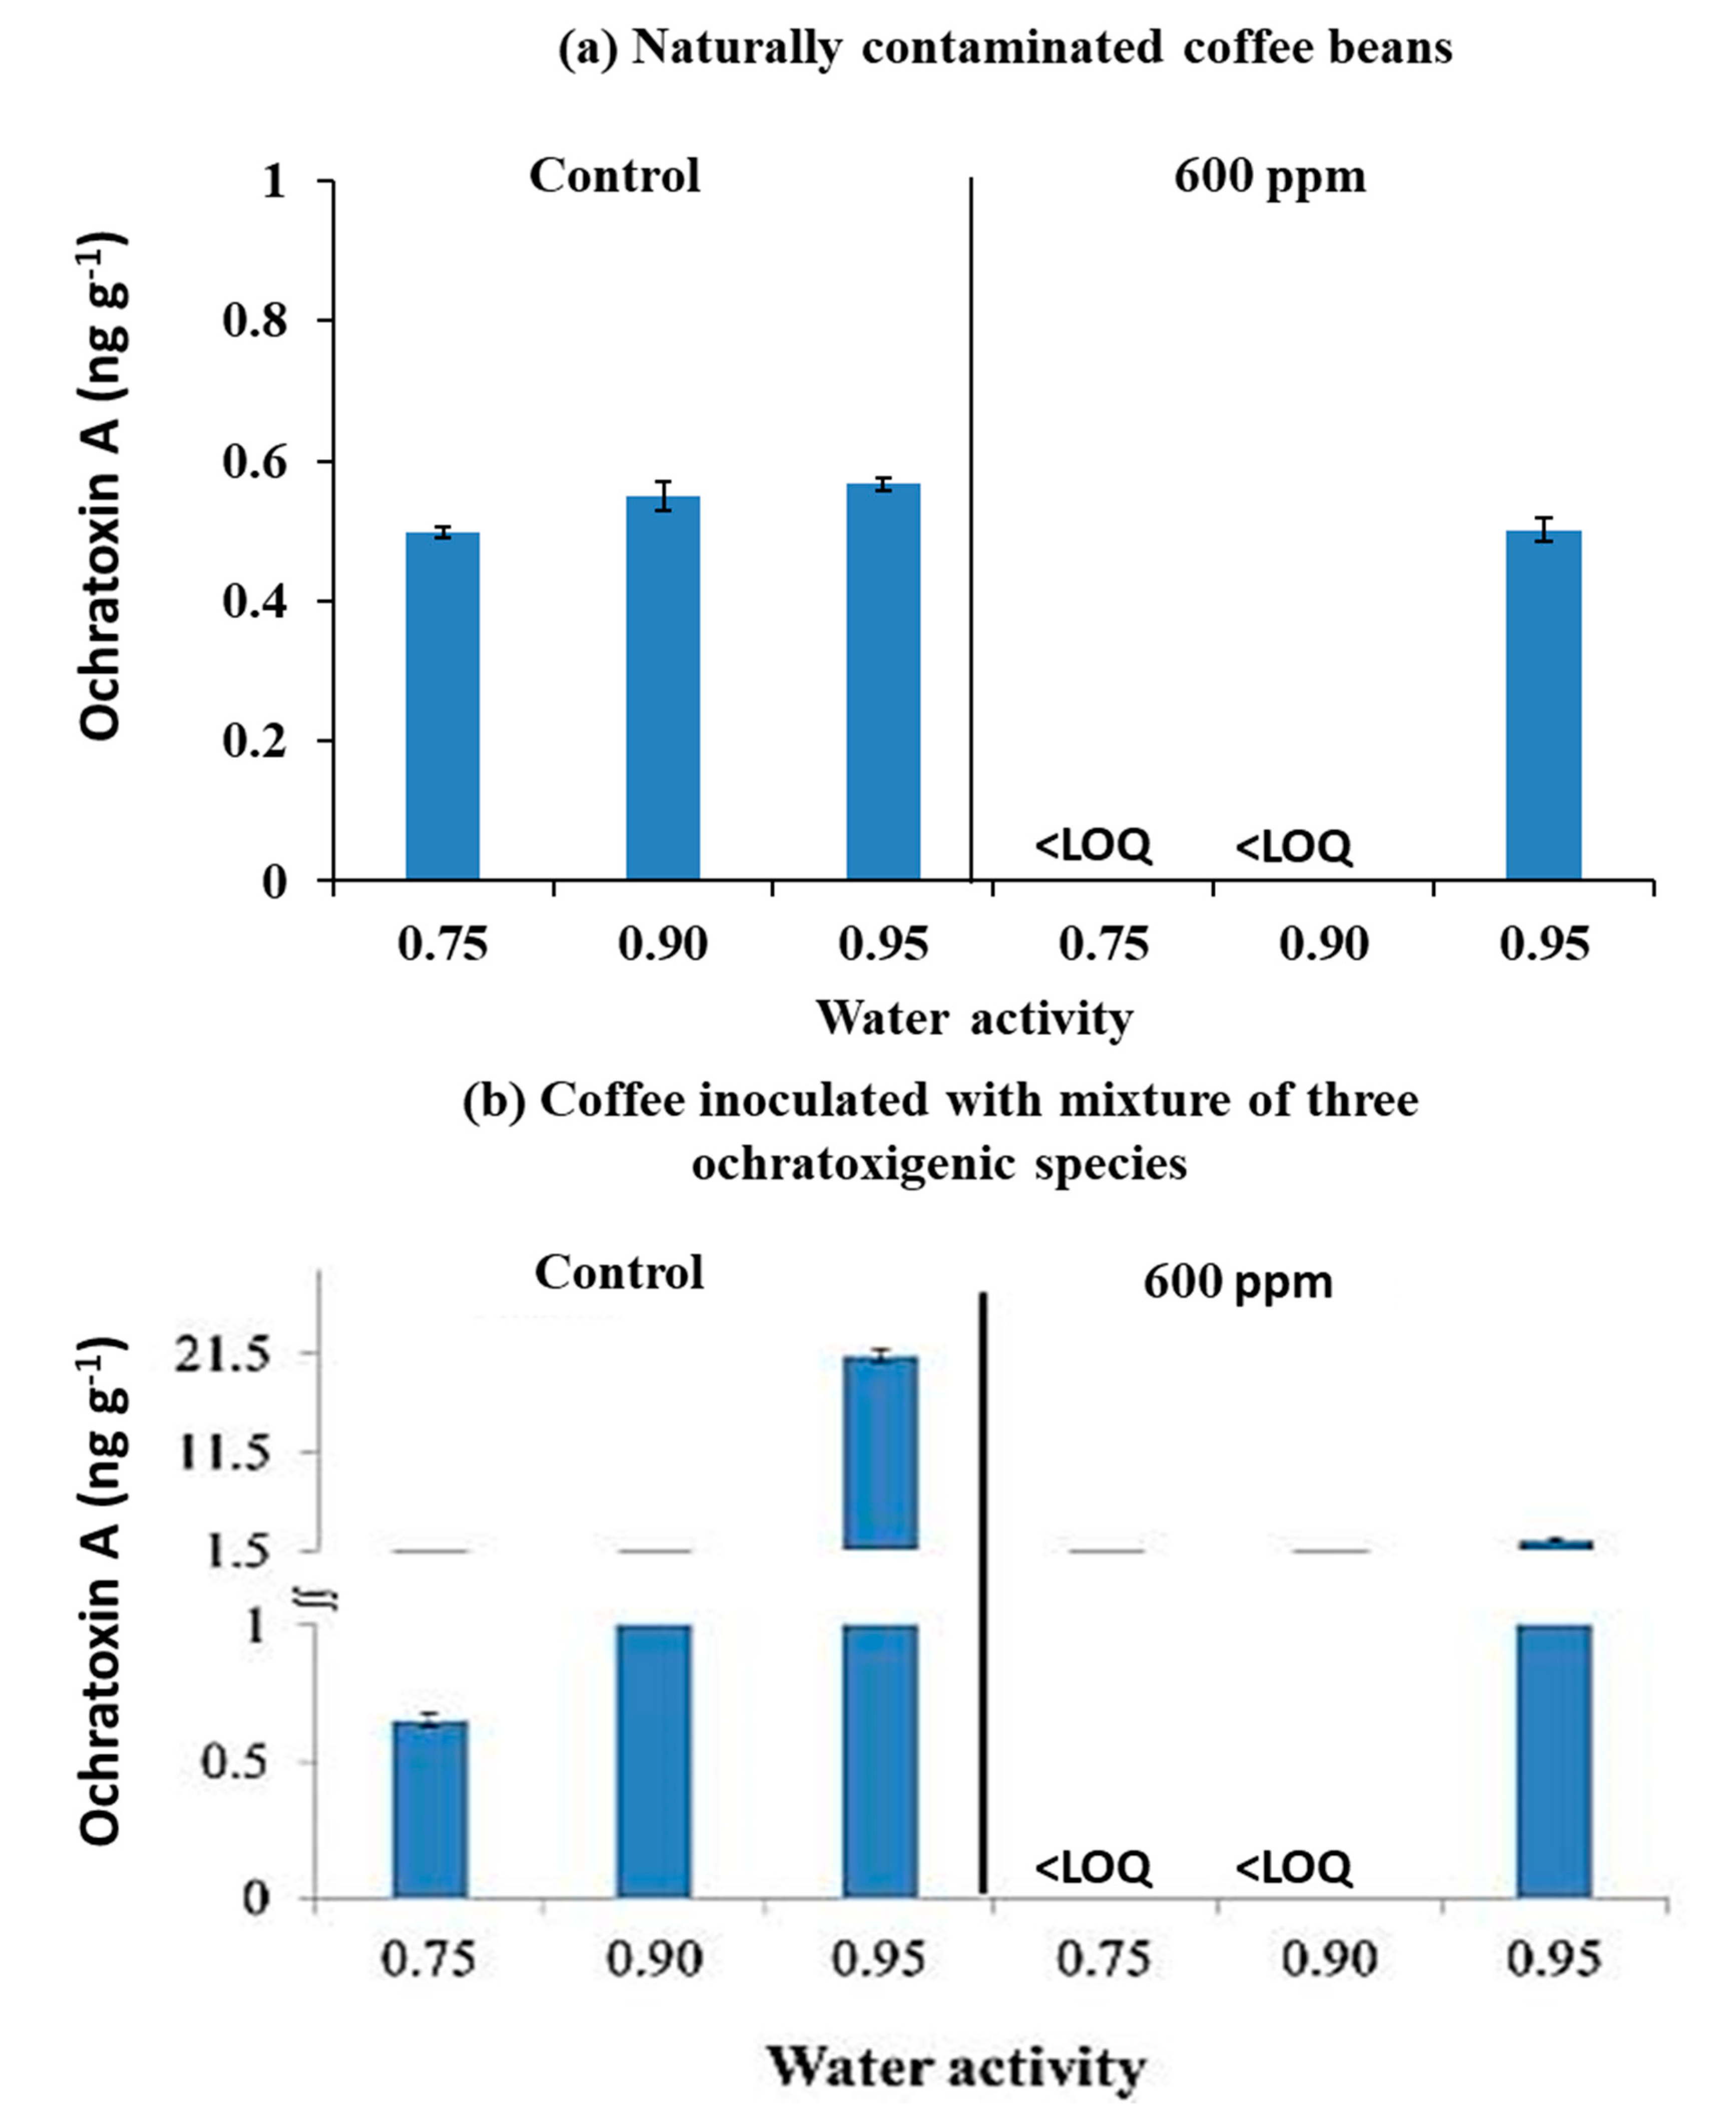
3.3. Efficacy of O3 Treatment on Ochratoxin A Contamination of Naturally Contaminated Green Coffee Beans and Inoculated with a Mixture of the Three Ochratoxigenic Species Stored for 12 Days
4. Discussion
4.1. Effect of O3 on the Fungal Populations and OTA Production by A. westerdijkiae, A. ochraceus, and A. carbonarius When Inoculated on Irradiated Stored Coffee Beans
4.2. Efficacy of O3 on Fungal Populations and OTA Contamination of Naturally Contaminated Coffee Beans and Inoculated with Ochratoxigenic Species at Different Water Availabilities
5. Conclusions
Author Contributions
Funding
Acknowledgments
Conflicts of Interest
References
- Kim, J.G.; Yousef, A.E.; Dave, S. Application of ozone for enhancing the microbiological safety and quality of foods. Rev. J. Food Prot. 1999, 62, 1071–1087. [Google Scholar] [CrossRef] [PubMed]
- United States Food and Drug Administration. Code of Federal Regulations: Maximum Acceptable Level of Ozone; 21CFR801.415; United States Food and Drug Administration: Silver Spring, MD, USA, 2019; Volume 8. Available online: https://www.accessdata.fda.gov/scripts/cdrh/cfdocs/cfcfr/cfrsearch.cfm?fr=801.415 (accessed on 31 August 2020).
- Frampton, M.W.; Pietropaoli, A.; Dentler, M.; Chalupa, D.; Little, E.L.; Stewart, J.; Frasier, L.; Oakes, D.; Wiltshire, J.; Vora, R.; et al. Cardiovascular effects of ozone in healthy subjects with and without deletion of glutathione-S-transferase M1. Inhal. Toxicol. 2015, 27, 113–119. [Google Scholar] [CrossRef] [PubMed]
- Horstman, D.H.; Ball, B.A.; Brown, J.; Gerrity, T.; Folinsbee, L.J. Comparison of pulmonary responses of asthmatic and non-asthmatic subjects performing light exercise while exposed to a low level of ozone. Toxicol. Ind. Health 1995, 11, 369–385. [Google Scholar] [CrossRef] [PubMed]
- Suslow, T.V. Ozone applications for postharvest disinfection of edible horticultural crops. ANS Publ. 2004, 8133, 1–8. [Google Scholar]
- Hibben, C.R.; Stotzky, G. Effects of ozone on the germination of fungus spores. Can. J. Microbiol. 1969, 15, 1187–1196. [Google Scholar] [CrossRef]
- Antony-Babu, S.; Singleton, I. Effect of ozone on spore germination, spore production and biomass production in two Aspergillus species. Int. J. Gen. Mol. Microbiol. 2009, 96, 413–422. [Google Scholar] [CrossRef]
- Savi, G.D.; Scussel, V.M. Effects of ozone gas exposure on toxigenic fungi species from Fusarium, Aspergillus, and Penicillium genera. Ozone Sci. Eng. 2014, 36, 144–152. [Google Scholar] [CrossRef]
- Vijayanandraj, V.R.; Nagendra Prasad, D.; Mohan, N.; Gunasekaran, M. Effect of ozone on Aspergillus niger causing black rot disease in onion. Ozone Sci. Eng. 2006, 28, 347–350. [Google Scholar] [CrossRef]
- Palou, L.; Crisosto, C.H.; Smilanick, J.L.; Adaskaveg, J.E.; Zoffoli, J.P. Effects of continuous 0.3 ppm ozone exposure on decay development and physiological responses of peaches and table grapes in cold storage. Postharvest Biol. Technol. 2002, 24, 39–48. [Google Scholar] [CrossRef]
- Nicoué, E.É.; Émond, J.; Vuillemard, J.; Do Nascimento Nunes, M.C. Destruction of Rhizopus stolonifer and Botrytis cinerea by ozone/ions treatments. Phytoprotection 2002, 85, 81–87. [Google Scholar] [CrossRef][Green Version]
- Minas, I.S.; Karaoglanidis, G.S.; Manganaris, G.A.; Vasilakakis, M. Effect of ozone application during cold storage of kiwifruit on the development of stem-end rot caused by Botrytis cinerea. Postharvest Biol. Technol. 2010, 58, 203–210. [Google Scholar] [CrossRef]
- Roushdy, M.M.; Abdel-Shakour, E.H.; Abdel-Ghany, T.M. Sporicidal effect of ozone on fungal and bacterial spores in water disinfection. J. Am. Sci. 2001, 7, 942–948. [Google Scholar]
- Conte, G.; Fontanelli, M.; Galli, F.; Cotrozzi, L.; Pagni, L.; Pellegrini, E. Mycotoxins in feed and food and the role of ozone in their detoxification and degradation: An update. Toxins 2020, 12, 486. [Google Scholar] [CrossRef] [PubMed]
- Mylona, K.; Kogkaki, E.; Sulyok, M.; Magan, N. Efficacy of gaseous ozone treatment on spore germination, growth and fumonisin production by Fusarium verticillioides in vitro and in situ in maize. J. Stored Prod. Res. 2014, 59, 178–184. [Google Scholar] [CrossRef]
- Magan, N.; Garcia-Cela, E.; Verheecke-Vaessen, C.; Medina, A. Chapter 14: Advances in postharvest detection and control of fungal contamination of cereals. In Advances in Postharvest Management of Cereals and Grains; Maier, D., Ed.; BDS Publishing: Cambridge, UK, 2020. [Google Scholar]
- Sultan, Y. Biodiversity of Mycotoxigenic Aspergillus Species in Egyptian Peanuts and Strategies for Minimizing Aflatoxin Contamination. Ph.D. Thesis, Cranfield University, Cranfield, UK, 2012. [Google Scholar]
- El-Desouky, T.A.; Sharoba, A.M.A.; El-Desouky, A.I.; El-Mansy, H.A.; Naguib, K. Effect of ozone gas on degradation of aflatoxin B1 and Aspergillus flavus fungal. J. Environ. Anal. Toxicol. 2012, 2, 128. [Google Scholar] [CrossRef]
- Sahab, A.F.; Hassanien, F.R.; El-Nemr, S.E.; Abdel-Alim, H.A.; Abdel-Wahhab, M.A. Effect of ozone gaseous on aflatoxin degradation and fat and protein content in peanut seeds. J. Appl. Sci. Res. 2013, 9, 2170–2175. [Google Scholar]
- Chen, R.; Ma, F.; Wu, L.P.W.; Zhang, W.; Ding, X.X.; Zhang, Q.; Li, M.; Wang, Y.R.; Xu, B.C. Effect of ozone on aflatoxins detoxification and nutritional quality of peanuts. Food Chem. 2014, 146, 284–288. [Google Scholar] [CrossRef]
- Cullen, P.J.; Valdramidis, V.P.; Tiwari, B.K.; Patil, S.; Bourke, P.; O’Donnell, C.P. Ozone processing for food preservation: An overview on fruit juice treatments. Ozone Sci. Eng. 2010, 32, 166–179. [Google Scholar] [CrossRef]
- Nascimento1, L.C.; de Oliveira Lima, L.C.; Picolli, R.H.; Fiorini, J.E.; da Silveira Duarte, S.M.; da Silva, J.M.S.F.; de Mello Silva Oliveira, N.; de Oliveira Morais Veiga, S.M. Ozônio e ultra-som: Processos alternativos para o tratamento do café despolpado (Ozone and ultrasound: Alternative processes in the treatment of fermented coffee). Ciênc. Tecnol. Aliment. Campinas 2008, 28, 282–294. [Google Scholar] [CrossRef]
- Leitao, A.L. Occurrence of ochratoxin A in coffee: Threads and solutions—A mini-review. Beverages 2019, 5, 36. [Google Scholar] [CrossRef]
- Akbar, A.; Medina, A.; Magan, N. Impact of climate change factors on growth and ochratoxin A production by Aspergillus sections Circumdati and Nigri species on coffee. World Mycotoxin J. 2016, 9, 863–874. [Google Scholar] [CrossRef]
- Akbar, A.; Medina, A.; Magan, N. Resilience of Aspergillus westerdijkiae strains to interacting climate-related abiotic factors: Effects on growth and ochratoxin A production on coffee-based medium and in stored coffee. Microorganisms 2020, 8, 1268. [Google Scholar] [CrossRef] [PubMed]
- Mitchell, D.; Parra, R.; Aldred, D.; Magan, N. Water and temperature relations of growth and ochratoxin A production by Aspergillus carbonarius strains from grapes in Europe and Israel. J. Appl. Microbiol. 2004, 97, 439–445. [Google Scholar] [CrossRef]
- Abdel-Hadi, A.; Magan, N. Influence of environmental factors on growth, sporulation and ochratoxin A and B production of the new grouping of the A. ochraceus group. World Mycotoxin J. 2009, 2, 429–434. [Google Scholar] [CrossRef]
- Steponavicius, D.; Raila, A.; Steponaviciene, A.; Lugauskas, A.; Kemzūraitė, A. Preventive measures reducing superficial mycobiotic contamination of grain. Ann. Agric. Environ. Med. 2012, 19, 193–201. [Google Scholar] [PubMed]
- Maeba, H.I.; Takamoto, Y.U.; Kamimura, M.I.; Miura, T.O. Destruction and detoxification of aflatoxins with ozone. J. Food Sci. 1988, 52, 667–668. [Google Scholar] [CrossRef]
- Allen, B.; Wu, J.; Doan, H. Inactivation of fungi associated with barley grain by gaseous ozone. J. Environ. Sci. Health Part B Pestic. Food Contam. Agri. Wastes 2003, 38, 617–630. [Google Scholar] [CrossRef]
- Restaino, L.; Frampton, E.W.; Hemphill, J.B.; Palnikar, R. Efficacy of ozonated water against various food-related microorganisms. Appl. Environ. Microbiol. 1995, 61, 3471–3475. [Google Scholar] [CrossRef]
- Whistler, P.E.; Sheldon, B.W. Biocidal activity of ozone versus formaldehyde against poultry pathogens inoculated in a prototype setter. Poultry Sci. 1989, 68, 1068–1073. [Google Scholar] [CrossRef]
- Mylona, K. Fusarium species in grains: Dry Matter Losses, Mycotoxin Contamination and Control Strategies Using Ozone and Chemical Compounds. Ph.D. Thesis, Cranfield University, Cranfield, UK, 2013. [Google Scholar]
- Freitas-Silva, O.; Venâncio, A. Ozone application to prevent and degrade mycotoxins: A review. Drug Metab. Rev. 2010, 42, 612–620. [Google Scholar] [CrossRef]
- Luo, X.; Wang, R.; Wang, L.; Li, Y.; Wang, Y.; Chen, Z. Detoxification of aflatoxin in corn flour by ozone. J. Sci. Food Agric. 2014, 94, 2253–2258. [Google Scholar] [CrossRef] [PubMed]
- Prudente, A.D., Jr.; King, J.M. Efficacy and safety evaluation of ozonation to degrade aflatoxin in corn. J. Food Sci. 2002, 67, 2866–2872. [Google Scholar]
- White, S.D.; Murphy, P.T.; Leandro, L.F.; Bern, C.J.; Beattie, S.E.; van Leewen, J.H. Mycoflora of high moisture maize treated with ozone. J. Stored Prod. Res. 2013, 55, 84–89. [Google Scholar] [CrossRef]


| Factors | ||
|---|---|---|
| Strains | aw | Ozone (ppm) |
| A. westerdijkiae (CBS 121986) | 0.75 | S |
| 0.90 | S | |
| 0.95 | S | |
| A. ochraceus (ITAL 14) | 0.75 | S |
| 0.90 | NS | |
| 0.95 | NS | |
| A. carbonarius (ITAL 204) | 0.75 | S |
| 0.90 | S | |
| 0.95 | S | |
| Ozone (ppm) | aw | aw × Ozone | |
|---|---|---|---|
| A. carbonarius (ITAL 204) | S | S | - |
| A. westerdijkiae (CBS 121986) | S | S | - |
| A. ochraceus (ITAL 14) | NS | S | - |
| Factors | ||||||
|---|---|---|---|---|---|---|
| (a) | aw | Ozone | Days | Ozone (0, 600 ppm) | aw (0.75,0.90,0.95) | Days (48 h, 12 days) |
| Naturally contaminated coffee beans (1) | 0.75 | NS | NS | S | S | S |
| 0.90 | S | NS | ||||
| 0.95 | S | S | ||||
| Coffee beans inoculated with 3 ochratoxigenic strains (2) | 0.75 | S | S | S | S | S |
| 0.90 | S | S | ||||
| 0.95 | S | S | ||||
| (b) | aw | Ozone | Days | Ozone (0, 600 ppm) | aw (0.75,0.90,0.95) | Days (48 h, 12 days) |
| (1) versus (2) | 0.75 | S | NS | S | S | S |
| 0.90 | S | NS | ||||
| 0.95 | S | S | ||||
| Factors | ||||
|---|---|---|---|---|
| (a) | aw | Ozone | Ozone (0, 600 ppm) | aw (0.75,0.90,0.95) |
| Naturally contaminated coffee beans (1) | 0.75 | S | S | NS |
| 0.90 | S | |||
| 0.95 | NS | |||
| Coffee beans inoculated with 3 ochratoxigenic strains (2) | 0.75 | S | S | S |
| 0.90 | S | |||
| 0.95 | S | |||
| (b) | aw | Ozone | Ozone (0, 600 ppm) | aw (0.75,0.90,0.95) |
| (1) versus (2) | 0.75 | S | S | S |
| 0.90 | S | |||
| 0.95 | S | |||
© 2020 by the authors. Licensee MDPI, Basel, Switzerland. This article is an open access article distributed under the terms and conditions of the Creative Commons Attribution (CC BY) license (http://creativecommons.org/licenses/by/4.0/).
Share and Cite
Akbar, A.; Medina, A.; Magan, N. Potential Control of Mycotoxigenic Fungi and Ochratoxin A in Stored Coffee Using Gaseous Ozone Treatment. Microorganisms 2020, 8, 1462. https://doi.org/10.3390/microorganisms8101462
Akbar A, Medina A, Magan N. Potential Control of Mycotoxigenic Fungi and Ochratoxin A in Stored Coffee Using Gaseous Ozone Treatment. Microorganisms. 2020; 8(10):1462. https://doi.org/10.3390/microorganisms8101462
Chicago/Turabian StyleAkbar, Asya, Angel Medina, and Naresh Magan. 2020. "Potential Control of Mycotoxigenic Fungi and Ochratoxin A in Stored Coffee Using Gaseous Ozone Treatment" Microorganisms 8, no. 10: 1462. https://doi.org/10.3390/microorganisms8101462
APA StyleAkbar, A., Medina, A., & Magan, N. (2020). Potential Control of Mycotoxigenic Fungi and Ochratoxin A in Stored Coffee Using Gaseous Ozone Treatment. Microorganisms, 8(10), 1462. https://doi.org/10.3390/microorganisms8101462


