Article

Phylogenetic Analyses of Xanthomonads Causing Bacterial Leaf Spot of Tomato and Pepper: Xanthomonas euvesicatoria Revealed Homologous Populations Despite Distant Geographical Distribution

Department of Plant and Environmental Protection Sciences, University of Hawaii at Manoa, Manoa, HI 96822, USA
*
Author to whom correspondence should be addressed.
Microorganisms 2019, 7(10), 462; https://doi.org/10.3390/microorganisms7100462
Submission received: 1 September 2019 / Revised: 13 October 2019 / Accepted: 14 October 2019 / Published: 16 October 2019
(This article belongs to the Special Issue Plant Microbial Interactions)

Abstract

:
Bacterial leaf spot of tomato and pepper (BLS), an economically important bacterial disease caused by four species of Xanthomonas (X. euvesicatoria (Xe), X. vesicatoria (Xv), X. gardneri (Xg), and X. perforans (Xp)), is a global problem and can cause over 50% crop loss under unfavorable conditions. Among the four species, Xe and Xv are prevalent worldwide. Characterization of the pathogens is crucial for disease management and regulatory purposes. In this study, we performed a multilocus sequence analysis (MLSA) with six genes (hrcN, dnaA gyrB, gapA, pdg, and hmbs) on BLS strains. Other Xanthomonas species were included to determine phylogenetic relationships within and among the tested strains. Four BLS species comprising 76 strains from different serological groups and diverse geographical locations were resolved into three major clades. BLS xanthomonads formed distinct clusters in the phylogenetic analyses. Three other xanthomonads, including X. albilineans, X. sacchari, and X. translucens pv. undolusa revealed less than 85%, 88%, and 89% average nucleotide identity (ANI), respectively, with the other species of Xanthomonas included in this study. Both antibody and MLSA data showed that Xv was clearly separated from Xe and that the latter strains were remarkably clonal, even though they originated from distant geographical locations. The Xe strains formed two separate phylogenetic groups; Xe group A1 consisted only of tomato strains, whereas Xe group A2 included strains from pepper and tomato. In contrast, the Xv group showed greater heterogeneity. Some Xv strains from South America were closely related to strains from California, while others grouped closer to a strain from Indiana and more distantly to a strain from Hawaii. Using this information molecular tests can now be devised to track distribution of clonal populations that may be introduced into new geographic areas through seeds and other infected plant materials.

Graphical Abstract

1. Introduction

Bacteria cause many important diseases in cultivated and wild plants throughout the world [1]. The genus Xanthomonas consists of many pathogens of economic importance that cause diseases in plants of over 200 families [1,2]. Bacterial leaf spot of tomato and pepper (BLS) is caused by four species of Xanthomonas, (X. euvesicatoria, X. vesicatoria, X. perforans, and X. gardneri) and is a worldwide problem in tomato and pepper production [3]. Approximately 17.7 million tons of tomato and 34.5 million tons of pepper were produced in 2016 (FAO 2016), and seed production is an essential component of these industries. Bacterial leaf spot is a seed-borne disease and can be destructive in warm and humid conditions, causing up to 50% of the yield loss in favorable conditions [4]. Xanthomonads may enter through natural openings, such as stomata, causing localized leaf spots, or through hydathodes resulting in vascular infection.
Formerly, all xanthomonads causing BLS were recognized as X. campestris pv. vesicatoria. In 1994, Stall et al. described two distinct groups within X. campestris pv. vesicatoria based on carbon substrate utilization, fatty acid profiles, starch hydrolysis, and ability to degrade pectin. The two groups had less than 50% DNA homology with DNA–DNA hybridization [5]. Fatty acid profiles, protein profiles, carbon substrate utilization, and ELISA using a panel of monoclonal antibodies were used to characterize diversity within a worldwide collection of BLS strains [5,6]. ELISA differentiated former X. campestris pv. vesicatoria strains from pepper and tomato into six serovars; three serovars were within two groups. Groups A and B were further differentiated by protein profile analysis and amylolytic activity [6]. In 1995, the BLS xanthomonads were further separated into two species, X. vesicatoria and X. axonopodis pv. vesicatoria based on DNA–DNA hybridization studies [7]. Later, Jones et al. [3] reclassified the BLS xanthomonads into four species, namely, X. vesicatoria, X. euvesicatoria, X. gardneri, and X. perforans, based on a thorough study of phenotypic characteristics, including antibody patterns, protein profiles, and pulse field gel electrophoresis. X. gardneri and X. perforans are newly described pathogens of tomato and pepper, while X. vesicatoria and X. euvesicatoria are of historical importance and are prevalent worldwide. Production of indistinguishable symptoms on a common host makes a visual diagnosis difficult for BLS xanthomonads; thus, researchers rely on molecular tools, such as sequencing, multilocus sequence typing (MLSA), and loop-mediated isothermal amplification to identify the species [8,9]. Characterization of genetic diversity is critical for management and regulatory purposes, and accurate identification of key differences and possible changes in pathogen populations [10] facilitates deployment of resistant cultivars, which is one sustainable approach to disease management [11]. Parkinson et al. [12,13] established gyrB gene as a simple and rapid method for phylogenetics and diagnostics of xanthomonads, including BLS-causing Xanthomonas species. MLST is commonly used to characterize the genetic diversity of pathogens based on selected loci within the genome [14,15], and this knowledge helps to identify possible new sources of inoculum and deploy disease management options.
An X. euvesicatoria strain identical to type strain NCPPB 2968 was the dominant pathogen causing BLS in eastern Australia, whereas X. vesicatoria strains, though fewer in number, formed two separate groups in phylogenetic studies [8]. Two groups within the X. vesicatoria population were also reported from Central Ethiopia [16]. Timilsina et al. [17] conducted the study on xanthomonads causing BLS by using strains collected from different geographical locations. Three haplotypes of X. euvesicatoria were identified and most of the strains were identical to type strain 85-10 [17]. Three haplotypes also were identified within X. vesicatoria, which had a smaller representation (nine strains) in the collection [17]. Most recently, Roach et al. [8,18] studied the diversity of recently collected xanthomonads from Australia causing BLS based on MLST and genome analyses.
Movement of pathogens in infected planting materials and seeds contributes to the spread of bacterial pathogens throughout the world and is significant in the case of BLS of tomato and pepper, which are seed-borne diseases. Nevertheless, both geographic isolation and selection pressure in specific locations shape the evolution and diversity within geographically isolated groups of pathogens. Most of the studies dealing with the diversity of X. euvesicatoria and X. vesicatoria are based on a few common genes [16,17]. The increasing availability of whole genome sequences of X. euvesicatoria and X. vesicatoria in public databases and new genome comparison tools allow genome-wide comparison and selection of robust markers (genes) for population genetic studies [14]. More studies with diverse strains from worldwide origins and new markers with higher potential to detect discrepancies within species are needed for a detailed analysis of the genetic diversity of X. euvesicatoria and X. vesicatoria. The rapid advancement in molecular technologies, including accessibility, affordability of sequencing facilities, and next-generation sequencing has now enabled detailed studies of diversity within and among plant pathogens [10,14,18]. Additional genotypes within each species of BLS xanthomonads have been discovered and multiple populations have been found at the same location [16,17].
The objective of this study was to characterize the diversity between and within X. euvesicatoria and X. vesicatoria strains collected in different years (mostly from 1960s to 1990s) from diverse worldwide geographical locations. A comparative genomic analysis was undertaken to select appropriate genes for better resolution of the population structure.

2. Materials and Methods

2.1. Bacterial Strains and DNA Extraction

The seventy-six strains used in this study were collected from different geographical locations including Australia, Taiwan, South America, California, Florida, Indiana, and Hawaii at different time intervals; details of the bacterial strains are listed in Table 1. The strains were isolated from infected pepper and tomato. Cultures stored at −80°C (TB medium) were grown on tetrazolium chloride medium (5 g peptone, 2.5 g dextrose, 8.5 g agar, 0.5 mL 1% TZC in 500 mL of distilled water) and purified by subculturing from the single colony. DNA was extracted from purified bacterial cultures using Wizard Genomic DNA Purification Kit (Promega, Madison, WI, USA) following the manufacturer’s instructions. The isolated DNA was quantified using NanoDrop™ 2000/c spectrophotometer (Thermo Fisher Scientific, Waltham, MA, USA).

2.2. Gene Selection and Primer Design

A total of six genes were selected based on their ability to discriminate the populations. The replication initiation factor (dnaA), type I glyceraldehyde-3-phosphate dehydrogenase (gapA), and DNA topoisomerase (ATP-hydrolyzing) subunit B (gyrB) genes are commonly used for population genetics studies of Xanthomonas species and were selected for this study after initial analysis [10,11,12,13]. Three genes were selected after genome-wide analyses of four BLS xanthomonads; genomes were retrieved from the National Center for Biotechnology Institute GenBank genome database (NCBI, Bethesda, MD). Whole genomes of X. euvesicatoria (NZ_CP018467, NZ_CP017190, and NC_007508), X. vesicatoria (NZ_CP018470 and NZ_CP018725) X. gardneri (NZ_CP018728 and NZ_CP018731), and X. perforans (NZ_CP019725 and NZ_CP018475) were aligned using Mauve [20] and potential genomic regions for population genetics studies were examined. Conserved genes among X. euvesicatoria, X. vesicatoria, X. perforans, and X. gardneri with the ability to detect interspecific and intraspecific discrepancies were selected. The hrcN gene, conserved in all four BLS xanthomonads but with the ability to discriminate these four species, was selected for identity confirmations and included in the population genetics study [9]. All three complete genomes of X. euvesicatoria were downloaded from NCBI GenBank database and compared; however, these genomes showed high homology and were not helpful for selection of genes that discriminate X. euvesicatoria populations. So, twelve X. euvesicatoria shotgun genome sequences were retrieved from the NCBI GenBank genome database and were aligned using progressive Mauve; the aligned files were exported to Geneious (version 10.2.3) and screened for the regions that could differentiate X. euvesicatoria populations. The pyruvate dehydrogenase (acetyl-transferring) (pdg) and hydroxymethylbilane synthase (hmbs) genes were specifically selected to differentiate X. euvesicatoria populations. Primers for gapA, gyrB, pdg, and hmbs were designed based on the sequence alignments of individual genes extracted from whole genomes of X. euvesicatoria, X. vesicatoria, X. perforans, and X. gardneri; conserved regions were used for primer design, which was done using primer3 software version 0.4.0 [21]. Previously reported primers were used for dnaA [19] and hrcN gene regions (Table 2) [9]. A total of 8 primer sets were used for the amplification of six target genes. Details of the primers are listed in Table 2. Due to the high nucleotide diversity in the hmbs gene, it was difficult to design a single primer that could amplify all BLS xanthomonads to give a desired product size (600–1000 bp). Therefore, two pairs of primers were designed for hmbs gene. Primer Hmbs-F and Hmbs-R were designed to target X. euvesicatoria and X. perforans. Likewise, Hmbs-F2 and Hmbs-R2 were designed to target X. vesicatoria and X. gardneri. A single primer set was used for amplification of the remaining genes for all four species. Five strains of X. vesicatoria gave no product with Hmbs-F2 and Hmbs-R2. Therefore, primers Hmbs-F10 and Hmbs-R10 were designed based on the sequence alignment of X. vesicatoria obtained with Hmbs-F2 and Hmbs-R2 primers along with hmbs sequences retrieved from the published whole genomes of X. vesicatoria.

2.3. PCR, Sequencing, and Identity Confirmation

PCR reactions were carried out in 20 μL volumes in a T100 Thermocycler (Bio-Rad, Hercules, CA, USA). One μL of each forward and reverse primer (5 µm), 10 μL of Gotaq Green master mix (Promega), 1 μL genomic DNA, and 7 μL sterile distilled water was used for each reaction. One microliter of sterile water was added to the negative control instead of DNA. Cycling conditions for hrcN, gyrB, gapA, pdg, and hmbs: initial denaturation for 5 min at 94 °C, followed by 35 cycles at 94 °C for 20 s, 60 °C for 30 s, and 72 °C for 1 min; this was followed by a final extension step at 72 °C for 3 min. For primer Hmbs-F10, all conditions were the same except that annealing was performed at 52 °C for 1 min. For dnaA primer set, cycling conditions consisted of initial denaturation at 94 °C for 5 min, followed by 35 cycles at 94 °C for 30 s, 60 °C for 1 min, an extension at 72 °C for 30 s, and a final extension at 72 °C for 10 min. To confirm the amplification of the target region, 5 μL of PCR product was electrophoresed on 1.5% agarose gel for 90 min and visualized under UV light (FOTODYNE Incorporated, Hartland, WI, USA). The PCR product was purified by mixing 5 μL of PCR product with 2 μL ExoSAP-IT™ (Affymetrix Inc, Santa Clara, CA, USA); the mixture was incubated at 37 °C for 15 min followed by 80 °C for 15 min [22]. Sequencing was performed at GENEWIZ facility (Genewiz, La Jolla, CA, USA). Obtained sequences of each strain were aligned using Geneious and manually edited to correct the sequencing errors. Finally, manually edited and corrected sequences were compared with the publicly available NCBI GenBank nucleotide and genome databases using BLASTn tool to confirm the identity of each isolate used in this study.

2.4. Phylogenetic Analysis of X. euvesicatoria and X. vesicatoria

Multiple alignments of the individual or concatenated sequences were used to generate the phylogenetic trees using CLC Genomics Workbench 12.0.3 and R studio 3.4.3 [23]. Multiple sequence alignments were obtained using multiple sequence comparisons by the log-expectation (MUSCLE) alignment tool in Geneious. Phylogenetic analysis was conducted using package ape and CLC Genomics Workbench to obtain a neighbor-joining tree. Pairwise distance was calculated among the DNA sequences using “K80” evolutionary model. From the sequence data generated in this study, six individual trees were obtained for the genes hrcN, dnaA, gyrB, gapA, pdg, and hmbs. In addition to this, sequences for dnaA, gyrB, gapA, pdg, and hmbs were concatenated and a tree was generated. Confidence for the branches was calculated by bootstrapping the tree 1000 times using the function “boot.phylo” in the R package, ape version 5.0 [24], and CLC Genomics Workbench. The obtained tree was plotted and annotated using the package ggtree version 1.10.4 [25] and CLC Genomics Workbench. Bootstrap values were plotted as node labels.

2.5. Phylogenetic Analysis of X. euvesicatoria along with Other Xanthomonas Species

To determine the phylogenetic position of X. euvesicatoria and X. vesicatoria relative to other plant pathogenic xanthomonads and vice versa, a total of 10 genes were retrieved from the whole genomes of plant pathogenic Xanthomonas species including sequences for 5 genes used in this study (dnaA, gyrB, gapA, pdg, and hmbs) and 5 other genes not used in this study (lacF, fusA, gltA, dnaK, and 16S). All the reference whole genomes or shotgun sequences of bacterial strains (Table 3) were retrieved from the NCBI GenBank. Sequences for nine housekeeping genes (dnaA, gyrB, gapA, pdg, hmbs, lacF, fusA, gltA, dnaK) were concatenated and a NJ (Neighbor-joining) tree was generated to draw a better picture of the phylogeny for plant pathogenic xanthomonads. A separate tree was plotted with 16s sequences for all Xanthomonas species. Finally, dnaA, gyrB, gapA, pdg, and hmbs sequences for strains used in this study were aligned along with reference sequences of other Xanthomonas species to obtain a tree. Neighbor-joining trees were generated and annotated following the previously mentioned procedure.

2.6. ELISA Analysis

Five monoclonal antibodies previously produced in our laboratories were used to assess the diversity in BLS xanthomonads isolated from pepper and tomato. Mabs Xv1, Xv3, Xv5, Xv 7, and Xv15 were produced following the protocol by Alvarez et al. [26]; Mab Xv8 was generated and evaluated by Bouzar et al. [6]. The immunogen, clone number, and subclass for each MAb is listed in Table 4.
All the strains listed in Table 1 except X. gardneri and X. perforans were tested by ELISA to confirm the initial identification using genus specific MAbs X1 and X11 [26], and later with the panel of MAbs generated to differentiate strains earlier classified as X. campestris pv. vesicatoria. Positive and negative reactions were recorded as 1 and 0, respectively. Results were used to get the matrix of binary number, strains on vertical axis, and antibodies on the horizontal axis. The matrix was exported to software R 3.4.3, pairwise distance was calculated, and a neighbor-joining tree was constructed following the above-mentioned procedure.

3. Results

3.1. PCR Amplification, Sequencing, and Identity Confirmation

After comparing the hrcN gene sequences against the NCBI GenBank nucleotide and genome databases, the identity of 58 and 14 strains were confirmed as X. euvesicatoria and X. vesicatoria, respectively. The identities of two strains received as X. perforans and X. gardneri were also reconfirmed by sequencing and BLASTn. Primers designed to amplify the hrcN, dnaA, gyrB, gapA, and pdg gene regions successfully amplified all the strains. However, for the hmbs gene, five X. vesicatoria strains, A3618, A3788, A1696, A1703, and A1887, did not amplify with the primer set Hmbs-F2 and Hmbs-R2. Successful amplification of the hmbs gene for four strains (A3618, A3788, A1696, and A1887) was achieved with a new primer set Hmbs-F10 and Hmbs-R10. Despite the effort to use alternate primers, strain A1703 failed to amplify with all possible combinations of primers sets Hmbs-2 and Hmbs-10. This strain was thus removed from the concatenated analysis.

3.2. Phylogenetic Analysis

The sequences were manually edited for higher accuracy; poor quality sequences from both 3′ and 5′ ends were removed. After error corrections, 729-, 718-, 702-, 796-, 676-, and 565-bp sequences were obtained for hrcN, dnaA, gyrB, gapA, pdg, and hmbs genes, respectively. All the sequences were submitted to the NCBI GenBank and the accession numbers are listed in Table S1. All six genes used for the population genetics grouped X. euvesicatoria, X. vesicatoria, X. gardneri, and X. perforans into distinct clusters (Figures S1–S6). The genes hrcN, gyrB, and gapA were unable to differentiate populations within X. euvesicatoria (Figures S1, S3 and S4) and there was no congruence among different groups of X. vesicatoria obtained with individual genes (Figures S1, S3 and S4). Phylogenetic analysis with dnaA differentiated X. euvesicatoria into a major group and a small subgroup within this group; however, X. vesicatoria showed high divergence among the strains (Figure S2). Four X. euvesicatoria strains that formed a small subgroup, A1718, A3799, A1926, A3621, differed from all other X. euvesicatoria strains by single nucleotide for dnaA gene. Phylogenetic analysis with pdg gene gave four X. vesicatoria groups, while hmbs gene clustered the X. vesicatoria strains into three groups (Figures S5 and S6).
All six genes were concatenated and produced a ~4186 bp long fragment. In phylogenetic analysis, X. vesicatoria formed a single tight cluster with small subgroups, while X. euvesicatoria formed two major groups (Figure 1). Two strains of X. gardneri and two strains of X. perforans grouped separately from X. euvesicatoria and X. vesicatoria, where X. gardneri was close to X. vesicatoria and X. perforans was close to X. euvesicatoria. X. euvesicatoria resolved into two clades, while X. gardneri, X. perforans, and X. vesicatoria comprised the third clade. X. euvesicatoria group A1 was well separated from group A2, with strong bootstrap support of 100. X. euvesicatoria groups A1 and A2 were different at 16 nucleotide positions. Group A1 and group A2 differed by seven 7 nucleotides for hmbs and nine nucleotides for pdg, where the differences were spread across the gene. Group A2 and a small subgroup within group A2 were different from each other by a single nucleotide in dnaA gene. Overall, genes hmbs and pdg were more variable. All the X. euvesicatoria strains in group A1 were from tomato and most of the strains in group A2 were from pepper, but it also had strains from tomato. X. euvesicatoria strains grouped together irrespective of their geographic origin. Color-coded matrix showing pairwise percentage identity of X. euvesicatoria, X. vesicatoria, X. perforans, and X. gardneri strains shown in Figure S7.

3.3. Phylogenetic Position of X. vesicatoria and X. euvesicatoria Relative to Other Xanthomonads

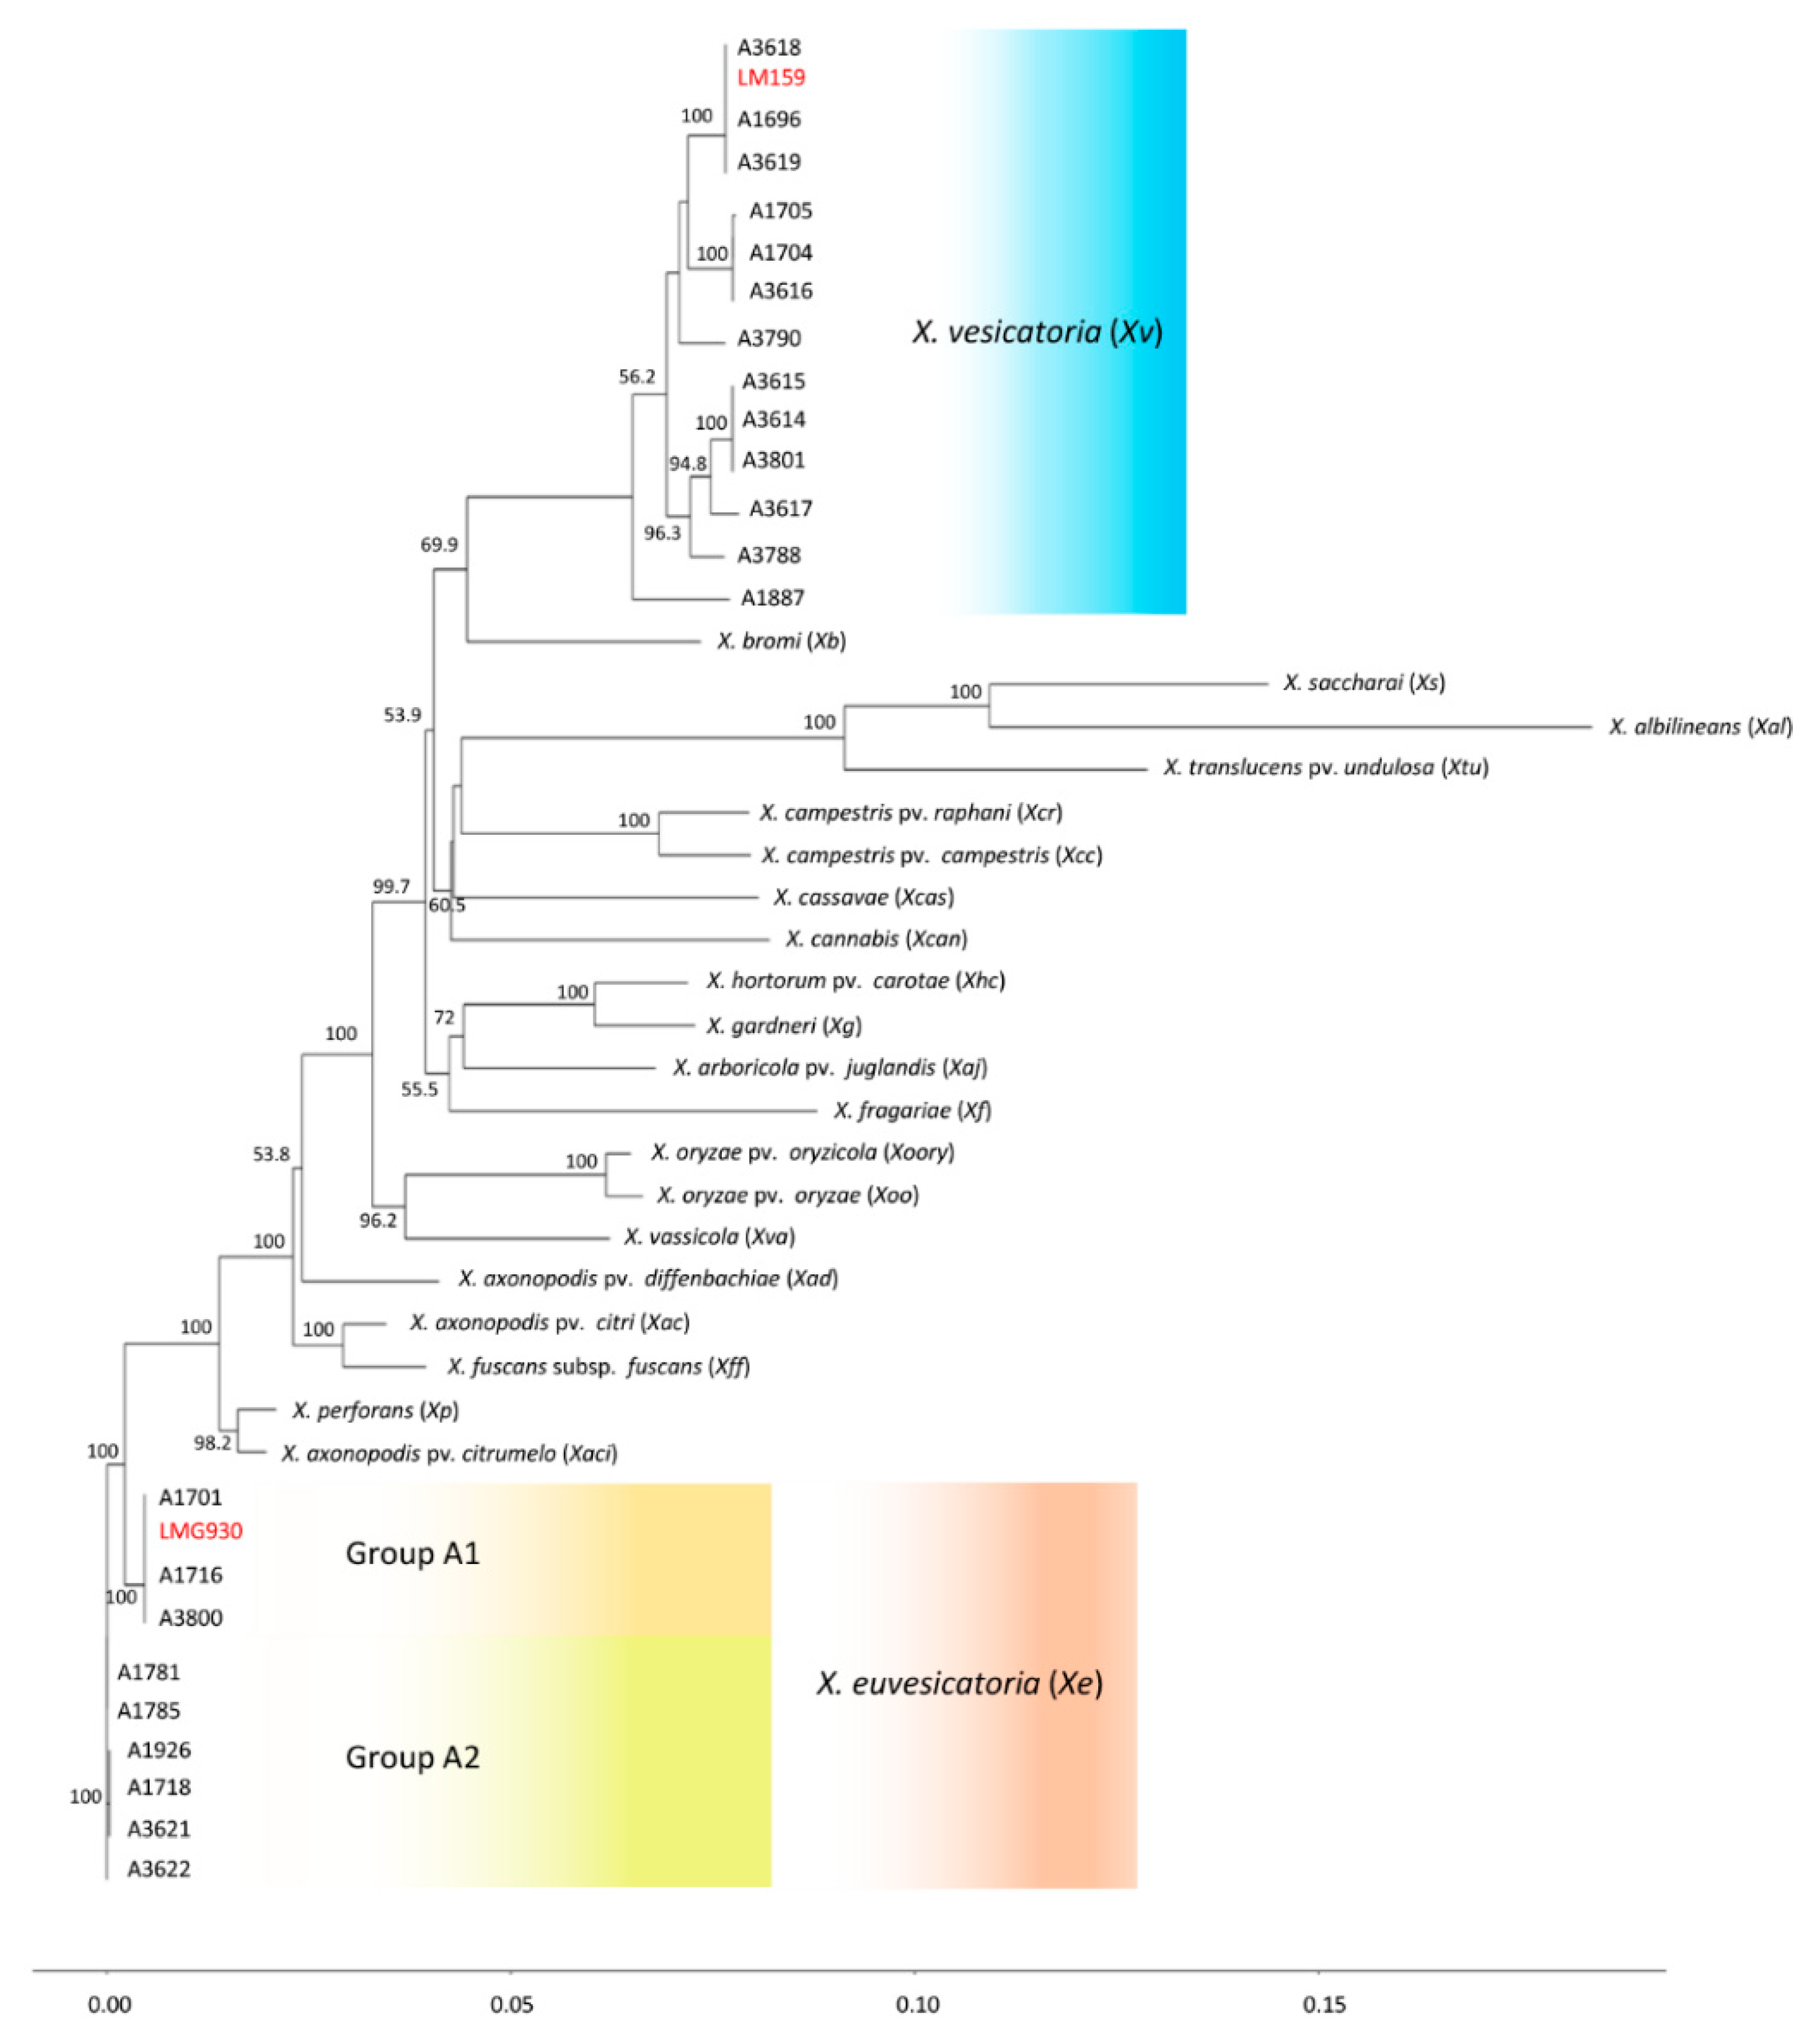
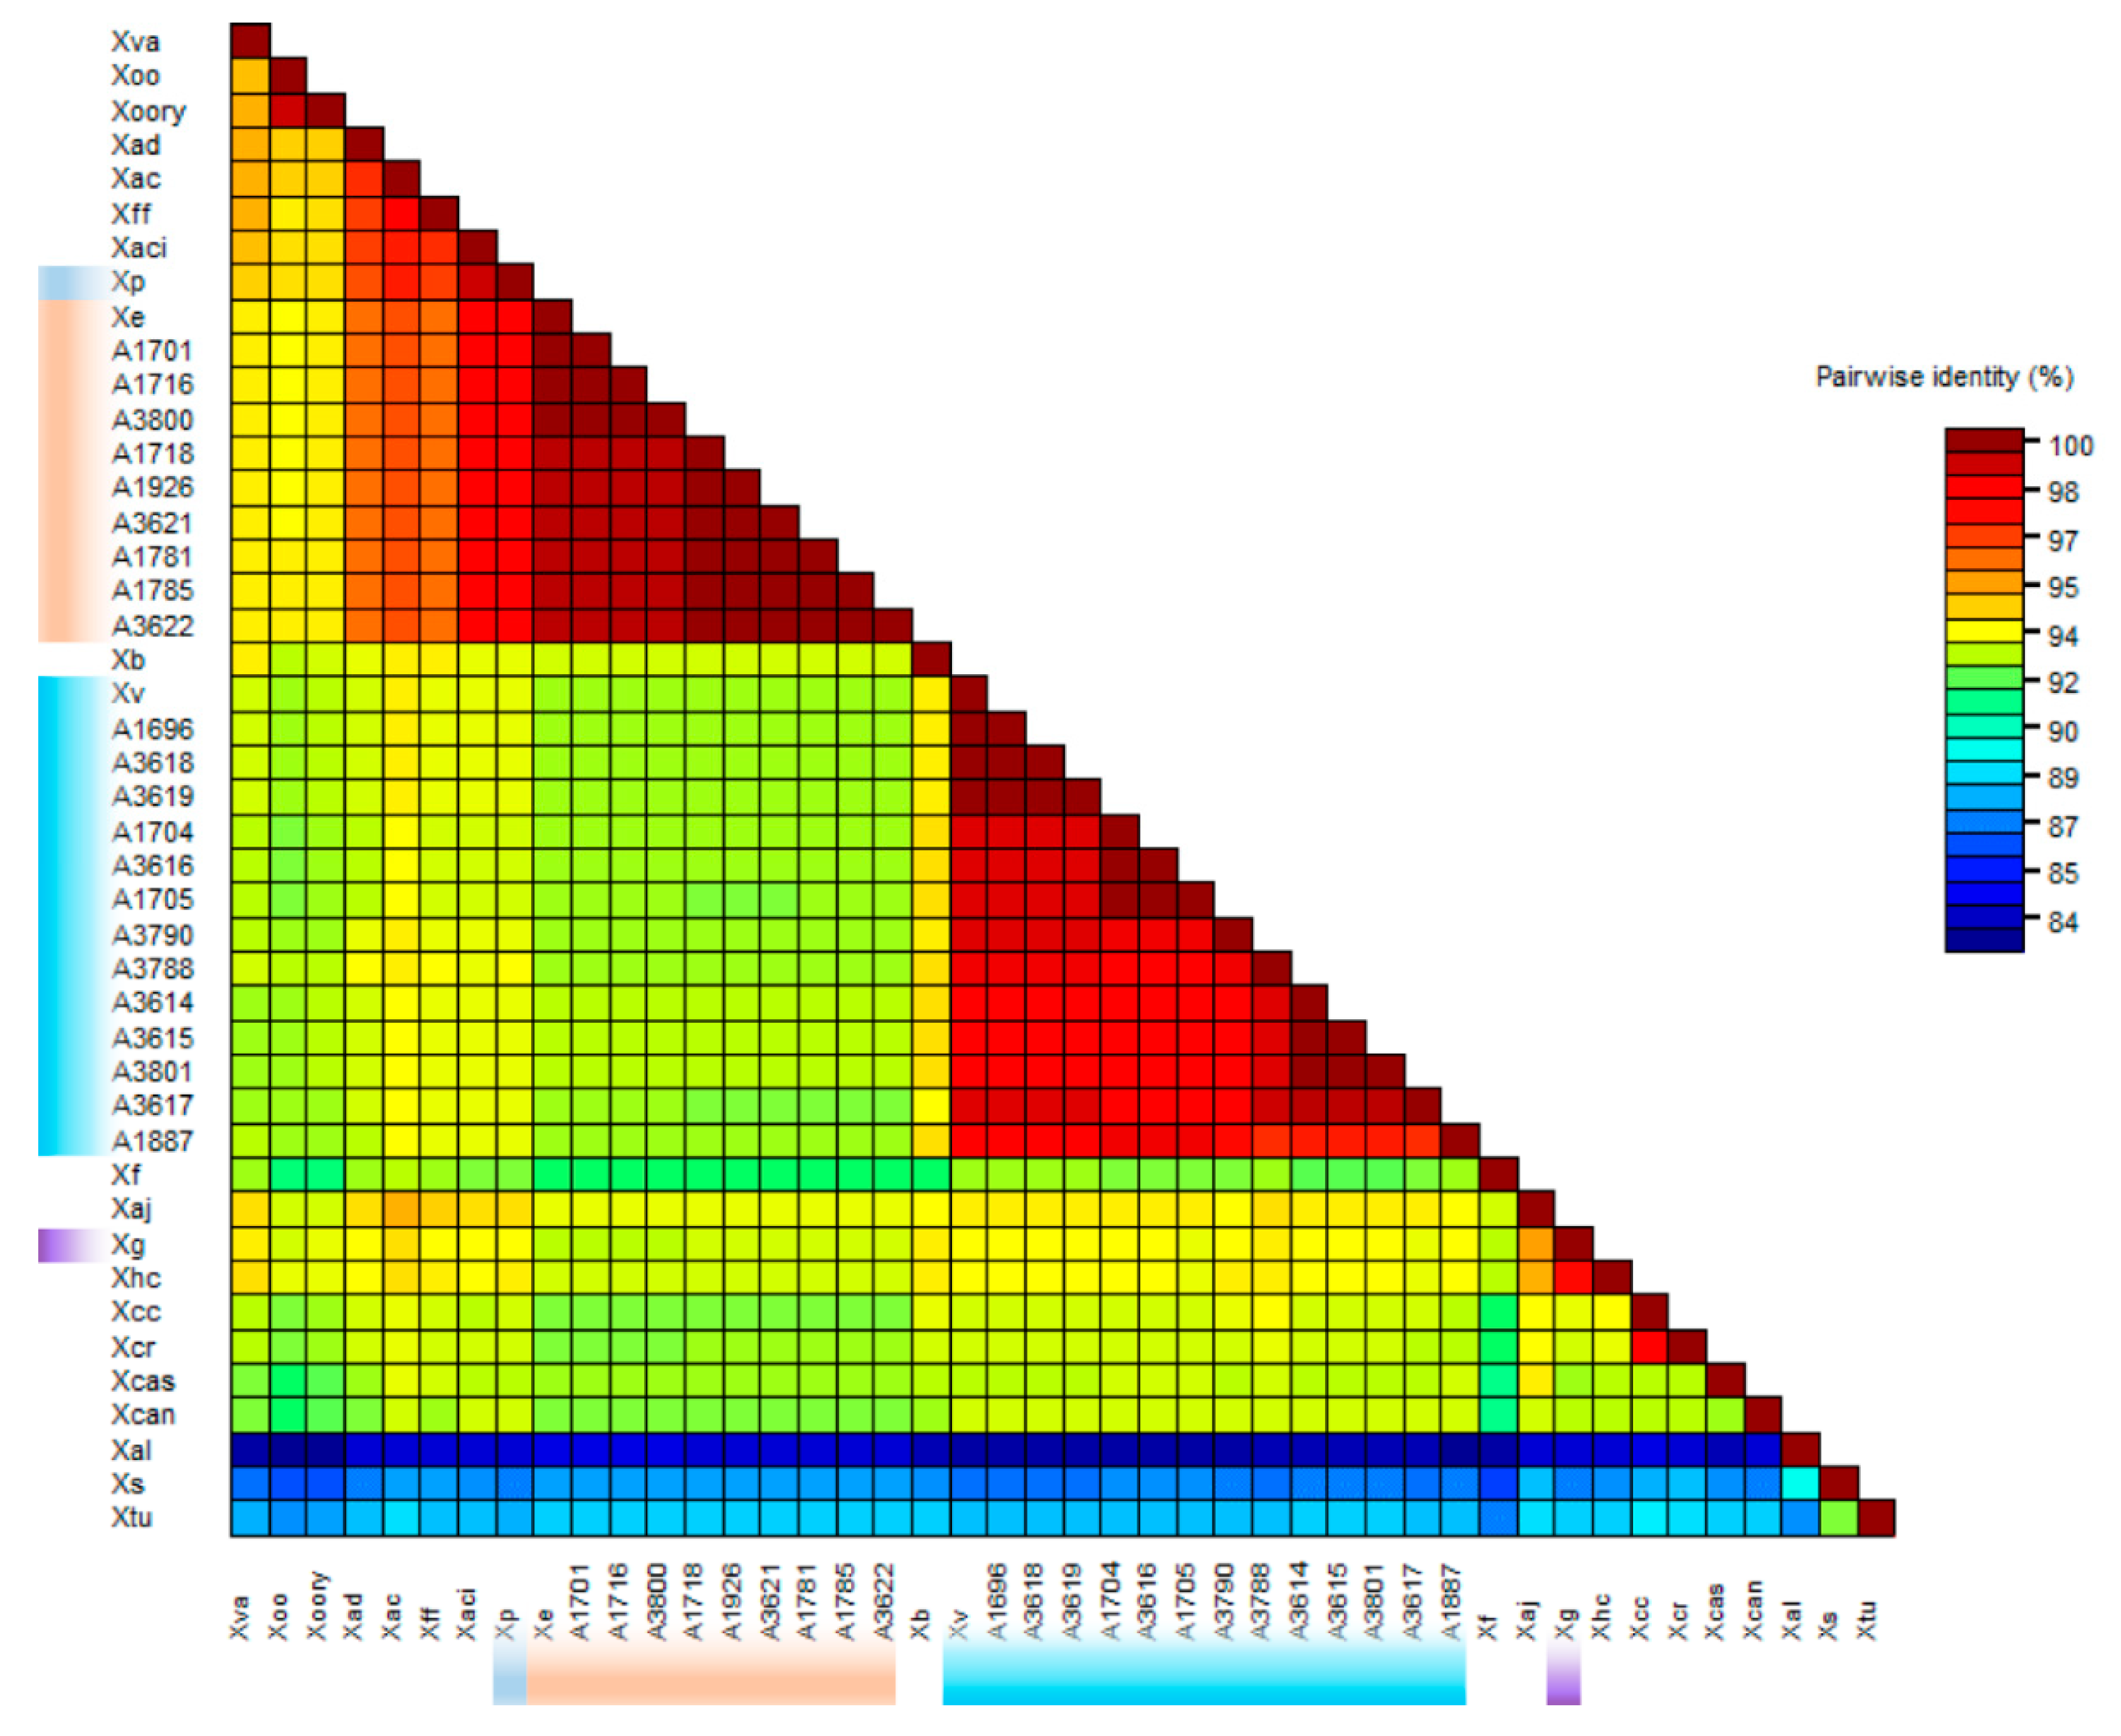
Sequences for five genes (dnaA, gyrB, gapA, hmbs, and pdg) of all X. vesicatoria strains and nine X. euvesicatoria representative strains from group A1 (A1701, A1716, A3800), A2 (A1781, A1785, A3622), and a subgroup within group A2 (A1926, A1718, A3621), along with the other Xanthomonas species (sequences of dnaA, gyrB, gapA, hmbs, and pdg genes were extracted from the genome or shotgun sequences, NCBI GenBank genome database), were used to determine the relative position of X. euvesicatoria and X. vesicatoria in a phylogenetic tree (Figure 2 and Figure 3). Gene gyrB showed several gaps in sequence alignment. Phylogenetic analysis of the concatenated sequences resolved the plant pathogenic xanthomonads into eight well supported clades (Figure 2). X. vesicatoria clustered together in a clade with X. bromi; X. vesicatoria reference strain LM159 was identical to strains A3618, A1696, and A3619, and formed a subgroup within the X. vesicatoria clade. X. saccharai, X. albilineans, and X. translucens pv. undulosa formed the second clade. X. campestris pv. raphani, X. campestris pv. campestris, X. cassavae and X. cannabis formed the third clade. The fourth clade was comprised of X. hortorum pv. carotae, X. gardneri, X. arboricola pv. Juglandis, and X. fragariae, whereas X. oryxae pv. oryzae, X. oryzae pv. oryzicola, and X. vassicola grouped together to form the fifth clade. X. axonopodis pv. citri and X. fuscans subsp. fuscans formed sixth clade, while X. perforans and X. axonopodis pv. citrumelo were in the seventh clade. X. euvesicatoria formed the eighth clade. The X. euvesicatoria reference strain LMG930 was identical to X. euvesicatoria group A1 strains and was 98%, 97.9%, 96%, 93%, and 92.6% identical to X. axonopodis pv. citrumelo, X. perforans, X. campestris pv. dieffenbachiae, X. gardneri, and X. vesicatoria, respectively. Reference strain LMG 930 shared only 84.7%, 85.5%, and 87.9% nucleotide identity with X. albilineans, X. translucens, and X. sacchari, respectively. Similarly, X. vesicatoria reference strain LM159 was most closely related to X. bromi (94%) and was least close to X. albilineans (83.6%). X. sacchari and X. translucens pv. undulosa shared only 87.2% and 88.3% average nucleotide identity with X. vesicatoria reference strain LM159. X. campestris pv. campestris and X. campestris pv. raphani were 97.8% identical. The xanthomonads, X. sacchari, X. albilineans, and X. translucens pv. undulosa in the second clade were very different than the remaining strains. X. albilineans was less than 85% similar, X. sacchari shared less than 88% average nucleotide identity, and X. translucens pv. undulosa was less than 89% identical to the other xanthomonads (species other than X. sacchari, X. translucens pv undulosa, and X. albilineans). X. albilineans, X. sacchari, and X. translucens pv undulosa caused leaf scald of sugarcane, chlorotic leaf streak of sugarcane, and leaf streak of wheat, respectively.
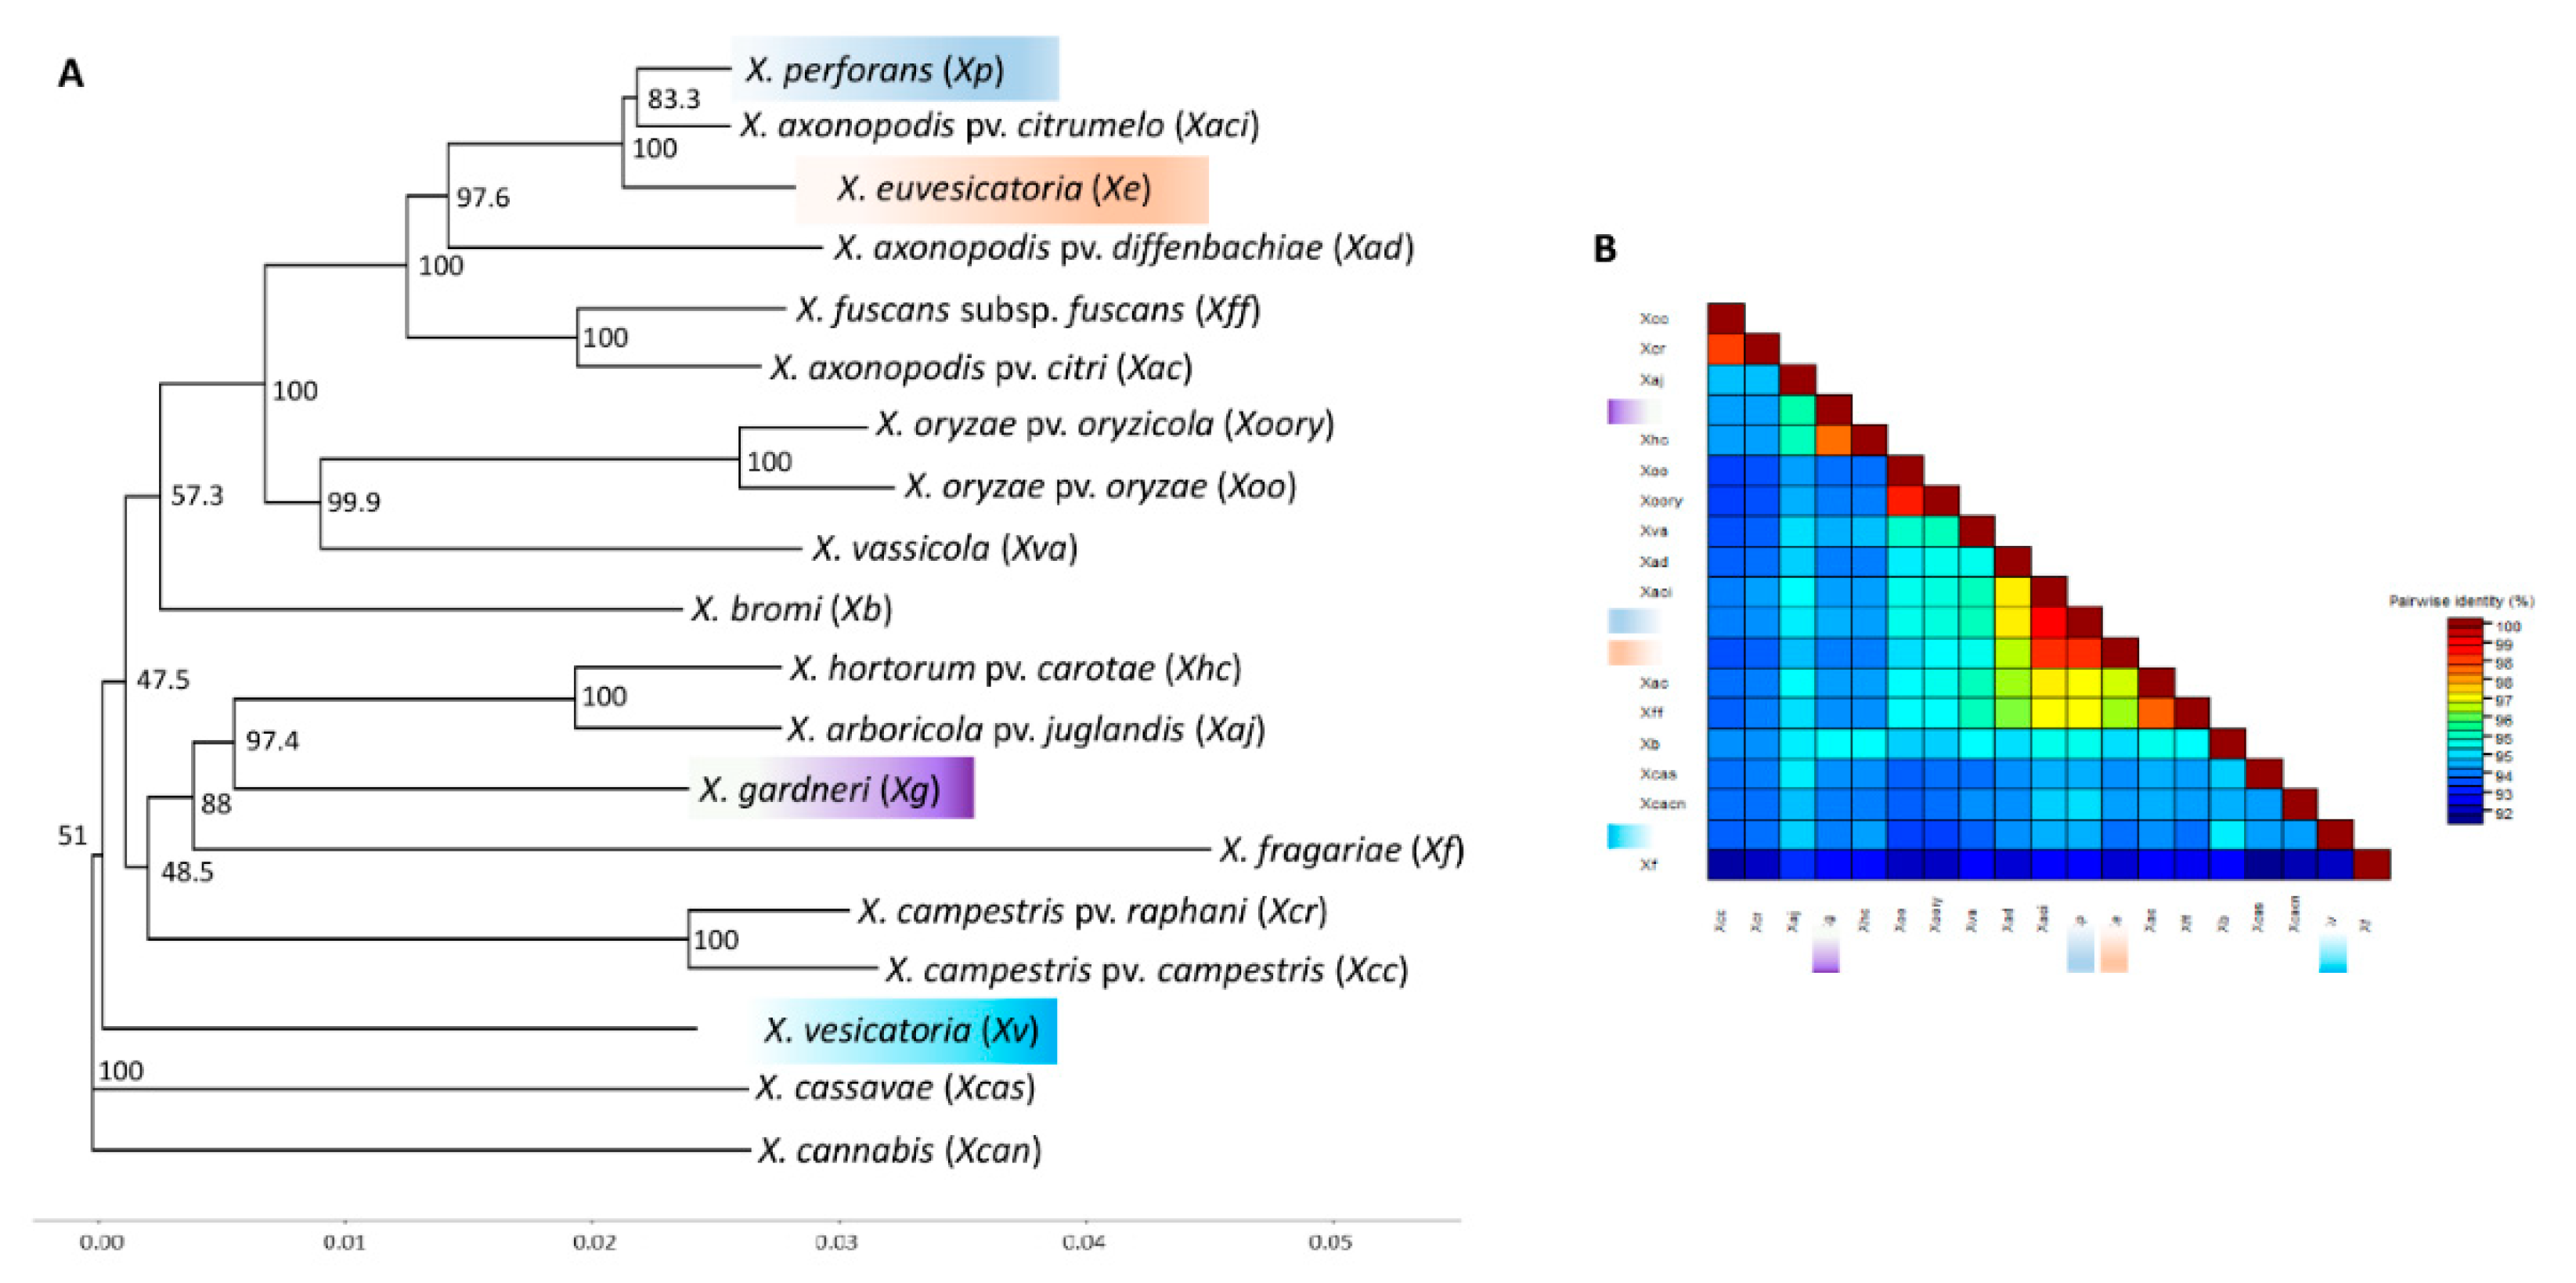
To comprehensively determine the position X. euvesicatoria and X. vesicatoria in a phylogenetic tree, a concatenated tree was constructed using the complete sequences of nine genes (dnaA, gyrB, gapA, pdg, hmbs, lacF, fusA, gltA, dnaK) extracted from representative genomes of Xanthomonas species/subspecies/pathovars that cause diseases in different plants (Figure 4). The tree was constructed with a concatenated fragment 14,595 (14,601 including gaps) bp long. Among the four species of Xanthomonas causing bacterial spot, X. euvesicatoria and X. perforans were most closely related. They grouped together with X. axonopodis pv. citrumelo, a pathogen of citrus causing bacterial leaf spot and showed 99.1% and 98.6% similarity with X. perforans and X. euvesicatoria, respectively (Figure 4). X. gardneri was closest to X. hortorum pv. carotae, a pathogen of carrot causing bacterial leaf blight. X. vesicatoria did not show high similarity with X. bromi, as revealed in Figure 2, which was generated using five gene sequences, while Figure 4 was generated with nine gene sequences. Both trees (Figure 2 and Figure 4) reveal the same picture except that X. vesicatoria grouped with X. bromi in Figure 2, but X. vesicatoria grouped separately from all the species and away from X. bromi in Figure 4. Also, X. euvesicatoria grouped with X. perforans and X. axonopodis pv. citrumelo in Figure 4, while it was well separated from rest of the species in Figure 2.
Sequences for 16s rRNA exhibited less diversity among the plant pathogenic xanthomonads compared to the other genes used in the study. The phylogenetic tree obtained with 16s rRNA gene sequences was not congruent with the concatenated trees produced with the five genes (dnaA, gyrB, hmbs, pdg, and gapA) or nine genes (dnaA, gyrB, gapA, pdg, hmbs, lacF, fusA, gltA, dnaK). All Xanthomonas species of plant pathogenic xanthomonads included in this study resolved into three major clades. The 16s sequences for X. euvesicatoria, X. perforans, X. fuscans subsp. fuscans, and X. axonopodis pv. citrumelo were identical, so were the sequences for X. axonopodis pv. diffenbachiae, X. cassavae, and X. axonopodis pv. citri. These species grouped together to form a clade with X. albilineans, X. sacchari, and X. translucens pv. undulosa (Figure 5). X. albilineans, X. saccharai, and X. translucens pv. undulosa were very different from rest of the xanthomonads and grouped away with other species in this clade. X. cannabis, X. gardneri, X. hortorum pv. carotae, X. campestris pv. campestris, X. raphani, and X. arboricola pv. juglandis clustered together in another clade. The third clade was formed by X. vesicatoria, X. fragariae, X. oryzae pv. oryzicola, X. bromi, X. vassicola, and X. oryzae pv. oryzae.

3.4. Phylogenetic Analysis of Antibody Data

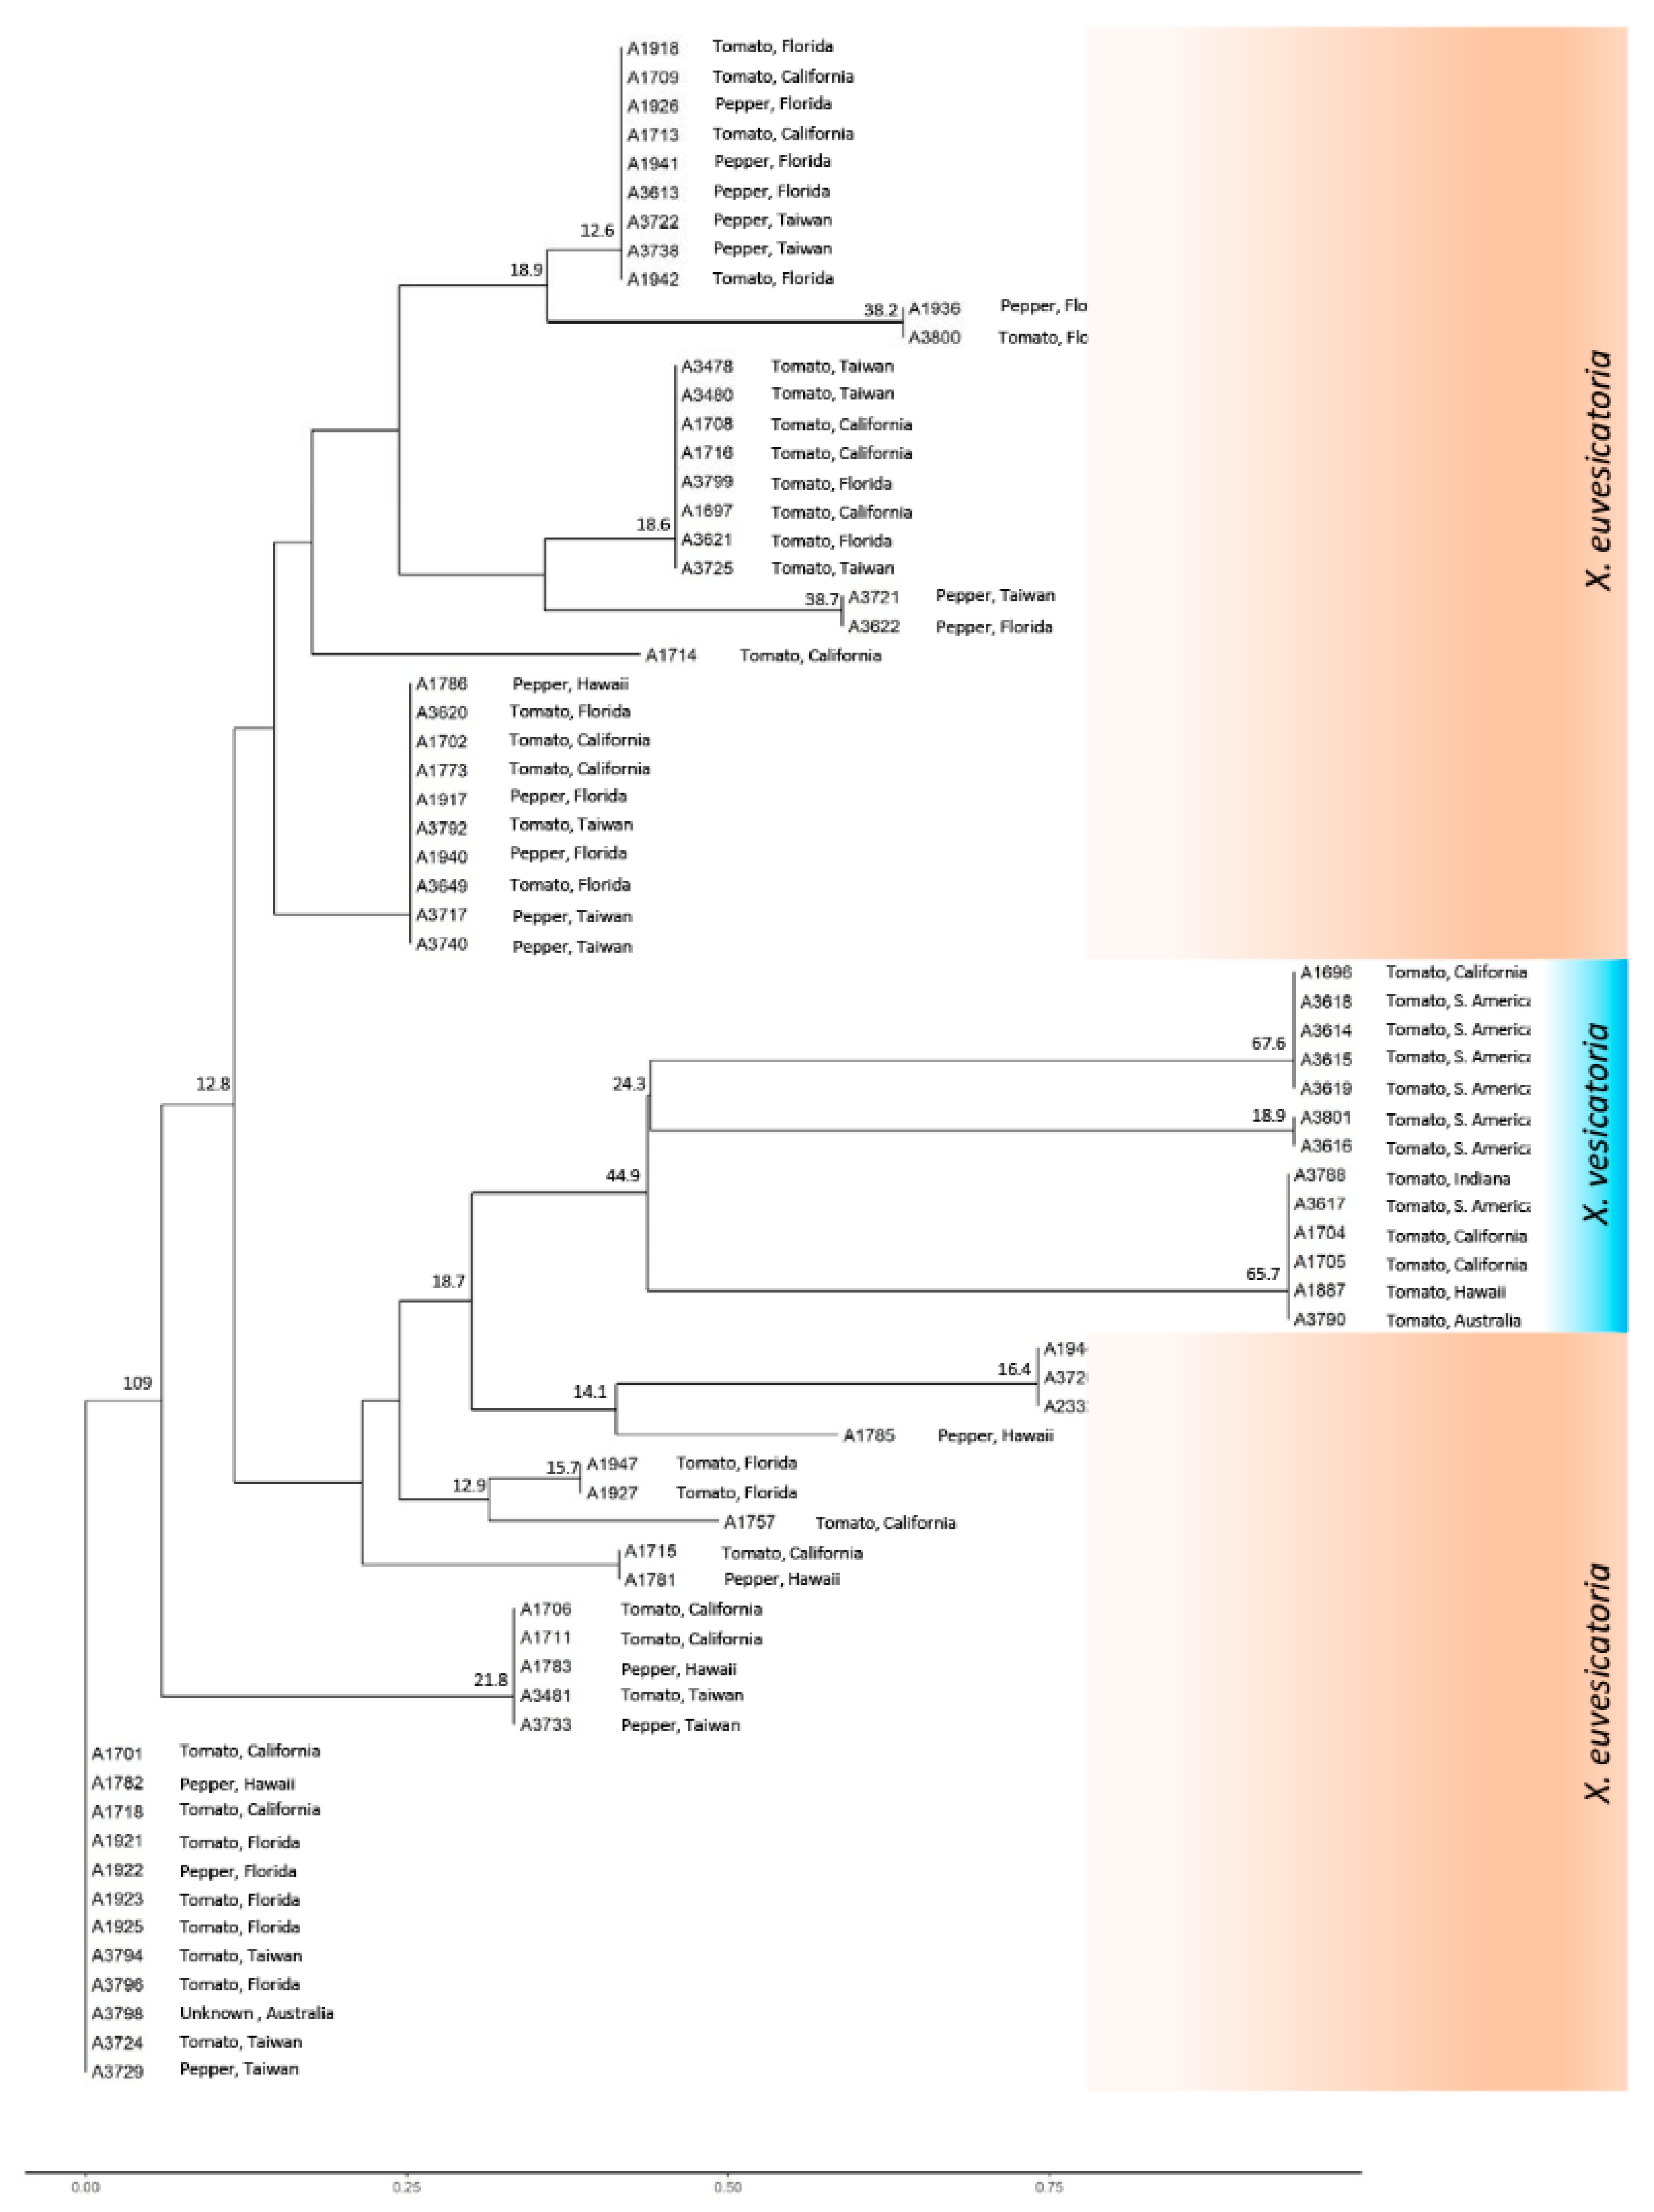
In ELISA, monoclonal antibodies, Mab1, Mab3, Mab5, and Mab7 reacted specifically with X. euvesicatoria, whereas Mab8 or Mab15 reacted with the X. vesicatoria strains. None of the X. vesicatoria strains that reacted with Mab8 also reacted with Mab15. One X. euvesicatoria strain (A1757) reacted with Mab8, as well as with the X. euvesicatoria-specific Mabs (Mab1, 3, 5, and 7). For the phylogenetic analysis, a positive reaction with any antibody was scored 1 and a negative reaction was scored 0 to obtain binary data matrix. Upon analysis, a combination of Mabs 1, 3, 5, 7, 8, and 15 clearly separated X. euvesicatoria from X. vesicatoria. The X. vesicatoria strains grouped together in a single clade with three subgroups, while X. euvesicatoria formed 12 clades (Figure 6). Strains formed clusters independent of the geographic locations where they were collected. Nevertheless, most of the X. vesicatoria strains were from South America and California, and none were from Florida or Taiwan.

4. Discussion

MLSA with six genes (hrcN, dnaA, gapA, gyrB, hmbs, and pdg) and ELISA were used to characterize the diversity within and among X. euvesicatoria and X. vesicatoria collected from a wide range of geographic locations. Phylogenetic analysis with ELISA and all six individual genes resolved X. euvesicatoria and X. vesicatoria into different clusters (Figure 6 and Figures S1–S6). X. vesicatoria exhibited higher diversity and fewer geographical origins than X. euvesicatoria, while the latter strains showed less diversity but greater geographical representation. Genes hmbs and pdg, identified through comparative genomics, showed higher resolution within X. euvesicatoria than the genes traditionally used for population genetics studies of xanthomonads.
X. euvesicatoria had greater representation in our collection (58 out of 76 strains), but exhibited less diversity compared to X. vesicatoria. This may indicate that relatively uniform populations of X. euvesicatoria were spread through the contaminated seed. Group A1 strains with identical sequences were isolated from plants in California, Florida, and Taiwan, and group A2 strains were from California, Florida, Hawaii, Taiwan, and Australia. The presence of identical genotypes across Asia and America (group A1) and America, the Pacific, Asia, and Australia (group A2) clearly suggests that international seed trade played a significant role in spreading this BLS pathogen across the globe. Interestingly, X. perforans, first detected in Florida in 1991, was also not found in our collection—this indicates that this species emerged in Florida after 1990.
Surprisingly, the greatest genetic diversity was observed within the smaller number of X. vesicatoria (n = 14) strains evaluated in this study, rather than within X. euvesicatoria strains. Concatenated analysis of X. vesicatoria formed small subgroups within the larger X. vesicatoria clade; similar groups were formed when the phylogenetic tree was generated using individual genes. Higher diversity within X. vesicatoria was also reported by other researchers [8,17,27]. Geographic separation of groups within X. vesicatoria has also been reported by Timilsina et al. [17]. Most of the X. vesicatoria strains used in this study were from South America and California; they formed five small subgroups, whereas individual strains from Australia, Indiana, and Hawaii showed distinct genotypes and grouped separately from South American and Californian strains. X. vesicatoria strain A1887 from Hawaii was distinct from all the other X. vesicatoria. Two X. vesicatoria strains (A3618 and A3619) from South America were identical to A1696 from California; this also could be due to the movement of infected seeds from one location to the other.
Genes hrcN, gyrB, and gapA showed little resolving power within X. euvesicatoria, with the result that all X. euvesicatoria strains grouped into a single cluster (Figures S1, S3 and S4). Arif et al. [14] obtained no differences in populations of the ryegrass bacterial pathogen Rathayibacter toxicus when traditional housekeeping genes were used; however, the selection of the genes through comparative genomics resolved the populations into three distinct groups. In contrast to the previous report [17], gapA did not differentiate X. euvesicatoria populations; this could be due to different origins of the strains. We did not have access to the strains from India, Barbados, and Grenada, which formed a second group in the previous phylogenetic analysis [17]. Thus, it is likely that there are more than three populations of X. euvesicatoria worldwide; therefore, a comprehensive study with strains representing broader geographic locations is needed before the true diversity within X. euvesicatoria can be resolved. MLSA genes dnaA, hmbs, and pdg differentiated X. euvesicatoria strains into two groups; the two subgroups resolved using hmbs and pdg were identical and well supported with high bootstrap values (Figures S5 and S6). The X. euvesicatoria group A1 resolved using hmbs and pdg was host-specific, comprising strains from tomato only. Group A2 consisted mostly of pepper strains and some tomato strains. The host of strain A3798 (subgroup within group A2) was unknown to us when received.
The phylogenetic tree generated using the binary data from ELISA analysis showed a clear separation of the X. vesicatoria strains from the X. euvesicatoria strains (Figure 6). The ELISA analysis showed better resolution than MLSA and further divided the X. euvesicatoria strains into 13 subgroups (Figure 6). The greater diversity of individual populations can be attributed to the presence of multiple antigenic determinants on bacterial cell surfaces that trigger host responses in plant–bacterial interactions.
Phylogenetic analysis with all the genes except pdg placed X. perforans very close to X. euvesicatoria; pdg gene analysis showed that X. perforans shared 96.9–97.5% ANI with X. vesicatoria, while only 93.8%–94.1% ANI with X. euvesicatoria strains (Figure S6). Sequences of five genes (dnaA, gyrB, gapA, hmbs, and pdg) were extracted from a publicly available genome database of plant pathogenic xanthomonads (including X. euvesicatoria and X. vesicatoria reference strains) and an analysis was done to determine the position of BLS xanthomonads relative to these species and vice versa. Phylogenetic analysis placed X. euvesicatoria, X. vesicatoria, X. gardneri, and X. perforans in strongly supported clades (Figure 2). Separation of X. euvesicatoria, X. vesicatoria, and X. gardneri as different species is supported by phylogenetic analysis as well as ANI values. These species shared less than 94% ANI (Figure 3). There is an ongoing debate as to whether to separate X. perforans from X. euvesicatoria, with a group of researchers believing they should be placed together as a single species [18,28,29,30]. Interestingly, in our analysis, X. perforans was most closely related to X. axonopodis pv. citrumelo and these strains were placed close together in the phylogenetic analysis with strong bootstrap support (Figure 2 and Figure 4). X. perforans and X. axonopodis pv. citrumelo shared 99.2% common nucleotide sequences (Figure 3). X. euvesicatoria and X. perforans were 97.5% identical in these five gene sequences (Figure 3). More studies at genome level are needed to determine whether X. perforans is closer to X. euvesicatoria or X. axonopodis pv. citrumelo, and to determine whether these three species should be retained as a separate species or be combined. The X. gardneri strain grouped together with X. hortorum pv. carotae with 100% bootstrap support (97.7% ANI) and X. vesicatoria was placed together in a clade with X. bromi (94% ANI) (Figure 2 and Figure 3). Based on phylogenetic analysis of four housekeeping genes, Young et al. [30] proposed that X. albilineans, X. sacchari, X. translucens pv. undolusa, and X. hyacinthi might be a different genus. In our study, X. albilineans, X. sacchari, and X. translucens pv. undolusa were observed to be very different to rest of the Xanthomonas species and revealed less than 85%, 88%, and 89% ANI with rest of Xanthomonas species, respectively. The sequences of dnaK, fusA, gltA, and lacF genes were not matched when mapped with the X. albilineans, X. sacchari, and X. translucens pv. undolusa genomes available in the NCBI GenBank databases, which makes them different from other species. The similar positions were also revealed in 16s RNA gene analysis (Figure 5), however, 16s RNA analyses are not known for comprehensive discrimination at species level.
Recombination in the housekeeping genes atpD [27,31], gapA, and gyrB [17] has been reported earlier in X. euvesicatoria and X. perforans. The atpD gene was not used in this study and no recombination was observed in gapA and gyrB genes. Homologous recombination usually occurs between closely related species or pathovars within a species [32,33]. Rates of recombination and acquisition of genes by horizontal gene transfer are high among xanthomonads [34] and a minimum of 10% of the core genes are laterally transferred during evolution of gamma proteobacteria [35].
In conclusion, we have described the genetic diversity of X. euvesicatoria and X. vesicatoria, and the phylogenetic positions of X. euvesicatoria and X. vesicatoria relative to each other and other xanthomonads. Little genetic diversity among X. euvesicatoria strains is consistent with worldwide movement of clonal populations in seeds, whereas geographic isolation appears to be shaping the population structure of X. vesicatoria. MLST analyses also illustrated that X. albilineans, X. sacchari, and X. translucens pv. undolusa were very different to rest of the Xanthomonas species and showed less than 85%, 88%, and 89% ANI with rest of Xanthomonas species, respectively. Knowledge of the genetic diversity in bacterial populations is fundamental to disease management decisions at the field and policy level.

Supplementary Materials

The following are available online at https://www.mdpi.com/2076-2607/7/10/462/s1.

Author Contributions

Data curation, U.D., A.M.A., and M.A.; formal analysis, U.D.; funding acquisition, M.A.; investigation, M.A.; methodology, U.D. and M.A.; project administration, M.A.; resources, M.A.; software, U.D. and M.A.; supervision, M.A.; validation, M.A., U.D., S.D., and A.M.A.; visualization, M.A.; writing—original draft, U.D.; writing—review and editing, S.D., A.M.A. and M.A.

Funding

This work was supported by the USDA National Institute of Food and Agriculture, Hatch project 9038H, managed by the College of Tropical Agriculture and Human Resources. The strains used in this study were revived and maintained by National Science Foundation grant support (NSF-CSBR grant no. DBI-1561663).

Acknowledgments

We also thank Mathews Paret (University of Florida) for providing the genomic DNA of Xanthomonas perforans and X. gardneri strains.

Conflicts of Interest

Authors declare no competing interest.

References

  1. Bradbury, J.F. Guide to Plant Pathogenic Bacteria; CAB International Mycological Institute: Farnham House, Slough, UK, 1986. [Google Scholar]
  2. Boch, J.; Bonas, U. Xanthomonas AvrBs3 Family-Type III effectors: Discovery and function. Annu. Rev. Phytopathol. 2010, 48, 419–436. [Google Scholar] [CrossRef] [PubMed]
  3. Jones, J.B.; Lacy, G.H.; Bouzar, H.; Stall, R.E.; Schaad, N.W. Reclassification of the xanthomonads associated with bacterial spot disease of tomato and pepper. Syst. Appl. Microbiol. 2004, 27, 755–762. [Google Scholar] [CrossRef] [PubMed]
  4. Scott, J.W.; Somodi, G.C.; Jones, J.B. Resistance to bacterial spot fruit infection in tomato. HortScience 1989, 24, 825–827. [Google Scholar]
  5. Stall, R.E.; Beaulieu, C.; Egel, D.; Hodge, N.C.; Leite, R.P.; Minsavage, G.V.; Bouzar, H.; Jones, J.B.; Alvarez, A.M.; Benedict, A.A. Two genetically diverse groups of strains are included in Xanthomonas campestris pv. vesicatoria. Int. J. Syst. Evol. Microbiol. 1994, 44, 47–53. [Google Scholar] [CrossRef]
  6. Bouzar, H.; Jones, J.B.; Stall, R.E.; Hodge, N.C.; Minsavage, G.V.; Benedict, A.A.; Alvarez, A.M. Physiological, chemical, serological, and pathogenic analyses of a worldwide collection of Xanthomonas campestris pv. vesicatoria strains. Phytopathology 1994, 84, 663–671. [Google Scholar] [CrossRef]
  7. Vauterin, L.; Hoste, B.; Kersters, K.; Swings, J. Reclassification of Xanthomonas. Int. J. Syst. Evol. Microbiol. 1995, 45, 472–489. [Google Scholar] [CrossRef]
  8. Roach, R.; Mann, R.; Gambley, C.G.; Shivas, R.G.; Rodoni, B. Identification of Xanthomonas species associated with bacterial leaf spot of tomato, capsicum and chili crops in eastern Australia. Eur. J. Plant Pathol. 2017, 150, 595–608. [Google Scholar] [CrossRef]
  9. Larrea-Sarmiento, A.; Dhakal, U.; Boluk, G.; Fatdal, L.; Alvarez, A.; Strayer-Scherer, A.; Paret, M.; Jones, J.; Jenkins, D.; Arif, M. Development of a genome-informed loop-mediated isothermal amplification assay for rapid and specific detection of Xanthomonas euvesicatoria. Sci. Rep. 2018, 8, 14298. [Google Scholar] [CrossRef]
  10. Potnis, N.; Timilsina, S.; Strayer, A.; Shantharaj, D.; Barak, J.D.; Paret, M.L.; Vallad, G.E.; Jones, J.B. Bacterial spot of tomato and pepper: Diverse Xanthomonas species with a wide variety of virulence factors posing a worldwide challenge. Mol. Plant Pathol. 2015, 16, 907–920. [Google Scholar] [CrossRef]
  11. Vancheva, T.; Stoyanova, M.; Tatyozova, M.; Bogatzevska, N.; Moncheva, P. Sub-species diversity of Xanthomonas euvesicatoria Bulgarian and Macedonian strains from pepper. Biotechnol. Biotec. Eq. 2014, 28, 592–601. [Google Scholar] [CrossRef]
  12. Parkinson, N.; Aritua, V.; Heeney, J.; Cowie, C.; Bew, J.; Stead, D. Phylogenetic analysis of Xanthomonas species by comparison of partial gyrase B gene sequences. Int. J. Syst. Evol. Microbiol. 2007, 57, 2881–2887. [Google Scholar] [CrossRef] [PubMed]
  13. Parkinson, N.; Cowie, C.; Heeney, J.; Stead, D. Phylogenetic structure of Xanthomonas determined by comparison of gyrB sequences. Int. J. Syst. Evol. Microbiol. 2009, 59, 264–274. [Google Scholar] [CrossRef] [PubMed]
  14. Arif, M.; Busot, G.Y.; Mann, R.; Rodoni, B.; Liu, S.; Stack, J.P. Emergence of a new population of Rathayibacter toxicus: An ecologically complex, geographically isolated bacterium. PLoS ONE 2016, 11, e0156182. [Google Scholar] [CrossRef]
  15. Young, J.M.; Wilkie, J.P.; Park, D.C.; Watson, D.R.W. New Zealand strains of plant pathogenic bacteria classified by multi-locus sequence analysis; proposal of Xanthomonas dyei sp. nov. Plant Pathol. 2010, 59, 270–281. [Google Scholar] [CrossRef]
  16. Kebede, M.; Timilsina, S.; Ayalew, A.; Admassu, B.; Potnis, N.; Minsavage, G.V.; Goss, E.M.; Hong, J.C.; Strayer, A.; Paret, M.; et al. Molecular characterization of Xanthomonas strains responsible for bacterial spot of tomato in Ethiopia. Eur. J. Plant. Pathol. 2014, 140, 677–688. [Google Scholar] [CrossRef]
  17. Timilsina, S.; Jibrin, M.O.; Potnis, N.; Minsavage, G.V.; Kebede, M.; Schwartz, A.; Bart, R.; Staskawicz, B.; Boyer, C.; Vallad, G.E.; et al. Multilocus sequence analysis of xanthomonads causing bacterial spot of tomato and pepper plants reveals strains generated by recombination among species and recent global spread of Xanthomonas gardneri. Appl. Environ. Microbiol. 2015, 81, 1520–1529. [Google Scholar] [CrossRef]
  18. Roach, R.; Mann, R.; Gambley, C.G.; Chapman, T.; Shivas, R.G.; Rodoni, B. Genomic sequence analysis reveals diversity of Australian Xanthomonas species associated with bacterial leaf spot of tomato, capsicum and chilli. BMC Genomics 2019, 20, 310. [Google Scholar] [CrossRef]
  19. Schneider, K.L.; Marrero, G.; Alvarez, A.M.; Presting, G.G. Classification of plant associated bacteria using RIF, a computationally derived DNA marker. PLoS ONE 2011, 6, e18496. [Google Scholar] [CrossRef]
  20. Darling, A.E.; Mau, B.; Perna, N.T. Progressive mauve: Multiple genome alignment with gene gain, loss and rearrangement. PLoS ONE 2010, 5, e11147. [Google Scholar] [CrossRef]
  21. Rozen, S.; Skaletsky, H. Primer3 on the WWW for General Users and for Biologist Programmers. In Bioinformatics Methods and Protocols: Methods in Molecular Biology; Krawetz, S., Misener, S., Eds.; Humana Press: Totowa, NJ, USA, 2000; pp. 365–386. [Google Scholar] [CrossRef]
  22. Ocenar, J.; Arizala, D.; Boluk, G.; Dhakal, U.; Gunarathne, S.; Paudel, S.; Dobhal, S.; Arif, M. Development of a robust, field-deployable loop-mediated isothermal amplification (LAMP) assay for specific detection of potato pathogen Dickeya dianthicola targeting a unique genomic region. PLoS ONE 2019, 14, e0218868. [Google Scholar] [CrossRef]
  23. RStudio, version 3.4.3; Integrated Development for R; RStudio, Inc.: Boston, MA, USA, 2015; Available online: http://www.rstudio.com/ (accessed on 23 August 2017).
  24. Paradis, E.; Claude, J.; Strimmer, K. APE: Analyses of phylogenetics and evolution in R language. Bioinformatics 2004, 20, 289–290. [Google Scholar] [CrossRef] [PubMed]
  25. Yu, G.; Smith, D.K.; Zhu, H.; Guan, Y.; Lam, T.T.Y. ggtree: An r package for visualization and annotation of phylogenetic trees with their covariates and other associated data. Methods Ecol. Evol. 2017, 8, 28–36. [Google Scholar] [CrossRef]
  26. Alvarez, A.; Benedict, A.; Mizumoto, C. Identification of xanthomonads and grouping of strains of Xanthomonas campestris pv. campestris with monoclonal antibodies. Phytopathology 1985, 75, 722–728. [Google Scholar] [CrossRef]
  27. Hamza, A.A.; Robene-Soustrade, I.; Jouen, E.; Lefeuvre, P.; Chiroleu, F.; Fisher-Le Saux, M.; Gagnevin, L.; Pruvost, O. MultiLocus Sequence Analysis- and Amplified Fragment Length Polymorphism-based characterization of xanthomonads associated with bacterial spot of tomato and pepper and their relatedness to Xanthomonas species. Syst. Appl. Microbiol. 2012, 35, 183–190. [Google Scholar] [CrossRef] [PubMed]
  28. Constantin, E.C.; Cleenwerck, I.; Maes, M.; Baeyen, S.; Van Malderghem, C.; De Vos, P.; Cottyn, B. Genetic characterization of strains named as Xanthomonas axonopodis pv. dieffenbachiae leads to a taxonomic revision of the X. axonopodis species complex. Plant Pathol. 2016, 65, 729–806. [Google Scholar] [CrossRef]
  29. Potnis, N.; Krasileva, K.; Chow, V.; Almeida, N.F.; Patil, P.B.; Ryan, R.P.; Sharlach, M.; Behlau, F.; Dow, J.M.; Momol, M.T.; et al. Comparative genomics reveals diversity among xanthomonads infecting tomato and pepper. BMC Genomics 2011, 12, 146. [Google Scholar] [CrossRef]
  30. Young, J.M.; Park, D.C.; Shearman, H.M.; Fargier, E. A multilocus sequence analysis of the genus Xanthomonas. Syst. Appl. Microbiol. 2008, 31, 366–377. [Google Scholar] [CrossRef]
  31. Ngoc, L.B.T.; Vernière, C.; Jouen, E.; Ah-You, N.; Lefeuvre, P.; Chiroleu, F.; Gagnevin, L.; Pruvost, O. Amplified fragment length polymorphism and multilocus sequence analysis-based genotypic relatedness among pathogenic variants of Xanthomonas citri pv. citri and Xanthomonas campestris pv. bilvae. Int. J. Syst. Evol. Microbiol. 2010, 60, 515–525. [Google Scholar] [CrossRef]
  32. Horvath, D.M.; Stall, R.E.; Jones, J.B.; Pauly, M.H.; Vallad, G.E.; Dahlbeck, D.; Staskawicz, B.J.; Scott, J.W. Transgenic resistance confers effective field level control of bacterial spot disease in tomato. PLoS ONE 2012, 7, e42036. [Google Scholar] [CrossRef]
  33. Posada, D.; Crandall, K.A.; Holmes, E.C. Recombination in evolutionary genomics. Annu. Rev. Genet. 2002, 36, 75–97. [Google Scholar] [CrossRef]
  34. Comas, I.; Moya, A.; Azad, R.K.; Lawrence, J.G.; Gonzalez-Candelas, F. The evolutionary origin of xanthomonadales genomes and the nature of the horizontal gene transfer process. Mol. Biol. Evol. 2006, 23, 2049–2057. [Google Scholar] [CrossRef] [PubMed]
  35. Susko, E.; Leigh, J.; Doolittle, W.F.; Bapteste, E. Visualizing and assessing phylogenetic congruence of core gene sets: A case study of the γ-proteobacteria. Mol. Biol. Evol. 2006, 23, 1019–1030. [Google Scholar] [CrossRef] [PubMed]
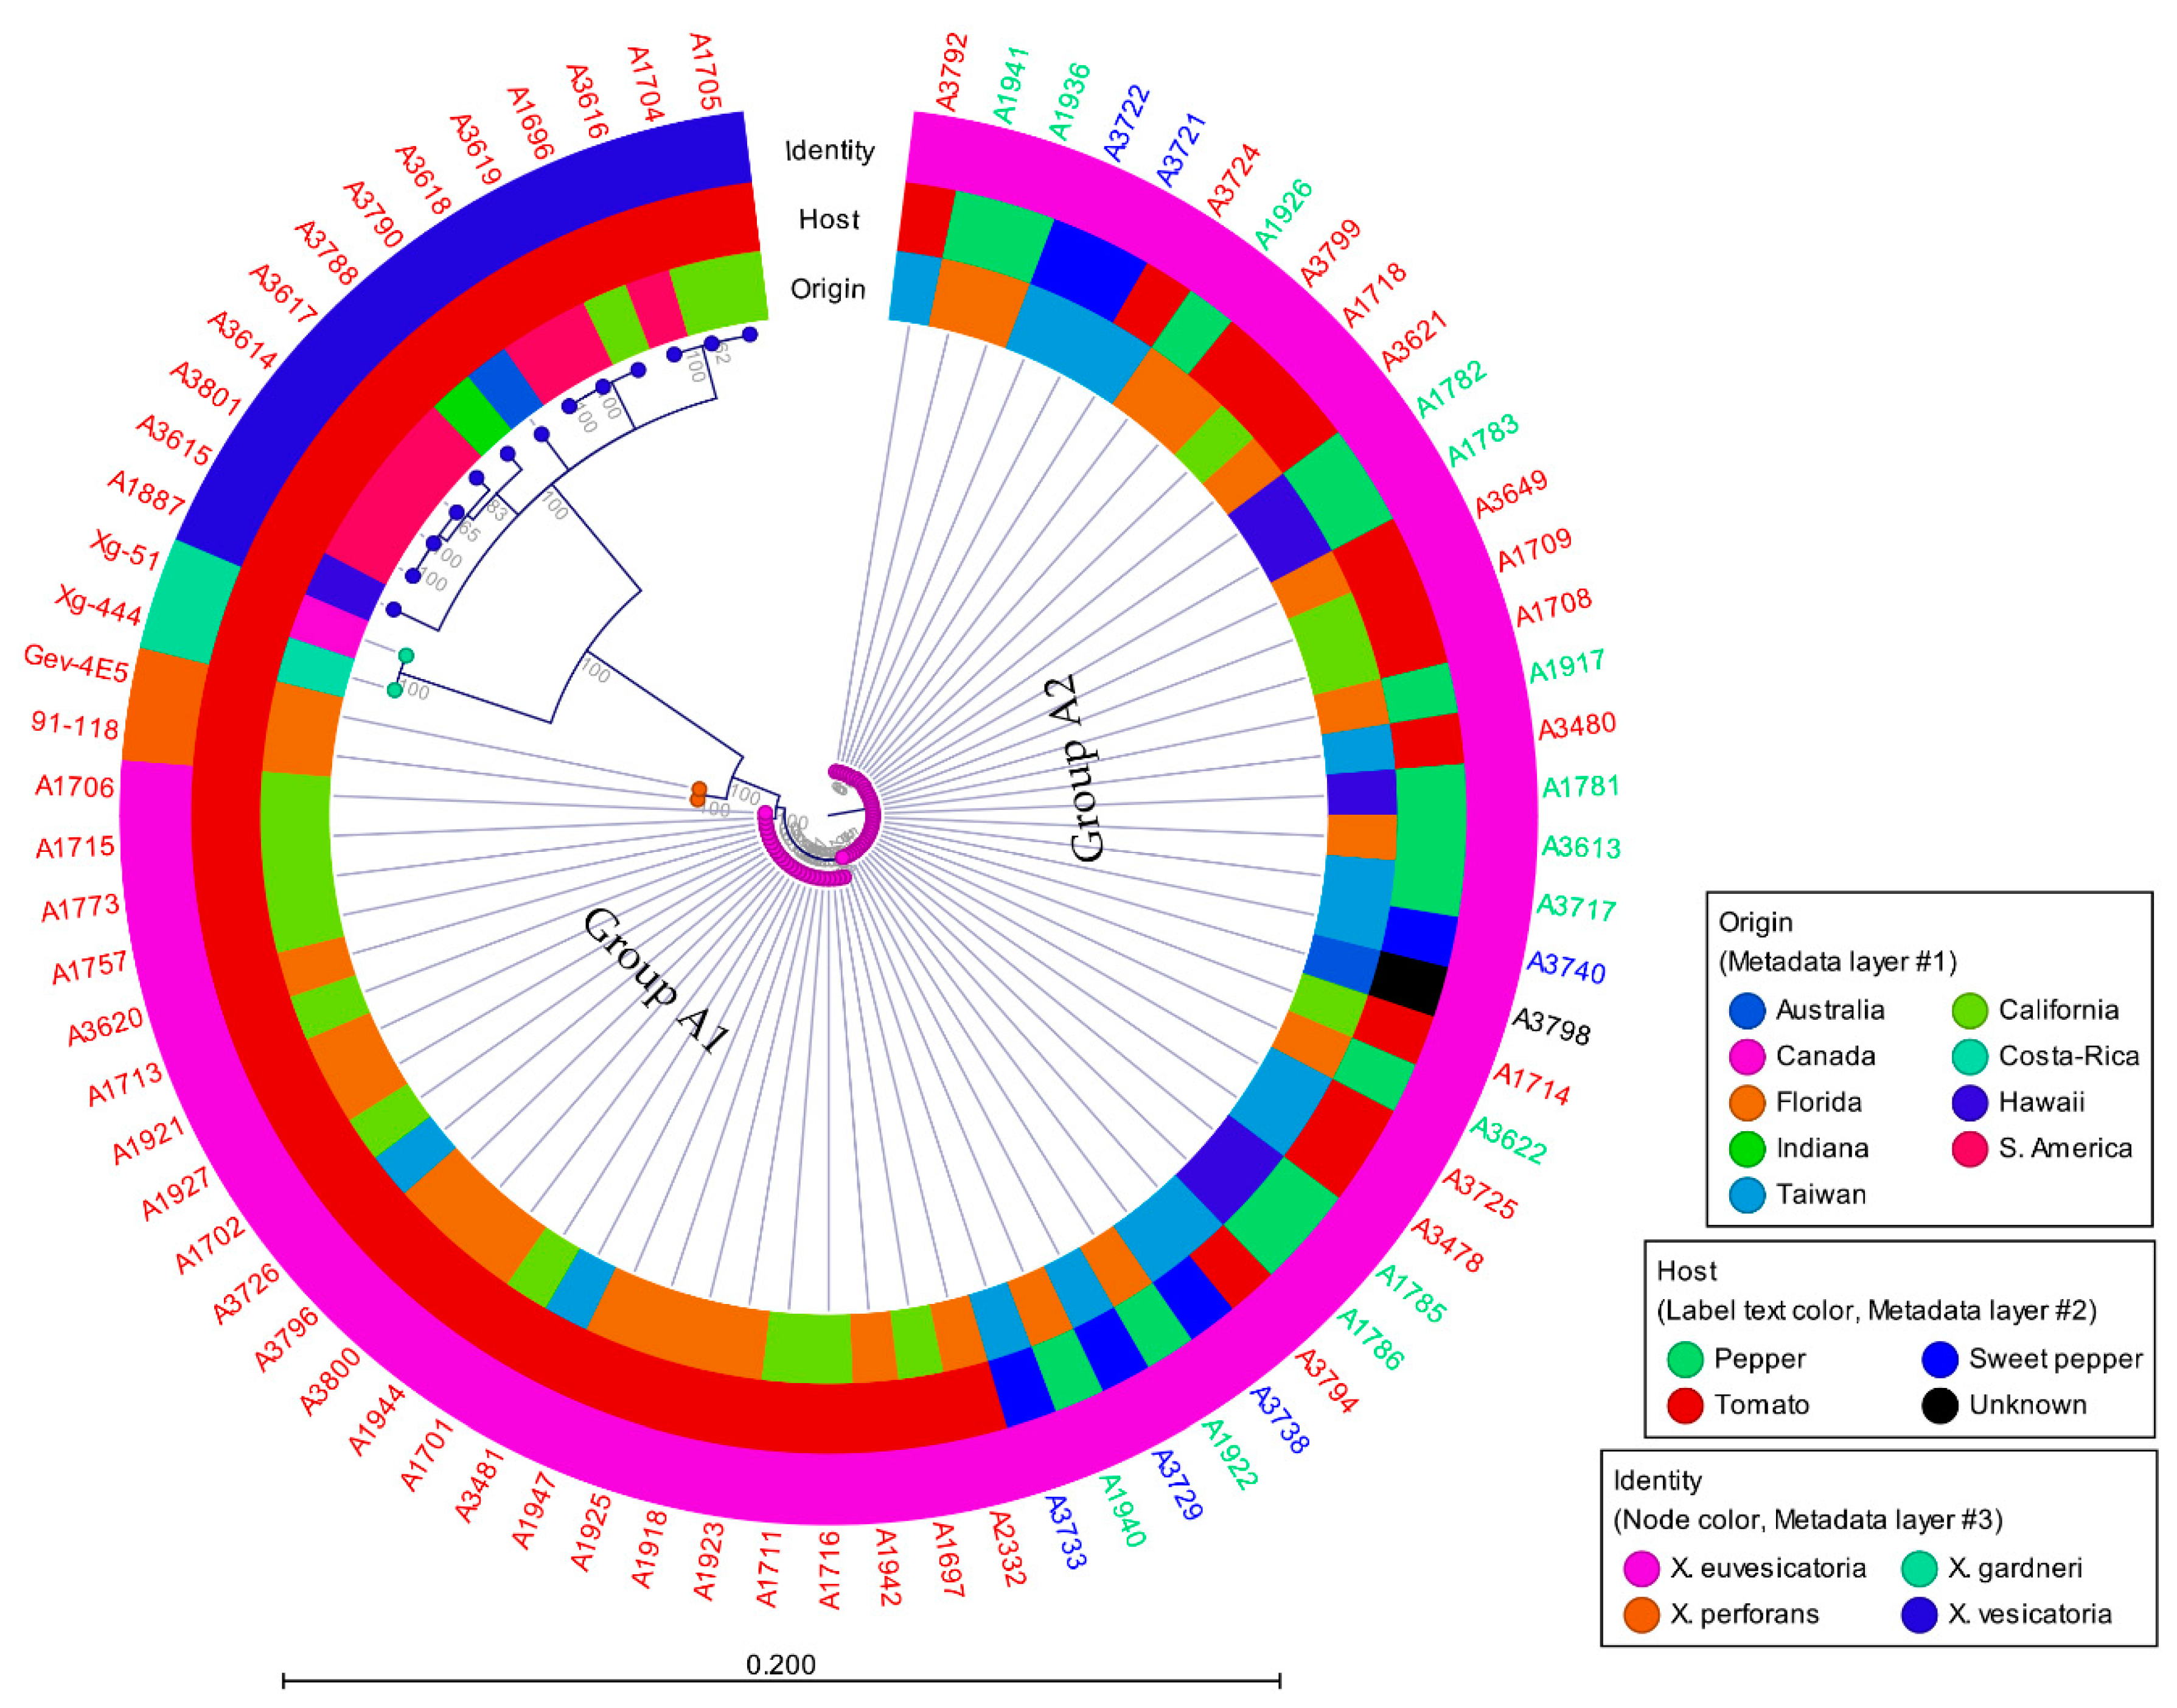
Figure 1. Concatenated phylogenetic analysis of Xanthomonas euvesicatoria and X. vesicatoria derived using genes EscN/YscN/HrcN family type III secretion system ATPase (hrcN), chromosomal replication initiator factor (dnaA), DNA topoisomerase (ATP-hydrolyzing) subunit B (gyrB), type I glyceraldehyde-3-phosphate dehydrogenase (gapA), hydroxymethylbilane synthase (hmbs), and pyruvate dehydrogenase (pdg). X. vesicatoria strain A1703 was removed from the analysis due to no amplification with hmbs gene primers. Numbers on the nodes represent bootstrap values and are presented as percentage of 1000 replicates.
Microorganisms 07 00462 g001
Figure 2. Phylogenetic position of Xanthomonas euvesicatoria, X. vesicatoria, and nineteen other plant pathogenic xanthomonads relative to each other. The phylogenetic tree was obtained using concatenated gene sequences for chromosomal replication initiator factor (dnaA), type I glyceraldehyde-3-phosphate dehydrogenase (gapA), DNA topoisomerase (ATP-hydrolyzing) subunit B (gyrB), hydroxymethylbilane synthase (hmbs), and pyruvate dehydrogenase (pdg) genes. Numbers on the nodes represent bootstrap values and are presented as percentage of 1000 replicates. The scale bar at the bottom shows the distance between strains of other species and strains of X. euvesicatoria and X. vesicatoria sequenced in this study. Sequences for other Xanthomonas species were extracted from the genomes listed in Table 3. LM159 and LMG930 are reference strains for X. vesicatoria and X. euvesicatoria, respectively.
Microorganisms 07 00462 g002
Figure 3. Color-coded matrix showing pairwise percentage identity of Xanthomonas euvesicatoria, X. vesicatoria with other species of Xanthomonas for chromosomal replication initiator factor (dnaA), type I glyceraldehyde-3-phosphate dehydrogenase (gapA), DNA topoisomerase (ATP-hydrolyzing) subunit B (gyrB), hydroxymethylbilane synthase (hmbs), and pyruvate dehydrogenase (pdg) genes. The information about the strains is provided in Table 1.
Microorganisms 07 00462 g003
Figure 4. Phylogenetic positions of Xanthomonas euvesicatoria and X. vesicatoria and other Xanthomonas species using chromosomal replication initiator factor (dnaA), type I glyceraldehyde-3-phosphate dehydrogenase (gapA), DNA topoisomerase (ATP-hydrolyzing) subunit B (gyrB), hydroxymethylbilane synthase (hmbs), pyruvate dehydrogenase (pdg), molecular chaperone DnaK (dnaK), sugar ABC transporter permease (lacF), elongation factor G (fusA), and citrate synthase (gltA) genes. (A) Phylogenetic tree showing the positions of Xanthomonas species, (B) color-coded heat map generated from concatenated sequences of nine complete genes (mentioned above). Numbers on the nodes represent bootstrap values and are presented as a percentage of 1000 replicates. Line in the bottom represents the scale bar that shows the distance between the species.
Microorganisms 07 00462 g004
Figure 5. Phylogenetic analysis of species of plant pathogenic Xanthomonas (Table 3) using complete 16s rRNA gene sequence. (A) Phylogenetic tree showing the position of Xanthomonas euvesicatoria and X. vesicatoria within the other species of plant pathogenic Xanthomonas. (B) Color-coded matrix showing pairwise percentage identity of 16s rRNA sequences of X. euvesicatoria and X. vesicatoria with the other species of plant pathogenic Xanthomonas. Numbers on the nodes represent bootstrap values and are presented as the percentage of 1000 replicates. Line in the bottom represents the scale bar that shows the distance between the species.
Microorganisms 07 00462 g005
Figure 6. Phylogenetic tree for Xanthomonas euvesicatoria and X. vesicatoria, obtained using binary data for reactivity of these species with monoclonal antibodies Mab 1, Mab 3, Mab 5, Mab 7, Mab 8, and Mab 15. Bootstrap values shown on nodes are presented as the percentage of 1000 replicates. Line in the bottom represents the scale bar that shows the distance between the species.
Microorganisms 07 00462 g006
Table 1. Details of the Xanthomonas euvesicatoria, X. vesicatoria, X. gardneri, and X. perforans strains used in the population genetics study.
A NumberOther IDOriginHostIdentityAcquired Date
A1701B94CaliforniaTomatoXanthomonas euvesicatoria1986
A1711K625/B63CaliforniaTomatoX. euvesicatoria1986
A3620Xv 153FloridaTomatoX. euvesicatoria1990
A1782K337HawaiiPepperX. euvesicatoria1986
A1781K336HawaiiPepperX. euvesicatoria1986
A1786K339HawaiiPepperX. euvesicatoria1986
A3480XVT20TaiwanTomatoX. euvesicatoria1990
A3478K348/XVT8TaiwanTomatoX. euvesicatoria1990
A1702K618/B111CaliforniaTomatoX. euvesicatoria1986
A1706K622/B62CaliforniaTomatoX. euvesicatoria1986
A1708K623/B93CaliforniaTomatoX. euvesicatoria1986
A1709K624/B108CaliforniaTomatoX. euvesicatoria1986
A1713K626/B78CaliforniaTomatoX. euvesicatoria1986
A1714K627/B81CaliforniaTomatoX. euvesicatoria1986
A1715K628/B92CaliforniaTomatoX. euvesicatoria1986
A1716K629/B95CaliforniaTomatoX. euvesicatoria1986
A1718K630/B106CaliforniaTomatoX. euvesicatoria1986
A1757K641/XCV1CaliforniaTomatoX. euvesicatoria1986
A1773K645/XCV2CaliforniaTomatoX. euvesicatoria1986
A1783MCGHawaiiPepperX. euvesicatoria1986
A1785EWCIIHawaiiPepperX. euvesicatoria1986
A191762-8FloridaPepperX. euvesicatoria1986
A191865-2aFloridaTomatoX. euvesicatoria1986
A3799Xv158FloridaTomatoX. euvesicatoria1991
A192169-13FloridaTomatoX. euvesicatoria1986
A192271-21FloridaPepperX. euvesicatoria1986
A192371-39FloridaTomatoX. euvesicatoria1986
A192575-4FloridaTomatoX. euvesicatoria1986
A192677-3FloridaPepperX. euvesicatoria1986
A3794Xv150TaiwanTomatoX. euvesicatoria1991
A3796Xv155FloridaTomatoX. euvesicatoria1991
A3792Xv148TaiwanTomatoX. euvesicatoria1991
A3798Xv157AustraliaNAX. euvesicatoria1991
A3800Xv159FloridaTomatoX. euvesicatoria1991
A1697B79CaliforniaTomatoX. euvesicatoria1986
A193682-12FloridaPepperX. euvesicatoria1986
A194082-16FloridaPepperX. euvesicatoria1986
A194182-17FloridaPepperX. euvesicatoria1986
A3621Xv158FloridaTomatoX. euvesicatoria1990
A3481XVT14TaiwanTomatoX. euvesicatoria1990
A3613Xv134FloridaPepperX. euvesicatoria1990
A3622XV173FloridaPepperX. euvesicatoria1990
A3649XV154FloridaTomatoX. euvesicatoria1990
A3717XVP28TaiwanPepperX. euvesicatoria1991
A3721XVP41TaiwanSweet pepperX. euvesicatoria1991
A3722XVP42TaiwanSweet pepperX. euvesicatoria1991
A3724XVT7TaiwanTomatoX. euvesicatoria1991
A3725XVT8TaiwanTomatoX. euvesicatoria1991
A3726XVT14TaiwanTomatoX. euvesicatoria1991
A3729XVP1TaiwanSweet pepperX. euvesicatoria1991
A3733XVP5TaiwanSweet pepperX. euvesicatoria1991
A3738XVP10TaiwanSweet pepperX. euvesicatoria1991
A3740XVP12TaiwanSweet pepperX. euvesicatoria1991
A192780-1FloridaTomatoX. euvesicatoria1986
A194283-4FloridaTomatoX. euvesicatoria1986
A194483-13FloridaTomatoX. euvesicatoria1986
A1947E3FloridaTomatoX. euvesicatoria1986
A2332X298FloridaTomatoX. euvesicatoria1990
A3617XV145S. AmericaTomatoX. vesicatoria1990
A3616XV144S. AmericaTomatoX. vesicatoria1990
A3618XV146S. AmericaTomatoX. vesicatoria1990
A3788CC12, Xv138IndianaTomatoX. vesicatoria1991
A1696K613/B71CaliforniaTomatoX. vesicatoria1986
A1703K619/B118CaliforniaTomatoX. vesicatoria1986
A1704K620/B122CaliforniaTomatoX. vesicatoria1986
A1705K621/XV-1CaliforniaTomatoX. vesicatoria1986
A1887K663/A135-1HawaiiTomatoX. vesicatoria1986
A3801Xv142aS. AmericaTomatoX. vesicatoria1991
A3790Xv140AustraliaTomatoX. vesicatoria1991
A3614XV142bS. AmericaTomatoX. vesicatoria1990
A3615XV143S. AmericaTomatoX. vesicatoria1990
A3619XV147S. AmericaTomatoX. vesicatoria1990
Xg-51CanadaTomatoX. gardneri*
Xg-444Costa-RicaTomatoX. gardneri*
Gev 4E5FloridaTomatoX. perforans*
91-118FloridaTomatoX. perforans*
MCG: Manoa community garden; NA: host information not available; K numbers refer to strains characterized using the dnaA RIF marker by Schneider et al. [19]; acquired date (when we received the strain) is not an isolation date; * we received only DNA, not the strains; 91-118 was isolated in 1991 [17]. For a few strains we have date of isolation: 62-8 in 1962; 65-2a in 1965; 69-13 in 1969; 71-21 and 71-39 in 1971; 75-4 in 1975; 77-3 in 1977; 82-12, 82-16, and 82-17 in 1982; 80-1 in 1980; 83-4 and 83-13 in 1983; for all Hawaiian strains acquired and isolation dates are the same.
Table 2. Details of the primers used for PCR amplification of EscN/YscN/HrcN family type III secretion system ATPase (hrcN), chromosomal replication initiator factor (dnaA), DNA topoisomerase (ATP-hydrolyzing) subunit B (gyrB), type I glyceraldehyde-3-phosphate dehydrogenase (gapA), hydroxymethylbilane synthase (hmbs), and pyruvate dehydrogenase (pdg) gene.
Target GenePrimers NamePrimer Sequences (5′-3′)Product Size
hrcNX-hrcN-FTCGGCACCATGCTCAAGGT846
X-hrcN-FGTGTAGAACGCGGTGATCGA
dnaAdnaA-FCAGCACGGTGGTGTGGTC928
dnaA-RCCTGGATTCGCATTACACC
gyrBGyrB-F2GAGGTGATCCTCACCGTGCT841
GyrB-R2TGATGGCCTTGGCTTCGTTC
gapAgapA-F1TGGCCATCAATGACCTGCTC865
gapA-R1TAGCCCCACTCGTTGTCGTA
pdgpdg-FCCACCCACCAGACCAAGAA990
pdg-RCAGGTACATGCCCTTGATGA
hmbsHmbs-FGTATCGCCACCCGCAAAA873
Hmbs-RCCTTGTCGAACAGCCCTTG
Hmbs-F2TTGCATCGCCACCCGCAAGA837
Hmbs-R2TCCTTGTCGAACAGGCCTTG
Hmbs-F10AGGGCCTGTTTTTGAAGGAA595
Hmbs-R10AACCCCTCGCCTTCCCAGGT
Table 3. Details of the xanthomonads genomes used to retrieve the gene sequences for phylogenetic analysis.
SpeciesAccession NumbersHostGeographic Location
X. perforansNZ_CP019725TomatoMauritius
X. gardneriNZ_CP018731TomatoNew Zealand
X. vesicatoriaNZ_CP018470TomatoNew Zealand
X. euvesicatoriaNZ_CP018467PepperUSA
X. fragariaeNZ_CP016830StrawberryCalifornia, USA
X. axonopodis pv. diffenbachiaeNZ_CP014347AnthuriumBrazil
X. sacchariNZ_CP010409RiceChina
X. translucens pv. undulosaNZ_CP008714WheatKansas, USA
X. hortum pv. carotaeNZ_CM002307CarrotOregon. USA
X. fuscans subsp. fuscansNC_022541BeanFrance
X. campestris pv. raphaniNC_017271CabbageEast Asia
X. oryzae pv. oryzicolaNC_017267RicePhilippines
X. axonopodis pv. citrumeloNC_016010CitrusFlorida, USA
X. albilineansNC_013722SugarcaneFrance
X. oryzae pv. oryzaeNC_007705RiceJapan
X. axonopodis pv. citriNC_003919Mexican limeFlorida, USA
X. campestris pv. campestrisNC_003902CabbageUK
X. arboricola pv. juglandisCP012251WalnutUSA
X. bromiGCF_900092025.1Brome grassFrance
X. cannabisGCF_000802405.1Cannabis sativaJapan
X. vassicolaGCF_000772705.2SorghumNew Zealand
X. cassavaeGCF_000454545.1CassavaMalawi
Table 4. Details of the monoclonal antibodies (Mabs) used to characterize Xanthomonas euvesicatoria and X. vesicatoria.
Mab NameClone NumberSubclassImmunogen (s)
Xv1106-41-1-1IgG2bA1074
Xv3131-39-14-2IgG2b82-17
Xv5 *131-10-9-1IgG382-17
Xv7 *130-10-2-1NA65-2a
Xv84H5-3B1IgG1BA29-1, BV20-3A, X525-85
Xcv15209-C15-4-4IgMB61, B80
Mabs Xv 1, 3, 8, and 15 were used in a previous survey of X. campestris pv. vesicatoria [6]; * Mabs Xv5 and Xv7 were produced from hybridoma cell lines previously generated at the University of Hawaii and data from these Mabs were not included in the analysis by Bouzar, et al., [6].