Article

Genetic Modification of mfsT Gene Stimulating the Putative Penicillin Production in Monascus ruber M7 and Exhibiting the Sensitivity towards Precursor Amino Acids of Penicillin Pathway

by
Rabia Ramzan
1,2,
Muhammad Safiullah Virk
1,2,
Zafarullah Muhammad
2,3,
Amani Mohedein Mohammed Ahmed
1,2,
Xi Yuan
1,2 and
Fusheng Chen
1,2,3,*
1
Hubei International Scientific and Technological Cooperation Base of Traditional Fermented Foods, Huazhong Agricultural University, Wuhan 430070, China
2
College of Food Science and Technology, Huazhong Agricultural University, Wuhan 430070, China
3
Key Laboratory of Environment Correlative Dietology, Ministry of Education, Huazhong Agricultural University, Wuhan 430070, China
*
Author to whom correspondence should be addressed.
Microorganisms 2019, 7(10), 390; https://doi.org/10.3390/microorganisms7100390
Submission received: 7 August 2019 / Revised: 15 September 2019 / Accepted: 19 September 2019 / Published: 24 September 2019
(This article belongs to the Section Microbial Biotechnology)

Abstract

:
The biosynthesis of penicillin G (PG) is compartmentalized, which forces penicillin and its intermediates to cross the membrane barriers. Although many aspects around the penicillin intermediates traffic system remain unclosed, the transmembrane transporter protein involvement has been only predicted. In the present work, detection of PG and isopenicillin N (IPN) in Monascus ruber M7 was performed and functions of mfst gene as a transporter were investigated by the combination of gene deletion (Δmfst) complementation (ΔmfsT::mfsT) and overexpression (M7::PtrpC-mfsT). While, the feeding of PG pathway precursor side chain and amino acids, i.e., phenylacetic acid, D-valine, and L-cysteine was performed for the interpretation of mfsT gene role as an intermediate transporter. The results showed that, the feeding of phenylacetic acid, D-valine, and L-cysteine possessed a significant effect on morphologies, secondary metabolites (SMs) production of all above-mentioned strains including M. ruber M7. The results of UPLC-MS/MS revealed that, ΔmfsT interrupt the penicillin G (PG) production in M. ruber M7 by blocking the IPN transportation, while PG and IPN produced by the ΔmfsT::mfsT have been recovered the similar levels to those of M. ruber M7. Conclusively, these findings suggest that the M. ruber M7 is, not only a PG producer, but also, indicate that the mfsT gene is supposed to play a key role in IPN intermediate compound transportation during the PG production in M. ruber M7.

1. Introduction

Monascus spp. are popular in China and other Asian countries as traditional edible fungi, and their fermented products, namely red mold rice (RMR), red yeast rice, Hongqu or Anka, have been extensively used as folk medicines and food colorants in China for nearly 2000 years [1,2,3,4,5,6]. Nowadays, the researchers have found that Monascus spp. can produce various beneficial secondary metabolites (SMs) such as, Monascus pigments, monacolin K, γ-aminobutyric acid, and dimerumic acid, and also a harmful SM, e.g., citrinin, a kind of mycotoxin [1,7,8,9,10,11,12]. Recently, Chen. [13] has detected β-lactams in RMR (red mold rice) produced by M. ruber M7, and discovered a putative gene cluster responsible for the β-lactam production. He has predicted that the putative β-lactam gene cluster in M. ruber M7 is 48-kb in size, comprising the eight genes. Moreover, Wei et al. identified a γ-lactam from RMR by M. purpureus [14].
Actually, many microorganisms including Gram negative bacteria, actinomycetes, and filamentous fungi can produce various kinds of lactams, especially β-lactam antibiotics, which have been the cornerstone of antibiotic treatment since the early 1940s [15]. About β-lactam antibiotics biosynthetic pathway, the three precursor amino acids: L-α-aminoadipic acid, L-cysteine, and D-valine, are initially condensed by non-ribosomal peptide synthetase (NRPS), namely δ-(L-α-aminoadipyl)-L-cysteinyl-D-valine synthetase (ACVS) encoded by pcbAB gene to form the intermediate δ-(L-α-aminoadipyl)-L-cysteinyl-D-valine (ACV), which is cyclized into isopenicillin N (IPN) by the catalytic activity of isopenicillin N synthase (IPNS) encoded by pcbC gene [16]. IPN is a basic nucleus of the β-lactam antibiotics with hydrophilic nature [17]. These steps occur in the cytoplasm of β-lactam producers [18]. Then, IPN can be converted into penicillin G (PG) in Penicillium chrysogenum and Aspergillus nidulans in the peroxisomal matrix, into cephalosporin C in Acremonium chrysogenum in the cytosol and into cephamycin C in Streptomyces clavuligerus and Amycolatopsis lactamdurans [19,20] in different subcellular compartments. For example, in P. chrysogenum the IPN is altered into PG in peroxisomal microbodies, where an isopenicillin N acyl transferase (IAT) catalyzes an α-aminoadipyl side chain (hydrophilic) into a phenyl acetyl CoA (hydrophobic) [21]. Most of the secondary metabolites, as well as, their key enzymes that may cause toxicity to host cells are localized in the microbodies. Such as IAT and phenylacetyl CoA-ligase (PACL) are the crucial enzymes for the PG production, localized in peroxisomes. When the putative targeting signal was removed, the enzyme was not directed to the microbody but instead localized in the vacuole and surrounding cytosol. Under these conditions, production of penicillin was halted [22,23]. The other explanation, that is named as IAT is not able to perform the catalytic reaction in the cytosol due to pH changing effect. Hence, the IPN should be transformed into the peroxisomes for IAT enzyme action and the final production of the benzyl penicillin, phenoxy methyl penicillin. Otherwise production of penicillins in the culture medium might be limited due to the blockage of IPN transportation [24,25]. So the shipping of intermediates and their precursors across the cellular membranes is a fundamental issue during the biosynthesis of penicillins [26], but many transporters remain unexplored [17,27], which include multidrug and toxic compound extrusion, ATP-binding cassette superfamily, small multidrug resistance, major facilitator superfamily (MFS) and so on according to their capabilities to transport different organic composites [26].
Among them, MFS transporters perform a dominant role in many physiological processes of life [28,29,30,31,32]. One MFS transporter gene, cmcT is involved in the biosynthesis of cephamicin in A. lactamdurans and S. clavuligerus [17]. Three MFS transporters genes, cefT, cefP, and cefM take part in the intermediate translocation during cephalosporin C biosynthesis in A. chrysogenum [33,34,35,36]. Similarly, Fernández-Aguado et al. discovered two MFS transporters penV and paaT in P. chrysogenum to participate the precursor amino acids and phenylacetate translocation, respectively [27,37].
Although many aspects around the penicillin traffic system are still needed to be explored, the transmembrane transporter proteins are supposed to be involved in it. And the strong prediction about the major facilitator superfamily transporter (MFST) encoding genes presence in the gene clusters for the synthesis of the secondary metabolites has been observed (Refs). In current research, an MFS transporter-like protein gene in a putative gene cluster of PG in M. ruber M7, called mfsT was found by homologous analysis, and then its functions were investigated through mfsT-deletion, complementation, and overexpression in the PG pathway.

2. Materials and Methods

2.1. Materials

M. ruber M7 strain (CCAM 070120, Culture Collection of State Key Laboratory of Agricultural Microbiology, Wuhan, China) which has ability to produce the Monascus pigments, citrinin but no monacolin K, was used to generate the ΔmfsT strain and the M7::PtrpC-mfsT strain [38]. The ΔmfsT strain was genetically modified to produce the ΔmfsT::mfsT strain. For the phenotypic analysis, potato dextrose agar (PDA), glycerol nitrate agar (25%) (G25N), malt extract agar (MA) and Czapek yeast extract agar (CYA) media were applied [39]. For transformants screening, 30 μg/mL of hygromycin B and 15 μg/mL of neomycin were utilized as resistant markers on PDA. All strains were maintained at 28 °C on PDA slants.

2.2. DNA Extraction

The cetyltri-methylammonium bromide method was used to extract the genomic DNA of strains from the mycelia that were grown on PDA plates covered by cellophane membrane as the detailed procedure has already been described by Shao et al. [40].

2.3. mfsT Gene Cloning and Computational Analysis

The primer pairs used in the current study are shown in Table 1. The genomic DNA of M. ruber M7 was utilized to amplify the mfsT gene by PCR and the conditions were followed as initial denaturation at 94 °C (5 min) succeeding by 35 amplification cycles with the subsequent conditions at 94 °C (30 s), 58 °C (30 s), 72 °C (1 min), while the last extension step at 72 °C (10 min) was performed using T100 Thermal Cycler (Bio-Rad, Hercules, CA, USA) [41,42]. Amino acid sequences encoded by mfsT were predicted by the SoftBerry’s FGENESH program (https://linuxl.softberry.com/berry.phtml), and the mfsT functional regions were analyzed with the Pfam 27.0 program (http://pfam.xfam.org/). The homology of the deduced amino acid sequences of mfsT was interpreted by the BLASTP program (https://blast.ncbi.nlm.nih.gov/Blast.cgi).

2.4. Construction of the mfsT Gene Deletion, Complementation, and Overexpression Strains

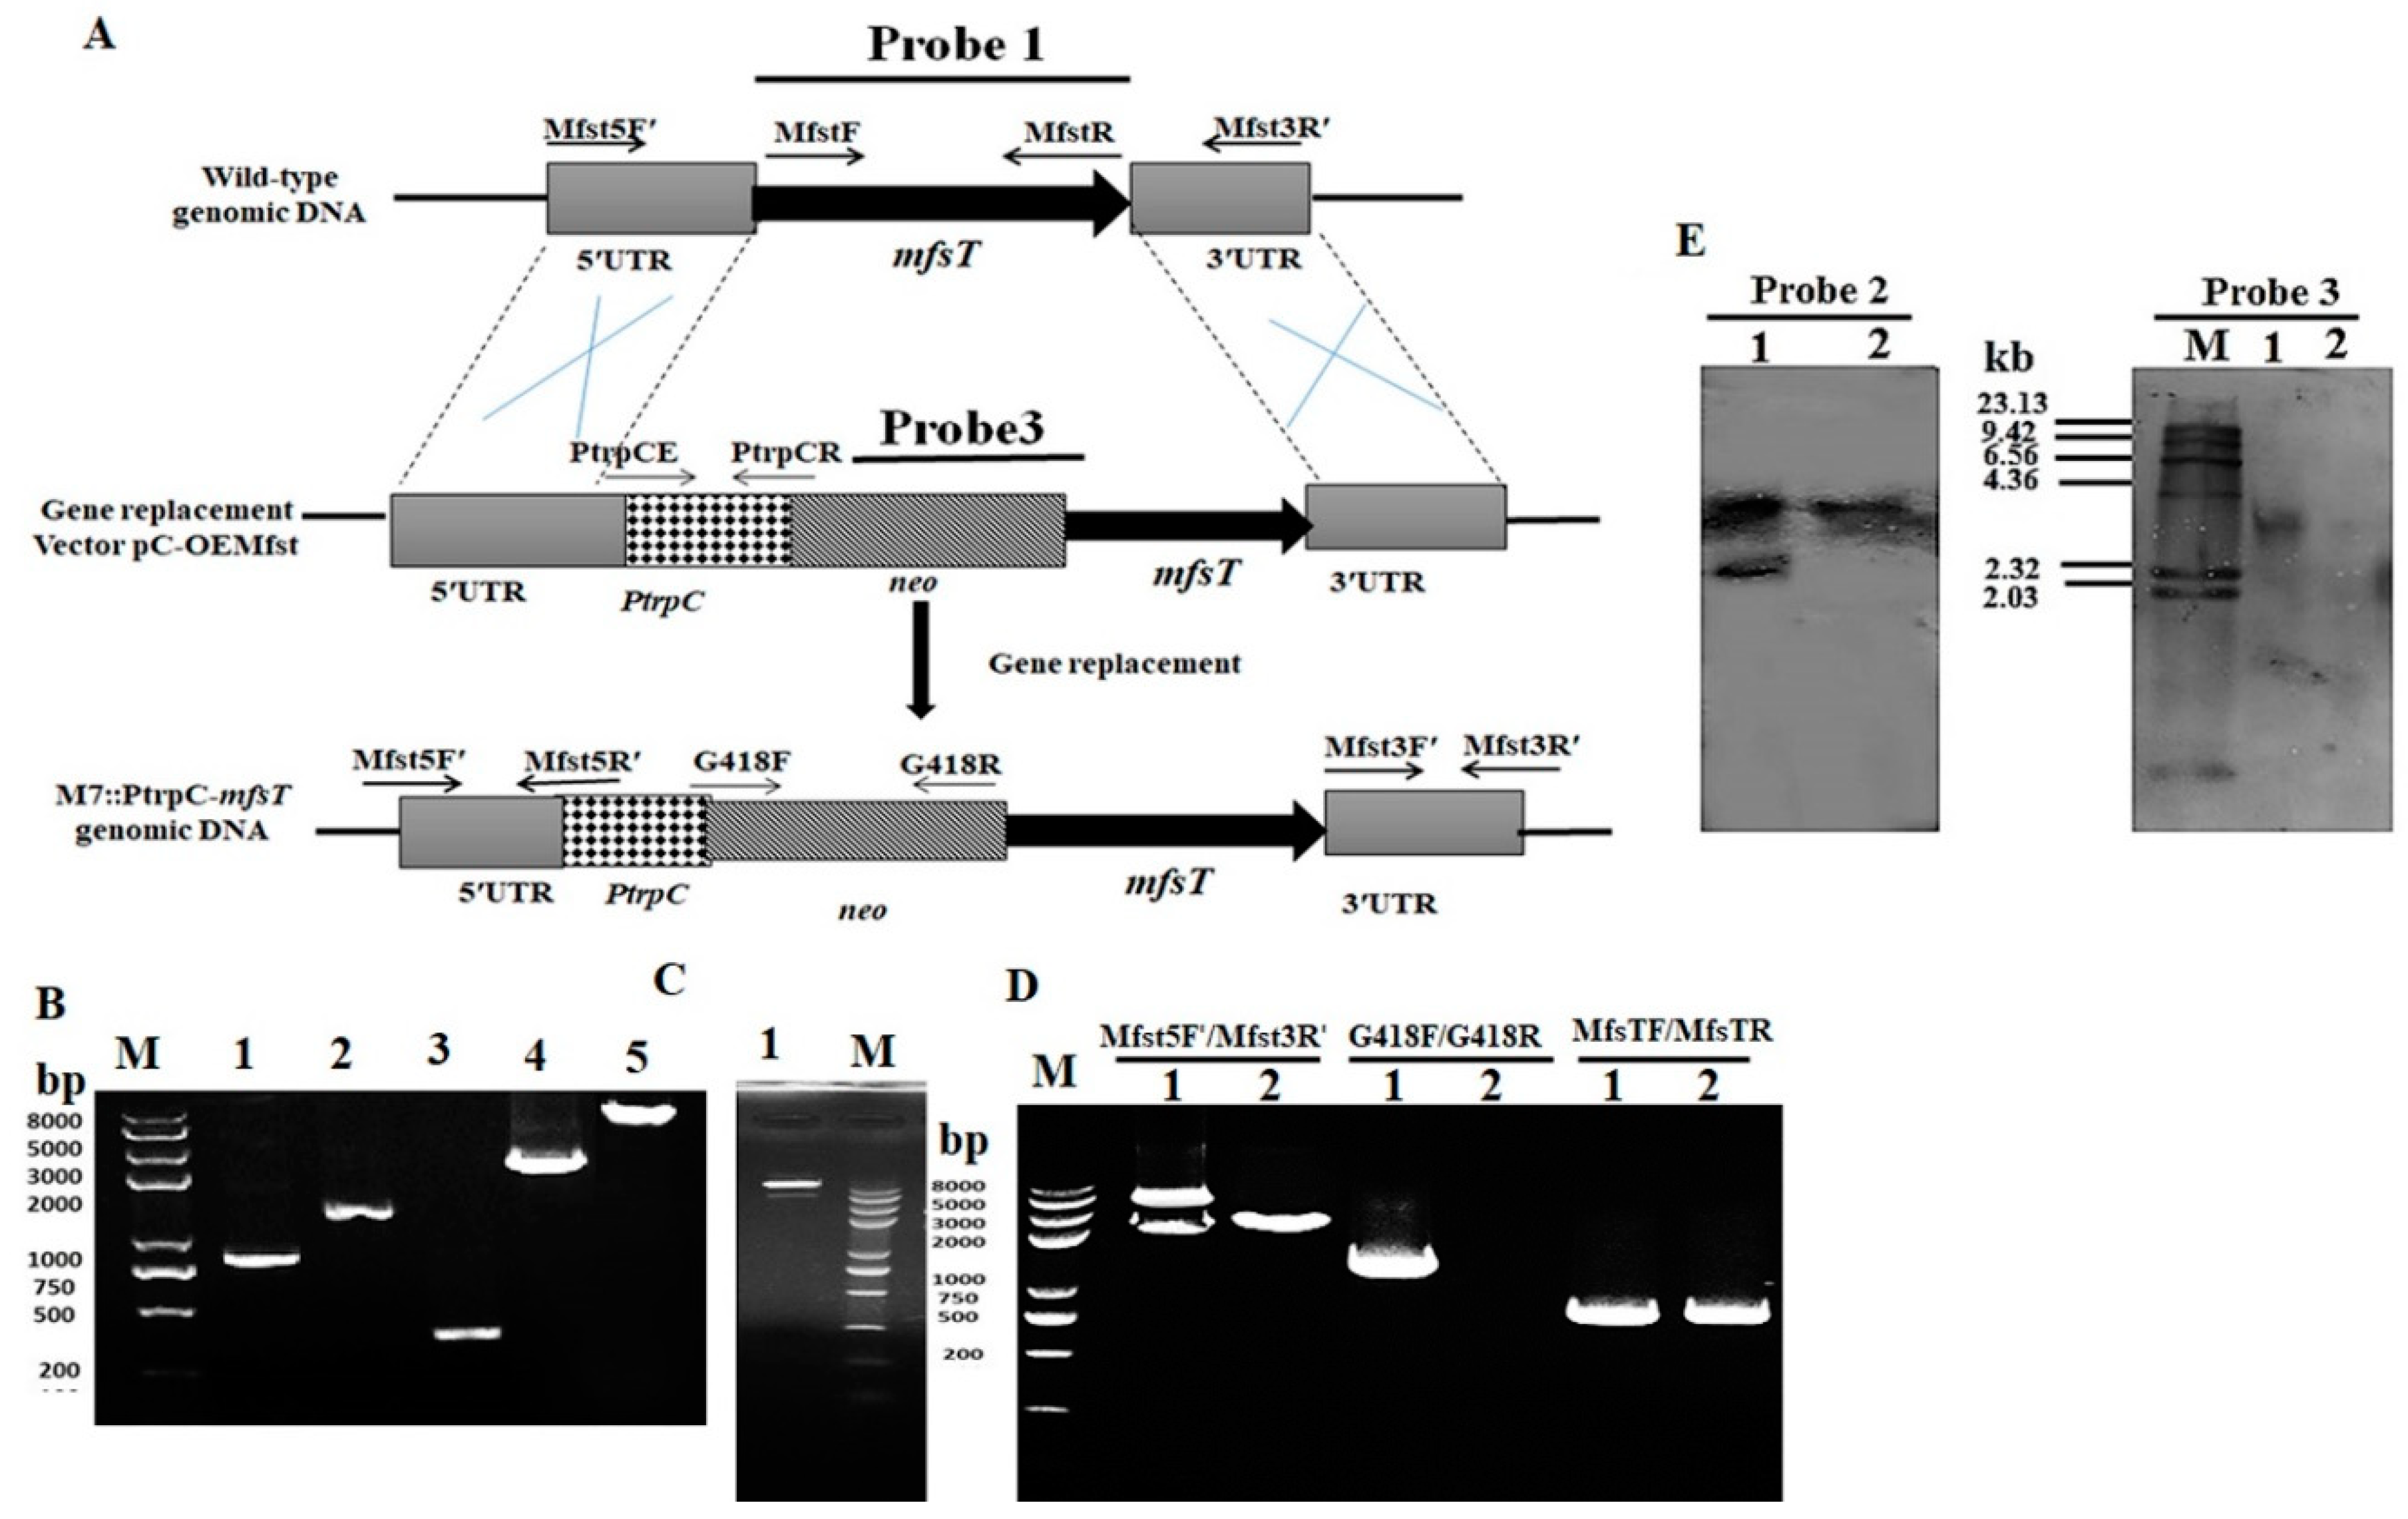
The targeted gene mfsT deletion, complementation, and overexpression were performed according to the method reported by Shao et al. [40]. The gene disruption cassette (5’UTR-hph-3’UTR), complementation cassette and overexpression cassette (5’UTR-PtrpC promoter-neo-mfsT gene-3’UTR) were constructed by the double-joint PCR method with primer pairs listed in Table 1, and the schematic illustration is shown in Figure 1A [43]. Agrobacterium tumefaciens cells containing the disruption vector (pC-MfsT), overexpression vector (pC-OEMfsT) of MfsT were constructed and co-cultivated with M. ruber M7 to produce the deletion strain (ΔmfsT) and the overexpression strain (M7::PtrpC-mfsT), respectively. While the Agrobacterium tumefaciens cells having vector (pC-OEMfsT) were co-cultivated with the ΔmfsT strain to generate the complementation strain ΔmfsT::mfsT

2.5. Southern Hybridization Analysis

The PCR and Southern blot were applied to further confirm the mfsT gene deletion, complementation, and overexpression strains using the procedure of the DIG-High Prime DNA Labeling & Detection Starter kit I (Roche, Mannheim, Germany). The DNA of putative ΔmfsT, ΔmfsT::mfsT, and M7::PtrpC-mfsT strains, as well as M. ruber M7 was digested with restriction enzyme XbaI. By PCR, the amplicons of probe 1 (mfsT gene), probe 2 (hph gene), and probe 3 (neo gene) were amplified with the primer pairs MfsTF/MfsTR, hphF/hphR, and G418F/G418R, respectively (Table 1). The ΔmfsT strain was confirmed by probe 1 and 2, ΔmfsT::mfsT strain by probe 2 and 3, and M7::PtrpC-mfsT strain by probe 1 and 3.

2.6. Quantitative Real-Time PCR (qRT-PCR) Analysis

qRT-PCR was implemented with the SLAN Fluorescence Quantitative Detection System from Wuhan Good BioTechnology Co., Ltd. (Wuhan, China) by the method as previously described by Liu et al. [44].

2.7. Phenotypic Characterization

The parental strain (M. ruber M7), ΔmfsT, ΔmfsT::mfsT, and M7::PtrpC-mfsT were inoculated on G25N, MA, PDA, and CYA media plates for 15 days at 28 °C to observe the colonial and microbiological features [45].

2.8. Biomass Estimation

The biomasses of M. ruber M7, ΔmfsT, ΔmfsT::mfsT, and M7::PtrpC-mfsT were estimated by using the gravimetric method. The mycelia were collected on PDA plates, then dried at 60 °C until constant weight and the mean biomasses were calculated by three replicates [46].

2.9. Extraction and Measurement of the PG Contents

2.9.1. PG Extraction

One mL of the freshly harvested spores (105 cfu/mL) from all transformants and wild-type strain M. ruber M7 was respectively grown on PDA plates covered with cellophane membranes and put at 28 °C for 7 days. The PG contents from the mycelia were extracted according to the method described by Senyuva et al. [47] with minor modification. The lyophilized mycelia (0.1 g) were put in acetonitrile (1.5 mL) and 1% formic acid in ethyl acetate (1 mL) and subjected to ultra-sonication for 10 min (KQ-250B, Kunshan, China). After the solvent was evaporated, the left sediment was suspended in 1% (v/v) formic acid solution, and then filtered through a 0.2-μm membrane before analysis.
From the aqueous phase the PG detection was performed by the method as described by Bi et al. [48] with slight modifications. Aliquots of 2 mL of broth blended with solution of ammonium sulfate of 50% w/v and polyethylene glycol (PEG) of 50% w/v, which was added gradually with ratio 1:1. The mixture homogenized by using the vortex used for 20 s and then centrifuged for 10 min at speed 3000× g, with temperature 4 °C. Two layers were formed, the upper PEG phase comprising PG, which was separated and analyzed by HPLC.

2.9.2. PG Detected by HPLC

The extracellular and intracellular PG contents were analyzed by HPLC as the method described by Ullán et al. [35]. 20 μL filtrates of the samples were injected in a HPLC (Waters, Milford, MA, USA) with a reverse-phase C18 column (Phenomenex Luna, 250 mm× 5 μm, Phenomenex, Torrance, CA, USA). The gradient elution was performed at flow rate (0.3 mL/min) using methanol as a mobile phase and 5% methanol in 50 mM ammonium formate (pH 3.5) as B mobile phase. A program for the elution gradient was set as follows: From 0 to 8 min the phase A 15% and phase B 85% were used; from 8 to 16 min the phase A 20% and phase B 80% were used, succeeding a washing step with phase A (100%) from 16 to 23 min and a final equilibration step starting at 23 min with 15% B. The temperature for the analytical column was maintained at 35 °C during the whole process. Ultraviolet detection of PG was carried using the 2487 UV/Vis detector at a 240 nm wavelength.

2.9.3. PG and IPN Verified by UPLC-MS/MS

For the mass interpretation by the UPLC, the separation achieved on an Acquity Ultra Performance Liquid Chromatography (UPLC) system (Waters, Milford, MA, USA) with an Acquity BEH C-18 column (2.1 mm × 100 mm, 1.7 μm) with PDA detector, a gradient program for elution employed with the mobile phase combining 25% solvent A (0.1 mM sodium acetate in water) and 55% solvent B (acetonitrile) 20% solvent C was water. The flow rate was set at 0.3 mL/min and the injection volume 2 μL used. The temperature for the column and samples was maintained at 40 °C and 4 °C, respectively.
The mass profile of the extract generated by using the Acquity TQD tandem quadruple mass spectrometer (Waters, Manchester, UK), the appliance functioned with an electrospray ionization (ESI) source. For the MS detection, the conditions for the ESI-MS were used as described by Liu et al. [49]. The PG standard having more than 98.0% purity (Sigma- Aldrich, Saint Louis, MO, USA) was used to approve the PG metabolites existence in the extract [50].

2.10. Feeding of Precursor Amino Acids

To evaluate the transportation mechanism of mfsT gene the feeding of pathway amino acid was performed [51]. For this step, M. ruber M7, ΔmfsT, ΔmfsT::mfsT, and M7::PtrpC-mfsT strain cultivated on PDA against the supplementation of pathway side chain and amino acid such as phenylacetic acid, D-valine, and L-cysteine at 2 mM concentration, separately. Further analyzed for biomass production (Section 2.8.), phenotypic characteristics (Section 2.7.), and PG production (Section 2.9.1).

2.11. Statistical Analyses

All experiments were analyzed in triplicates. Statistics 8.1 program (Analytical Software, SAS/STAT®, Cary, NC, USA) was utilized for the statistical analyses. In the Tukey test, the p-value < 0.05 was considered as statistically significant and p < 0.01 as highly significant.

3. Results

3.1. mfsT Gene Sequence Analysis in M. ruber M7

The putative gene mfsT with a 1729 bp fragment size was successfully amplified by utilizing the genomic DNA of M. ruber M7. The mfsT gene protein sequence from M7 was a blast on NCBI (https://blast.ncbi.nlm.nih.gov/Blast.cgi), and homologous alignment of the MfsT with 25 different MFS transporters from other genomes has been found [52]. As well as, the 527 amino acids sequence was predicted by using the SoftBerry’s FGENESH. A database exploration with Pfam 27.0 program (http://pfam.xfam.org/) exhibited that mfsT belongs to the MFS transporter family [53]. As well as, the sequence of MfsT protein was analyzed with the algorithms TMHMM (http://www.cbs.dtu.dk/services/TMHMM/) to determine the number of TMSs (transmembrane spanners) [34]. The results reveal that the MfsT protein possesses 12 hydrophobic TMSs and which arranged into two individually folded domains having six successive TMS, (Supplementary Figure S1.). Similarly, tridimensional conformation modeling of the MfsT protein was created by the SwissProt (http://swissmodel.expasy.org/) [54]. Which displays that 12 α-helixes transmembrane segments surrounding the central substrate binding site in MfsT protein (Supplementary Figure S2.).

3.2. Genetic Engineering of mfsT Gene

To investigate the function of mfsT in vivo, the development of the ΔmfsT gene disruption, complementation, and overexpression strains was done by using a cited method [40,44,55]. Four putative deleted (ΔmfsT) strains obtained, which were further identified and validated by PCR analyses. Data related to one mutant has been displayed in Figure 1D, the genomic DNA of ΔmfsT strain used as a template for the primer pairs MfsTF/MfsTR (Table 1.) no band of DNA amplified in ΔmfsT strain, as compared to M. ruber M7, which showed the clear DNA band of size 700 bp. However, hph gene with 2137 bp fragment size amplified from ΔmfsT and for the M. ruber M7 lane remained blanked with the primers hphF/hphR (Table 1.). Additionally, the southern blot analysis was performed to confirm the right homologous recombination in the putative deletion mutants for mfsT. A probe 1, which gave a single hybridizing band (5.5 kb) in M. ruber DNA digested with the XbaI enzyme. So, the wild type strain possessing a single copy of the gene, ΔmfsT lane remained unspotted. Similarly, with probe 2, a band of size 3.8 kb appeared in ΔmfsT, which proved that the presence of only one integrated copy of the mfsT disruption was constructed and the M. ruber M7 remained blank (Figure 1E).
Three presumed neo resistance complementary (ΔmfsT::mfsT) strains were collected and further investigated. The data associated with one strain has been demonstrated here. During the PCR analyses verification, for the primer pair MfsTF/MfsTR the 0.7 kb size DNA band appeared for ΔmfsT::mfsT strain, nothing was amplified in ΔmfsT. On the opposite, for the primer pairs of G418F/G418R the 1.2 kb fragment amplified in ΔmfsT::mfsT and the lane for ΔmfsT remained blank (Figure 2D). Moreover, to confirm the successful homologous recombination, no DNA band amplified for hphF/hphR primers in ΔmfsT::mfsT strain, while a band with 2.2 kb appeared in ΔmfsT. Hence, the hygromycine B resistance has been replaced by the neomycine resistance successfully (Figure 2D). Further, the genomic DNA of ΔmfsT::mfsT and ΔmfsT amplicons of different sizes for the primers MfsT5F′/MfsT3R′ are shown in (Table 1.) such as, 4.6 kb and 3.5 kb, respectively. The southern blotting revealed that no hybridization band was noticed in ΔmfsT::mfsT, while a band of size 5.5 kb was observed in ΔmfsT for probe 2. Furthermore, to prove the successful homologous recombination, probe 3 gave a 3.5 kb band in ΔmfsT::mfsT and nothing in ΔmfsT (Figure 2E).
Twenty putative M7::PtrpC-mfsT strains with neomycin resistance were selected and examined by the PCR system. As shown in Figure 3D, from the genomic DNA of M7::PtrpC-mfsT the 1.2 kb product amplified and nothing from a wild strain for the primer pair G418F/G418R. On the other hand, in the case of MfsT5F′/MfsT3R′ primers the two amplicons in M7::PtrpC-mfsT appeared with different sizes 4.6 kb and 3.0 kb. In the case of M. ruber M7 only a single 3.0 kb band obtained. Which demonstrated that, the M7::PtrpC-mfsT carried more than one integrated copy of the PtrpC-mfsT overexpression construct (Figure 3D). The Southern blot analysis displayed that, two hybridization bands were noticed in M7::PtrpC-mfsT band of size 5.5 kb and 3 kb appeared by probe 1, which confirmed that the overexpression construct (M7::PtrpC-mfsT) strain carried only two integrated copies of the mfsT. For further confirmation, probe 3 gave a 3.8 kb size band in M7::PtrpC-mfsT and nothing in M. ruber M7 (Figure 3E).

3.3. Real-Time PCR Analysis of ΔmfsT, ΔmfsT::mfsT and M7::PtrpC-mfsT

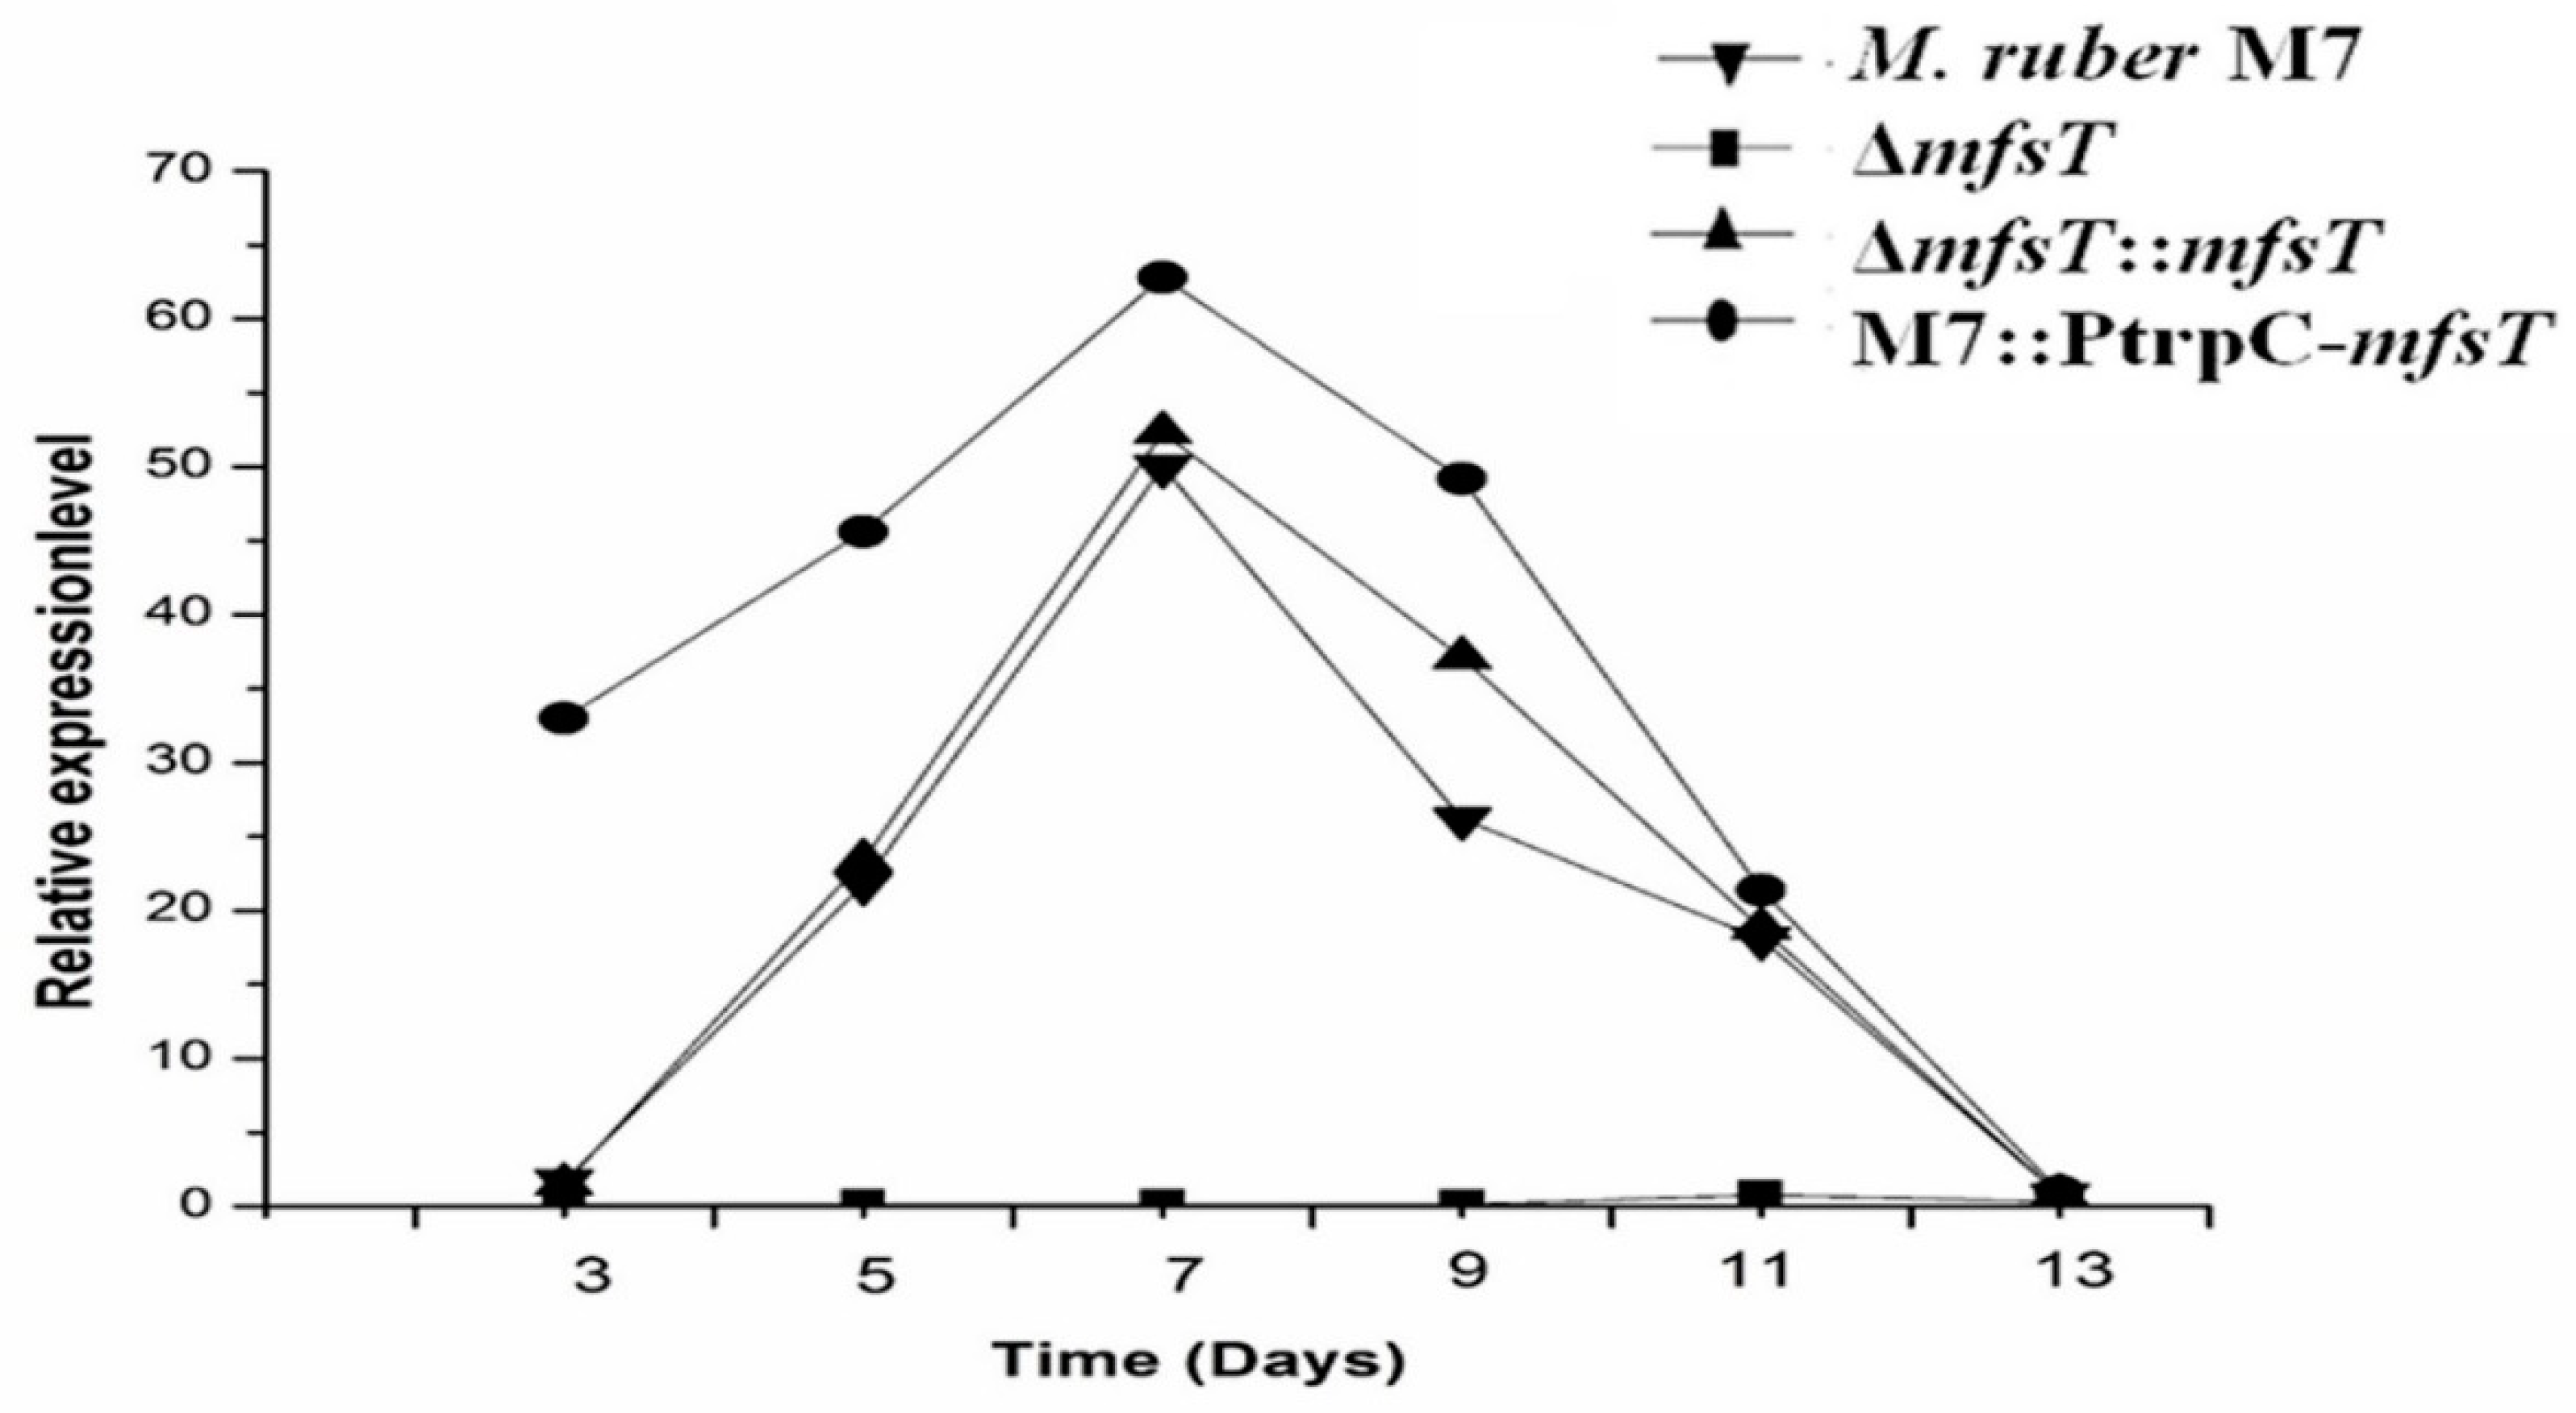
The transcriptional interpretations of the mfsT gene was performed by qRT-PCR for all mutant strains such as ΔmfsT, ΔmfsT::mfsT, and M7::PtrpC-mfsT as compared to the wild type M. ruber M7. As demonstrated in Figure 4, the gene knockout validated in the ΔmfsT strain by observing the lowest mfsT gene expression. Although, in the M. ruber M7 the mfsT gene expression level steadily increased and topped at the 7th day, after that the expression level was dropped. While, the mfsT expression level was similar in both the complementary strain (ΔmfsT::mfsT) as well as in the parental strain. In the case of overexpression (M7::PtrpC-mfsT), the expression level of mfsT was higher compared to that of M. ruber M7.

3.4. Phenotypic Characterization of ΔmfsT, ΔmfsT::mfsT and M7::PtrpC-mfsT

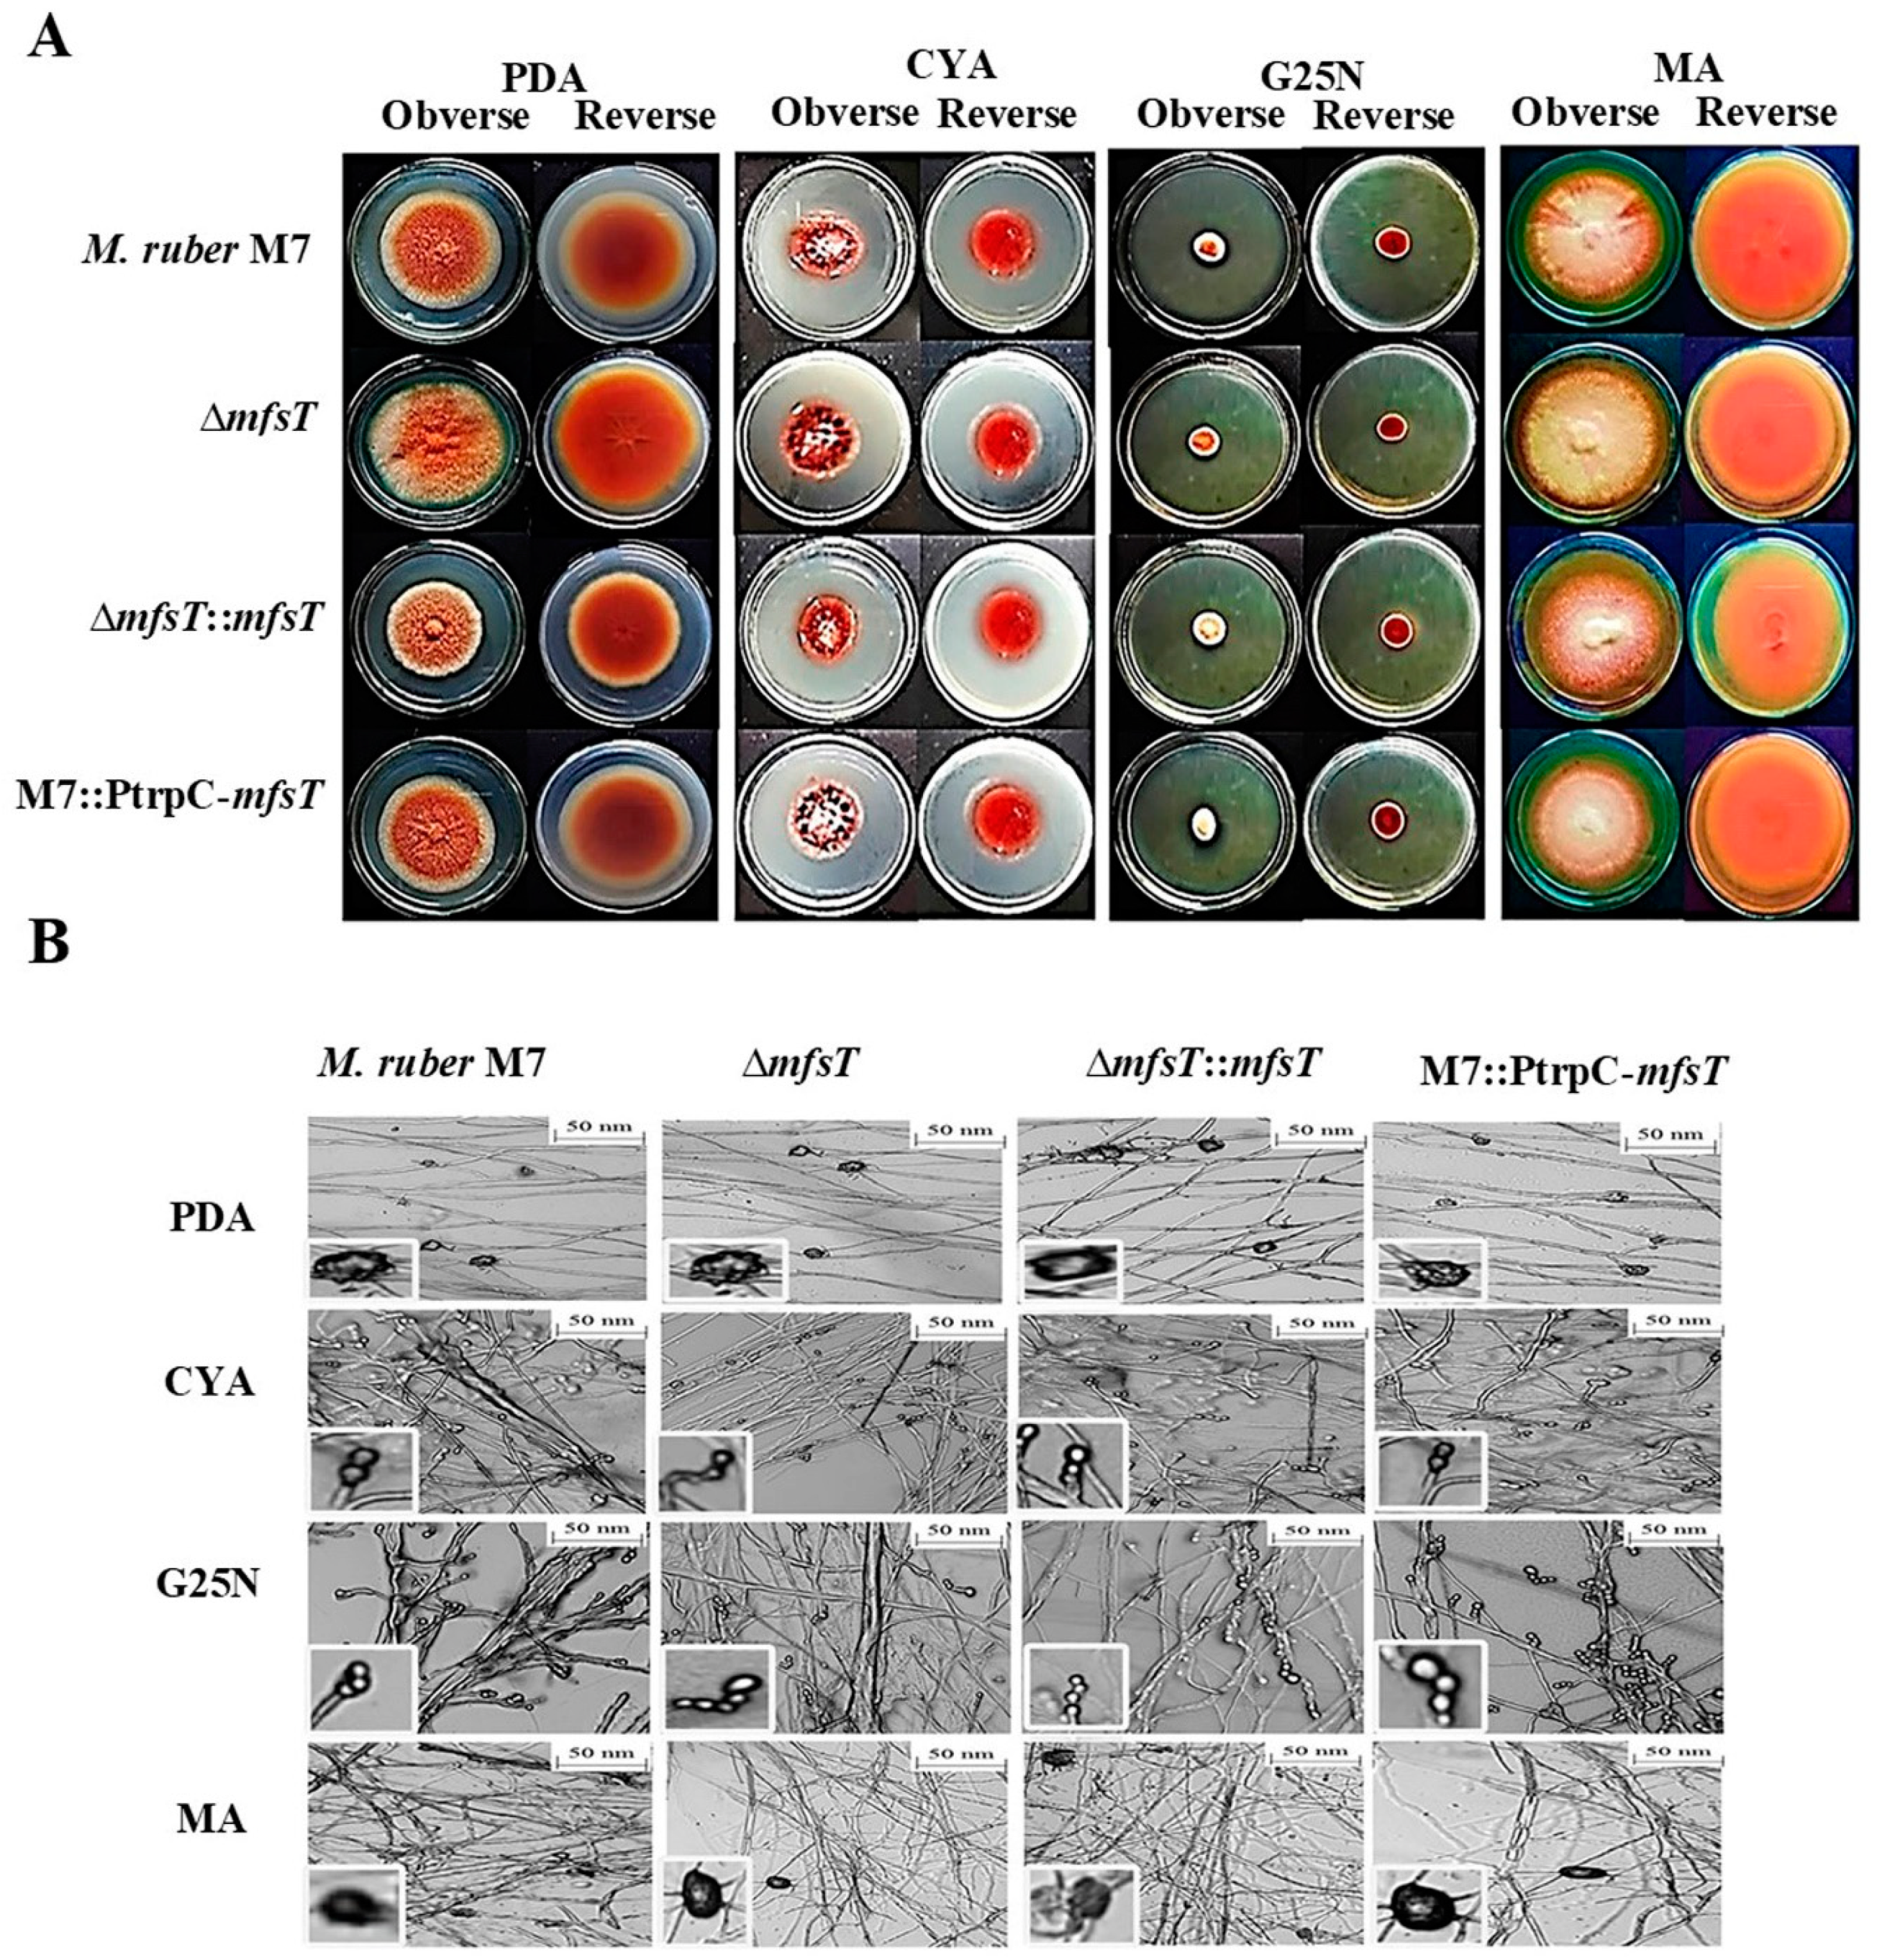
To investigate the morphological development variations between the deletion (ΔmfsT) strain, complementation ΔmfsT::mfsT strain, and overexpression M7::PtrpC-mfsT strain, as compared to M. ruber M7 the phenotypic features were noted. All the mentioned strains inoculated on four distinctive media PDA, G25N, CYA, and MA and incubated for 15 days at 28 °C. While considering the results of M. ruber M7 and ΔmfsT, ΔmfsT::mfsT, and M7::PtrpC-mfsT the significant difference was observed about the phenotypic analysis, such as, the colony edges, colony appearance size, colony diameter and growth rate among the strains in PDA and MA media plates (Figure 5A). While for G25N the colony color for ΔmfsT::mfsT, and M7::PtrpC-mfsT little bit lighter as compared to M. ruber M7 as well as ΔmfsT. Moreover, overall development and phenotype of cleistothecia and conidia also demonstrated no variations among the mutant strains as compared to the wild strain (Figure 5B).

3.5. Biomass

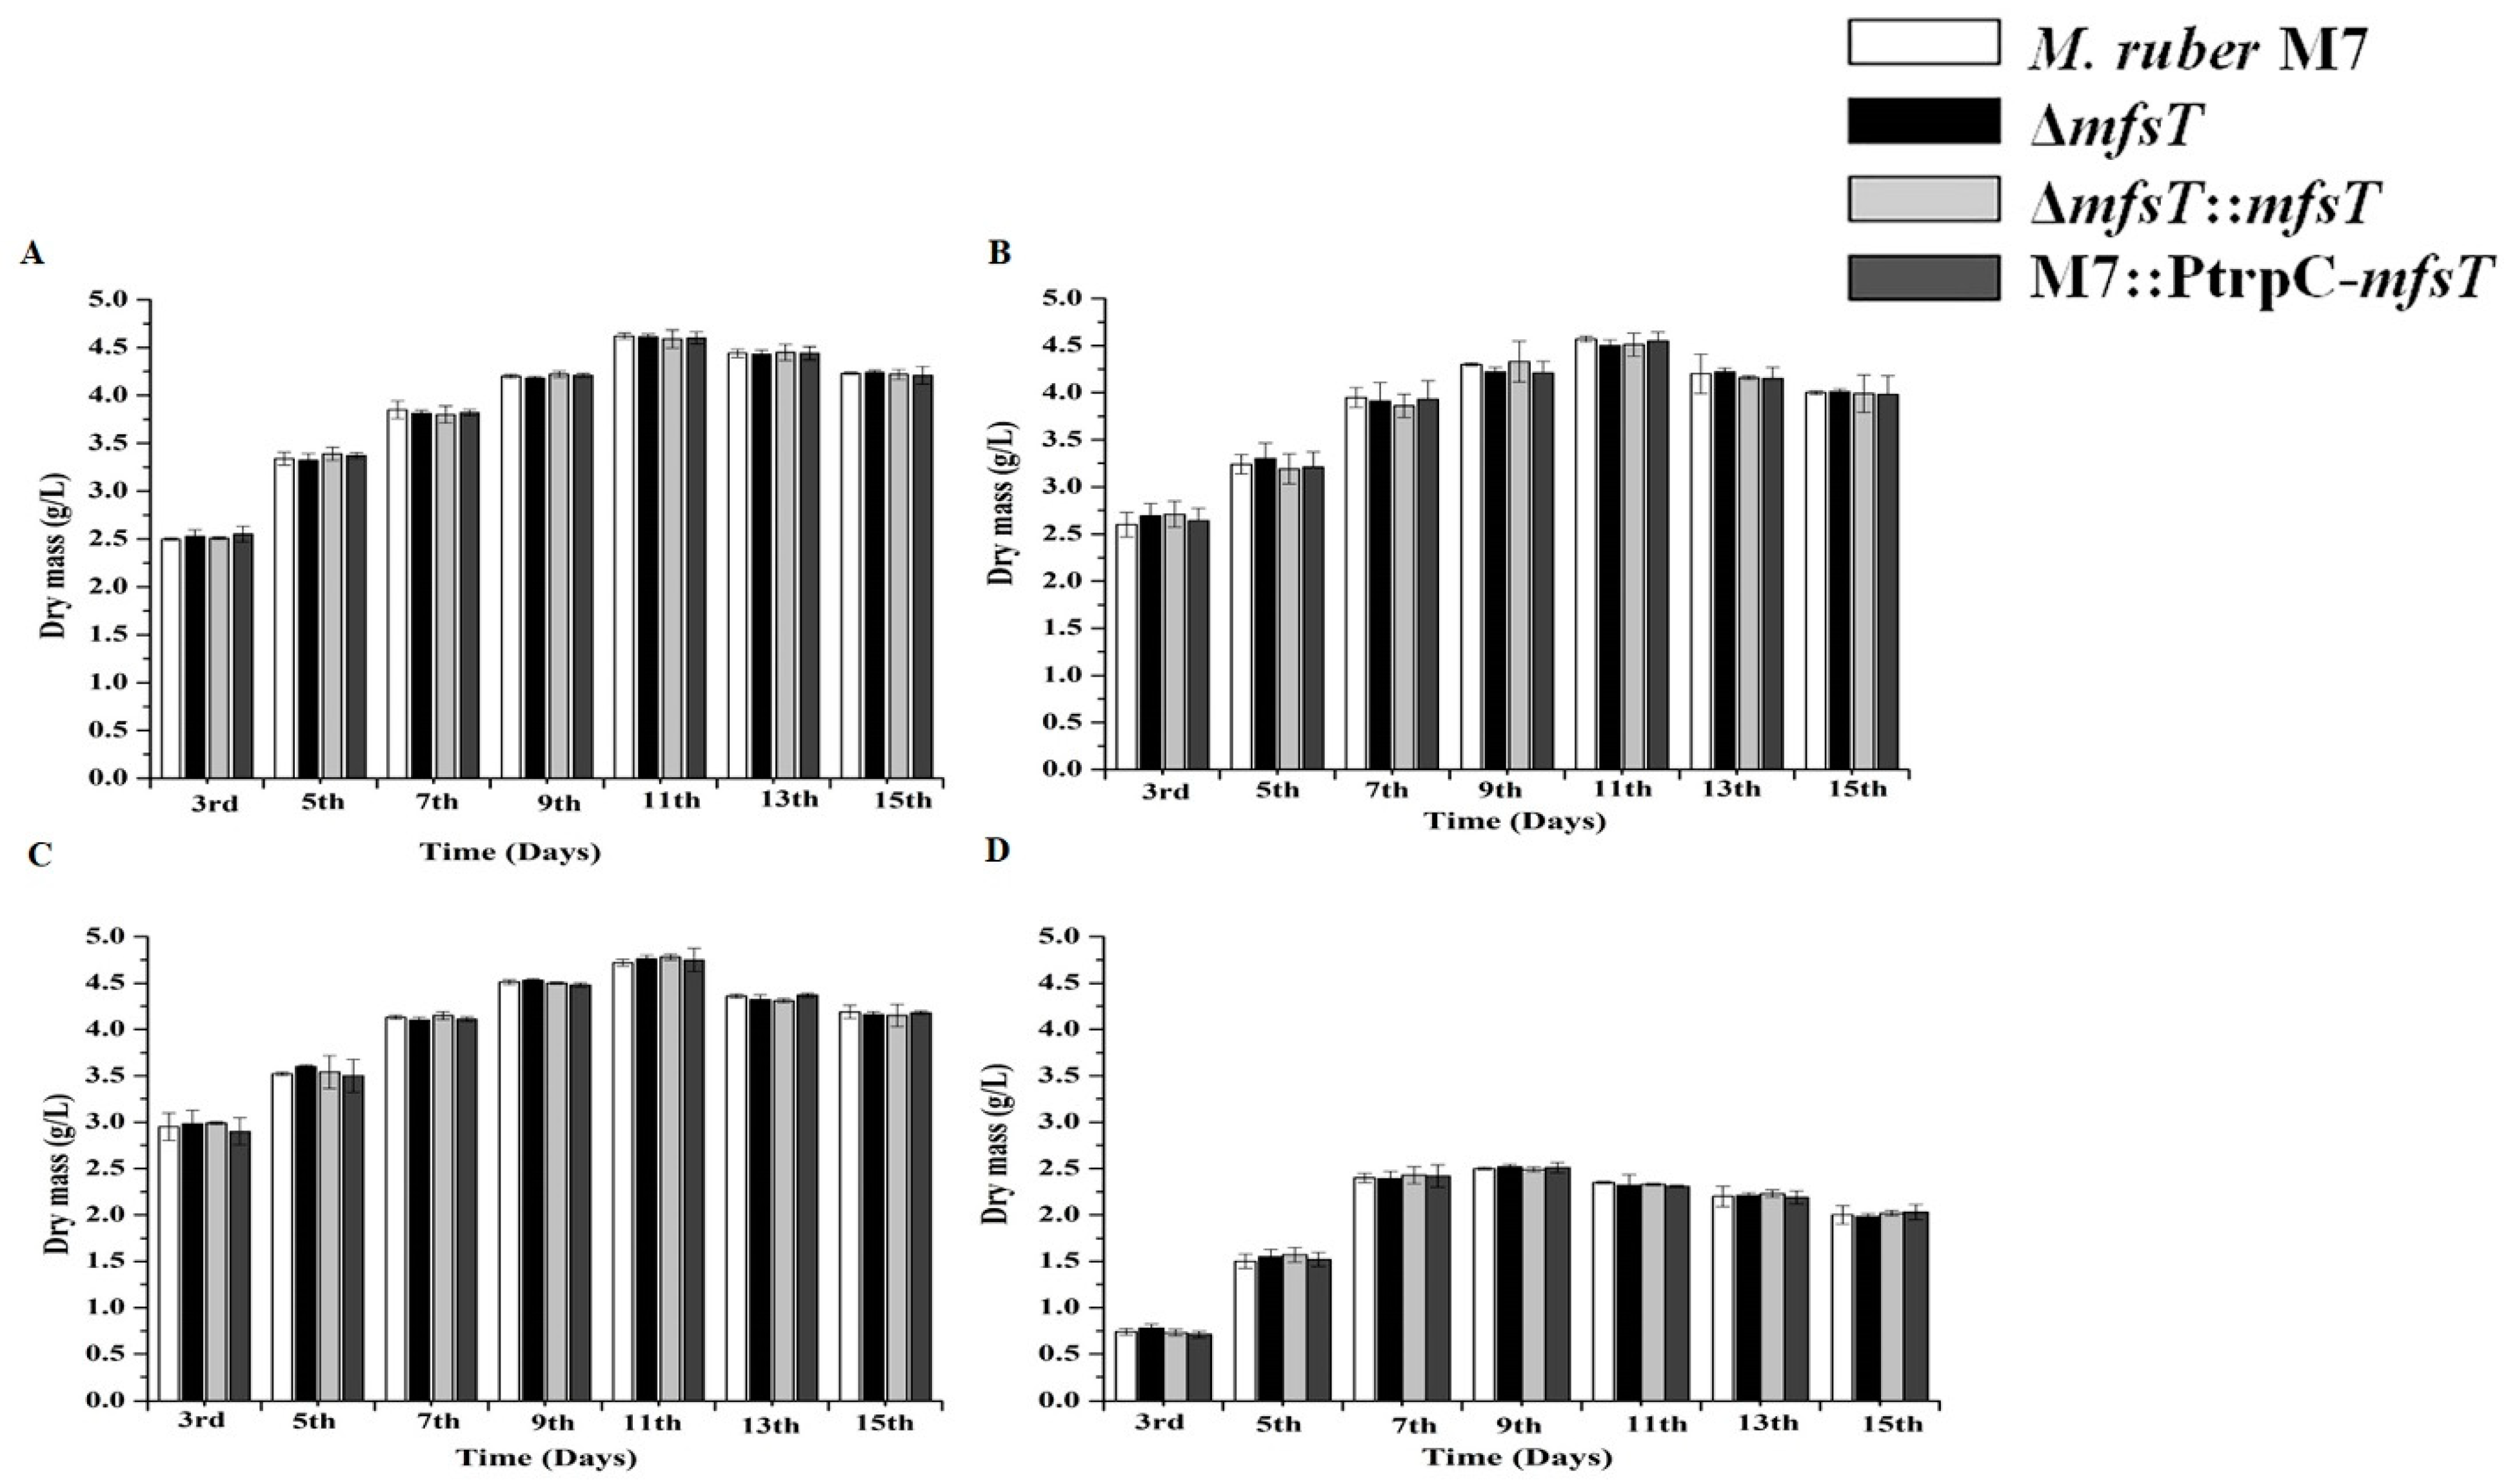
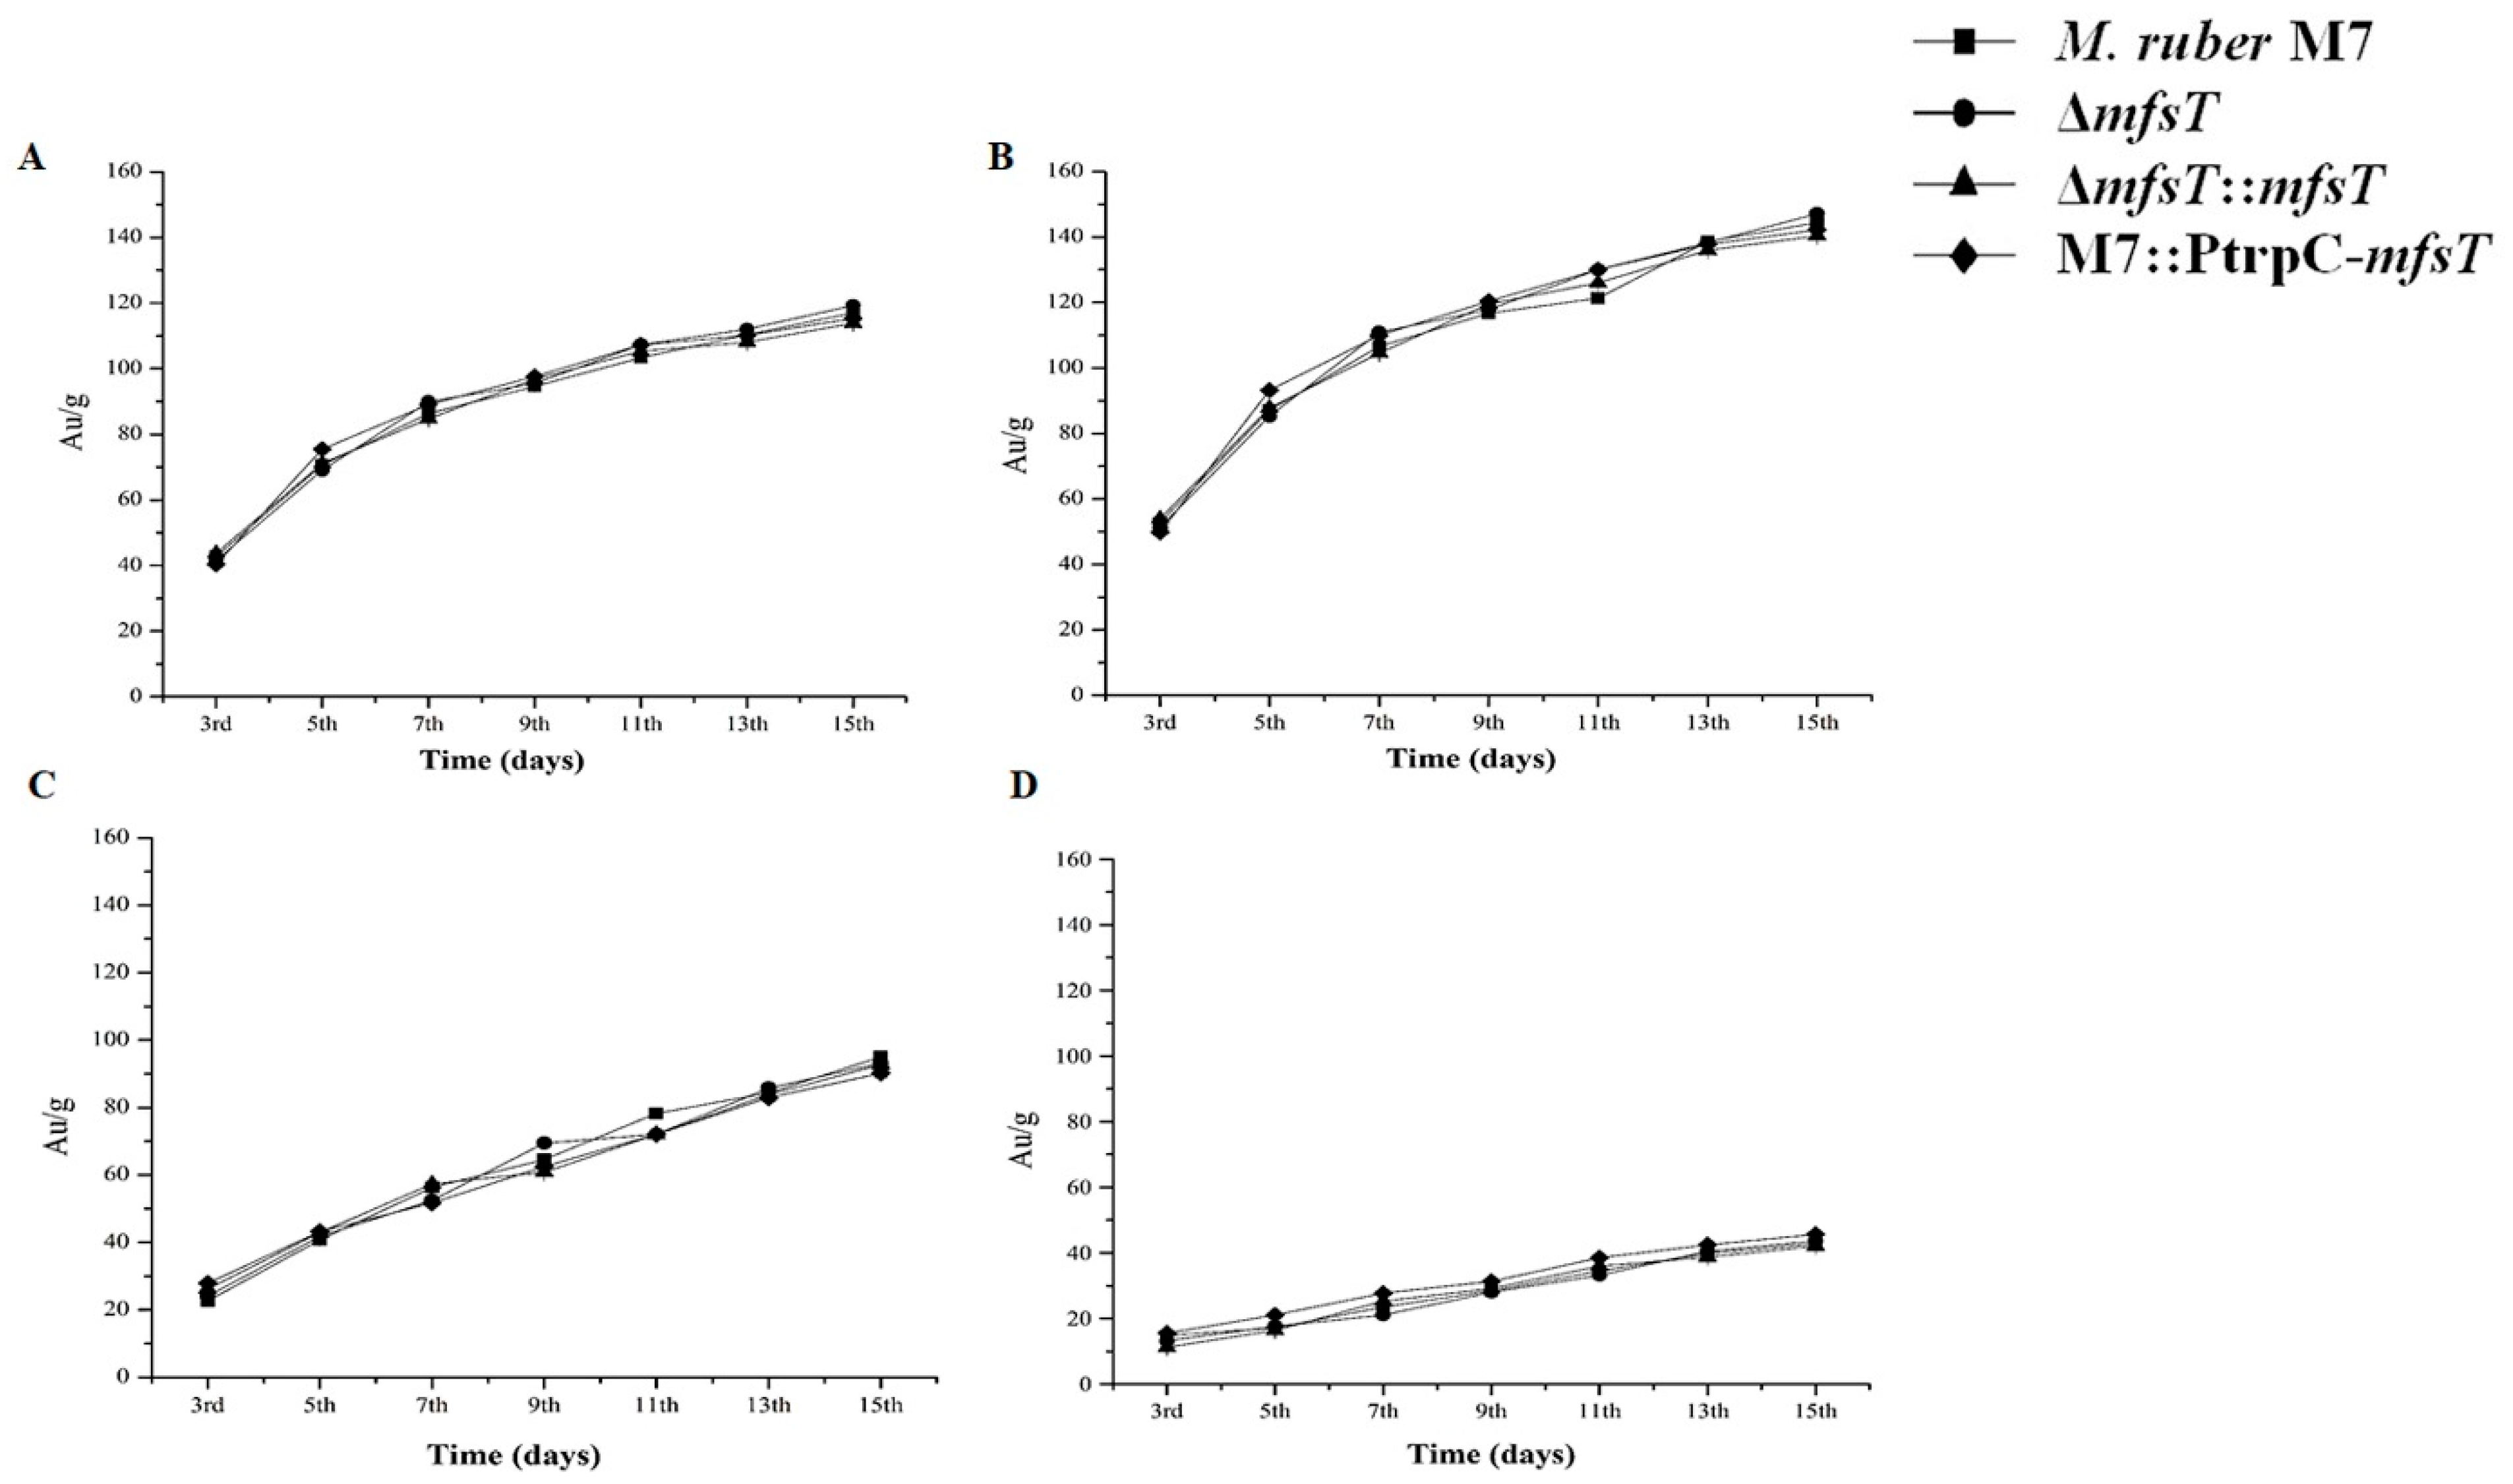
The biomass of M. ruber M7 as a control to ΔmfsT, ΔmfsT::mfsT, and M7::PtrpC-mfsT strains measured by weighing the dry cell weight of the mycelia. The results presented in Figure 6, showed the significant (p < 0.05) increase in the biomass value for all the strains up to the 15th day. However, the greatest biomass was observed on the 11th day and after that overall a decreasing trend in biomass was noted.

3.6. Analyses of MP Production ΔmfsT, ΔmfsT::mfsT and M7::PtrpC-mfsT

Previously, Liu et al. [44] and Feng et al. [7] reported that Monascus spp. can produce many secondary metabolites especially MPs such as red, orange, and yellow. Overall production of the pigments notably (p < 0.01) increased from 3rd to 15th day for all strains (Figure 7).

3.7. Detection and Production of PG by HPLC and UPLC

The role of the mfsT gene in the putative penicillin biosynthesis in M. ruber M7, all transformants strains deletion (ΔmfsT), complementation (ΔmfsT::mfsT), and overexpression (M7::PtrpC-mfsT) were investigated by the HPLC. All the strains fermented in penicillin production conditions for 7 days. The samples collected at the 7th day beside the treated samples and studied by HPLC for the estimation of the PG.
In the ΔmfsT strains, the insufficiency of the extracellular PG was observed, may be due to its accumulation within the cells of the mutant. However, HPLC results indicated that these mutants could not accumulate the intracellular PG (Figure 8A). In these transformants, intracellular PG levels were lower than the detectable levels during fermentation.
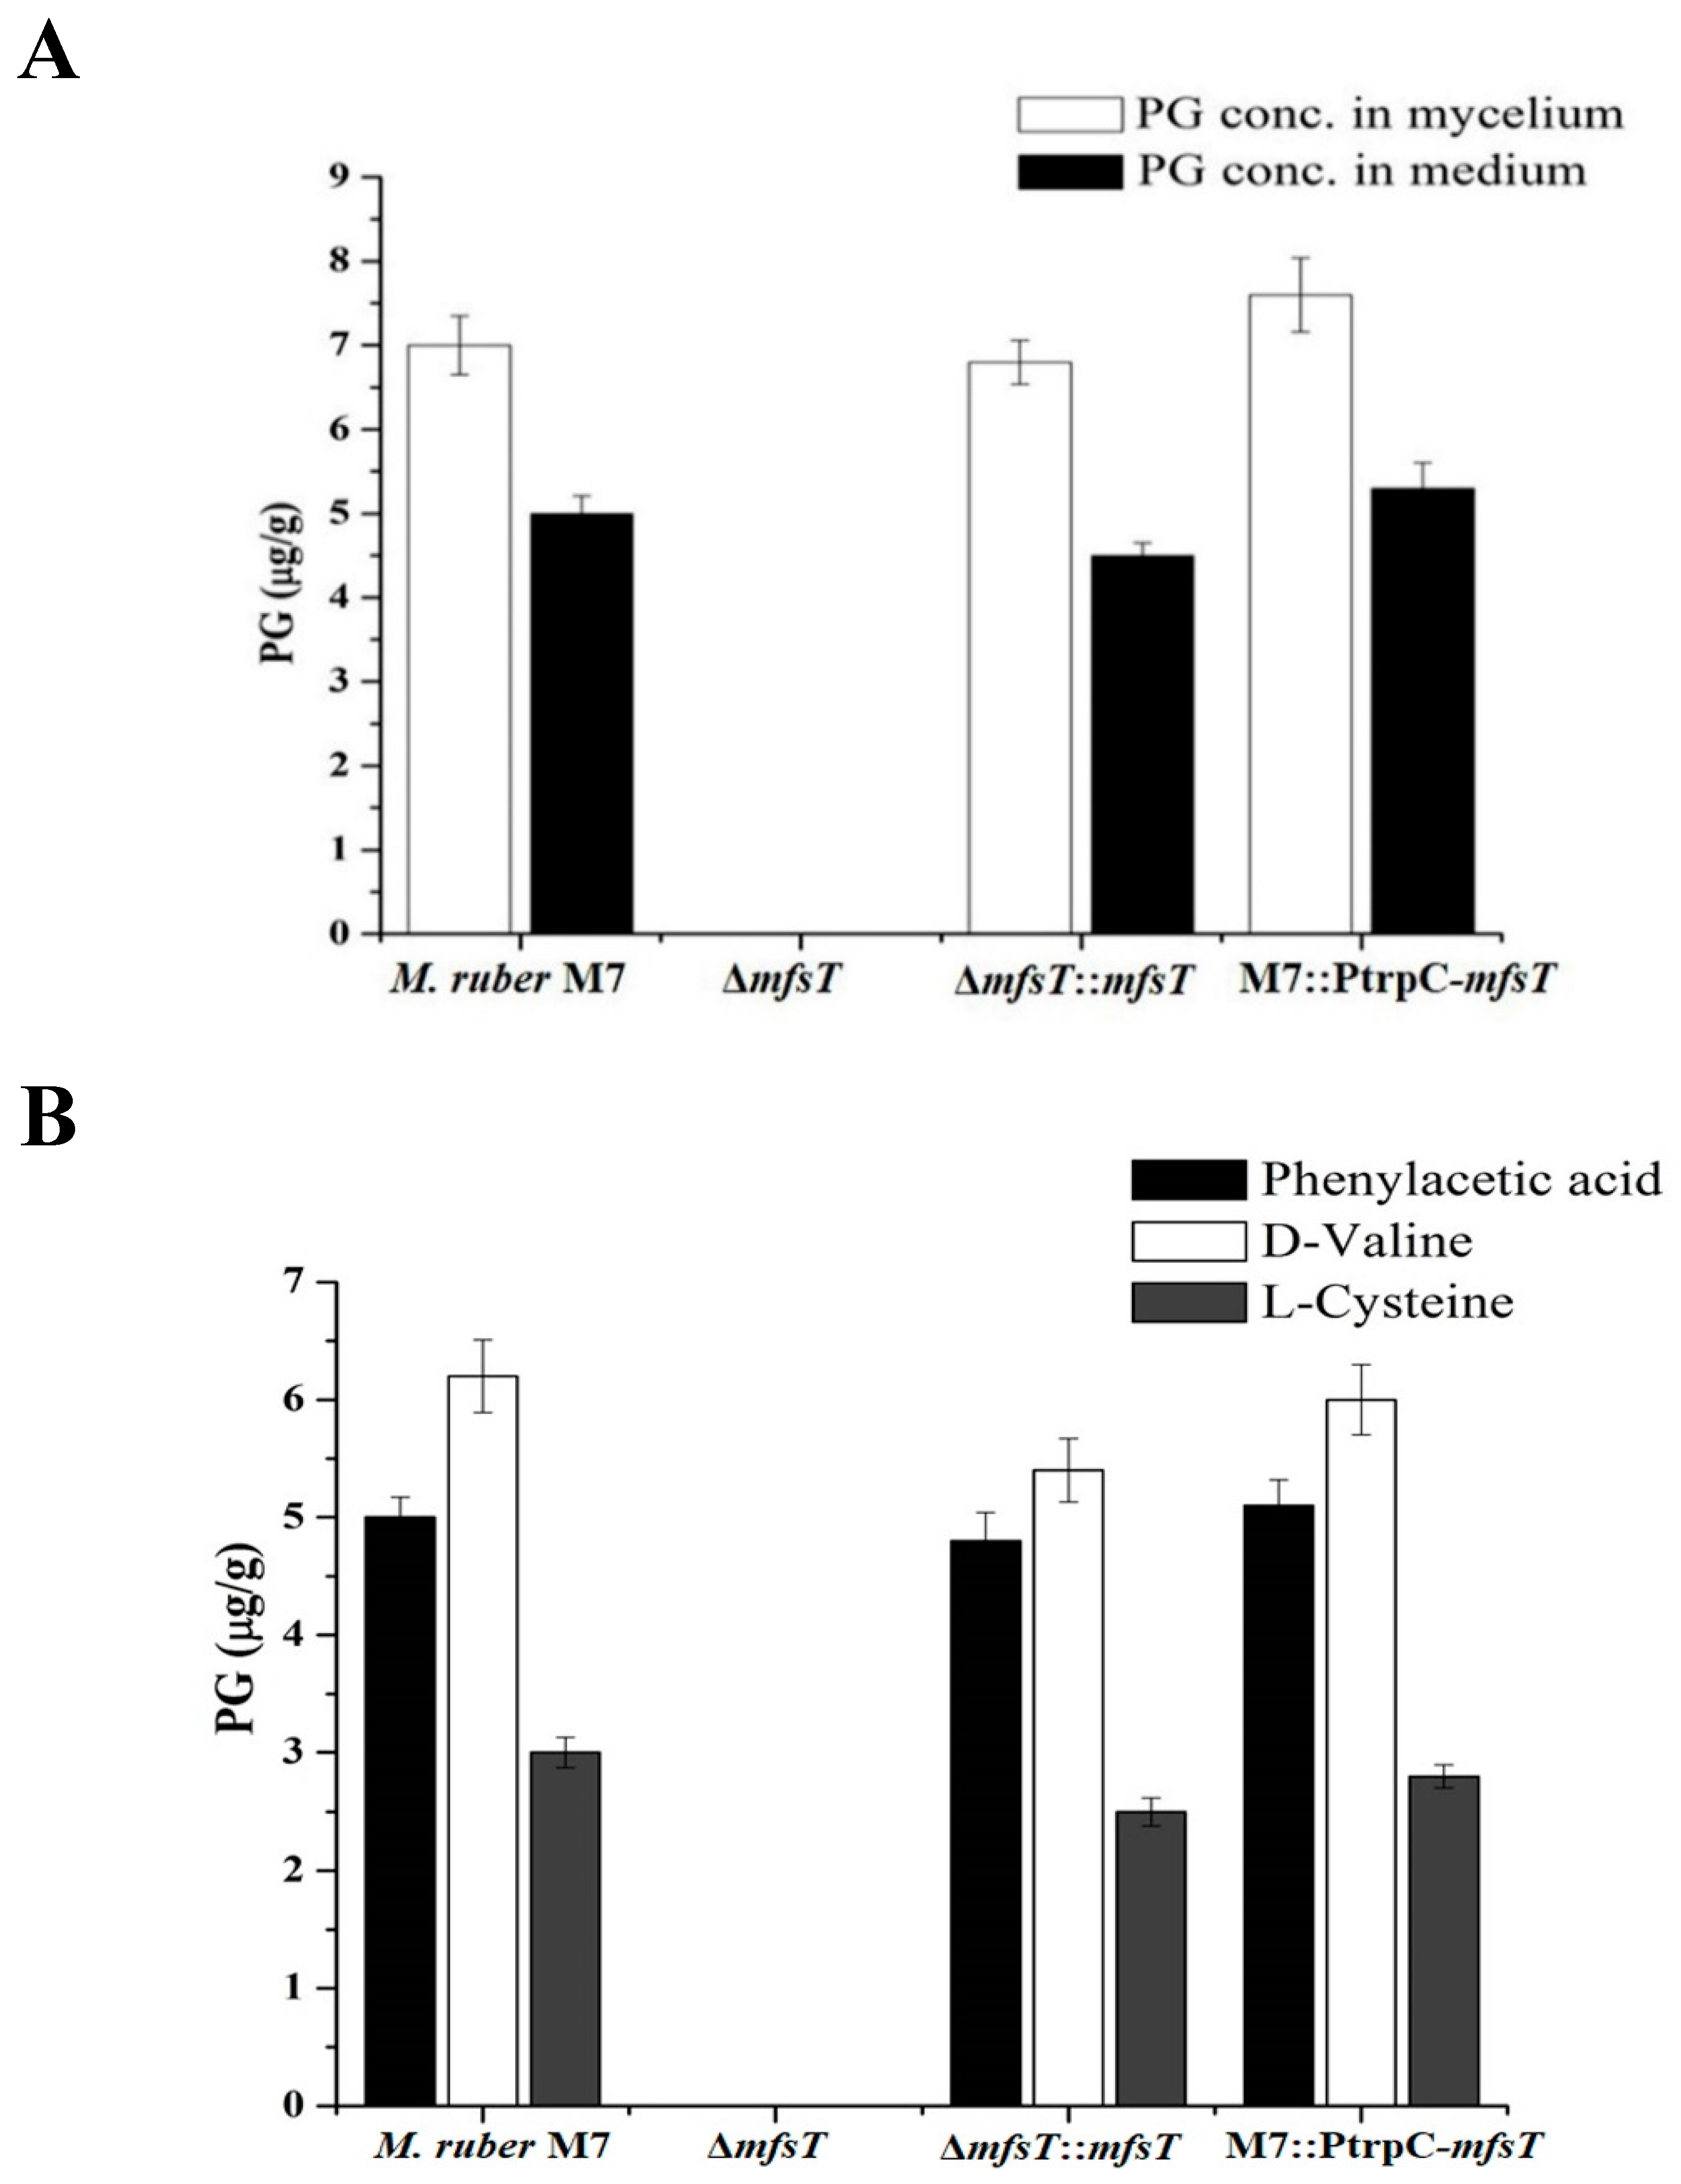
The detected PG production summaries among the mutant strains, some of them exhibited an increase such as overexpression (M7::PtrpC-mfsT), while ΔmfsT revealed no PG production in contrast to the parental strain M7 at the 7th day (Figure 8A). The mean PG yield in intracellular portion of transformants ΔmfsT, ΔmfsT::mfsT, and M7::PtrpC-mfsT calculated as 0.0 ± 0.00 μg/g, 6.8 ± 0.26 μg/g, and 7.6 ± 0.43 μg/g, compared to the parental strain, i.e., 7.0 ± 0.35 μg/g (Figure 8A). Whereas, the extracellular results gave the same pattern for the production of PG ΔmfsT, ΔmfsT::mfsT, and M7::PtrpC-mfsT yielding the PG, 0.0 ± 0.00 μg/g, 4.5 ± 0.15 μg/g, and 5.3 ± 0.30 μg/g, compared to the parental strain, i.e., 5.0 ± 0.21 μg/g (Figure 8A).
Conclusively, there is clear proof about the ΔmfsT gene role for having the depilatory effect on the PG production by blocking transportation of intermediates. While, for further confirmation of the complementation strain, ΔmfsT::mfsT showed almost similar production rates as did the parental strain.
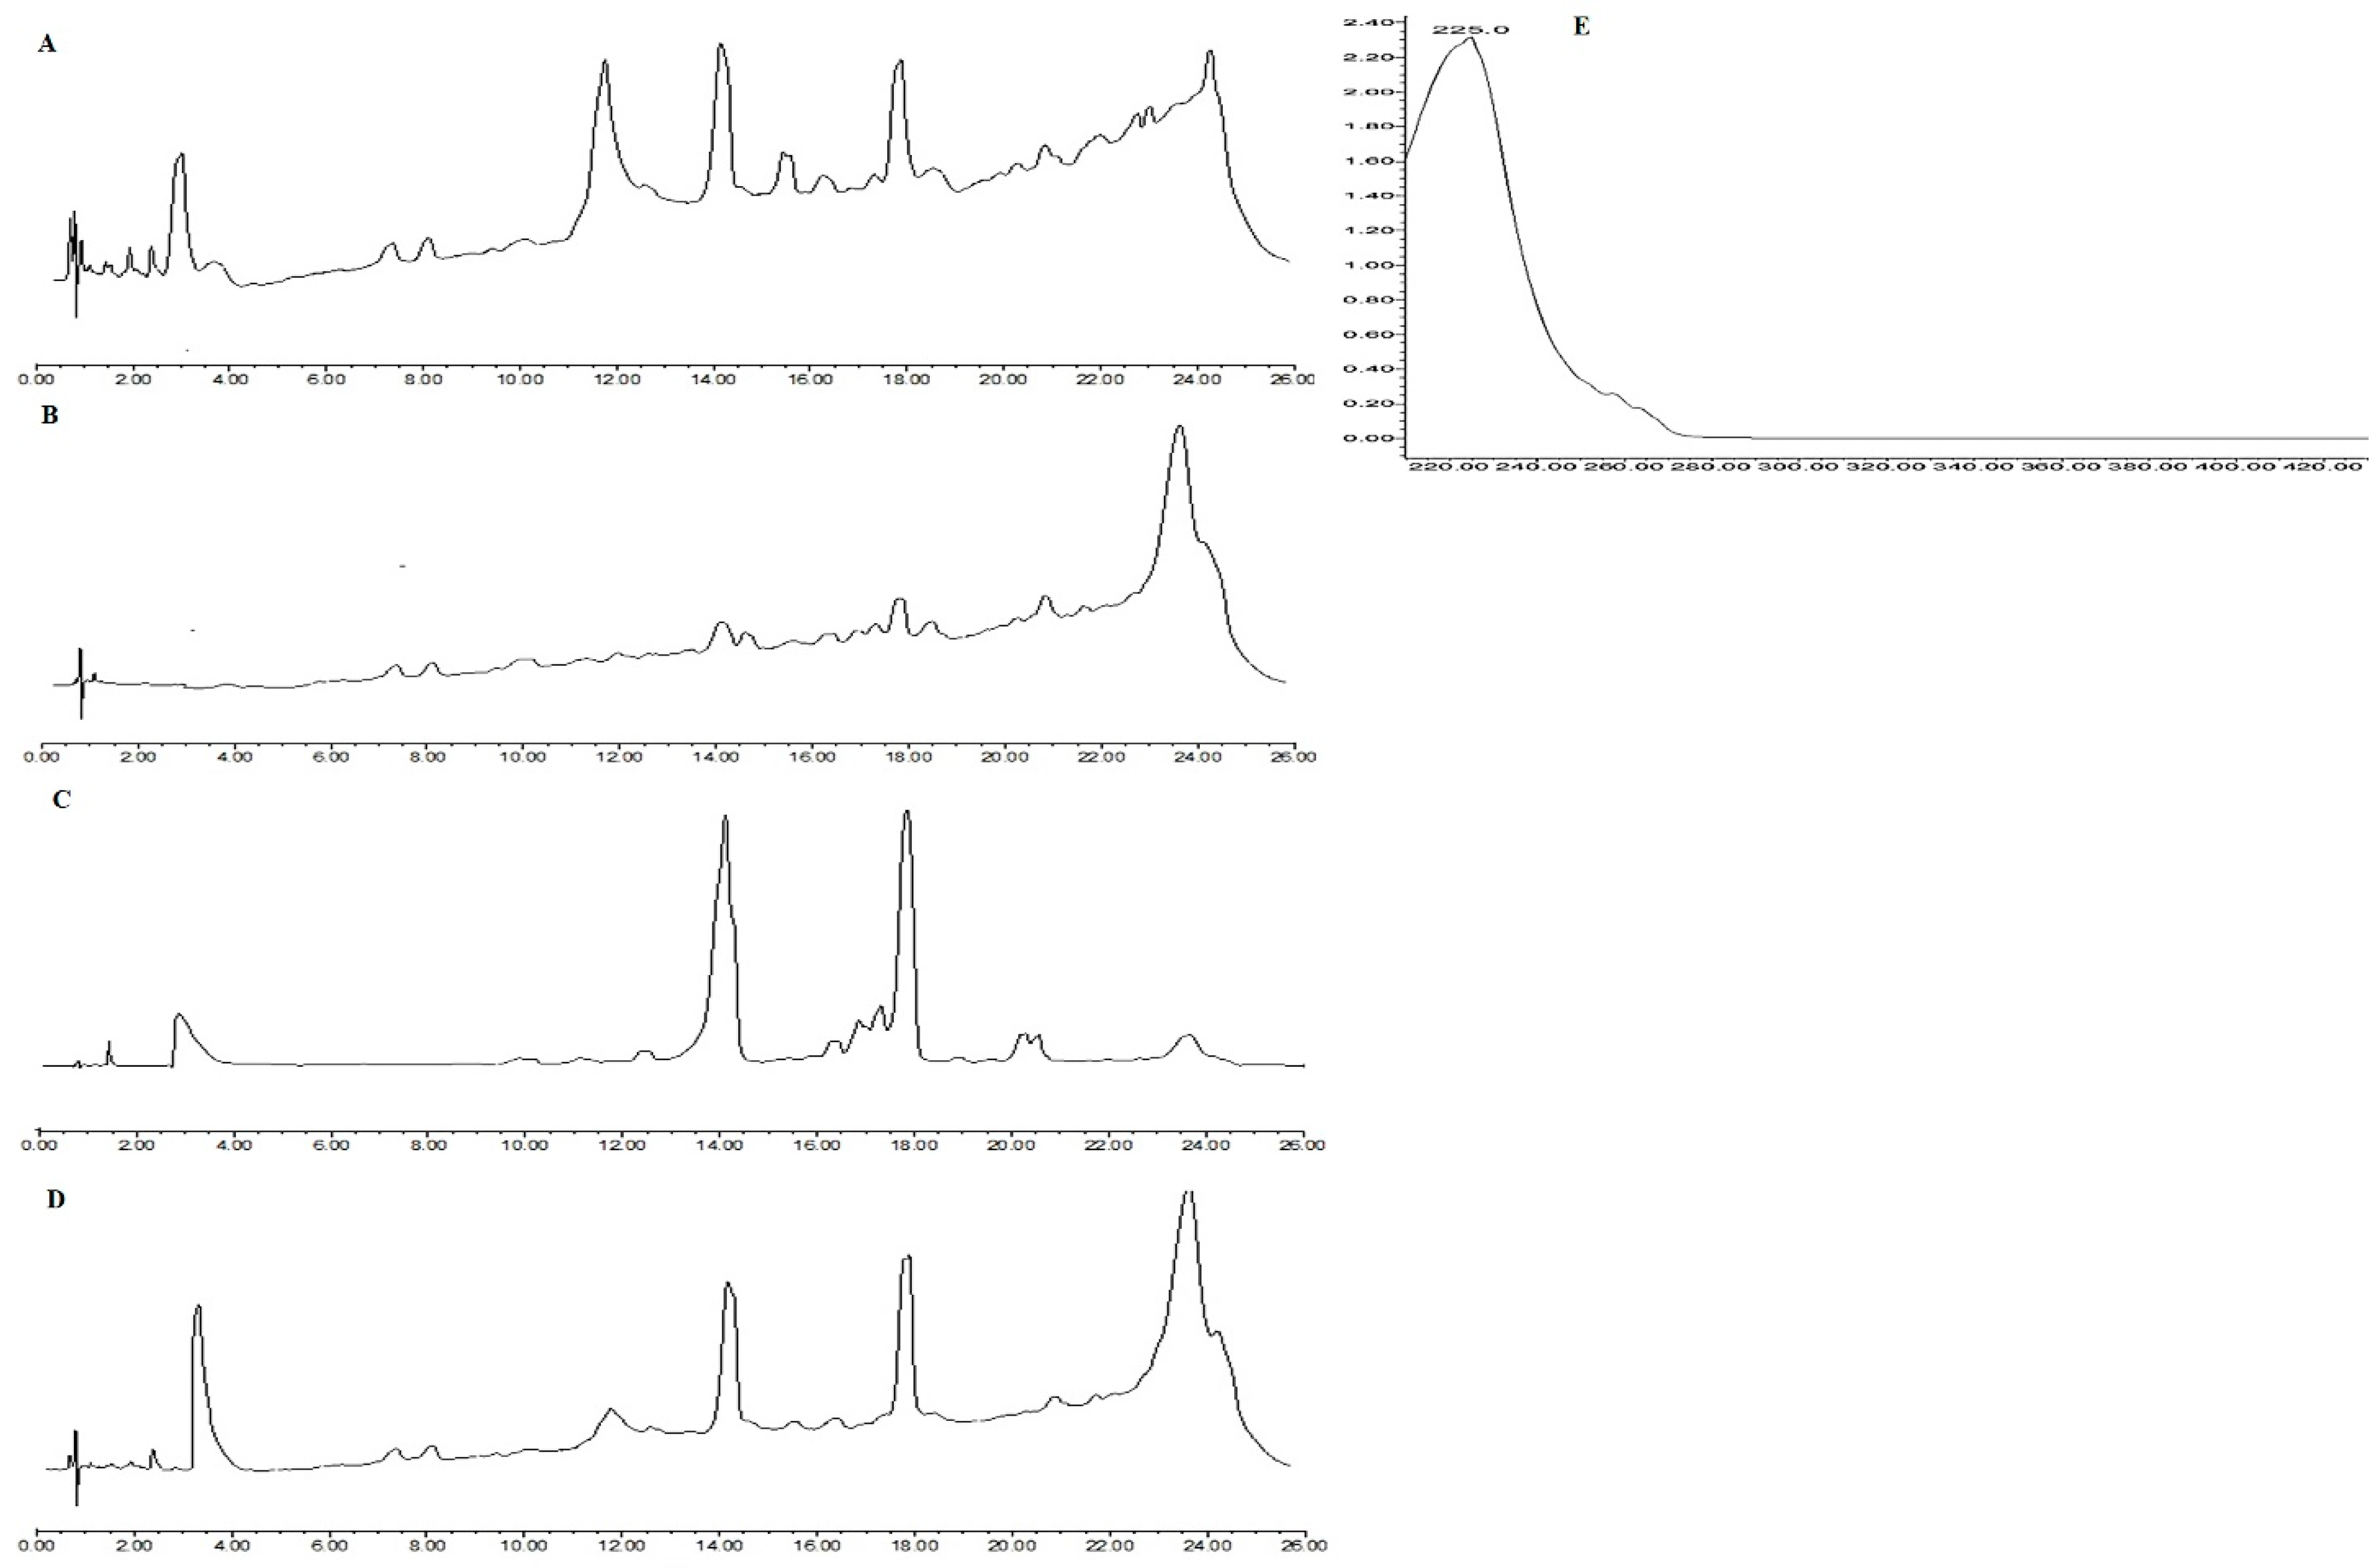
The PG presence in the filtrate of M. ruber M7, ΔmfsT, ΔmfsT::mfsT, and M7::PtrpC-mfsT confirmed by UPLC analyses (Figure 9). The spectrum of penicillin G is presented in (Figure 9E). The peak for penicillin G appeared at approximately 3.8 min in the case of sample filtrate for M. ruber M7(Figure 9A), ΔmfsT::mfsT (Figure 9C), M7::PtrpC-mfsT (Figure 9D), having the same spectrum as PG. And no peak appeared in the case of ΔmfsT (Figure 9B), which confirmed that none was produced by ΔmfsT. Hence, mfsT is responsible for controlling the production of PG by transportation of intermediate compounds in M. ruber M7. For more confirmation feeding of precursor amino acids has been performed to check the mfsT gene function for the transportation of intermediate.

3.8. Effect of Feeding of Precursor Amino Acids

First of all, the morphological sensitivity for colony development and SMs of the M. ruber M7, ΔmfsT, ΔmfsT::mfsT, and M7::PtrpC-mfsT strains were investigated against the phenylacetic acid, D-valine, and L-cysteine The effect on the formation of cleistothecia and conidia was also observed. In the case of phenylacetic acid, D-valine, and L-cysteine feeding fermentation, a sharp decline in the biomass was observed for ΔmfsT, ΔmfsT::mfsT and M7::PtrpC-mfsT as compared to the M7 up to a 15th day for all amino acids. The amino acids and side chain feeding exhibited a clear biomass reduction L-cysteine < phenylacetic acid < D-valine. The lowest biomass was observed in L-cysteine feeding experiment (Figure 6B–D).
Despite, the amino acid supplementation affected the ability of the production of the pigments. D-valine feeding significantly increased the yield of pigments in all strains (Figure 7B). While for the exposure of the L-cysteine showed a significant reduction (p < 0.01) in the pigment contents for all mutant strains as well as in M7 (Figure 7D). In the case of phenaylacaetic acid supplementation, slower growth has been observed among ΔmfsT, ΔmfsT::mfsT, M7::PtrpC-mfsT, and M. ruber M7.
Similarly, no PG production was observed in the ΔmfsT mutant 0.0 ± 0.00 µg/g (Figure 8B). Hence, from the above results it noted that gene mfsT did not involve in the pathway amino acid transportation. While, in other mutants all amino acid supplementation reduced the PG production due to lower biomass yield.
The effect of pathway amino acids and side chain (phenylacetic acid, D-valine, and L-cysteine) on colony morphology and the formation of the spores of ΔmfsT, ΔmfsT::mfsT, M7::PtrpC-mfsT and M7. All strains cultivated on PDA plates which were supplemented with 2 mM concentration of each amino acid and incubated for 15 days at 28 °C. As a result, a significant difference related to diameter and colony morphology was observed among supplemented amino acids. Moreover, the mutants ΔmfsT, ΔmfsT::mfsT, M7::PtrpC-mfsT and wild type M. ruber M7 colony characteristics change such as, the size, color, and shape (Figure 10A). The phenylacetic acid supplementation decreased the sensitivity among the ΔmfsT, ΔmfsT::mfsT, and M7::PtrpC-mfsT strains, the irregularity was observed in colony edges. For L-cysteine, the overall colony diameter and growth rate was decreased in all mutant strains ΔmfsT, ΔmfsT::mfsT, and M7::PtrpC-mfsT as compared to the M7. While similar to M7, the change in color of the colony was observed by the feeding of the D-valine in ΔmfsT, ΔmfsT::mfsT, and M7::PtrpC-mfsT. However, there was no difference observed in the conidia formation for all strains (Figure 10B). UPLC-MS/MS was performed for further clarification of the function of mfsT gene.

3.9. Detection of Beta Lactam Metabolites by UPLC-MS Results

A mass profile of the M. ruber, ΔmfsT, ΔmfsT::mfsT, and M7::PtrpC-mfsT on solid state fermentation rice filtrate created to explore the metabolites. Since this filtrate indicated a broader range of biological activities. The results of the foot-printing of the abundant metabolites present in M. ruber M7 have been presented in Figure 11.
Molecular masses related to the beta-lactam like PG established in the filtrate of the culture. Hence, the PG presence in M. ruber M7 extract was also demonstrated in the analysis of UPLC-MS/MS (Figure 11). The occurrence of the mass (335.336 g/mol) in the crude extract of M7 (Figure 11B) and the similar fragmentation pattern exists in the standard penicillin G (Figure 11A) approved the identity of this metabolite. While in the case of ΔmfsT no PG peak detected (Figure 11C).
While comparing the results for all strains, another peak for 395 g/mol [56] for isopenicillin N missed in Δfsmt (Figure 11C) as compared to other strains such as M. ruber, ΔmfsT::mfsT, and M7::PtrpC-mfsT. Hence, the mfsT may be responsible for the transportation of IPN and in deletion mutant (ΔmfsT) IPN transportation blocked, which may interfere the PG pathway.

4. Discussion

A large number of transporter proteins perform a leading role to maintain the physiological balance from prokaryotic to eukaryotic organisms by permitting the substrate transportation across the lipid bilayers of every cell. From the genomic analysis, 10% of all these transporter proteins belong to the MFS [17,57]. Until now, the secondary metabolites shipping from cellular compartments to export cell are not fully known in fungal cells. Although, the strong prediction reported regarding the presence of a gene encoding the major facilitator superfamily (MFS) transporter proteins in the gene clusters of secondary metabolites. Therefore, in biosynthetic pathways, may be these membrane-spanning proteins take part in compartmentalization or localization between the microbodies or to the extracellular [9,58]. The MFS transporter proteins acted as a secondary carrier operated by the proton (H+) motive force created by the electrochemical proton gradient across the transmembrane [25]. It is assumed that as a consequence of the selective evaluation, the MFS transporters undergo the mutation process, which modifies their binding ability to the specific ligand and let them transport the secondary metabolites [59].
In the present exploration, we have analyzed one of the major facilitator superfamily (MFS) member exited in M. ruber M7, we named it as “mfsT”. The mfsT gene responsible for encoding the protein MfsT in M. ruber M7 was found similar to Aspergillus and Penicillium spp. through comparative analyses of their protein sequences with the algorithm Blastp (protein–protein alignment with Basic Local Alignment Search Tool, (NCBI). Supporting this fact, MrMfsT (Monascus ruber major facilitator superfamily) exhibits the significant amino acid alignment with other MFSs transporter protein related to Penicillium species (Table 2.) such as, chrysogenum (KZN94365.1), occitanis (PCG89412.1), expansum (XP_016598554.1), italicum (KGO74874.1), griseofulvum (KXG49310.1), digitatum Pd1 (XP_014538707.1). Typically, most of the MFS transporters possess a 12–14 hydrophobic transmembrane spanners, divided into two specific folded domains with equal number of spanners [59]. The MfsT protein carries two discrete blocks of domain with 6TMS in each domain (Supplementary Figure S1.) Moreover, 6TMS/6TMS domain structure typical characteristic of the MFS members [58]. The hydrophobic binding chamber of MFS transporter undergoes a series of the mutation processes during evolution, which increase its specificity towards the particular secondary metabolites [59]. The binding site of hydrophobic chamber is surrounded by the 12TMS topologically, as predicted by tridimensional modeling (Supplementary Figure S2.).
The participation of mfsT in the putative biosynthesis of penicillin G in M. ruber confirmed by investigating the three types of mutated strains was achieved by the deletion, overexpression, and complementation of the mfsT gene. The experimentation analysis of all types of transformants reveals that the modulations in the mfsT gene expression caused the blocked (Figure 9B), increased and, clearly complementary effect on the PG production (Figure 9C).
Ullán et al. found that, in P. chrysogenum, the PenM belonged to the MFS transporter protein involved for the passing of substrate IPN across the hydrophobic membranes, because, IPN has a hydrophilic nature that hinders its transportation through the cell [34]. Penicillin N (PenN) is biochemically similar to the IPN and they are chemically enantiomers (L and D) in structure. PenN also acts as a substrate for the CefM another MFS transporter protein of A. chrysogenum. This fact points out a conserved range of specificity of these transporter proteins among these two fungi that share part of the beta-lactam biosynthetic pathway [25,60]. Similarly, intermediate compounds of the cephalosporin C transportation encoded by another MFS cefT gene [60]. Moreover, it was also predicted that afTl gene of aflatoxin biosynthetic gene cluster in Aspergillus parasiticus encoded the MFS transporter may affect the production of aflatoxin which is statistically different on the basis of semi quantitative analysis [61,62].
Fernández-Aguado et al. stated that the CmcT which is the MFS transporter protein encoded by the cmcT gene putatively involved for intermediate transportation in the biosynthesis cluster of cephamicin in the A. lactamdurans and S. clavuligerus [17]. A decade ago, by molecular and biochemical working about the biosynthesis of cephalosporin C on A. chrysogenum C10 (ATCC 48272), three genes cefT, cefP, cefM identified that encoded the MFS transporter proteins in the beta-lactam gene cluster. The gene cefT controlled those β-lactams secretion, which have α-aminoadipic derived side chains such as, IPN, PenN, and deacetyl cephalosporin C [33,34,35]. The cefP involved in the IPN translocation to the peroxisomal lumen from the cytosol [34]. Similarly, cefM involved in the PenN transportation from the lumen to the cytosol of the microbodies. Moreover, the penV encoded the membrane MFS transporter genes, which supplies the precursor of the amino acids from the vacuolar pool for the tripeptide ACV formation [37]. The paaT gene in A. chrysogenum participated in the phenylacetate translocation in the peroxisomal bodies, after internalization of phenylacetate it supplied as a side chain for the PG formulation [27]. Meanwhile, in another report about the P. chrysogenum for the transporter ABC40 exhibited the extrusion system to the sorbate, phenylacetate, and benzoate, as well as, shielding the cells from the injurious acidification through the weak acid incorporation to the β-lactam pathway [63].
L-α-aminoadipic acid, L-valine, and L-cysteine have been reported as precursors of penicillin biosynthesis. The cysteine and valine have physiological importance due to their participation in the protein synthesis. While the L-α-aminoadipic acid obtained from the lysine pathway as an intermediate compound. The β-lactam producer strains can produce the higher L-α-aminoadipic acid. Valine acts as the main precursor constituent of the penum nucleus structure [64]. L-valine performed a pivotal function to improve penicillin V (penV) production [65]. There was positive correlation reported in the penV production and L-valine supplementation concentrations in the fermentation medium. Similarly, it was noticed that the enzyme activity of the penicillin biosynthesis was altered by the addition of PAA (phenylacetic acid) into the fermentation medium [66]. The PAA showed an inhibition effect on the biomass yield of Bacillus badius. The PAA as a weak acid increases the medium acidity that affects the growth and ultimately lowers the PG production.

5. Conclusions

In this study, we cloned and categorized an mfsT gene from the M. ruber M7 that encoded the MFS transporter. Our outcomes determined that mfsT putatively involved in penicillin G (PG) production, possibly by translocation of the intermediate compound IPN across the microbodies. This has been detected for the first time that, the MFS transporter is linked with isopenicillin N transportation in M. ruber M7. In the UPLC MS/MS results, the peak appeared with mass 335.336 g/mol and 359.220 g/mol in M. ruber M7, ΔmfsT::mfsT, and M7::PtrpC-mfsT except in the ΔmfsT. The feeding experiments of the PG precursor amino acids and side chain including phenylacetic acid, D-valine, and L-cysteine showed a significant effect on morphologies, and MPs production of ΔmfsT::mfsT and M7::PtrpC-mfsT including M. ruber M7. For the PG results, the pattern for production remains the same for pathway amino acid feeding. Moreover, in M. ruber M7 the secretion of PG might have resulted from the supportive activity of the multiple transporters as a transporter.

Supplementary Materials

The following are available online at https://www.mdpi.com/2076-2607/7/10/390/s1, Figure S1: Hydropathy profile of the MfsT protein amino acid sequence created by TMHMM, Figure S2: Three dimensional modeling of MfsT protein formed by SwissProt.

Author Contributions

R.R. has designed and carried out the present research work, conducted experiments, analyzed the data, and written the present manuscript. M.S.V. helped in doing the experiments and gave the technical guidance. Z.M. helped in analyzing the statistical data, elaborating, drawing the figures, and provided help in proof reading and presenting the work in its present form. X.Y. and A.M.M.A. also helped in carrying out the experiments. F.C. provided place in the laboratory, gave access to the lab facilities for experimentation, and funds for the present work.

Funding

This work was supported by the Major Program of the National Natural Science Foundation of China (Nos. 31730068 and 31330059 to F.C.), and the National Key Research and Development Program of China (No. 2018YFD0400404 to F.C.).

Conflicts of Interest

All the authors hereby solemnly declare that, there is no conflict of interest in the present research work.

References

  1. Shi, Y.C.; Pan, T.M. Beneficial effects of Monascus purpureus NTU 568-fermented products: A review. Appl. Microbiol. Biotechnol. 2011, 90, 1207–1217. [Google Scholar] [CrossRef] [PubMed]
  2. Akihisa, T.; Tokuda, H.; Ukiya, M.; Kiyota, A.; Yasukawa, K.; Sakamoto, N.; Kimura, Y.; Suzuki, T.; Takayasu, J.; Nishino, H. Anti-tumor-initiating effects of monascin, an azaphilonoid pigment from the extract of Monascus pilosus fermented rice (red-mold rice). Chem. Biodivers. 2005, 2, 1305–1309. [Google Scholar] [CrossRef] [PubMed]
  3. Kim, C.; Jung, H.; Kim, Y.O.; Shin, C.S. Antimicrobial activities of amino acid derivatives of monascus pigments. FEMS Microbiol. Lett. 2006, 264, 117–124. [Google Scholar] [CrossRef] [PubMed]
  4. Lee, B.H.; Pan, T.M. Benefit of Monascus-fermented products for hypertension prevention: A review. Appl. Microbiol. Biotechnol. 2012, 94, 1151–1161. [Google Scholar] [CrossRef] [PubMed]
  5. Lee, C.L.; Pan, T.M. Development of Monascus fermentation technology for high hypolipidemic effect. Appl. Microbiol. Biotechnol. 2012, 264, 117–124. [Google Scholar] [CrossRef] [PubMed]
  6. Lee, Y.M.; Li, H.; Hong, J.; Cho, H.Y.; Bae, K.S.; Kim, M.A.; Kim, D.K.; Jung, J.H. Bioactive metabolites from the sponge-derived fungus Aspergillus versicolor. Arch. Pharm. Res. 2010, 33, 231–235. [Google Scholar] [CrossRef] [PubMed]
  7. Feng, Y.; Shao, Y.; Zhou, Y.; Chen, W.; Chen, F. Monascus Pigments. In Industrial Biotechnology of Vitamins, Biopigments, and Antioxidants; Vandamme, E.J., Revuelta, J.L., Eds.; Wiley-VCH: Weinheim, Germany, 2016. [Google Scholar]
  8. Dhakal, R.; Bajpai, V.K.; Baek, K.H. Production of GABA (γ-aminobutyric acid) by microorganisms: A review. Brazilian J. Microbiol. 2012, 43, 1230–1241. [Google Scholar] [CrossRef]
  9. Kistler, H.C.; Broz, K. Cellular compartmentalization of secondary metabolism. Front. Microbiol. 2015, 6, 68. [Google Scholar] [CrossRef]
  10. Wang, W.; Gao, M.; Shao, Z.; Li, F.; Zhang, B.; Ke, W.; Liao, Y. Citrinin Monomer and Dimer Derivatives with Antibacterial and Cytotoxic Activities Isolated from the Deep Sea-Derived Fungus Penicillium citrinum NLG-S01-P1. Mar. Drugs 2019, 17, 46. [Google Scholar] [CrossRef]
  11. de Oliveira Filho, J.W.G.; Islam, M.T.; Ali, E.S.; Uddin, S.J.; de Oliveira Santos, J.V.; de Alencar, M.V.O.B.; Júnior, A.L.G.; Paz, M.F.C.J.; de Brito, M.D.R.M.; e Sousa, J.M.D.C.; et al. A comprehensive review on biological properties of citrinin. Food Chem. Toxicol. 2017, 110, 130–141. [Google Scholar] [CrossRef]
  12. Ozcengiz, G.; Demain, A.L. Recent advances in the biosynthesis of penicillins, cephalosporins and clavams and its regulation. Biotechnol. Adv. 2013, 31, 287–311. [Google Scholar] [CrossRef] [PubMed]
  13. Chen, W. Insights Into Biological Characteristics Of Monascus Ruber M7 by Genomics Approaches. Doctor Thesis, Huazhong Agricultural University, Wuhan, China, 2015. [Google Scholar]
  14. Wei, W.; Lin, S.; Chen, M.; Liu, T.; Wang, A.; Li, J.; Guo, Q.; Shang, X. Monascustin, an unusual γ-lactam from red yeast rice. J. Nat. Prod. 2017, 80, 201–204. [Google Scholar] [CrossRef] [PubMed]
  15. Lobanovska, M.; Pilla, G. Penicillin’s discovery and antibiotic resistance: Lessons for the future? Yale J. Biol. Med. 2017, 90, 135–145. [Google Scholar] [PubMed]
  16. Lamas-Maceiras, M.; Vaca, I.; Rodríguez, E.; Casqueiro, J.; Martín, J.F. Amplification and disruption of the phenylacetyl-CoA ligase gene of Penicillium chrysogenum encoding an aryl-capping enzyme that supplies phenylacetic acid to the isopenicillin N-acyltransferase. Biochem. J. 2006, 395, 147–155. [Google Scholar] [CrossRef] [PubMed] [Green Version]
  17. Fernández-Aguado, M.; Martín, J.F.; Rodríguez-Castro, R.; García-Estrada, C.; Albillos, S.M.; Teijeira, F.; Ullán, R.V. New insights into the isopenicillin N transport in Penicillium chrysogenum. Metab. Eng. 2014, 22, 89–103. [Google Scholar] [CrossRef]
  18. Barreiro, C.; García-Estrada, C. Proteomics and Penicillium chrysogenum: Unveiling the secrets behind penicillin production. J. Proteomics 2019, 198, 119–131. [Google Scholar] [CrossRef]
  19. Van Den Berg, M.A.; Albang, R.; Albermann, K.; Badger, J.H.; Daran, J.M.; Driessen, A.J.; Garcia-Estrada, C.; Fedorova, N.D.; Harris, D.M.; Heijne, W.H.M.; et al. Genome sequencing and analysis of the filamentous fungus Penicillium chrysogenum. Nat. Biotechnol. 2008, 26, 1161–1168. [Google Scholar] [CrossRef] [Green Version]
  20. Ávalos, J.; Díaz-Sánchez, V.; García-Martínez, J.; Castrillo, M.; Ruger-Herreros, M.; Limón, M.C. Biosynthesis and Molecular Genetics of Fungal Secondary Metabolites, Fungal Biology; Springer: Berlin, Germany, 2014. [Google Scholar]
  21. García-Estrada, C.; Vaca, I.; Fierro, F.; Sjollema, K.; Veenhuis, M.; Martín, J.F. The unprocessed preprotein form IATC103S of the isopenicillin N acyltransferase is transported inside peroxisomes and regulates its self-processing. Fungal Genet. Biol. 2008, 45, 1043–1052. [Google Scholar] [CrossRef] [Green Version]
  22. Evers, M.E.; Trip, H.; van den Berg, M.A.; Bovenberg, R.A.L.; Driessen, A.J.M. Compartmentalization and Transport in β-Lactam Antibiotics Biosynthesis. In Molecular Biotechnolgy of Fungal beta-Lactam Antibiotics and Related Peptide Synthetases; Springer: Berlin, Germany, 2012; Volume 88. [Google Scholar]
  23. Martín, J.F.; Ullán, R.V.; García-Estrada, C. Regulation and compartmentalization of β-lactam biosynthesis. Microb. Biotechnol. 2010, 3, 285–299. [Google Scholar] [CrossRef]
  24. García-Estrada, C.; Vaca, I.; Ullán, R.V.; Van Den Berg, M.A.; Bovenberg, R.A.; Martín, J.F. Molecular characterization of a fungal gene paralogue of the penicillin penDE gene of Penicillium chrysogenum. BMC Microbiol. 2009, 9, 104. [Google Scholar] [CrossRef]
  25. Martín, J.F.; Ullán, R.V.; García-Estrada, C. Role of peroxisomes in the biosynthesis and secretion of β-lactams and other secondary metabolites. J. Ind. Microbiol. Biotechnol. 2012, 39, 367–382. [Google Scholar] [CrossRef] [PubMed]
  26. Martín, J.F.; Casqueiro, J.; Liras, P. Secretion systems for secondary metabolites: How producer cells send out messages of intercellular communication. Curr. Opin. Microbiol. 2005, 8, 282–293. [Google Scholar] [CrossRef] [PubMed]
  27. Fernández-Aguado, M.; Ullán, R.V.; Teijeira, F.; Rodríguez-Castro, R.; Martín, J.F. The transport of phenylacetic acid across the peroxisomal membrane is mediated by the PaaT protein in Penicillium chrysogenum. Appl. Microbiol. Biotechnol. 2013, 97, 3073–3084. [Google Scholar] [CrossRef] [PubMed]
  28. Lee, J.; Sands, Z.A.; Biggin, P.C. A Numbering System for MFS Transporter Proteins. Front. Mol. Biosci. 2016, 3, 21. [Google Scholar] [CrossRef] [PubMed]
  29. Burckhardt, G.; Wolff, N.A. Structure of renal organic anion and cation transporters. Am. J. Physiol. Physiol. 2017, 278, F853–F866. [Google Scholar] [CrossRef]
  30. Saier, M.H.; Paulsen, I.T. Phylogeny of multidrug transporters. Semin. Cell Dev. Biol. 2001, 12, 205–213. [Google Scholar] [CrossRef] [PubMed]
  31. Guan, L.; Kaback, H.R. Lessons from lactose permease. Annu. Rev. Biophys. Biomol. Struct. 2005, 35, 67–91. [Google Scholar] [CrossRef]
  32. Newstead, S.; Drew, D.; Cameron, A.D.; Postis, V.L.G.; Xia, X.; Fowler, P.W.; Ingram, J.C.; Carpenter, E.P.; Sansom, M.S.P.; McPherson, M.J.; et al. Crystal structure of a prokaryotic homologue of the mammalian oligopeptide-proton symporters, PepT1 and PepT2. EMBO J. 2011, 30, 417–426. [Google Scholar] [CrossRef]
  33. Ullán, R.V.; Godio, R.P.; Teijeira, F.; Vaca, I.; García-Estrada, C.; Feltrer, R.; Kosalkova, K.; Martín, J.F. RNA-silencing in Penicillium chrysogenum and Acremonium chrysogenum: Validation studies using β-lactam genes expression. J. Microbiol. Methods 2008, 75, 209–218. [Google Scholar] [CrossRef]
  34. Ullán, R.V.; Teijeira, F.; Guerra, S.M.; Vaca, I.; Martín, J.F. Characterization of a novel peroxisome membrane protein essential for conversion of isopenicillin N into cephalosporin C. Biochem. J. 2010, 432, 227–236. [Google Scholar] [CrossRef] [Green Version]
  35. Ullán, R.V.; Teijeira, F.; Martín, J.F. Expression of the Acremonium chrysogenum cefT gene in Penicillum chrysogenum indicates that it encodes an hydrophilic β-lactam transporter. Curr. Genet. 2008, 54, 153–161. [Google Scholar] [CrossRef] [PubMed]
  36. Ullán, R.; Liu, G.; Casqueiro, J.; Gutiérrez, S.; Bañuelos, O.; Martín, J. The cefT gene of Acremonium chrysogenum C10 encodes a putative multidrug efflux pump protein that significantly increases cephalosporin C production. Mol. Genet. Genomics 2002, 267, 673–683. [Google Scholar] [CrossRef] [PubMed]
  37. Fernández-Aguado, M.; Teijeira, F.; Martín, J.F.; Ullán, R.V. A vacuolar membrane protein affects drastically the biosynthesis of the ACV tripeptide and the beta-lactam pathway of Penicillium chrysogenum. Appl. Microbiol. Biotechnol. 2013, 97, 795–808. [Google Scholar] [CrossRef] [PubMed]
  38. Chen, F.; Hu, X. Study on red fermented rice with high concentration of monacolin K and low concentration of citrinin. Int. J. Food Microbiol. 2005, 103, 331–337. [Google Scholar] [CrossRef] [PubMed]
  39. He, Y.; Liu, Q.; Shao, Y.; Chen, F. ku70 and ku80 null mutants improve the gene targeting frequency in Monascus ruber M7. Appl. Microbiol. Biotechnol. 2013, 97, 4965–4976. [Google Scholar] [CrossRef] [PubMed]
  40. Shao, Y.; Ding, Y.; Zhao, Y.; Yang, S.; Xie, B.; Chen, F. Characteristic analysis of transformants in T-DNA mutation library of Monascus ruber. World J. Microbiol. Biotechnol. 2009, 25, 989–995. [Google Scholar] [CrossRef]
  41. Chen, W.; Xie, T.; Shao, Y.; Chen, F. Genomic characteristics comparisons of 12 food-related filamentous fungi in tRNA gene set, codon usage and amino acid composition. Gene 2012, 497, 116–124. [Google Scholar] [CrossRef]
  42. Chen, W.; Xie, T.; Shao, Y.; Chen, F. Phylogenomic Relationships between Amylolytic Enzymes from 85 Strains of Fungi. PLoS ONE 2012, 7, e49679. [Google Scholar] [CrossRef]
  43. Wang, L.; Wang, W.; Xu, G. Promotion of Monacolin K production by Agrobacterium tumefaciens-mediated transformation in Monascus albidus 9901. Curr. Microbiol. 2011, 62, 501–507. [Google Scholar] [CrossRef]
  44. Liu, Q.; Xie, N.; He, Y.; Wang, L.; Shao, Y.; Zhao, H.; Chen, F. MpigE, a gene involved in pigment biosynthesis in Monascus ruber M7. Appl. Microbiol. Biotechnol. 2014, 98, 285–296. [Google Scholar] [CrossRef]
  45. Chen, G.; Bei, Q.; Huang, T.; Wu, Z. Tracking of pigment accumulation and secretion in extractive fermentation of Monascus anka GIM 3.592. Microb. Cell Fact. 2017, 16, 172. [Google Scholar] [CrossRef] [PubMed]
  46. Wang, L.; Dai, Y.; Chen, W.; Shao, Y.; Chen, F. Effects of Light Intensity and Color on the Biomass, Extracellular Red Pigment, and Citrinin Production of Monascus ruber. J. Agric. Food Chem. 2016, 64, 9506–9514. [Google Scholar] [CrossRef]
  47. Şenyuva, H.Z.; Gilbert, J.; Öztürkoǧlu, Ş. Rapid analysis of fungal cultures and dried figs for secondary metabolites by LC/TOF-MS. Anal. Chim. Acta 2008, 617, 97–106. [Google Scholar] [CrossRef]
  48. Bi, P.; Li, D.Q.; Dong, H.R. A novel technique for the separation and concentration of penicillin G from fermentation broth: Aqueous two-phase flotation. Sep. Purif. Technol. 2009, 69, 205–209. [Google Scholar] [CrossRef]
  49. Liu, J.; Zhou, Y.; Yi, T.; Zhao, M.; Xie, N.; Lei, M.; Liu, Q.; Shao, Y.; Chen, F. Identification and role analysis of an intermediate produced by a polygenic mutant of Monascus pigments cluster in Monascus ruber M7. Appl. Microbiol. Biotechnol. 2016, 100, 7037–7049. [Google Scholar] [CrossRef]
  50. Lopes, F.C.; Tichota, D.M.; Sauter, I.P.; Meira, S.M.M.; Segalin, J.; Rott, M.B.; Rios, A.O.; Brandelli, A. Active metabolites produced by Penicillium chrysogenum IFL1 growing on agro-industrial residues. Ann. Microbiol. 2013, 63, 771–778. [Google Scholar] [CrossRef]
  51. Yang, J.; Xu, X.; Liu, G. Amplification of an MFS transporter encoding gene penT significantly stimulates penicillin production and enhances the sensitivity of Penicillium chrysogenum to phenylacetic acid. J. Genet. Genomics 2012, 39, 593–602. [Google Scholar] [CrossRef]
  52. Altschul, S.F.; Wootton, J.C.; Gertz, E.M.; Agarwala, R.; Morgulis, A.; Schäffer, A.A.; Yu, Y.K. Protein database searches using compositionally adjusted substitution matrices. FEBS J. 2005, 272, 5101–5109. [Google Scholar] [CrossRef]
  53. El-Gebali, S.; Mistry, J.; Bateman, A.; Eddy, S.R.; Luciani, A.; Potter, S.C.; Qureshi, M.; Richardson, L.J.; Salazar, G.A.; Smart, A.; et al. The Pfam protein families database in 2019. Nucleic Acids Res. 2019, 47, D427–D432. [Google Scholar] [CrossRef]
  54. Waterhouse, A.; Bertoni, M.; Bienert, S.; Studer, G.; Tauriello, G.; Gumienny, R.; Heer, F.T.; De Beer, T.A.P.; Rempfer, C.; Bordoli, L.; et al. SWISS-MODEL: Homology modelling of protein structures and complexes. Nucleic Acids Res. 2018, 46, W296–W303. [Google Scholar] [CrossRef]
  55. Liu, J.; Lei, M.; Zhou, Y.; Chen, F. A comprehensive analysis of the small GTPases Ypt7 involved in the regulation of fungal development and secondary metabolism in monascus ruber M7. Front. Microbiol. 2019, 10, 452. [Google Scholar] [CrossRef] [PubMed]
  56. Aldeek, F.; Canzani, D.; Standland, M.; Crosswhite, M.R.; Hammack, W.; Gerard, G.; Cook, J.M. Identification of Penicillin G Metabolites under Various Environmental Conditions Using UHPLC-MS/MS. J. Agric. Food Chem. 2016, 64, 6100–6107. [Google Scholar] [CrossRef] [PubMed]
  57. Paulsen, I.T. Multidrug efflux pumps and resistance: Regulation and evolution. Curr. Opin. Microbiol. 2003, 6, 446–451. [Google Scholar] [CrossRef] [PubMed]
  58. Reddy, V.S.; Shlykov, M.A.; Castillo, R.; Sun, E.I.; Saier, M.H. The major facilitator superfamily (MFS) revisited. FEBS J. 2012, 279, 2022–2035. [Google Scholar] [CrossRef] [PubMed]
  59. Yan, N. Structural advances for the major facilitator superfamily (MFS) transporters. Trends Biochem. Sci. 2013, 38, 151–159. [Google Scholar] [CrossRef]
  60. Teijeira, F.; Ullán, R.V.; Fernández-Aguado, M.; Martín, J.F. CefR modulates transporters of beta-lactam intermediates preventing the loss of penicillins to the broth and increases cephalosporin production in Acremonium chrysogenum. Metab. Eng. 2011, 13, 532–543. [Google Scholar] [CrossRef] [PubMed]
  61. Yu, J.H.; Hamari, Z.; Han, K.H.; Seo, J.A.; Reyes-Domínguez, Y.; Scazzocchio, C. Double-joint PCR: A PCR-based molecular tool for gene manipulations in filamentous fungi. Fungal Genet. Biol. 2004, 41, 973–981. [Google Scholar] [CrossRef]
  62. Chang, P.K.; Yu, J.; Yu, J.H. aflT, a MFS transporter-encoding gene located in the aflatoxin gene cluster, does not have a significant role in aflatoxin secretion. Fungal Genet. Biol. 2004, 41, 911–920. [Google Scholar] [CrossRef]
  63. Weber, S.S.; Kovalchuk, A.; Bovenberg, R.A.L.; Driessen, A.J.M. The ABC transporter ABC40 encodes a phenylacetic acid export system in Penicillium chrysogenum. Fungal Genet. Biol. 2012, 49, 915–921. [Google Scholar] [CrossRef]
  64. Zhang, W.; Hunter, I.; Tham, R. Microbial and Plant Cell Synthesis of Secondary Metabolites and Strain Improvement. In Fermentation Microbiology and Biotechnology; CRC Press: Boca Raton, FL, USA, 2012. [Google Scholar]
  65. Parameswari, S.; Sivasankari, S. Execution of Enriched Rice Bran Medium in Hyper Production of Penicillin V by Penicillium chrysogenum. Waste and Biomass Valorization 2018, 9, 1559–1565. [Google Scholar] [CrossRef]
  66. Rajendran, K.; Mahadevan, S.; Jeyaprakash, R.; Paramasamy, G.; Mandal, A.B. Strategies for enhancing the production of penicillin G acylase from bacillus badius: Influence of phenyl acetic acid dosage. Appl. Biochem. Biotechnol. 2013, 171, 1328–1338. [Google Scholar] [CrossRef] [PubMed]
Figure 1. (A) Pictorial presentation for the homologous recombination approach to create facilitator superfamily transporter (mfsT) disruption strains; (B) M: Trans 2k plus II Marker; lane 1: PCR product of 5’ franking region (759 bp); lane 2: PCR product of 3’ franking (677 bp); lane 3: hph (2137 bp); lane 4: PCR product of recombinant fragment of 5’UTR, hph and 3’UTR (3573 bp); (C) lane 1: Restriction enzyme digestion analysis of vector pC-MfsT; (D) validation of mfsT homologous recombination events; lane 1, the ΔmfsT strain; lane 2, the wild-type strain (M7). Different distinct bands obtained by PCR amplification for selected pair of primer; (E) southern hybridization analysis; lane 1: Xba1 digested genomic DNA of ΔmfsT; lane 2: Xba1 digested genomic DNA of M7, respectively; M: λDNA/HindIII marker; probe 1: mfsT gene; probe 2: hph gene.
Microorganisms 07 00390 g001
Figure 2. (A) Pictorial presentation for the homologous recombination approach to create mfsT complement strains; (B) M: Trans 2k plus II Marker; lane 1: PCR product of 5’ franking region (761 bp); lane 2: PCR product of 3’ franking (2312 p); lane 3: neo (1221 bp); lane 4: PCR product of PtrpC promoter (373 bp); lane 5: mfsT complementation cassette (4667 bp); (C) lane 1: Restriction enzyme digestion analysis of vector pC-OEMfsT for complementation; (D) validation of ΔmfsT::mfsT homologous recombination events. Lane 1, ΔmfsT::mfsT; lane 2, ΔmfsT. Different distinct bands obtained by PCR amplification for selected pair of primer; (E) southern hybridization analysis; lane 1: Xba1 digested genomic DNA of ΔmfsT; lane 2: Xba1 digested genomic DNA of M7; lane 3: Xba1 digested genomic DNA of ΔmfsT::mfsT, respectively, M: λDNA/HindIII marker; probe 2: hph gene; probe 3: G418 gene.
Microorganisms 07 00390 g002
Figure 3. (A). Pictorial presentation for the homologous recombination approach to create mfsT overexpression strains; (B). M: Trans 2k plus II Marker; lane 1: PCR product of 5′ franking region (761 bp); lane 2: PCR product of 3′ franking (2312 p); lane 3: neo (1221 bp); lane 4: PCR product of PtrpC promoter (373 bp); lane 5: M7::PtrpC-mfsT cassette (4667 bp); (C). lane 1: Restriction enzyme digestion analysis of vector pC-OEMfsT; (D). validation of M7::PtrpC-mfsT homologous recombination events. Lane 1, M7::PtrpC-mfsT; lane 2, the wild-type strain (M7). Different distinct bands obtained by PCR amplification for selected pair of primer; (E). southern hybridization analysis; lane 1: Xba1 digested genomic DNA of M7::PtrpC-mfsT; lane 2: Xba1 digested genomic DNA of M7, respectively, M: λDNA/HindIII marker; probe 1: mfsT gene; probe 3: G418 gene.
Microorganisms 07 00390 g003
Figure 4. RT-PCR analysis of the mfsT gene in the M. ruber M7, ΔmfsT, ΔmfsT::mfsT, and M7::PtrpC-mfsT. The relative expression 3rd–13th day in M. ruber M7, ΔmfsT, ΔmfsT::mfsT, and M7::PtrpC-mfsT strains for the mfsT gene.
Microorganisms 07 00390 g004
Figure 5. Morphological comparison of M. ruber M7, ΔmfsT, ΔmfsT::mfsT, and M7::PtrpC-mfsT. (A) Colony morphology of M. ruber M7, ΔmfsT, ΔmfsT::mfsT, and M7::PtrpC-mfsT on PDA, CYA, G25N, MA plates and cultured at 28 °C for 15 days. (B) Cleistothecia and conidia development in M. ruber M7, ΔmfsT, ΔmfsT::mfsT, and M7::PtrpC-mfsT inoculated on PDA, CYA, G25N, MA plates and cultured at 28 °C for 8 days.
Microorganisms 07 00390 g005
Figure 6. Comparison of biomass (dry cell weight) of the M. ruber M7, ΔmfsT, ΔmfsT::mfsT, and M7::PtrpC-mfsT against pathway side chain and amino acid. (A) PDB medium without amino acid (control); (B) PDB medium with D-valine; (C) PDB medium with phenylacetic acid; (D) PDB medium with L-cysteine, at 2 mM concentrations and incubated at 28 °C without agitation. The bar representing the mean of triplicate values and error bars show standard deviation.
Microorganisms 07 00390 g006
Figure 7. Comparative analysis for the pigments in M. ruber M7, ΔmfsT, ΔmfsT::mfsT, and M7::PtrpC-mfsT against pathway side chain and amino acid. (A) PDB medium without amino acid (control); (B) PDB medium with D-valine; (C) PDB medium with phenylacetic acid; (D) PDB medium with L-cysteine, at 2 mM concentrations and incubated at 28 °C without agitation. (Mean ± sd).
Microorganisms 07 00390 g007
Figure 8. Comparison of PG concentration of the wild-type strain and the mfsT transformants at the 7th day. (A) PG concentration in mycelium and medium; (B) comparison of PG concentration affected by supplementation of D-valine, phenylacetic acid, L-cysteine at 2 mM. The bar representing the mean of triplicate values and error bars show standard deviation.
Microorganisms 07 00390 g008
Figure 9. Comparison of eluted products of M. ruber M7, ΔmfsT, ΔmfsT::mfsT, and M7::PtrpC-mfsT for solid state fermentation on rice. (A) Metabolic profile of M. ruber M7; (B) metabolic profile of ΔmfsT; (C) metabolic profile of ΔmfsT::mfsT; (D) metabolic profile of M7::PtrpC-mfsT at 250 nm. (E) UV-Vis spectrum of benzylpenicillin (PG).
Microorganisms 07 00390 g009
Figure 10. Morphological comparison of M. ruber M7, ΔmfsT, ΔmfsT::mfsT, and M7::PtrpC-mfsT to evaluate the sensitivity towards pathway amino acid supplementation. (A) Colony morphology of M. ruber M7, ΔmfsT, ΔmfsT::mfsT, and M7::PtrpC-mfsT inoculated on PDA plates which supplemented with D-valine, phenylacetic acid, L-cysteine at 2 mM concentrations for each and cultured at 28 °C for 15 days; (B). cleistothecia and conidia development in M. ruber M7, ΔmfsT, ΔmfsT::mfsT, and M7::PtrpC-mfsT cultured on PDA plates which supplemented with D-valine, phenylacetic acid, L-cysteine at 2 mM concentrations for each and cultured at 28 °C for 8 days.
Microorganisms 07 00390 g010
Figure 11. UPLC-MS/MS ([M-H]) spectrogram of the M. ruber M7, ΔmfsT, ΔmfsT::mfsT, and M7::PtrpC-mfsT for solid state fermented on rice displays that the atomic mass of [M-H] ion (m/z 335.336) matched well with the standard penicillin. The molecular weight for isopenicillin N is 359.3 g/mol, in spectrogram [M-H] ion m/z 359.00 representing the isopenicillin N peak. (A) Spectra in: A penicillin G (PG) standard with the mass 335.336; (B) a pattern of fragmentation of M. ruber M7; (C) a pattern of fragmentation of ΔmfsT; (D) a pattern of fragmentation of ΔmfsT::mfsT; (E) a pattern of fragmentation of M7::PtrpC-mfsT.
Microorganisms 07 00390 g011
Table 1. Primers used for experimentation.
NameSequence 5′⟶3′Description
MfsT5FGCTCTAGAAGTCCGAGCGCTGCAGCFor the amplification of the 759 bp of the 5′ flanking region of the mfsT gene
MfsT5RCAATATCATCTTCTGTCGACTCGGTCTCGCGTGCTTG
MfsT3FGAGGTAATCCTTCTTTCTAGTTACCCATCAAGGCAGGCFor the amplification of the 677 bp of the 3′ flanking region of the mfsT gene
MfsT3RGGGGTACCCCGGAAAGCAGAAGACCA
hphFGTCGACAGAAGATGATATTGFor the amplification of the 2317 bp of the hph cassette from the plasmid pSKH
hphRCTAGAAAGAAGGATTACCTC
MfsTFGCCCTGTGTGTATTGCTCFor the amplification of the 700 bp of the partial mfsT gene which was used as probe 1
MfsTRGTAACCACGGTCCATGAG
MfsT5F′GCTCTAGATGGCTGGTGCTGAGGGTAGFor the amplification of the 761 bp of the 5′ flanking region for overexpression and complementation of the mfsT gene
MfsT5R′CAATATCATCTTCTGTCGACTAGGGCTAAGGGCAAGGGC
PtrpCFGTCGACAGAAGATGATATTGFor the amplification of the 373 bp of the trpC promoter from the plasmid pSKH
PtrpCRGGTTCGGTTCGCATATCGATGCTTGGGTAGAATA
G418FCCAACTCAACCCCATCGAACCGTAACCFor the amplification of the 1221 bp of the neo cassette from the plasmid pKN1
G418RACGATGCTGGACGGGGACATCATCATGCAACATGCATG
MfsT3F′GTCCCCGTCCAGCATCGTFor the amplification of the 2312 bp of the 3′ flanking region + ORF for overexpression and complementation of the mfsT gene
MfsT3R′GGGGTACCAGCGGCTGGGTAGAGTCC
GAPDHFCTATGCGTGTGCCTACTTCCAFor the real-time RT-PCR analysis of gpd
GAPDHRGAGTTGAGGGCGATACCAGC
MfsTFTCGTGCTCTCCTTGGGCTTCFor the real-time RT-PCR analysis of mfsT
MfsTRTGACGAGAGAGCGGATGAGATT
Table 2. Significative homologous alignment of MfsT protein with other fungi.
Protein NumberStrainFunctionPositive Amino Acid (%)
XP_001270324.1Aspergillus clavatus NRRL 1MFS transporter putative83
RDW58813.1Coleophoma cylindrosporaMFS transporter-1074
GAD96209.1Byssochlamys spectabilis No. 5MFS transporter putative57
XP_016598554.1Penicillium expansumMajor facilitator superfamily domain, general substrate transporter54
KGO74874.1Penicillium italicumMajor facilitator superfamily domain, general substrate transporter53
XP_014538707.1Penicillium digitatum Pd1MFS multidrug transporter, putative55
KZN94365.1Penicillium chrysogenumProton-coupled folate transporter53
KXG49310.1Penicillium griseofulvumMajor facilitator superfamily domain, general substrate transporter52
KFH48645.1Acremonium chrysogenumPutative transporter like protein52
PCG89412.1Penicillium sp. ‘occitanis’Major facilitator superfamily domain, general substrate transporter51