Article

Probiotic-Induced Gut Microbiota Modulation: A Comparative Analysis Using 16S rRNA V3–V4 and Targeted Sequencing


1
Department of Biomedical Laboratory Science, Graduate School, Eulji University, Uijeongbu 11759, Republic of Korea
2
Department of Internal Medicine, Yeouido St. Mary’s Hospital, The Catholic University of Korea, Seoul 07345, Republic of Korea
3
Department of Gastroenterology, Daejeon Eulji University Hospital, Eulji University, Daejeon 35233, Republic of Korea
4
Department of Senior Healthcare, Graduate School, Eulji University, Uijeongbu 11759, Republic of Korea
5
Department of Mortuary Science, College of Bio-Convergence, Eulji University, Seongnam 13135, Republic of Korea
*
Authors to whom correspondence should be addressed.
Microorganisms 2026, 14(5), 1035; https://doi.org/10.3390/microorganisms14051035
Submission received: 6 April 2026 / Revised: 23 April 2026 / Accepted: 24 April 2026 / Published: 1 May 2026
(This article belongs to the Collection Feature Papers in Gut Microbiota Research)

Abstract

Standard 16S rRNA V3–V4 sequencing encounters primer mismatch issues and insufficient taxonomic resolution, hindering the accurate quantification of specific, low-abundance taxa, such as administered probiotic strains. Therefore, we empirically compared outcomes between the standard V3–V4 method and high-resolution targeted species sequencing (TSS) to assess bias and establish reliability metrics for probiotic efficacy assessments. A longitudinal pilot study was conducted over nine weeks in older participants receiving synbiotic supplementation; their fecal samples were collected and analyzed. V3–V4 analysis successfully captured a significant transient reduction in alpha-diversity with multidirectional genus-level fluctuations. However, taxonomic overlap between these two methods was high at the phylum level and sharply declined to 6.7% at the species level. Notably, compared with V3–V4 sequencing, TSS could successfully quantify the abundance of administered Bifidobacterium animalis. This study empirically demonstrated that 16S rRNA V3–V4 sequencing introduces substantial quantitative bias, limiting its suitability for monitoring specific probiotic strains and compromising the reliability of clinical efficacy assessments. Therefore, we recommend a dual-sequencing framework that integrates the broad ecological screening capabilities of V3–V4 with the precise species-level quantification of TSS to establish the necessary scientific rigor for assessing probiotic efficacy.

1. Introduction

The gut microbiota is a important factor in host health [1], and disruptions in its diversity (dysbiosis) during aging strongly correlates with conditions such as inflammation and functional decline [2,3]. This dysbiosis is associated with altered immune responses that can lead to various disease states [4]. Probiotic intervention, which involves the administration of beneficial live microorganisms, is a key strategy used for restoring microbial balance and alleviate age-related symptoms [5,6,7,8]. Therefore, accurately monitoring the fate and ecological impact of these probiotic strains within the complex microbial community of the host is essential for validating their efficacy [9].
Traditionally, microbial community profiling has heavily relied on 16S rRNA gene sequencing of specific hypervariable regions, such as the V3–V4 region [10,11]. Although this method is cost-effective and efficient for characterizing the overall community structure across large cohorts, it lacks sufficient species-level discriminatory power owing to the high sequence homology across bacterial taxa [10,12]. This presents significant challenges for evaluating targeted interventions, such as probiotics, specifically including primer mismatch-induced amplification bias and inadequate taxonomic resolution, which hinder the accurate quantification of specific, low-abundance yet functionally crucial taxa (including administered probiotic species) [13,14,15]. Indeed, in our V3–V4 analysis of older adults following probiotic intake, we observed complex, multidirectional remodeling of the gut ecosystem, characterized by both decreases and compensatory increases in functional taxa (e.g., Faecalibacterium and Blautia). These heterogeneous and sometimes conflicting community-level shifts highlight the limitations of relying solely on a single, broad-spectrum sequencing method to elucidate the precise mechanisms underlying probiotic action [16].
To overcome the well-recognized limitations in species-level resolution and quantification bias inherent in 16S rRNA V3–V4 sequencing, a high-resolution, strain-specific approach is required [12,17]. Targeted species sequencing (TSS), which employs species-specific primers that span multiple hypervariable regions, provides markedly improved accuracy for detecting and quantifying low-abundance bacterial strains [16,18,19].
Therefore, the aim of this study was to directly and empirically compare the outcomes of two distinct microbiome profiling methodologies: standard 16S rRNA V3–V4 sequencing and the high-resolution TS approach. By performing a comparative analysis of fecal samples collected during synbiotic intervention in older adults, this study aimed to precisely identify and quantify discrepancies between the two sequencing platforms. This comparison is critical for determining whether the V3–V4 method misrepresents or fails to detect key functional taxa (including the administered probiotic species) and for establishing the need for a dual-sequencing framework to achieve accurate and sensitive evaluations of probiotic efficacy in future clinical studies.

2. Materials and Methods

2.1. Study Design and Sample Collection

This study was conducted with a cohort of 20 middle-aged to older individuals (aged 60–70 years), predominantly female (85%), who were recruited from a community institution in Seongnam, Republic of Korea (Table 1). Participants were confirmed free of specific underlying diseases. The study spanned nine weeks and used a time-series design across three defined time points: time points 1 (T1; week 3), 2 (T2; week 6), and 3 (T3; week 9). The initial three weeks served as the run-in period. The intervention period was defined as the three weeks occurring between T1 and T2, during which participants received the commercial synbiotic supplement daily. The Control group received no synbiotic intervention. Specifically, the Control group consisted of four individuals who consumed the same beverage that the treatment group did but received a placebo (a drink without the bacterial strain). Participants were assigned to the Control and Treatment groups via simple random assignment. The subsequent 3-week period (T2–T3) served as the control washout period. Sixty fecal samples (n = 20 individuals × 3 time points) were collected for microbial analysis. This study was approved by the Eulji University Internal Review Board (IRB No. EUIRB 2021-008), and written informed consent obtained from all participants prior to the study.
The participants were issued sterile collection containers and instructed to collect a minimum of 10 g fresh stool immediately before their visit. Stool samples were stored at 4 °C in a domestic refrigerator before delivery. Upon arrival at the laboratory, the samples were kept at 4 °C, and DNA extraction initiated within 2 h of receipt.

2.2. Intake Supplements

The intervention used a commercially available synbiotic formulation (MPRO3; hy Co., Ltd., Yongin-si, Gyeonggi-do, Republic of Korea). The daily dose provided a total bacterial count of 10 × 109 colony-forming units (CFUs) delivered in a composite package that included two capsules (130 mg/capsule) and 130 mL of a liquid solution, with the capsule and liquid components designed in a respective 1:2 ratio. The precise probiotic composition consisted of three distinct strains: Bifidobacterium animalis subsp. lactis HY8002 (5.0 × 10⁹ CFU), Lactobacillus casei HY2782 (2.5 × 10⁹ CFU), and L. plantarum HY7712 (2.5 × 10⁹ CFU). The 130 mL solution served as the prebiotic component, containing various forms of dietary fiber (including polydextrose, chicory dietary fiber, lactulose, and wheat dietary fiber) and several functional oligosaccharides (such as fructooligosaccharides, isomaltooligosaccharides, and xylooligosaccharides).

2.3. DNA Extraction and PCR Amplification

Genomic DNA was extracted from fecal samples using the QIAamp PowerFecal Pro DNA Kit (Qiagen, Hilden, Germany), following the manufacturer’s protocol. The process commenced by accurately measuring a 250 mg aliquot of the fecal material and transferring it into a dry bead tube provided by the kit. Subsequently, 800 L C1 Lysis Solution was added, and the mixture mechanically vortexed for 10 min. Following agitation and centrifugation, the supernatant was carefully separated, 200 L CD2 solution added, and the sample processed further. The recovered supernatant, excluding the residual pellet, was then mixed with 600 L CD3 solution. This mixture was loaded onto the spin column in two sequential applications (650 L each), separated by centrifugation steps. The column was washed with 500 L EA and 500 L C5 solutions, each followed by centrifugation. The purified DNA was eluted by applying 65 L C6 elution solution, whereafter the sample was centrifuged and the final solution collected. All extracted DNA samples were stored at −80 °C until library preparation and sequencing were initiated.

2.4. 16S rRNA Amplicon and Targeted Species Sequencing

The extracted DNA served as the template for PCR amplification targeting the V3–V4 hypervariable region of bacterial 16S rRNA genes. Amplification employed the following universal primers: 341F (5′-CCTACGGGNGGCWGCAG-3′), which contained a sample-specific 6–8 bp tag sequence, and 805R (5′-GACTACHGGGTATCTAATCC-3′). PCR was performed using the Platinum PCR SuperMix High Fidelity system (Thermo Fisher Scientific, Waltham, MA, USA). Each 27 µL final reaction volume contained 2.5 ng template DNA and primers at a final concentration of 50 nM. The thermal cycling protocol was structured as follows: initial denaturation at 94 °C for 3 min, followed by 30 cycles of denaturation at 94 °C for 30 s, annealing at 50 °C for 30 s, and extension at 72 °C for 30 s. The resulting amplicon libraries were further purified using the Agencourt AMPure XP DNA Purification Kit (Beckman Coulter, Brea, CA, USA) to eliminate residual primer dimers and other contaminants, following the manufacturer’s instructions. The purified samples were eluted in 15 µL low-EDTA Tris-EDTA buffer.
DNA concentration, purity, and amplicon library concentrations were precisely measured using the dsDNA HS (High Sensitivity) Assay Kit on a Qubit 4 Fluorometer (Thermo Fisher Scientific). Fragment size distribution and overall quality of the pooled DNA libraries were subsequently verified using the Agilent 2100 Bioanalyzer system (Agilent Technologies, Palo Alto, CA, USA). The enriched libraries were loaded onto an Ion 530 Chip Kit (Thermo Fisher Scientific). Sequencing was then performed using the Ion GeneStudio S5 next-generation sequencing system (Thermo Fisher Scientific) to generate paired-end reads, following the standard operational procedures of the platform.
TSS was performed using an Ion AmpliSeq technology-based assay to ensure accurate species-level resolution (Ion AmpliSeq Microbiome Health Research Kit, Thermo Fisher Scientific). This assay incorporates a comprehensive 16S design covering eight hypervariable regions, along with highly species-specific primers targeting 73 bacterial species (Supplementary Data S1), including the administered probiotic strains. The TSS method has been validated to provide 100% sensitivity and specificity at the species level, demonstrating superior quantitative accuracy (Spearman’s rho: 0.90–0.99) compared with that of standard 16S methods.

2.5. Data Processing

Raw 16S rRNA sequence data, provided in FASTQ format, were initially generated and managed using Torrent Suite Software (v.5.14.1.1; Thermo Fisher Scientific). Amplicon sequence variant (ASV) inference and downstream bioinformatics processing were primarily conducted using the Quantitative Insights into Microbial Ecology (QIIME 2 v.2.0) software environment following the DADA2 pipeline. A total of 1,211,742 raw read counts were acquired across all samples, with an average of 4627 counts/sample. Prior to ASV inference, sequences underwent quality filtering and trimming based on the sample origin due to varying read quality profiles: sequences were truncated to 418 bp, and the initial 47 bp containing low-quality data removed. Chimeric sequences were also addressed at the beginning of each read. The assembled reads were subsequently demultiplexed and processed through the DADA2 pipeline using default parameters. Taxonomic identification of the resulting ASVs was performed using the EzBio-classifier database. For comparative analysis, clusters were generated based on a 97% sequence similarity threshold, with a focus on downstream analysis centered on the genus level of classification. Reads generated via the TS assay were separately processed using the dedicated Ion Reporter solution workflow, which leveraged species-specific primer information for accurate taxonomic classification down to the species level.

2.6. Statistical Analysis

The generated ASVs were used as inputs for microbial diversity assessments (alpha- and beta-diversity) conducted within the QIIME 2 framework. To evaluate the alpha-diversity within sample communities, standardized metrics, including taxonomic richness (observed features), were calculated after the samples had been rarefied to an equal sequencing depth. Differences in alpha-diversity between comparison groups were statistically assessed using the nonparametric Mann–Whitney U test. For beta-diversity assessment, the unweighted UniFrac distance metric was employed to quantify the phylogenetic dissimilarity in bacterial community structure among samples, with differences in community structure between groups analyzed for statistical significance using the Analysis of Similarities (ANOSIM) test. Furthermore, to compare the abundance profiles and highlight taxonomic distinctions between microbial communities, a tree analysis approach was used. This method leveraged the hierarchical structure of taxonomic classification, incorporating both quantitative metrics (based on median abundance) and statistical evaluations (using the nonparametric Wilcoxon rank-sum test). A focused analysis of variance (ANOVA) with Bonferroni post hoc analysis was performed to assess quantitative agreement between the two platforms. All statistical analyses were supplemented and visualized using GraphPad Prism (v.9.3.0; GraphPad Software, Boston, MA, USA) and SPSS Statistics (v.20.0; IBM, Armonk, NY, USA), with differences considered statistically significant at p-values < 0.05.

3. Results

3.1. 16S rRNA V3–V4 Sequencing Analysis of the Gut Microbiota

3.1.1. Overall Community Composition and Relative Abundance

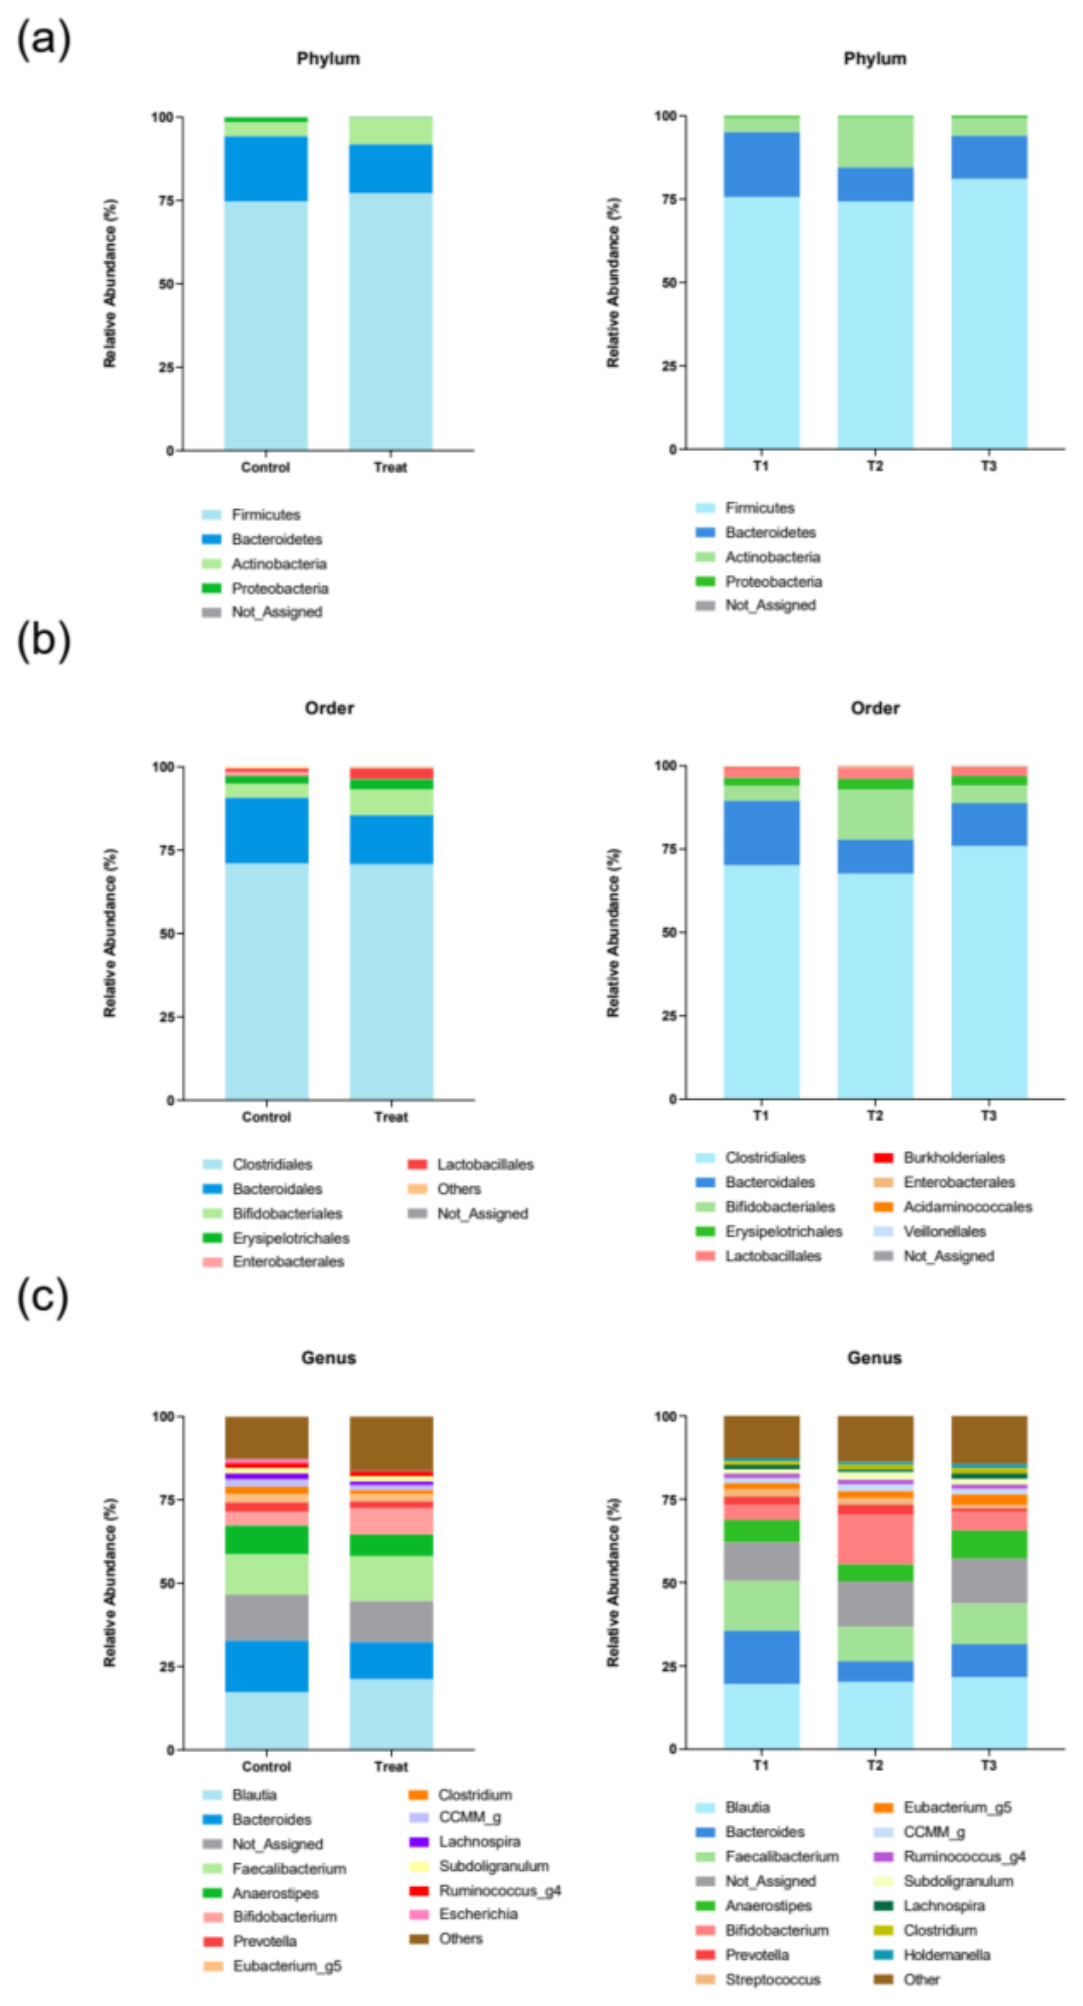
Microbial community analysis based on 16S rRNA V3–V4 sequencing revealed the overall compositional gut microbiota profile of the study participants (Figure 1). The mean relative abundance profiles for the Control (no synbiotic intervention) and Treatment groups were largely similar, suggesting no significant baseline compositional differences in the major phyla detected.
The microbial community was primarily dominated by Firmicutes and Bacteroidetes, both accounting for approximately 90% of the total relative abundance observed across all time points. At baseline (T1), the abundance of Firmicutes was 75.6% and that of Bacteroidetes 19.4%. The phylum Actinobacteria exhibited the most significant fluctuation over time; its abundance increased from 4.3% at T1 to a peak of 15.0% at T2 (end of the intervention) before decreasing to 5.4% at T3. Conversely, Bacteroidetes abundance decreased from 19.4% at T1 to 10.2% at T2. Firmicutes abundance remained relatively stable between T1 (75.6%) and T2 (74.1%) but increased to 81.0% at T3 (Figure 1a). At the order level, Clostridiales (under Firmicutes) abundance slightly decreased from 70.0% (T1) to 67.6% (T2) before increasing to 75.8% (T3). Consistent with the phylum-level changes observed, Bifidobacteriales (under Actinobacteria) abundance dramatically increased from 4.3% at T1 to 15.0% at T2, while that of Bacteroidales simultaneously decreased from 19.4% to 10.2% over the same period (Figure 1b). Genus-level analysis corroborated the dynamics observed at higher taxonomic levels (Figure 1c). The genus of the administered probiotic strain, Bifidobacterium, showed the most pronounced temporal change, significantly increasing from 4.36% at T1 to 15.01% at T2 (nearly 3.4-fold increase) before dropping to 5.41% at T3. Concurrently, the relative abundances of two major short-chain fatty acid (SCFA)-producing genera decreased at T2: Bacteroides decreased from 15.98% (T1) to 6.23% (T2) and Faecalibacterium decreased from 14.97% (T1) to 10.32% (T2). Conversely, Blautia maintained a stable, high abundance, slightly increasing from 19.52% at T1 to 20.16% at T2 and 21.56% at T3.

3.1.2. Alpha- and Beta-Diversity Assessments

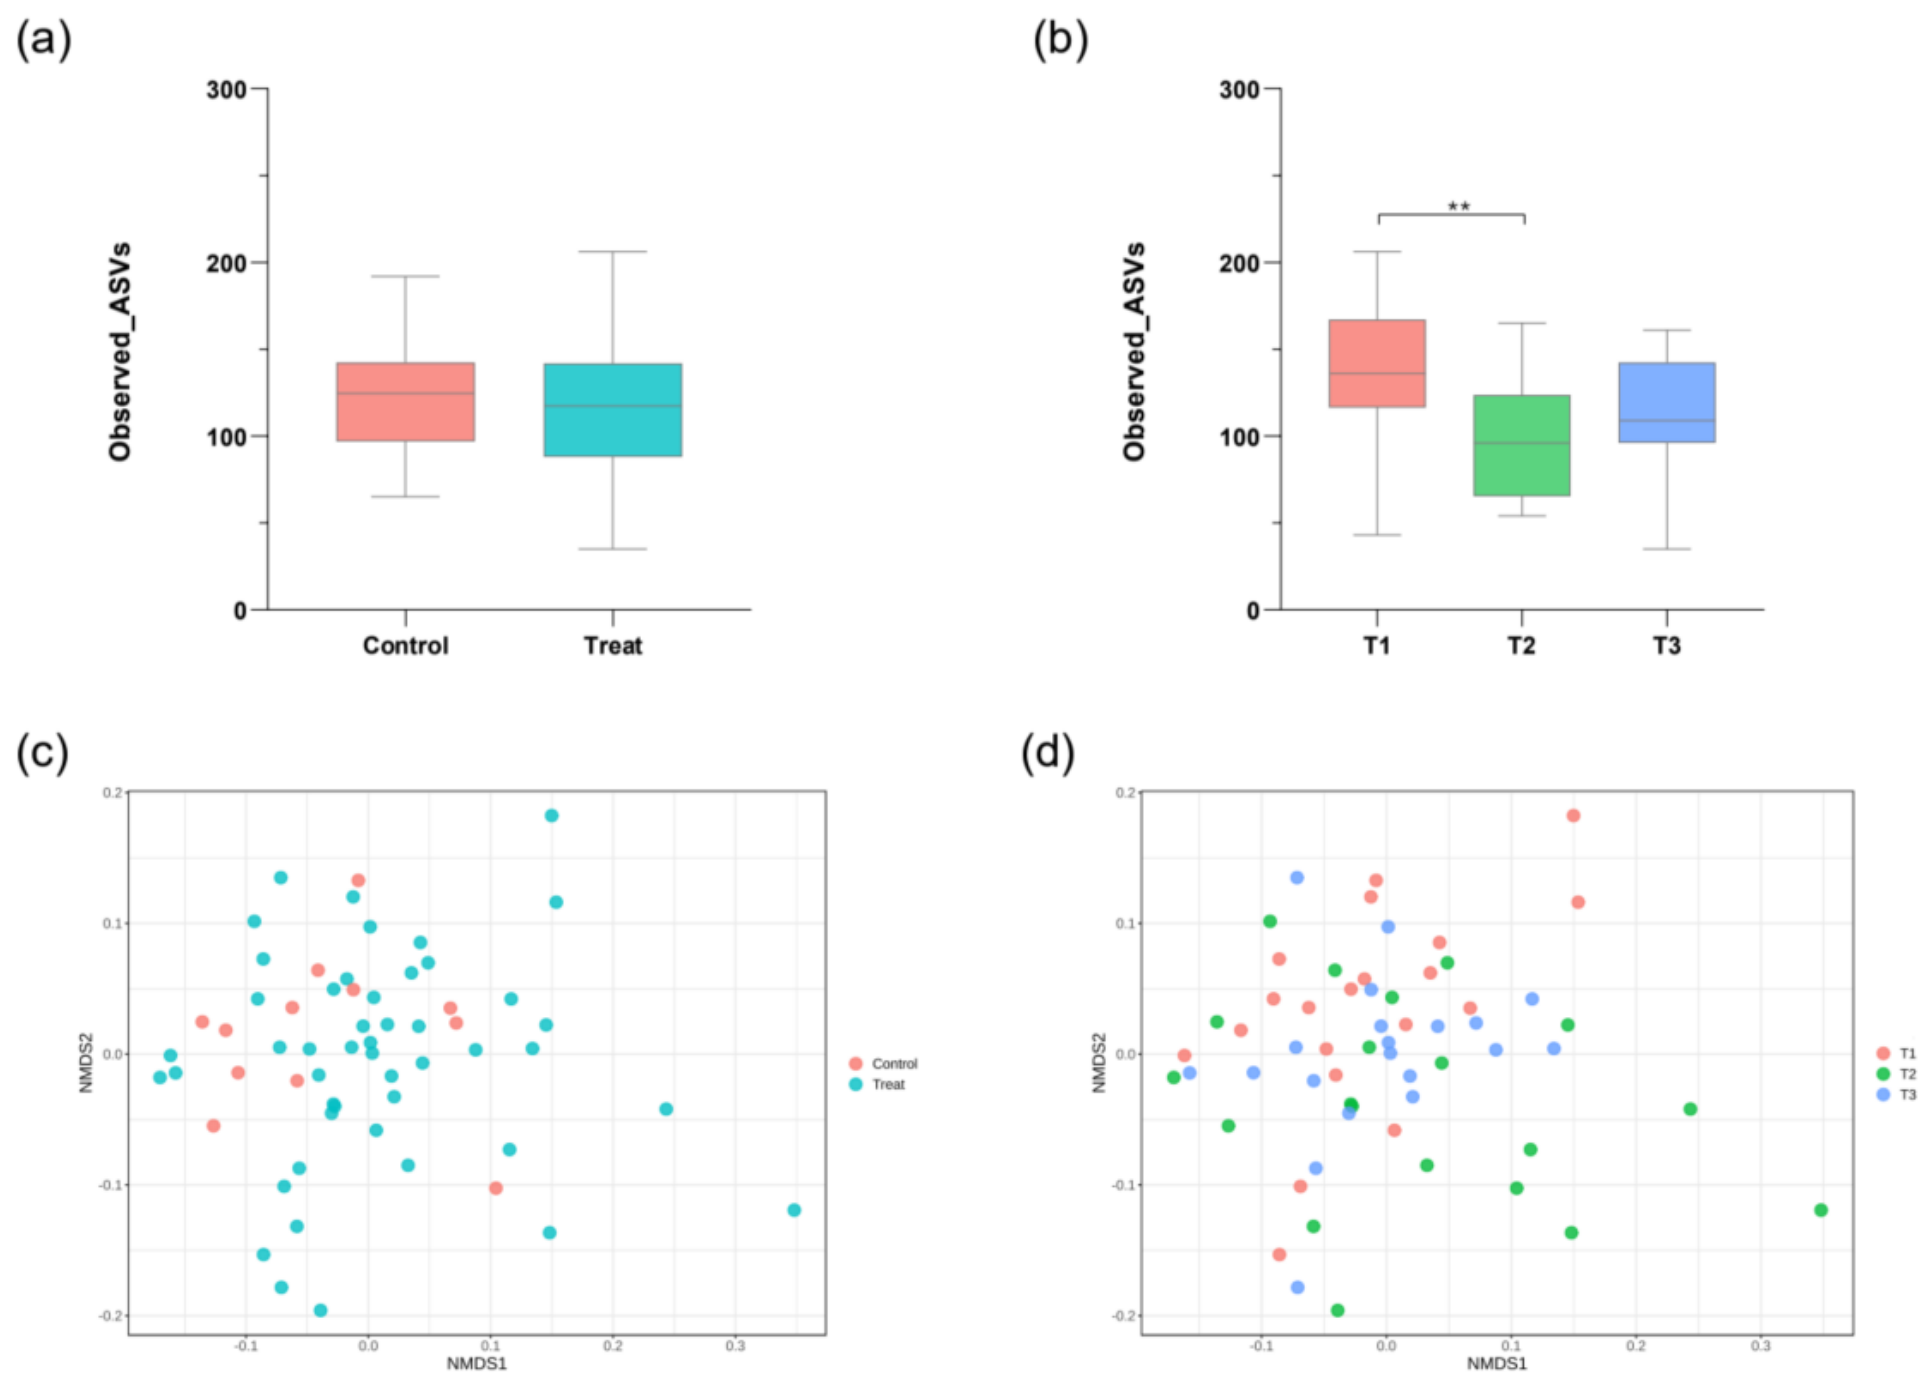
Taxonomic richness, quantified using the Observed ASVs metric, was assessed across both general treatment groups and at specific time points (Figure 2a,b). No statistically significant differences in alpha-diversity between the general Control and Treatment groups were observed. However, analysis across time points revealed significant changes: alpha-diversity decreased during the intervention period, with the difference between T1 (baseline) and T2 (end of intervention) being statistically significant (p = 0.013; Kruskal–Wallis test). No other significant pairwise differences were observed.
Community structural differences were evaluated using the Weighted UniFrac distance metric and visualized via nonmetric multidimensional scaling (NMDS) plots (Figure 2c,d). Comparisons between the Control and Treatment groups showed that the overall microbial community structures were not significantly separated (ANOSIM test: R = −0.55515, p = 0.706). In contrast, community structures assessed across the three time points within the Treatment group showed a statistically significant separation (ANOSIM test: R = 0.062287, p = 0.009). Despite this statistical significance, the NMDS plots demonstrated high inter-individual variability, with extensive overlap observed among the T1–T3 sample distributions.

3.1.3. Complex and Unresolved Taxonomic Dynamics

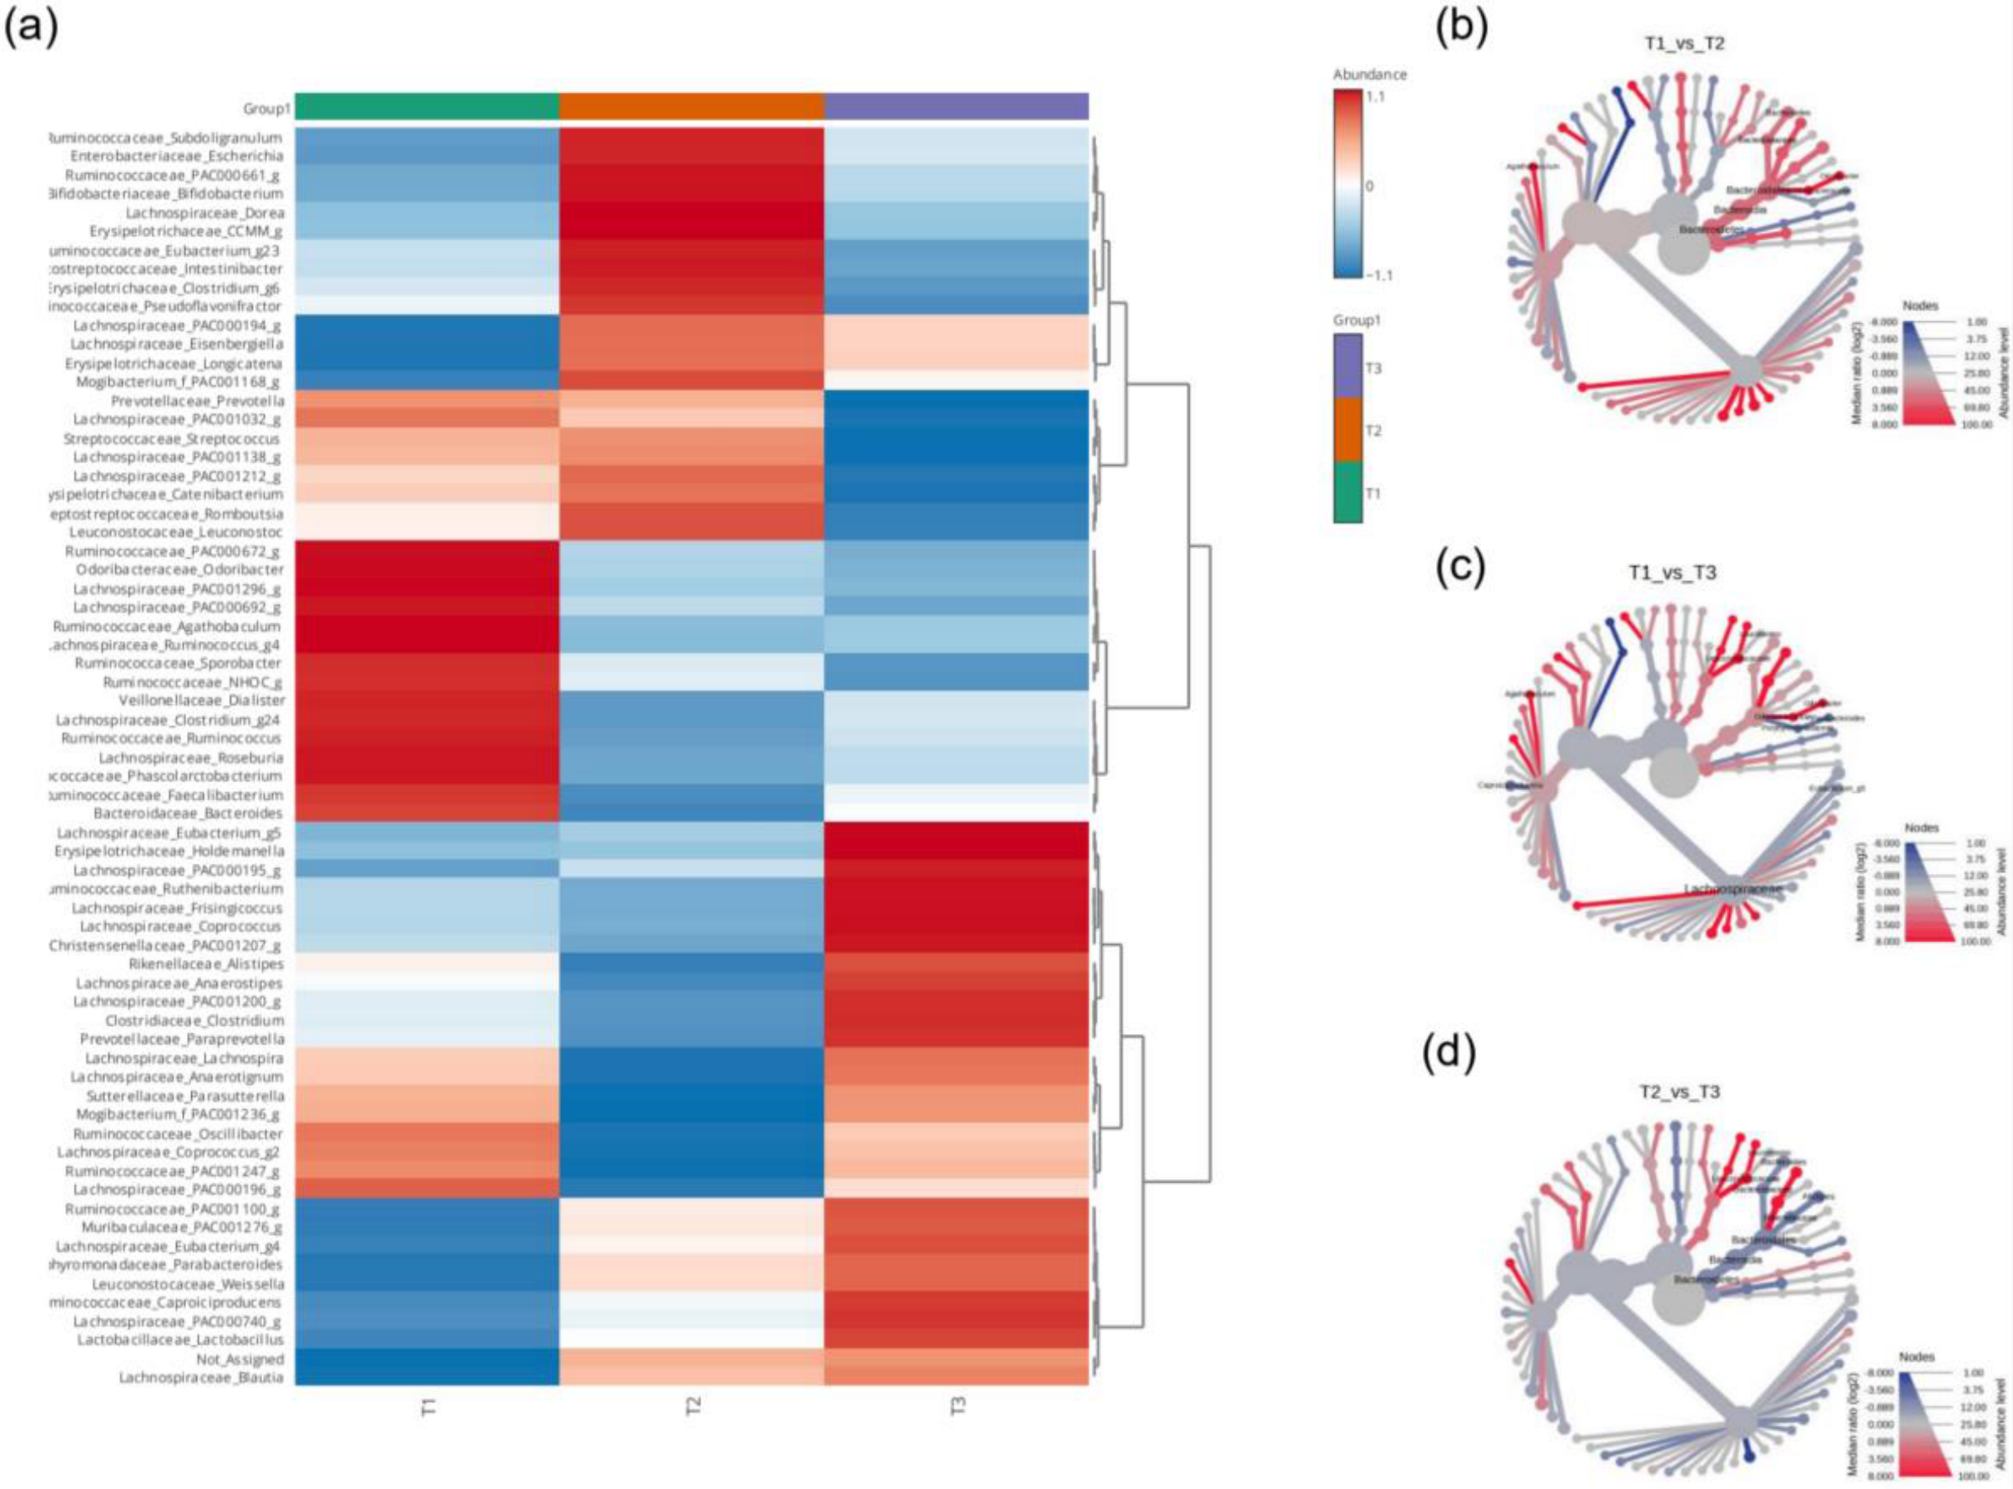
The 16S rRNA V3–V4 sequencing analysis captured complex and multidirectional fluctuations in gut microbiota at the genus level following probiotic administration. The hierarchical clustering heatmap (Figure 3a) demonstrated distinct genus-relative abundance patterns at T2 compared with those at T1 and T3, suggesting a broad ecological reorganization. ANOVA and Bonferroni post hoc results (p < 0.05) confirmed statistically significant abundance changes in at least nine major functional taxa across the measured time points. For example, significant shifts were observed in Bacteroides (p = 0.001), Roseburia (p = 0.004), and Odoribacter (p = 0.005) during the T1 vs. T2 comparison. The heat tree plots (Figure 3b–d), based on the Wilcoxon rank-sum test, further validated these hierarchical changes; the abundances of Bacteroides (p = 0.001593) and Bacteroidales (p = 0.008712) significantly decreased between T1 and T2, indicating a significant competitive response from the Bacteroidetes phylum. Furthermore, V3–V4-based functional prediction analysis revealed significant fluctuations in the Kyoto Encyclopedia of Genes and Genomes pathways between T1 and T2 (Table 2). Notably, the predicted abundance of the butanoate metabolism pathway significantly increased from 0.0884 at T1 to 0.4658 at T2 (p = 0.0172), suggesting a potential enhancement in SCFA production capability during the intervention period. Conversely, abundance of the ko00604 glycosphingolipid biosynthesis pathway significantly decreased from 0.0566 at T1 to 0.0404 at T2 (p = 0.0063), and that of riboflavin metabolism decreased from 0.3653 to 0.3026 (p = 0.0035). While the V3–V4 data successfully captured this broad complexity and functional perturbation, inherent limitations of the method at the species level precludes objective quantitative validation of whether the observed increase in butanoate metabolism and taxonomic shifts were directly driven by successful colonization of the administered probiotic strain. To overcome this fundamental limitation of V3–V4 sequencing data and accurately verify the fate of the probiotic strain, we performed high-resolution TSS analysis, as described in Section 3.2.

3.2. Empirical Validation of Sequencing Discrepancy and Species Fidelity

A critical comparative analysis between the 16S V3–V4 method and high-resolution TSS approach was performed to directly address limitations of the taxonomic resolution and quantification bias of V3–V4 (Figure 4). TSS analysis utilized a custom assay designed to target 73 specific bacterial species, thus providing the necessary fidelity to accurately track the administered probiotic strain. Detailed sequencing summaries, including total reads and total valid mapped reads obtained via the high-resolution TSS approach, are presented in Supplementary Data S2, along with a summary of the study subjects’ surveys.

3.2.1. Taxonomic Resolution and Overlap Disparity

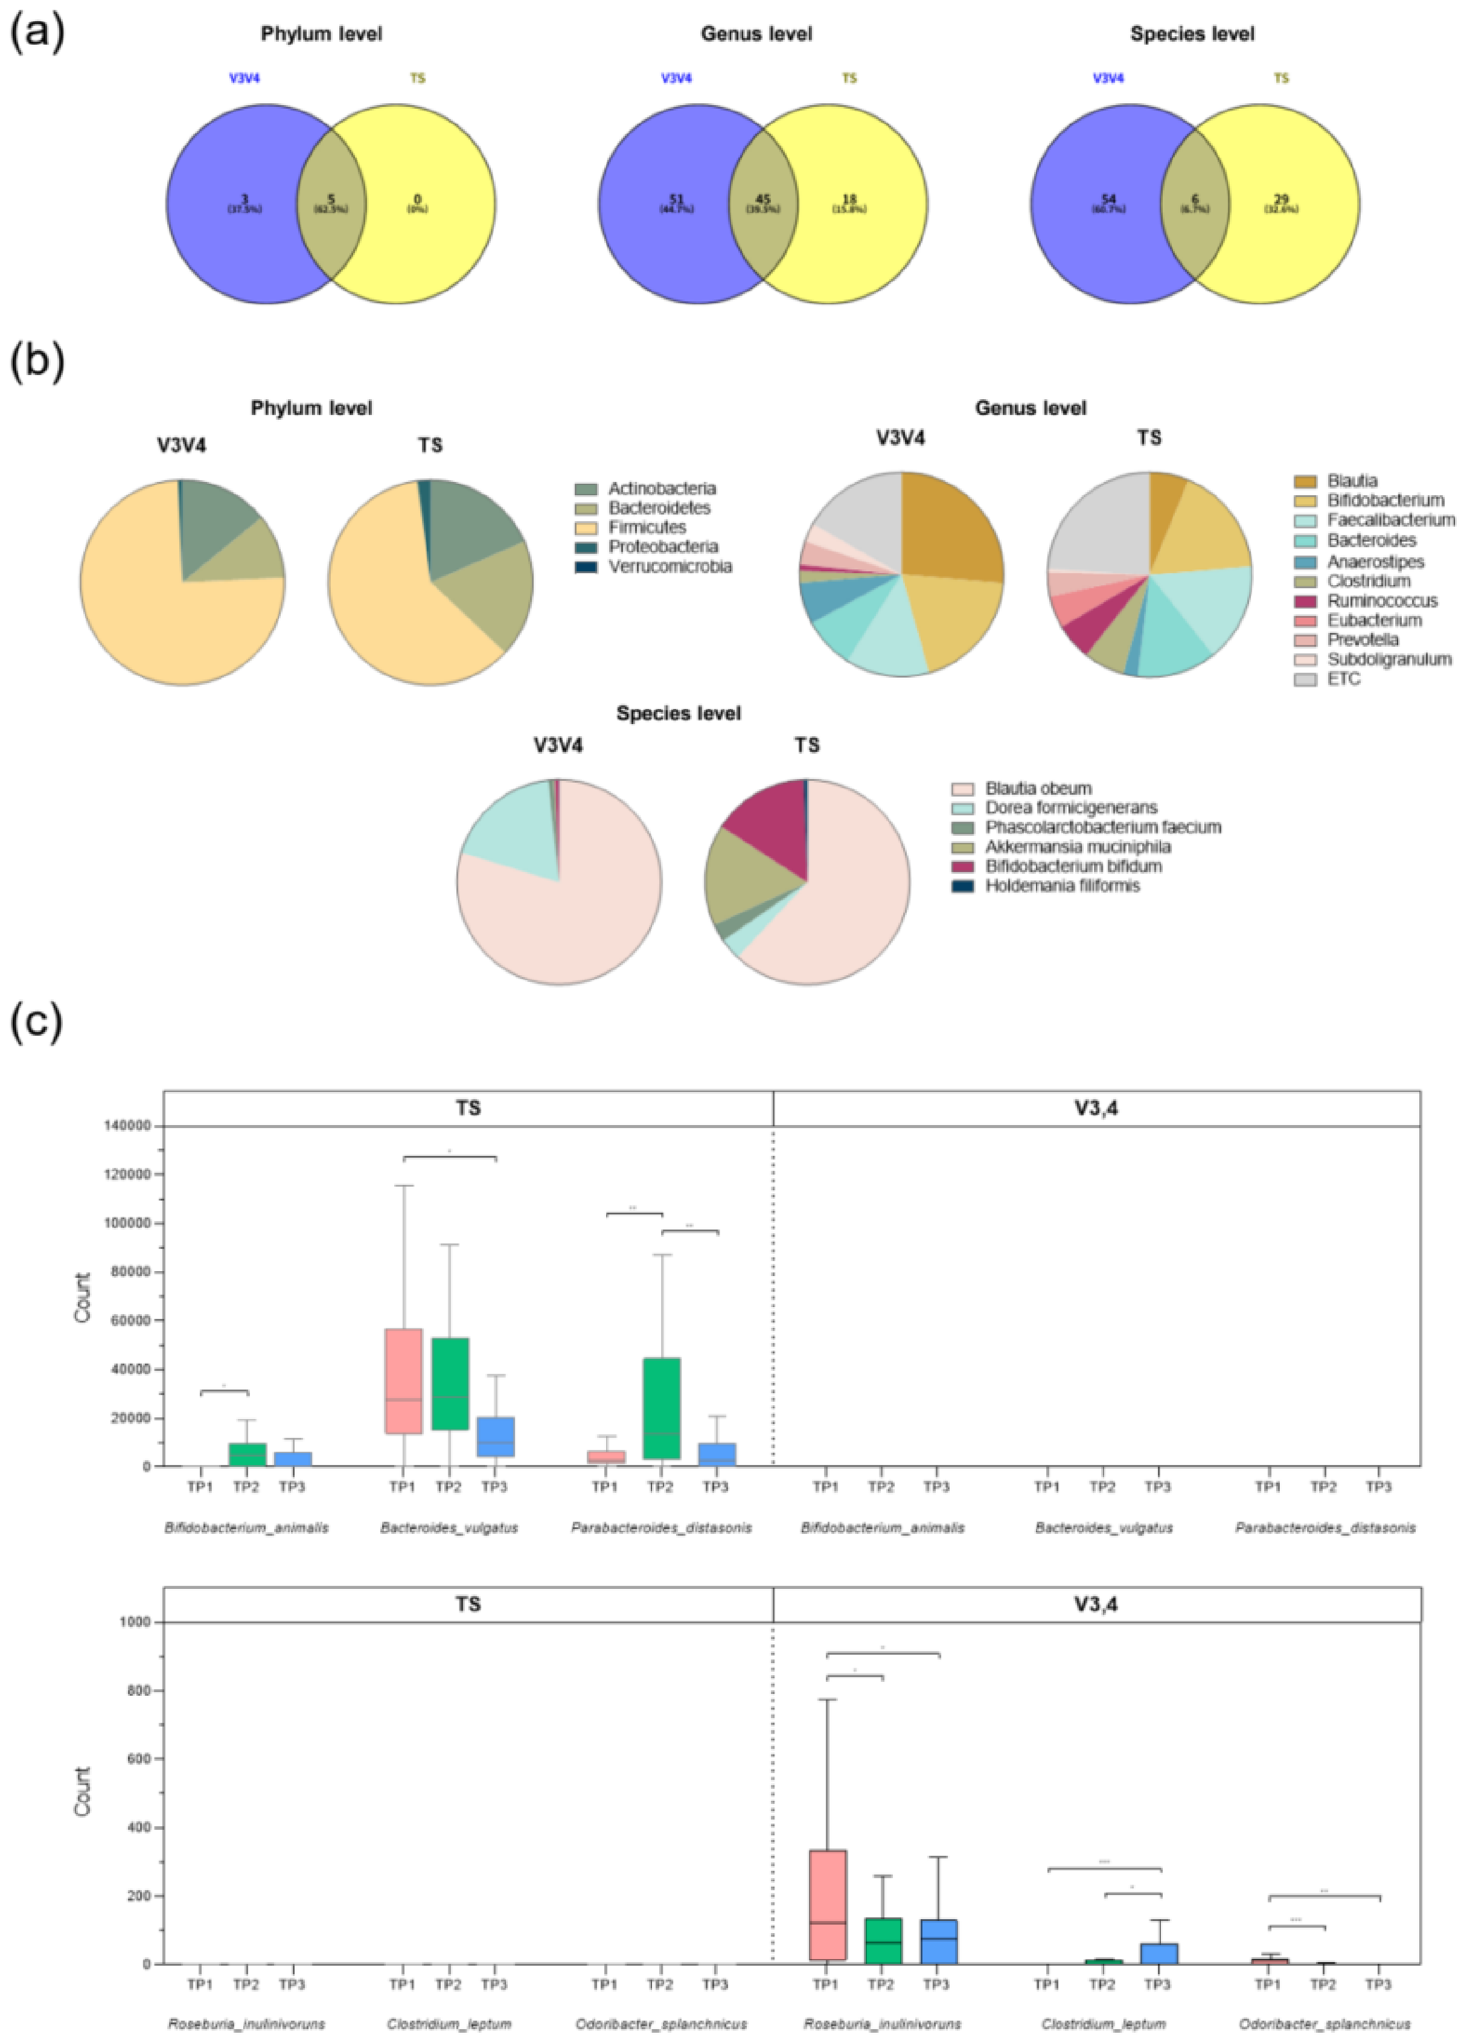
The comparative analysis, which used T2 (end of intervention) samples, revealed a progressive disparity in taxonomic classification between the two methods as the resolution increased (Figure 4a). At the highest level (phylum), the overlap was substantial, with five common taxa identified, representing 62.5% of all identified phyla. This agreement decreased at the genus level, with only 45 shared taxa, representing 39.5% of the total identified genera. Crucially, taxonomic consensus collapsed at the species level. Only six species were commonly identified through both the V3–V4 and TSS methods, constituting a mere 6.7% overlap with the total number of identified species. This severe divergence at the species level empirically validates the assertion that the V3–V4 method suffers from insufficient taxonomic resolution, making it unreliable for the precise species-level identification required for tracking specific strains. Comparisons of the relative abundance profiles of commonly identified taxa (Figure 4b) further demonstrated quantitative disagreement despite the qualitative consensus observed at taxonomic higher levels. For instance, the V3–V4 method reported Blautia abundance at 26.32% and that of Bacteroides at 8.19%, whereas TSS measured these at 6.22% and 12.56%, respectively. This substantial quantitative variance confirms that even when taxa are commonly identified, the underlying abundance data are fundamentally different between the two platforms.

3.2.2. Quantitative Bias in Probiotic Strain Detection

Analysis of discrepant taxa across the measured time points provided critical evidence of the quantitative bias of V3–V4 sequencing, particularly concerning the administered probiotic strain (Figure 4c). Successful probiotic tracking was achieved when using the TSS method with species-specific primers, which enabled successful quantification of the administered probiotic. The B. animalis probiotic was detected and showed a temporal change consistent with the intervention, although the ANOVA post hoc result was marginally significant for T1 vs. T2 (p = 0.46). TSS also identified significant dynamic changes in other Bacteroidetes taxa: Bacteroides vulgatus showed a significant difference between T1 and T3 (p = 0.021), and Parabacteroides distasonis showed significant changes between T1 vs. T2 (p = 0.012) and T2 vs. T3 (p = 0.018). Contrastingly, V3–V4 quantification failed to measure the administered probiotic strain. While TS successfully identified and tracked B. animalis across the tested time points, V3–V4 reported no counts for this species, indicating the complete absence of detection. Furthermore, V3–V4 detected unique and statistically significant temporal changes in other species that were not found to be significant by TSS: Roseburia inulinivorans (T1 vs. T2, p = 0.03; T1 vs. T3, p = 0.04), Clostridium leptum (T1 vs. T3, p = 0.005; T2 vs. T3, p = 0.029), and Odoribacter splanchnicus (T1 vs. T2, p = 0.005; T1 vs. T3, p = 0.002). This discrepancy confirms that the V3–V4 method generates unique and statistically significant findings that are likely products of amplification bias rather than of true biological changes, thereby invalidating its reliability for efficacy assessments.

4. Discussion

In this longitudinal pilot study, we primarily employed standard 16S rRNA V3–V4 sequencing to screen the ecological impact that synbiotic intervention has on the gut microbiota of older adults. Our initial observations revealed a significant, albeit transient, reduction in alpha-diversity (Observed ASVs) during the intervention period (T2), suggesting that the administration of high-concentration probiotics induced a distinct “ecological perturbation” within the resident ecosystem [20,21,22,23]. Previous studies have posited that the influx of exogenous microorganisms can trigger temporary resource competition or antimicrobial activity, leading to the suppression of less competitive, rare taxa [24,25]. Consequently, the observed reduction in diversity should not be strictly interpreted as detrimental dysbiosis but rather as an indicator of active ecosystem remodeling and acute response of the community to probiotic intervention [20,26,27].
This complexity was further mirrored in the multidirectional shifts observed at the genus level. The V3–V4 analysis highlighted dynamic fluctuations, such as a significant decrease in dominant taxa (Bacteroides) and concurrent shifts in SCFA-producing genera, including Roseburia and Odoribacter. Furthermore, functional prediction analysis suggested a potential enhancement in the butanoate metabolism pathway during the intervention, suggesting that metabolic niche expansion was driven by the synbiotics [5,28]. However, these broad taxonomic and functional signals present a critical interpretative challenge; limited resolution of the V3–V4 region inherently fails to distinguish whether these shifts are directly driven by colonization of the administered strains or merely through compensatory responses of the resident species [29]. This “interpretative ambiguity” underscores the insufficiency of broad-spectrum profiling for elucidating the precise mechanisms of probiotic action [30].
The most definitive finding of this study, which empirically validates the methodological limitations raised in the Introduction, was the quantitative failure of the V3–V4 platform to detect the administered probiotic strain, B. animalis subsp. lactis. Furthermore, the superior accuracy of the TSS method was functionally validated through its ability to establish significant correlations with host clinical parameters, which were entirely masked in the 16S dataset. As presented in our correlation analysis (Supplementary Figure S1), the increase in Bacteroides vulgatus—precisely quantified only by TSS—was significantly associated with a reduction in Triglycerides (R = −0.627, p = 0.004) and CRP (R = −0.474, p = 0.041). This demonstrates that TSS not only mitigates technical bias but also provides the necessary quantitative resolution to evaluate the actual clinical efficacy of synbiotic interventions. Although the high-resolution TSS assay confirmed that B. animalis was the only species to exhibit a statistically significant increase at the T2 endpoint, the V3–V4 method reported near-zero abundance for this species across all measured time points. Although the high-resolution TSS assay confirmed that B. animalis was the only species to exhibit a statistically significant increase at the T2 endpoint, the V3–V4 method reported near-zero abundance for this species across all measured time points. This discrepancy is likely attributable to the well-documented primer mismatches in the V3–V4 region for Actinobacteria, particularly for the Bifidobacterium genus, which lead to severe amplification bias and false-negative results [11,31,32]. Moreover, the dramatic drop in taxonomic consensus at the species level, as evidenced by our Venn diagram analysis, confirms that the short read length of the V3–V4 region lacks the discriminatory power necessary to resolve closely related species [29,31]. Consequently, relying solely on standard 16S sequencing would have led to the erroneous conclusion that the probiotic intervention failed to colonize the host, thereby misrepresenting the clinical efficacy of the supplement [31].
The ultimate utility of our comparative analysis lies in resolving the functional ambiguity surrounding the V3–V4 findings. The TSS data provide the critical missing link: successful colonization of the administered B. animalis at T2 strongly supports the increased potential for butanoate metabolism, as Bifidobacterium species are primary producers of acetate and lactate, which are vital cross-feeding substrates for major butyrate producers, such as Roseburia and Faecalibacterium [33,34,35]. Furthermore, TSS identified significant T2 shifts in Bacteroides vulgatus and P. distasonis, key polysaccharide degraders, suggesting that the synbiotic induced functional reorganization of the dietary fiber-utilizing capacity within the gut [36,37,38]. This reorganization may play a crucial role in enhancing host adaptation and ecological resilience. According to Liu et al. (2025), gut microbiota significantly aids host adaptation under physiological or environmental stress through microbial-mediated mechanisms [39]. In the context of our study, the selective modulation of species such as B. vulgatus and P. distasonis via synbiotics may reinforce the metabolic homeostasis and resilience of the elderly host against age-related physiological declines. Conversely, the V3–V4 analysis yielded statistically significant changes in R. inulinivorans, C. leptum, and O. splanchnicus that were not corroborated by TSS, highlighting a methodological risk in which V3–V4 bias can generate statistically significant but potentially false signals from nontargeted species [32,40]. Finally, the V3–V4-predicted decreases in riboflavin metabolism and glycosphingolipid biosynthesis pathways during the intervention, although derived from ambiguous taxonomic data, may reflect a temporary suppression or metabolic shift in certain B-vitamin-producing Firmicutes taxa due to competitive influx of the Bifidobacterium strain, emphasizing the broad, cascading metabolic effects of the intervention [41,42].
Despite the significant methodological insights gained from this comparative analysis, several limitations of the present study must be acknowledged. First, as a pilot study, the sample size was relatively small (n = 20), which may limit the generalizability of the findings and statistical power to detect more subtle ecological shifts within the microbiota. Second, while the inclusion of participants on diabetic medication (n = 3) could be a potential confounding factor, our PERMANOVA analysis confirmed that medication use did not significantly alter the baseline microbial community structure (F = 2.04, R2 = 0.034, p = 0.060). This suggests that the observed ecological shifts were primarily driven by the synbiotic intervention rather than pharmacological variables. Third, our reliance on the V3–V4 region for broad community profiling remains a source of inherent technical constraint. The well-documented primer mismatches and limited taxonomic resolution of this region imply that some resident taxa might have been underrepresented or misidentified, potentially masking deeper interactions between the synbiotic and indigenous microbes of the host. Future large-scale longitudinal trials incorporating metagenomic shotgun sequencing alongside TSS assays would be beneficial to provide even greater functional depth and validate these findings across a more diverse population.
In conclusion, returning to the primary objective of the present study, we have empirically demonstrated that while standard 16S rRNA V3–V4 sequencing is a cost-effective tool for profiling overall community structure and detecting macroscopic ecosystem shifts, it is fundamentally inadequate for the precise monitoring of specific probiotic strains. The most critical finding of our comparative analysis is the quantitative bias stemming from intrinsic limitations of V3–V4 sequencing, which led to the outright non-detection of the administered B. animalis strain. This failure confirms that relying solely on V3–V4 sequencing risks misinterpreting the clinical efficacy of intervention trials. The rationale for utilizing the high-resolution TSS method is not only crucial for enhanced resolution but also to introduce a necessary quantitative truth standard into probiotic efficacy assessments. The TSS assay, designed with eight comprehensive 16S hypervariable regions and highly species-specific primers, inherently mitigates the two fatal flaws of the V3–V4 method: primer mismatch issues and low species-level fidelity. Successful quantification of the probiotic strain via TSS validated that this method provides unambiguous, species-level quantitative data that are essential for confirming strain survival and assessing the true ecological contribution of the supplement.
This research, which is positioned as a critical methodological validation study, establishes empirical data required to assess the potential of the V3–V4 method to misrepresent or miss changes in key functional taxa—including the administered probiotic species. To overcome these critical limitations and ensure the accurate validation of probiotic efficacy in future clinical research, we advocate the adoption of a dual-sequencing approach. By integrating the broad ecological screening capabilities of 16S rRNA V3–V4 sequencing with the precise, species-level quantification of TSS, researchers can ensure that both the “forest” (community dynamics) and “trees” (specific strain fate) are accurately assessed, thereby establishing the necessary scientific rigor in the field.

Supplementary Materials

The following supporting information can be downloaded at: https://www.mdpi.com/article/10.3390/microorganisms14051035/s1, Figure S1: Correlation analysis between TSS-detected microbial abundance and clinical metabolic parameters. Supplementary Data S1: brief description; Table S1: species-specific primers targeting 73 bacterial species; Table S2: Summary of study subjects surveys.

Author Contributions

Study design, H.L.; conceptualization, H.L.; methodology, O.K.; sample collection, G.K. and J.K.; validation, G.K.; formal analysis, O.K.; investigation, J.K., O.K., and G.K.; resources, J.K. and S.-H.J.; data curation, O.K.; bioinformatics analyses, H.L.; writing—original draft preparation, H.L.; writing—review and editing, H.L.; visualization, H.L.; supervision, S.H. and C.S.O.; funding acquisition, S.H. All authors have read and agreed to the published version of the manuscript.

Funding

This study was supported by Eulji University (Uijeongbu, Republic of Korea) in 2024 (EJRG-24-10) and the National Research Foundation of Korea (NRF) grant funded by the Korea government (MSIT) (No. RS-2022-NR072193).

Institutional Review Board Statement

The study was conducted in accordance with the Declaration of Helsinki, and approved by the Eulji University Internal Review Board (IRB No. EUIRB 2021-008 and 20 March 2021).

Informed Consent Statement

Informed consent was obtained from all subjects involved in the study.

Data Availability Statement

The original contributions presented in this study are included in the article/supplementary material. Further inquiries can be directed to the corresponding authors.

Acknowledgments

We are grateful to Eulji University for providing the administrative and technical facilities required to conduct this comparative analysis.

Conflicts of Interest

The authors declare no conflicts of interest. The funders had no role in the design of the study; in the collection, analyses, or interpretation of data; in the writing of the manuscript; or in the decision to publish the results.

Abbreviations

The following abbreviations are used in this manuscript:
ANOSIMAnalysis of Similarities
ANOVAAnalysis of variance
ASVAmplicon sequence variant
CFUsColony-forming units
NMDSNonmetric multidimensional scaling
QIIMEQuantitative Insights into Microbial Ecology
SCFAShort-chain fatty acid
TSSTargeted species sequencing

References

  1. Kim, S.; Jazwinski, S.M. The Gut Microbiota and Healthy Aging: A Mini-Review. Gerontology 2018, 64, 513–520. [Google Scholar] [CrossRef] [Scilit] [PubMed]
  2. Caldarelli, M.; Rio, P.; Marrone, A.; Giambra, V.; Gasbarrini, A.; Gambassi, G.; Cianci, R. Inflammaging: The Next Challenge-Exploring the Role of Gut Microbiota, Environmental Factors, and Sex Differences. Biomedicines 2024, 12, 1716. [Google Scholar] [CrossRef] [Scilit]
  3. Escudero-Bautista, S.; Omaña-Covarrubias, A.; Nez-Castro, A.T.; López-Pontigo, L.; Pimentel-Pérez, M.; Chávez-Mejía, A. Impact of Gut Microbiota on Aging and Frailty: A Narrative Review of the Literature. Geriatrics 2024, 9, 110. [Google Scholar] [CrossRef] [Scilit]
  4. Shen, Y.; Fan, N.; Ma, S.X.; Cheng, X.; Yang, X.; Wang, G. Gut Microbiota Dysbiosis: Pathogenesis, Diseases, Prevention, and Therapy. MedComm 2025, 6, e70168. [Google Scholar] [CrossRef] [Scilit]
  5. Zeng, Q.; Luo, Y.; He, W. Effect of Probiotics or Synbiotics on Skeletal Muscle in Older Adults: A Systematic Review and Meta-Analysis of Randomized Controlled Trials. Aging Res. 2024, 2, 9340028. [Google Scholar] [CrossRef] [Scilit]
  6. Sanchez, Y.; Sanchez de la Barquera, B.; Carrillo, B.E.M.; Garrido, J.F.A.; Mendez, R.M.; Arciniega, A.D.B.; Ramos, R.V.; Pina, A.E.S. Emerging Evidence on the Use of Probiotics and Prebiotics to Improve the Gut Microbiota of Older Adults with Frailty Syndrome: A Narrative Review. J. Nutr. Health Aging 2022, 26, 926–935. [Google Scholar] [CrossRef] [Scilit]
  7. Sodré, C.S.; Vieira, M.S.; Estefan, J.L.; Moraes, C.; Cavalcante, F.S.; Dos Santos, K.R.N.; de Carvalho Ferreira, D. The Effect of Probiotics on the Clinical Status of Adult Patients with Atopic Dermatitis: A Systematic Review. Eur. J. Med. Res. 2022, 27, 94. [Google Scholar] [CrossRef] [Scilit]
  8. Claesson, M.J.; Wang, Q.; O’Sullivan, O.; Greene-Diniz, R.; Cole, J.R.; Ross, R.P.; O’Toole, P.W. Comparison of Two Next-Generation Sequencing Technologies for Resolving Highly Complex Microbiota Composition Using Tandem Variable 16s Rrna Gene Regions. Nucleic Acids Res. 2010, 38, e200. [Google Scholar] [CrossRef] [Scilit] [PubMed]
  9. Karjalainen, H.; Ahlroos, T.; Myllyluoma, E.; Tynkkynen, S. Real-Time Pcr Assays for Strain-Specific Quantification of Probiotic Strains in Human Faecal Samples. Int. Dairy J. 2012, 27, 58–64. [Google Scholar] [CrossRef] [Scilit]
  10. Elie, C.; Perret, M.; Hage, H.; Sentausa, E.; Hesketh, A.; Louis, K.; Fritah-Lafont, A.; Leissner, P.; Vachon, C.; Rostaing, H.; et al. Comparison of DNA Extraction Methods for 16s Rrna Gene Sequencing in the Analysis of the Human Gut Microbiome. Sci. Rep. 2023, 13, 10279. [Google Scholar] [CrossRef] [Scilit] [PubMed]
  11. Matsuo, Y.; Komiya, S.; Yasumizu, Y.; Yasuoka, Y.; Mizushima, K.; Takagi, T.; Kryukov, K.; Fukuda, A.; Morimoto, Y.; Naito, Y.; et al. Full-Length 16s Rrna Gene Amplicon Analysis of Human Gut Microbiota Using Minion Nanopore Sequencing Confers Species-Level Resolution. BMC Microbiol. 2021, 21, 35. [Google Scholar] [CrossRef] [Scilit]
  12. Snipen, L.; Angell, I.L.; Rognes, T.; Rudi, K. Reduced Metagenome Sequencing for Strain-Resolution Taxonomic Profiles. Microbiome 2021, 9, 79. [Google Scholar] [CrossRef] [Scilit] [PubMed]
  13. Sipos, R.; Székely, A.J.; Palatinszky, M.; Révész, S.; Márialigeti, K.; Nikolausz, M. Effect of Primer Mismatch, Annealing Temperature and Pcr Cycle Number on 16s Rrna Gene-Targetting Bacterial Community Analysis. FEMS Microbiol. Ecol. 2007, 60, 341–350. [Google Scholar] [CrossRef] [Scilit]
  14. Silvaraju, S.; Menon, N.; Fan, H.; Lim, K.; Kittelmann, S. Phylotype-Level Characterization of Complex Communities of Lactobacilli Using a High-Throughput, High-Resolution Phenylalanyl-Trna Synthetase (Phes) Gene Amplicon Sequencing Approach. Appl. Environ. Microbiol. 2020, 87, e02191-20. [Google Scholar] [CrossRef] [Scilit] [PubMed]
  15. Schloss, P.D.; Gevers, D.; Westcott, S.L. Reducing the Effects of Pcr Amplification and Sequencing Artifacts on 16s Rrna-Based Studies. PLoS ONE 2011, 6, e27310. [Google Scholar] [CrossRef] [Scilit]
  16. Kim, E.; Yang, S.M.; Lim, B.; Park, S.H.; Rackerby, B.; Kim, H.Y. Design of Pcr Assays to Specifically Detect and Identify 37 Lactobacillus Species in a Single 96 Well Plate. BMC Microbiol. 2020, 20, 96. [Google Scholar] [CrossRef] [Scilit]
  17. Brumfield, K.D.; Huq, A.; Colwell, R.R.; Olds, J.L.; Leddy, M.B. Microbial Resolution of Whole Genome Shotgun and 16s Amplicon Metagenomic Sequencing Using Publicly Available Neon Data. PLoS ONE 2020, 15, e0228899. [Google Scholar] [CrossRef] [Scilit]
  18. Mathys, S.; Lacroix, C.; Mini, R.; Meile, L. Pcr and Real-Time Pcr Primers Developed for Detection and Identification of Bifidobacterium Thermophilum in Faeces. BMC Microbiol. 2008, 8, 179. [Google Scholar] [CrossRef] [Scilit]
  19. Lugli, G.A.; Duranti, S.; Milani, C.; Mancabelli, L.; Turroni, F.; Sinderen, D.V.; Ventura, M. Uncovering Bifidobacteria Via Targeted Sequencing of the Mammalian Gut Microbiota. Microorganisms 2019, 7, 535. [Google Scholar] [CrossRef] [Scilit] [PubMed]
  20. Lozupone, C.A.; Stombaugh, J.I.; Gordon, J.I.; Jansson, J.K.; Knight, R. Diversity, Stability and Resilience of the Human Gut Microbiota. Nature 2012, 489, 220–230. [Google Scholar] [CrossRef] [Scilit]
  21. Suez, J.; Zmora, N.; Zilberman-Schapira, G.; Mor, U.; Dori-Bachash, M.; Bashiardes, S.; Zur, M.; Regev-Lehavi, D.; Brik, R.B.Z.; Federici, S.; et al. Post-Antibiotic Gut Mucosal Microbiome Reconstitution Is Impaired by Probiotics and Improved by Autologous Fmt. Cell 2018, 174, 1406–1423.e16. [Google Scholar] [CrossRef] [Scilit]
  22. Lai, H.H.; Chiu, C.H.; Kong, M.S.; Chang, C.J.; Chen, C.C. Probiotic Lactobacillus Casei: Effective for Managing Childhood Diarrhea by Altering Gut Microbiota and Attenuating Fecal Inflammatory Markers. Nutrients 2019, 11, 1150. [Google Scholar] [CrossRef] [Scilit]
  23. Shen, X.; Jin, H.; Zhao, F.; Kwok, L.Y.; Zhao, Z.; Sun, Z. Short-Term Probiotic Supplementation Affects the Diversity, Genetics, Growth, and Interactions of the Native Gut Microbiome. Imeta 2024, 3, e253. [Google Scholar] [CrossRef] [Scilit]
  24. Derrien, M.; van Hylckama Vlieg, J.E. Fate, Activity, and Impact of Ingested Bacteria within the Human Gut Microbiota. Trends Microbiol. 2015, 23, 354–366. [Google Scholar] [CrossRef] [Scilit] [PubMed]
  25. Horrocks, V.; King, O.G.; Yip, A.Y.; Marques, I.M.; McDonald, J.A. Role of the Gut Microbiota in Nutrient Competition and Protection against Intestinal Pathogen Colonization. Microbiology 2023, 169, 001377. [Google Scholar] [CrossRef] [Scilit]
  26. Williams, C.E.; Hammer, T.J.; Williams, C.L. Diversity Alone Does Not Reliably Indicate the Healthiness of an Animal Microbiome. ISME J. 2024, 18, wrae133. [Google Scholar] [CrossRef] [Scilit]
  27. Safarchi, A.; Al-Qadami, G.; Tran, C.D.; Conlon, M. Understanding Dysbiosis and Resilience in the Human Gut Microbiome: Biomarkers, Interventions, and Challenges. Front. Microbiol. 2025, 16, 1559521. [Google Scholar] [CrossRef] [Scilit]
  28. Singh, V.; Lee, G.; Son, H.; Koh, H.; Kim, E.S.; Unno, T.; Shin, J.H. Butyrate Producers, “the Sentinel of Gut”: Their Intestinal Significance with and Beyond Butyrate, and Prospective Use as Microbial Therapeutics. Front. Microbiol. 2022, 13, 1103836. [Google Scholar] [CrossRef] [Scilit]
  29. Johnson, J.S.; Spakowicz, D.J.; Hong, B.Y.; Petersen, L.M.; Demkowicz, P.; Chen, L.; Leopold, S.R.; Hanson, B.M.; Agresta, H.O.; Gerstein, M.; et al. Evaluation of 16s Rrna Gene Sequencing for Species and Strain-Level Microbiome Analysis. Nat. Commun. 2019, 10, 5029. [Google Scholar] [CrossRef] [Scilit] [PubMed]
  30. Fuks, G.; Elgart, M.; Amir, A.; Zeisel, A.; Turnbaugh, P.J.; Soen, Y.; Shental, N. Combining 16s Rrna Gene Variable Regions Enables High-Resolution Microbial Community Profiling. Microbiome 2018, 6, 17. [Google Scholar] [CrossRef] [Scilit] [PubMed]
  31. Sim, K.; Cox, M.J.; Wopereis, H.; Martin, R.; Knol, J.; Li, M.S.; Cookson, W.O.; Moffatt, M.F.; Kroll, J.S. Improved Detection of Bifidobacteria with Optimised 16s Rrna-Gene Based Pyrosequencing. PLoS ONE 2012, 7, e32543. [Google Scholar] [CrossRef] [Scilit]
  32. Abellan-Schneyder, I.; Matchado, M.S.; Reitmeier, S.; Sommer, A.; Sewald, Z.; Baumbach, J.; List, M.; Neuhaus, K. Primer, Pipelines, Parameters: Issues in 16s Rrna Gene Sequencing. mSphere 2021, 6, e01202-20. [Google Scholar] [CrossRef] [Scilit] [PubMed]
  33. Rivière, A.; Selak, M.; Lantin, D.; Leroy, F.; De Vuyst, L. Bifidobacteria and Butyrate-Producing Colon Bacteria: Importance and Strategies for Their Stimulation in the Human Gut. Front. Microbiol. 2016, 7, 979. [Google Scholar] [CrossRef] [Scilit]
  34. Culp, E.J.; Goodman, A.L. Cross-Feeding in the Gut Microbiome: Ecology and Mechanisms. Cell Host Microbe 2023, 31, 485–499. [Google Scholar] [CrossRef] [Scilit] [PubMed]
  35. Moens, F.; Verce, M.; De Vuyst, L. Lactate- and Acetate-Based Cross-Feeding Interactions between Selected Strains of Lactobacilli, Bifidobacteria and Colon Bacteria in the Presence of Inulin-Type Fructans. Int. J. Food Microbiol. 2017, 241, 225–236. [Google Scholar] [CrossRef] [Scilit]
  36. Cheng, J.; Hu, J.; Geng, F.; Nie, S. Bacteroides Utilization for Dietary Polysaccharides and Their Beneficial Effects on Gut Health. Food Sci. Hum. Wellness 2022, 11, 1101–1110. [Google Scholar] [CrossRef] [Scilit]
  37. Qu, Z.; Liu, H.; Yang, J.; Zheng, L.; Huang, J.; Wang, Z.; Xie, C.; Zuo, W.; Xia, X.; Sun, L.; et al. Selective Utilization of Medicinal Polysaccharides by Human Gut Bacteroides and Parabacteroides Species. Nat. Commun. 2025, 16, 638. [Google Scholar] [CrossRef] [Scilit]
  38. Sonnenburg, E.D.; Zheng, H.; Joglekar, P.; Higginbottom, S.K.; Firbank, S.J.; Bolam, D.N.; Sonnenburg, J.L. Specificity of Polysaccharide Use in Intestinal Bacteroides Species Determines Diet-Induced Microbiota Alterations. Cell 2010, 141, 1241–1252. [Google Scholar] [CrossRef] [Scilit]
  39. Liu, H.; Zhao, X.; Xu, S.; Zhao, L.; Han, X.; Xu, X.; Zhao, N.; Hu, L.; Luo, C.; Wang, X.; et al. Multi-Omics Reveal the Gut Microbiota-Mediated Severe Foraging Environment Adaption of Small Wild Ruminants in the Three-River-Source National Park, China. Integr. Zool. 2025, 20, 916–935. [Google Scholar] [CrossRef] [Scilit]
  40. Matchado, M.S.; Rühlemann, M.; Reitmeier, S.; Kacprowski, T.; Frost, F.; Haller, D.; Baumbach, J.; List, M. On the Limits of 16s Rrna Gene-Based Metagenome Prediction and Functional Profiling. Microb. Genom. 2024, 10, 001203. [Google Scholar] [CrossRef] [Scilit]
  41. Hossain, K.S.; Amarasena, S.; Mayengbam, S. B Vitamins and Their Roles in Gut Health. Microorganisms 2022, 10, 1168. [Google Scholar] [CrossRef] [Scilit] [PubMed]
  42. Magnúsdóttir, S.; Ravcheev, D.; de Crécy-Lagard, V.; Thiele, I. Systematic Genome Assessment of B-Vitamin Biosynthesis Suggests Co-Operation among Gut Microbes. Front. Genet. 2015, 6, 148. [Google Scholar] [CrossRef] [Scilit] [PubMed]
Figure 1. Relative abundance profiles of the major microbial taxa are shown for different groups (Control vs. Treatment) and across three time points (T1–T3). Compositional differences in the microbial communities based on phylogenetic classification are illustrated at the phylum (a), order (b), and genus (c) taxonomic levels. Abbreviation: T, time point.
Microorganisms 14 01035 g001
Figure 2. Phylogenetic and compositional differences of microbial communities are presented using alpha- and beta-diversity metrics. (a,b) Alpha-diversity analysis: Box plots showing alpha-diversity (within-sample diversity, e.g., observed amplicon sequence variants [ASVs]) comparing different groups. Statistical differences in alpha-diversity were primarily assessed using the Kruskal–Wallis test for overall group comparison, followed by Mann–Whitney U tests for pairwise comparisons. Box plots illustrate the 25th–75th percentile range, with the black horizontal line indicating the 50th percentile (median). (c,d) Beta-diversity analysis: Nonmetric multidimensional scaling (NMDS) plots visually represent the structural dissimilarity between groups, as quantified using the Weighted UniFrac distance metric. Statistical differences between communities were analyzed using Analysis of Similarities. Statistical notation: p-values for the Mann–Whitney U test (for pairwise alpha-diversity comparisons) are indicated in the figure: ** p < 0.01. Abbreviation: T, time point.
Microorganisms 14 01035 g002
Figure 3. Hierarchical clustering heatmap of the gut microbiota composition across three time points (a). The heatmap depicts the relative abundance of dominant gut microbial genera across three time points: before (T1), during (T2), and after (T3) synbiotic intake. Colors represent z-score-normalized abundance values, where red indicates increased abundance, blue indicates decreased abundance, and white represents mean abundance levels. (bd) Heat tree plots displaying taxonomic hierarchies with node colors representing relative enrichment (red: first group, blue: second group) based on median abundance, using the Wilcoxon rank-sum test for significance. Node sizes reflect the relative abundance, highlighting key taxa contributing to the compositional differences between groups. Abbreviation: T, time point.
Microorganisms 14 01035 g003
Figure 4. Comparative analysis of the taxonomic resolution and quantitative accuracy between 16S rRNA V3–V4 and targeted species sequencing (TSS). (a) Venn diagrams illustrating the number of common and unique taxa identified via the 16S V3–V4 and TSS methods at the phylum, genus, and species levels. The analysis highlights a significant drop in taxonomic consensus at lower levels, particularly at the species level, underscoring the critical failure of V3–V4 in achieving the necessary resolution for specific probiotic monitoring. (b) Pie or bar charts displaying the relative abundance profiles of key taxa commonly identified through both the V3–V4 and TSS methods (e.g., dominant phyla or the top 10 genera). This comparison shows the overall consensus in high-abundance community structures, contrasting with the performance of the method in classifying the microbial baseline. (c) Box plots comparing the relative abundance of discrepant and targeted low-abundance species across the three measured time points (T1–T3), with statistical differences assessed via ANOVA and Bonferroni post hoc analysis. The box plot ranges from the 25th–75th percentile, with the 50th percentile represented by the black horizontal line. The p-values for the Mann–Whitney U test are shown in the figure: * p < 0.05, ** p < 0.01 and *** p < 0.005. Abbreviation: TP, time point.
Microorganisms 14 01035 g004
Table 1. Characteristics of study subjects.
Value (%)
Total20
SEX
Male3(15)
Female17(85)
Age
60s8(40)
70s11(55)
80s1(5)
Range64–83
Smoking
no19(95)
yes1(5)
Alcohol
no14(70)
yes6(30)
Table 2. Predicted Functional Pathway Shifts by KEGG Analysis.
PathwayDefinitionp-Valuep-Value (FDR)T1T2T3
ko04973Carbohydrate digestion and absorption0.00290.34850.04120.05540.0432
ko00604Glycosphingolipid biosynthesis—ganglio series0.00630.34850.05660.04050.0470
ko04016MAPK signaling pathway—plant0.00380.34850.04470.05050.0456
ko04626Plant-pathogen interaction0.00350.34850.13460.11300.1242
ko00020Citrate cycle (TCA cycle)0.01190.44040.41110.38510.4014
ko00650Butanoate metabolism0.01730.47880.48840.46590.4897
ko04724Glutamatergic synapse0.02000.52120.08790.08410.0872
ko00626Naphthalene degradation0.00630.34850.05160.0615
ko05143African trypanosomiasis0.00630.34850.01620.0197
ko01503Cationic antimicrobial peptide (CAMP) resistance0.00350.34850.36530.3033
ko00740Riboflavin metabolism0.00490.34850.27510.2497
ko00350Tyrosine metabolism0.00870.42790.19900.2234
ko00051Fructose and mannose metabolism0.01490.44040.77920.7110
ko01501beta-Lactam resistance0.01380.44040.47440.4186
ko01040Biosynthesis of unsaturated fatty acids0.01490.44040.12250.1329
ko00950Isoquinoline alkaloid biosynthesis0.01100.44040.05820.0723
ko01052Type I polyketide structures0.01280.44040.01950.0251
ko04950Maturity onset diabetes of the young0.02150.52890.00060.0009
ko00945Stilbenoid, diarylheptanoid and gingerol biosynthesis0.02310.53800.01600.0134
ko00980Metabolism of xenobiotics by cytochrome P4500.03730.64900.06040.0683
ko00791Atrazine degradation0.04250.64900.03650.0420
ko00513Various types of N-glycan biosynthesis0.04250.64900.06730.0537
ko00511Other glycan degradation0.03490.64900.36290.2941
ko03008Ribosome biogenesis in eukaryotes0.03980.64900.04630.0542
ko03420Nucleotide excision repair0.04250.64900.36490.3854
ko00720Carbon fixation pathways in prokaryotes0.03050.64900.67690.6423
ko00190Oxidative phosphorylation0.03490.64900.79690.7601
ko04075Plant hormone signal transduction0.03980.64900.01090.0077
ko00790Folate biosynthesis0.03980.64900.45220.4404
ko03018RNA degradation0.04830.71330.44810.4251
ko03450Non-homologous end-joining0.03490.98510.0033 0.0044
ko01054Nonribosomal peptide structures0.04830.98510.0114 0.0125
ko00533Glycosaminoglycan biosynthesis—keratan sulfate0.03491.0000 0.00050.0008
ko01523Antifolate resistance0.01491.0000 0.16380.1582
ko00904Diterpenoid biosynthesis0.02311.0000 0.00010.0001
ko00640Propanoate metabolism0.02311.0000 0.50760.5235
Disclaimer/Publisher’s Note: The statements, opinions and data contained in all publications are solely those of the individual author(s) and contributor(s) and not of MDPI and/or the editor(s). MDPI and/or the editor(s) disclaim responsibility for any injury to people or property resulting from any ideas, methods, instructions or products referred to in the content.