Article

Epidemiological, Phenotypic, and Genomic Characterization of Salmonella from Food and Clinical Sources in Liaoning, China, 2022–2024

1
Liaoning Provincial Center for Disease Control and Prevention, Shenyang 110001, China
2
China National Center for Food Safety Risk Assessment, Beijing 100022, China
*
Authors to whom correspondence should be addressed.
Microorganisms 2026, 14(4), 823; https://doi.org/10.3390/microorganisms14040823
Submission received: 13 March 2026 / Revised: 30 March 2026 / Accepted: 31 March 2026 / Published: 3 April 2026
(This article belongs to the Special Issue Salmonella and Food Safety)

Abstract

Salmonella is a major cause of foodborne illness worldwide, posing significant risks to public health and food safety. This study investigated the prevalence, serovar distribution, genotypic characteristics, and antimicrobial resistance (AMR) profiles of Salmonella. A total of 2515 food samples were collected from retail markets, supermarkets, and food processing facilities, and 13,670 stool samples were obtained from sentinel hospitals across 14 cities in Liaoning. The Kruskal–Wallis test was used to compare genetic features among serovars, followed by Dunn’s post hoc test for pairwise comparisons. A total of 314 Salmonella strains were identified, with raw poultry showing the highest detection rate (28.88%) among food sources and children aged 0–6 years (3.47%) the highest among the clinical age groups. Among food samples, S. Enteritidis was the most prevalent serovar (42.6%), and it was also the most common in clinical samples (35.8%); in contrast, S. 4,[5],12:i:- was dominant in pediatric clinical cases. According to AMR analysis, 90.13% of strains were resistant to at least one antibiotic and 67.83% were multidrug-resistant (MDR), with the highest resistance to ampicillin (68.47%). Analysis revealed that S. 4,[5],12:i:- harbored the ASSuT resistance module (blaTEM-1B, aph(3″)-Ib/aph(6)-Id, sul2, tet(B)). Extensive MDR phenotypes were observed in S. Indiana and S. Kentucky, associated with abundant insertion sequences (IS) and resistance genes (ARGs), including clinically critical determinants (blaNDM-9, mcr-1.1, rmtB). The highest mean virulence factor (VF) count (111.17) was observed in S. Enteritidis, contributing to its epidemiological success. Conversely, S. Indiana and S. Kentucky, predominantly food-associated serovars, exhibited reduced virulence but served as critical AMR reservoirs. These findings highlight the epidemiological characteristics and AMR risks of Salmonella in food and clinical settings, providing critical data for food safety and clinical antimicrobial stewardship.

1. Introduction

Salmonella remains a leading cause of foodborne illnesses worldwide, responsible for approximately 153 million annual gastroenteritis cases and over 60,000 deaths [1,2]. The genus encompasses over 2600 serovars [3], yet only about 100 account for most human infections [4]. Non-typhoidal Salmonella (NTS) causes manifestations ranging from self-limiting gastroenteritis to life-threatening invasive disease [5], with approximately 5% of patients (particularly infants, the elderly, and immunocompromised individuals) developing bacteremia or focal extra-intestinal infections [6]. Invasive complications (meningitis, osteomyelitis, endovascular infections) carry mortality rates up to 40–60% despite appropriate therapy [7]. Certain host-adapted serovars cause severe human disease and exhibit higher antimicrobial resistance (AMR), underscoring the need for serovar-level surveillance [8,9].
The acquisition of antimicrobial resistance (AMR) is driven by horizontal transfer of resistance determinants via mobile genetic elements, compounded by antibiotic overuse in medicine and animal husbandry [10]. Critically, AMR profiles vary substantially across serovars, necessitating serovar-specific surveillance. A nine-year national study across 26 Chinese provinces (2014–2022) identified S. Enteritidis (14.23%), S. Typhimurium (8.52%), S. Derby (6.30%), S. Kentucky (5.95%), and S. Rissen (5.24%) as predominant serovars in animal-origin foods, with marked regional distribution and dynamic prevalence shifts [11].
Of particular concern is escalating resistance to third-generation cephalosporins and fluoroquinolones—both WHO Highest Priority Critically Important Antimicrobials, with fluoroquinolones recommended as first-line therapy for invasive salmonellosis [12]. Genomic surveillance in Shanghai (2012–2021) revealed 56.6% of 458 clinical isolates exhibited multidrug resistance (MDR), with fluoroquinolone resistance mutations (parC T57S: 32.5%; gyrA D87Y: 29.0%) and blaCTX-M-55 (3.3%) widely disseminated [13]. In contrast, restrictive antibiotic policies in the USA and EU have maintained low resistance in livestock isolates (fluoroquinolones: 3.00% and 6.90%; third-generation cephalosporins: 4.20% and 0.40%) [14,15]. China, as the world’s largest antibiotic producer and consumer with over 50% consumption attributed to animal production [16], faces alarming resistance rates including MDR over 50% and clinically significant determinants such as blaCTX-M-55 across multiple regions [13,17,18].
Despite this global significance, comprehensive studies examining epidemiological distribution, serovar dynamics across diverse sources, and resistance profiles remain limited in northeastern China. Liaoning Province, a major agricultural region, represents a critical sentinel site for understanding Salmonella transmission at the human–animal–environment interface. Therefore, this study investigated (i) prevalence and seasonal distribution of Salmonella in food products and clinical diarrheal patients in Liaoning (2022–2024); (ii) serovar distribution patterns across sources and demographic groups; (iii) phenotypic and genotypic AMR profiles of predominant serovars; and (iv) associations between virulence factors, mobile genetic elements, and serovar-specific epidemiological success. The findings will inform evidence-based food safety policies and antimicrobial stewardship programs.

2. Materials and Methods

From January 2022 to December 2024, a total of 2515 food samples were collected from retail markets, supermarkets, and food processing facilities across Liaoning Province, China. Food samples were categorized into five groups: poultry (n = 419), pork (n = 75), beef (n = 207), aquatic products (n = 1200), all of which were raw, and other food sources including cooked meat products and raw sauces (n = 614). Poultry samples consisted of whole chicken carcasses, chicken breasts, or thighs, collected as retail cuts. Pork and beef samples included muscle tissue. Aquatic products primarily comprised fresh fish, shrimp and shellfish. All samples were transported to the laboratory in insulated containers with ice packs within 4 h and processed immediately upon arrival. In markets, food samples were stored under ambient or refrigerated conditions (4 °C) as per routine retail practice. Concurrently, 13,670 stool samples were collected from diarrheal patients with suspected foodborne illness at sentinel hospitals throughout Liaoning Province—covering all 14 of its cities. Four age groups were established for the clinical samples: 0–6 years (n = 2015), 6–18 years (n = 1235), 18–60 years (n = 7065), and >60 years (n = 3355).
Salmonella isolation from food samples was performed according to the National Food Safety Standard of China GB4789.4-2016 [19]. Briefly, 25 g of each food sample was pre-enriched in buffered peptone water at 37 °C for 18 h, followed by selective enrichment in tetrathionate broth and Rappaport Vassiliadis broth at 42 °C for 24 h. The enriched cultures were streaked onto xylose lysine deoxycholate agar and CHROMagar Salmonella plates, then incubated at 37 °C for 24 h. For clinical specimens, stool samples were directly inoculated onto Salmonella Shigella agar and MacConkey agar, followed by incubation at 37 °C for 24 h. Presumptive colonies were subsequently subjected to biochemical confirmation using the VITEK 2 system (bioMérieux, Marcy-l’Étoile, France). Salmonella serovars were determined by slide agglutination using commercial antisera (SSI Diagnostica, Hillerød, Denmark) according to the Kauffmann–White scheme. Serovar testing was performed by determining somatic O antigens and flagellar H antigens.
Phenotypic antimicrobial resistance profiles were determined by the broth microdilution method. The testing procedure was performed according to the Clinical and Laboratory Standards Institute (CLSI) M07 [20], and results were interpreted using CLSI M100 [21] breakpoints. A total of 20 antibiotics representing 12 antimicrobial classes were tested: Phenylpropanol class: CHL (Chloramphenicol); Quinolone class: NAL (Nalidixic acid) and CIP (Ciprofloxacin); Aminoglycoside class: GEN (Gentamicin) and AMK (Amikacin); Tetracycline class: TET (Tetracycline); Penicillin class: AMP (Ampicillin); Cephalosporins class: CFZ (Cefazolin), CXM (Cefuroxime), CPM (Cefepime), CAZ (Ceftazidime), CFX (Cefoxitin); Carbapenems class: IPM (Imipenem); β-lactam/β-lactam inhibitor complex:AMS (Ampicillin/Sulbactam), CTX/C (Cefotaxime/clavulanate); Macrolide class: AZM (Azithromycin); Folate pathway inhibitor class: SXT (Sulfamethoxazole/Trimethoprim); Polymyxin class: CT (Colistin), PB (Polymyxin). Escherichia coli ATCC 25922 was used as quality control strain. The minimal inhibitory concentration (MIC) was determined after incubation at 35 °C for 16–20 h. All phenotypic tests were performed in duplicate to ensure reproducibility, and results were recorded only when the quality control strain fell within acceptable MIC ranges. All antimicrobial agents were obtained from commercial sources (Shanghai Fuxing, Shanghai, China) and prepared according to CLSI guidelines. Multidrug resistance (MDR) was defined as resistance to three or more antimicrobial classes.
Genomic DNA was extracted from overnight bacterial cultures using the TIANamp Bacteria DNA Kit (Tiangen, Beijing, China) following the manufacturer’s instructions including enzymatic lysis with lysozyme (20 mg/mL) at 37 °C for 30 min, proteinase K digestion, and subsequent column-based purification. Genomic DNA quality and concentration were assessed by agarose gel electrophoresis and with a Qubit fluorometer (Thermo Fisher Scientific, Waltham, MA, USA). Whole-genome sequencing was performed on the Illumina xplus platform (PE 150). The average depth was 50× coverage.
Raw sequencing reads were trimmed for quality using Trimmomatic v0.39 and assembled using SPAdes v4.2.0. Genome quality was assessed with QUAST v5.3.0. Antimicrobial resistance genes (ARGs) were identified using ABRicate v1.0.1 against the ResFinder databases, with a minimum identity threshold of 80% and minimum coverage of 80%. Target gene mutations in quinolone resistance-determining regions (QRDRs) of gyrA, gyrB, parC, and parE were analyzed using PointFindertools (v3.0). Insertion sequence (IS) elements were identified using the ISfinder database through ABRicate. Virulence factor genes were detected using ABRicate against the Virulence Factor Database (VFDB) with the same thresholds. Multilocus sequence typing (MLST) was performed using MLST v2.19.0 based on the PubMLST scheme.
Statistical analyses were performed using R studio v4.1.2. The Kruskal–Wallis test was used to compare the mean numbers of antimicrobial resistance genes, insertion sequences, and virulence factors among serovars, followed by Dunn’s post hoc test for multiple comparisons. A p-value < 0.05 was considered statistically significant. Mean separation was indicated using superscript letters in tables. Figures were generated using itol online and R studio v4.1.2.

3. Results

3.1. The Detection Rate of Salmonella According to Different Classifications

From 2022 to 2024, a total of 2515 food samples were collected and classified into five categories based on isolated sources; 170 strains of Salmonella were detected from food samples (Table 1). Poultry exhibited the highest Salmonella detection rate at 28.88 %   ( 121 / 419 ) . Pork had a detection rate of 22.67% (17/75), followed by beef 4.83% (10/207). Other food sources (cooked meat products, raw sauce) had a detection rate of 1.63% (10/614); 144 strains of Salmonella were detected from 13670 diarrheal patients with suspected foodborne illness. Children aged 0–6 years had the highest Salmonella detection rate among clinical cases at 3.47% (70/2015).
Salmonella detection rates in food samples showed a distinct seasonal pattern (Table 2), with the highest rate observed in summer, at 14.06% (89/633), followed by autumn, at 6.64 %   ( 42 / 633 ) , spring, at 4.01 %   ( 25 / 624 ) , and winter, at 2.24 %   ( 14 / 625 ) . In clinical samples, summer had the highest number of positive clinical samples (91 cases), exceeding spring (22), autumn (29), and winter (2). During summer, there is an increase in the number of diarrheal patients with suspected foodborne illness. The detection rate in summer (1.24%) was lower than spring (2.02%) due to a 6.7-fold larger sample size (7346 vs. 1090), but the absolute burden of clinical cases remained highest in summer. In both the clinical and food samples, summer appears to be a season of significance. This suggests that environmental factors in summer, such as higher temperatures and humidity, may contribute to the proliferation and spread of Salmonella in both clinical and food-related contexts.

3.2. The Distribution of Salmonella Serovars with Different Classifications

Among food sources, different serovars show distinct prevalence patterns (Table 1). In poultry, S. Enteritidis is the most dominant serovar, accounting for 53.72% of the detected Salmonella isolates, followed by S. Kentucky (10.74%). For pork, S. Infantis and S. London are the most common, each making up 23.53% of the positive samples. The “other food sources” category includes cooked meat products and raw sauces, in which S. 4,[5],12:i:- showed a relatively higher prevalence (40.00%), suggesting potential post-processing contamination. Salmonella Enteritidis accounted for 20.00% in this category.
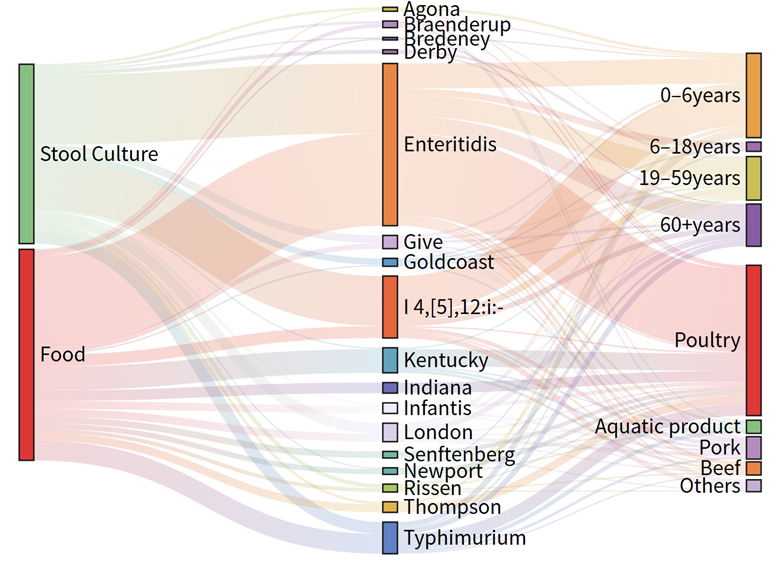
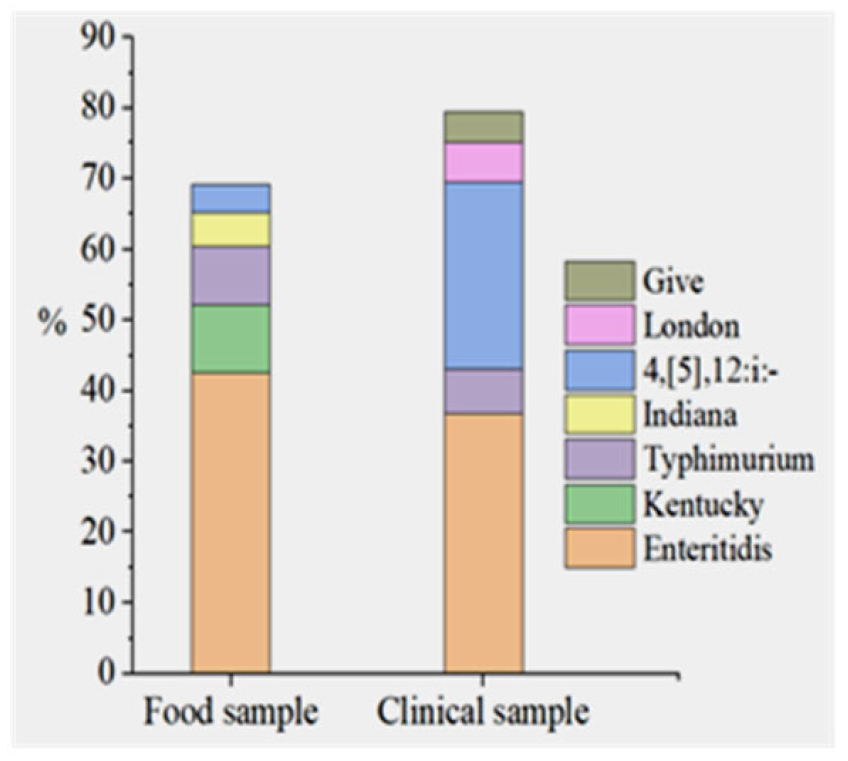
In the 0–6-year age group from clinics, S. 4,[5],12:i:—is the most common serovar, representing 41.43% of the detected isolates, while S. Enteritidis is the second most prevalent at 27.14%. Across most categories, S. Enteritidis was the dominant serovar, except for the 0–6 age group, where S. 4,[5],12:i:- prevailed. The top five serovars from both sources are presented in Figure 1. In both food and clinical samples, S. Enteritidis was the most prevalent serovar, accounting for 42.6% and 35.8%, respectively. Additionally, S. Typhimurium and S. 4,[5],12:i:- were detected in the top five serovars from both sources. The Sankey plot (Figure 2) and Table 1 shows that the distribution of Salmonella serovars is uneven among different sample types (food and stool cultures), age groups, and food categories. With a total of 126 isolates, S. Enteritidis shows a balanced distribution between food (57.94%) and stool samples (42.06%), indicating its role in both food contamination and clinical cases. Among the serovars, S. Indiana was exclusively isolated from food sources (100%), whereas S. Kentucky, while also predominantly food-associated (94.12%), was the only one of the two detected in clinical samples, albeit at a very low frequency (5.88%). The highest proportion in stool samples (84.44%) was observed for S. 4,[5],12:i:-, with only 15.56% from food, highlighting its role in human infections.

3.3. Antibiotic Susceptibility of Salmonella Isolates

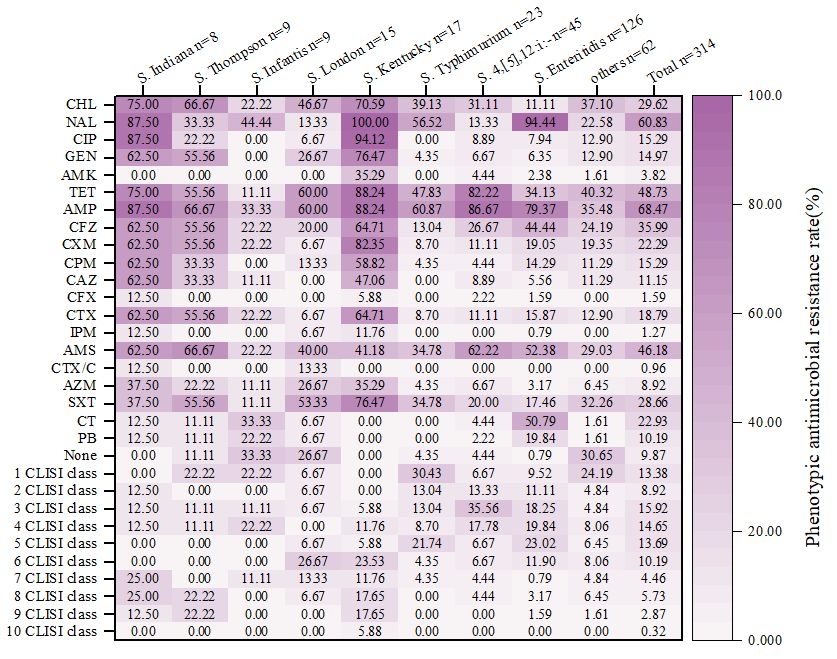
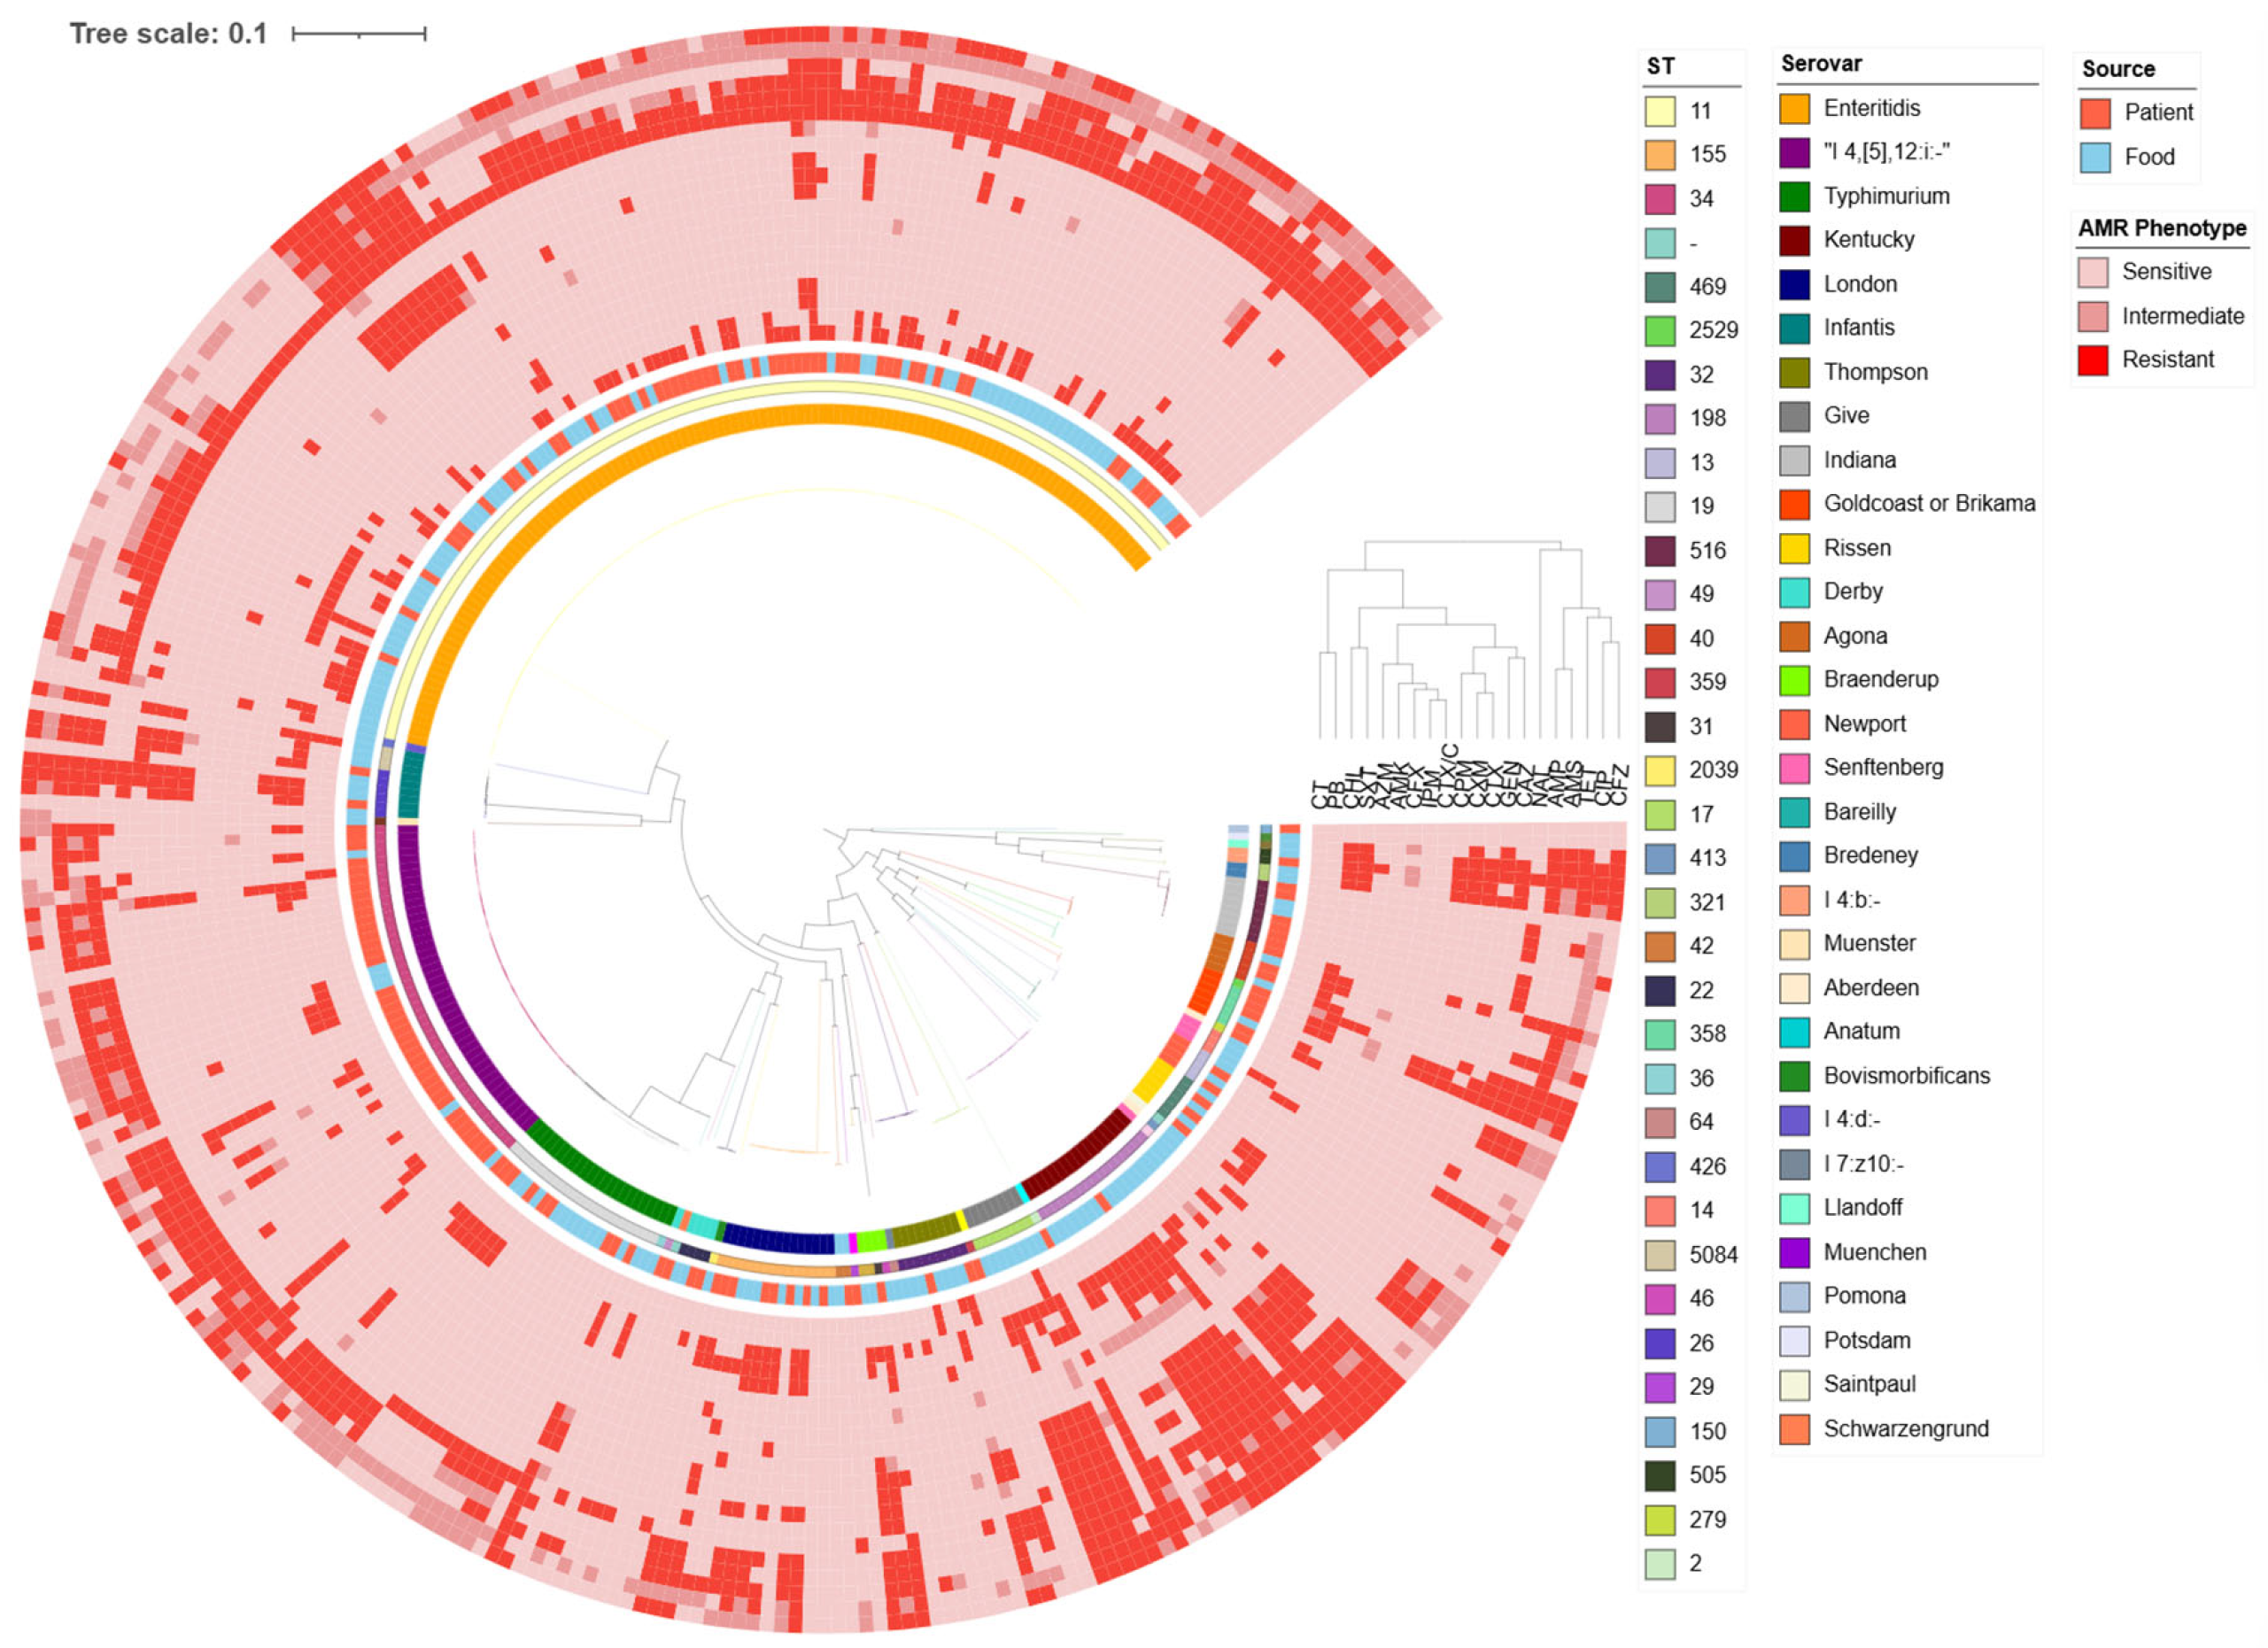
The AMR phenotype and AMR rate are presented in Figure A1 and Figure 3. Twenty antibiotics have been classified into twelve categories according to the 2024 version of the Clinical and Laboratory Standards Institute (CLSI) guidelines, Edition 34. Among a total of 314 Salmonella strains, the proportion of strains resistant to at least one antibiotic is 90.13%. The proportion of multidrug-resistant (MDR) strains, which are resistant to more than three CLSI class of antibiotics, is 67.83%. All Salmonella strains exhibit the highest resistance rate to AMP, which is 68.47%, followed by NAL (60.83%), TET (48.73%), and AMS (46.18%).
Some serovars show relatively high resistance rates to certain antimicrobials. Relatively high resistance rates to NAL were observed for S. Kentucky, S. Enteritidis, and S. Indiana, with the rates being 100%, 94.44%, and 87.50%, respectively. For another quinolone class antibiotic, CIP, the resistance rates of S. Kentucky and S. Indiana are 94.12% and 87.50%, respectively, which are significantly higher than those of other serovars. For TET, the resistance rates of S. Kentucky, S. 4,[5],12:i:, and S. Indiana are 88.24%, 82.22%, and 75%, respectively. Among the drugs tested, AMP has the highest resistance rate, with the resistance rates of S. Kentucky, S. 4,[5],12:i:, S. Indiana, and S. Enteritidis to AMP all exceeding 75%. Relatively high resistance rates to CAZ and CTX (third-generation cephalosporins: ceftazidime and cefotaxime) were also displayed by S. Indiana, S. Kentucky, and S. Thompson, which warrants vigilance. Most serovars are sensitive to amikacin (AMK), whereas the resistance rate of S. Kentucky to AMK is as high as 35.29%. Among the 12 CLSI classes of antibiotics, the highest level of resistance detected was to 10, observed in one strain of S. Kentucky isolated from poultry. Next, resistance to nine CLSI classes of antimicrobials was noted, with S. Indiana, S. Kentucky, and S. Thompson each accounting for more than 10% of such resistant isolates. For MDR (resistance to over three CLSI classes of antimicrobials), the highest resistance rates were seen in S. Kentucky (100%), followed by S. Indiana (87.5%), S. Enteritidis (78.57%), S. 4,[5],12:i:—(75.56%), S. Thompson (66.67%), S. London (60%), S. Typhimurium (52.17%), S. Infantis (44.44%), and others (40.32%).

3.4. Genotypic AMR Profiles of Predominant Salmonella Serovars

A total of 66 AMR genes were identified among 314 Salmonella isolates, conferring resistance to 10 different antimicrobial classes (Table A1). The distribution of these genes was highly heterogeneous, with distinct serovar-specific patterns and varying prevalence rates.
Aminoglycoside resistance was widespread across all serovars, with aac(6′)-Iaa detected in 100% of isolates across all tested serovars, indicating a conserved resistance mechanism. However, S. Indiana exhibited the highest prevalence of aminoglycoside resistance genes, including aac(3)-IVa (75.00%), aph(4)-Ia (75.00%), and ARR-3 (75.00%). High carriage of aac(3)-IId (64.71%), aadA7 (88.24%), and ARR-3 (64.71%) was observed in S. Kentucky, while S. 4,5,12:i:- and S. Thompson had a notable prevalence of aph(3)-Ib (91.11% and 66.67%, respectively) and aph(6)-Id (91.11% and 66.67%, respectively).
β-lactam resistance was dominated by blaTEM-1B, which was highly prevalent in S. Enteritidis (73.02%), S. Typhimurium (52.17%), S. 4,5,12:i:- (77.78%), and S. London (60.00%). The blaCTX-M-55 was the most broadly distributed ESBL gene, found in S. Indiana (50.00%), S. Kentucky (52.94%), S. Thompson (33.33%), and others. S. Kentucky uniquely harboring blaCTX-M-14b (23.53%) was observed, while S. Thompson and S. Infantis showed a preference for blaCTX-M-65 (44.44% and 33.33%, respectively). The plasmid-mediated AmpC gene blaCMY-2 was only detected in S. London (6.67%). Of particular clinical concern, blaNDM-9, a carbapenemase gene conferring resistance to last-line antibiotics, was detected exclusively in S. Indiana (12.50%).
Sulfonamide resistance was common, with sul2 detected in S. Enteritidis (47.62%), S. Typhimurium (34.78%), S. 4,5,12:i:- (86.67%), and S. Indiana (87.50%). sul1 was particularly prevalent in S. Indiana (75.00%) and S. Kentucky (94.12%), suggesting co-selection with other resistance determinants.
Tetracycline resistance was primarily mediated by tet(A), which was highly prevalent in S. Indiana (87.50%), S. Kentucky (88.24%), and S. London (73.33%). A unique pattern was observed in S. 4,5,12:i:-, where tet(B) was detected in 80.00% of isolates, indicating a distinct resistance mechanism.
Plasmid-mediated quinolone resistance (PMQR) genes were prevalent. qnrS1 was the most common, detected in nearly all serovars, with the highest rates in S. Thompson (77.78%), followed by S. London (40.00%) and S. Typhimurium (34.78%). The bifunctional gene aac(6′)-Ib-cr, which confers resistance to both aminoglycosides and ciprofloxacin, was found at alarmingly high rates in S. Indiana (75.00%), S. London (40.00%), and S. 4,[5],12:i:- (13.33%). The oqxAB efflux pump genes were primarily confined to S. Indiana (37.50%). Otherwise, the bacterial genes gyrA, gyrB, parC, and parE encode subunits of two essential type II topoisomerases: DNA gyrase (gyrA and gyrB) and topoisomerase IV (parC and parE). Point mutations within these genes, particularly in conserved regions designated as the quinolone resistance-determining regions (QRDRs), constitute a principal mechanism of acquired antimicrobial resistance. Mutations in the gyrB and parE gene were not detected across 314 isolations (Table A2). Remarkable variability in gyrA and parC mutation rates was observed among the serovars. Among the serovars, S. Indiana, S. Kentucky and S. Infantis also exhibited high mutation burdens, with S. Indiana showing 100% gyrA and 87.5% parC mutations, S. Kentucky showing 100% gyrA and 94.12% parC, and S. Infantis showing 100% parC and 33.33% gyrA mutations. A very high gyrA mutation rate (94.44%) but a very low parC mutation rate (5.56%) was displayed by S. Enteritidis, indicating that single gyrA mutations may be the primary mechanism for quinolone resistance in this serovar. With minimal mutations in gyrA (4.44%) and parC (4.44%), S. 4,[5],12:i:- exhibited the lowest overall mutation burden.
Regarding macrolide resistance genes, S. Indiana exhibited the highest prevalence, with 75.00% of isolates carrying mph(A). Moreover, this serovar was the only one in which mph(E) and msr(E) were detected (both at 12.50%). Notable levels of macrolide resistance were also shown by S. Kentucky and S. London, primarily driven by the mph(A) gene, with prevalence rates of 41.18% and 40.00%, respectively.
Strikingly, S. Indiana exhibited the highest prevalence of mcr-1.1, with 50.00% of its isolates carrying this gene. Simultaneously, it was the exclusive carrier of blaNDM-9 (12.50%), further cementing its status as a critical AMR reservoir.

3.5. Genotypic Features Among Different Salmonella Serovars

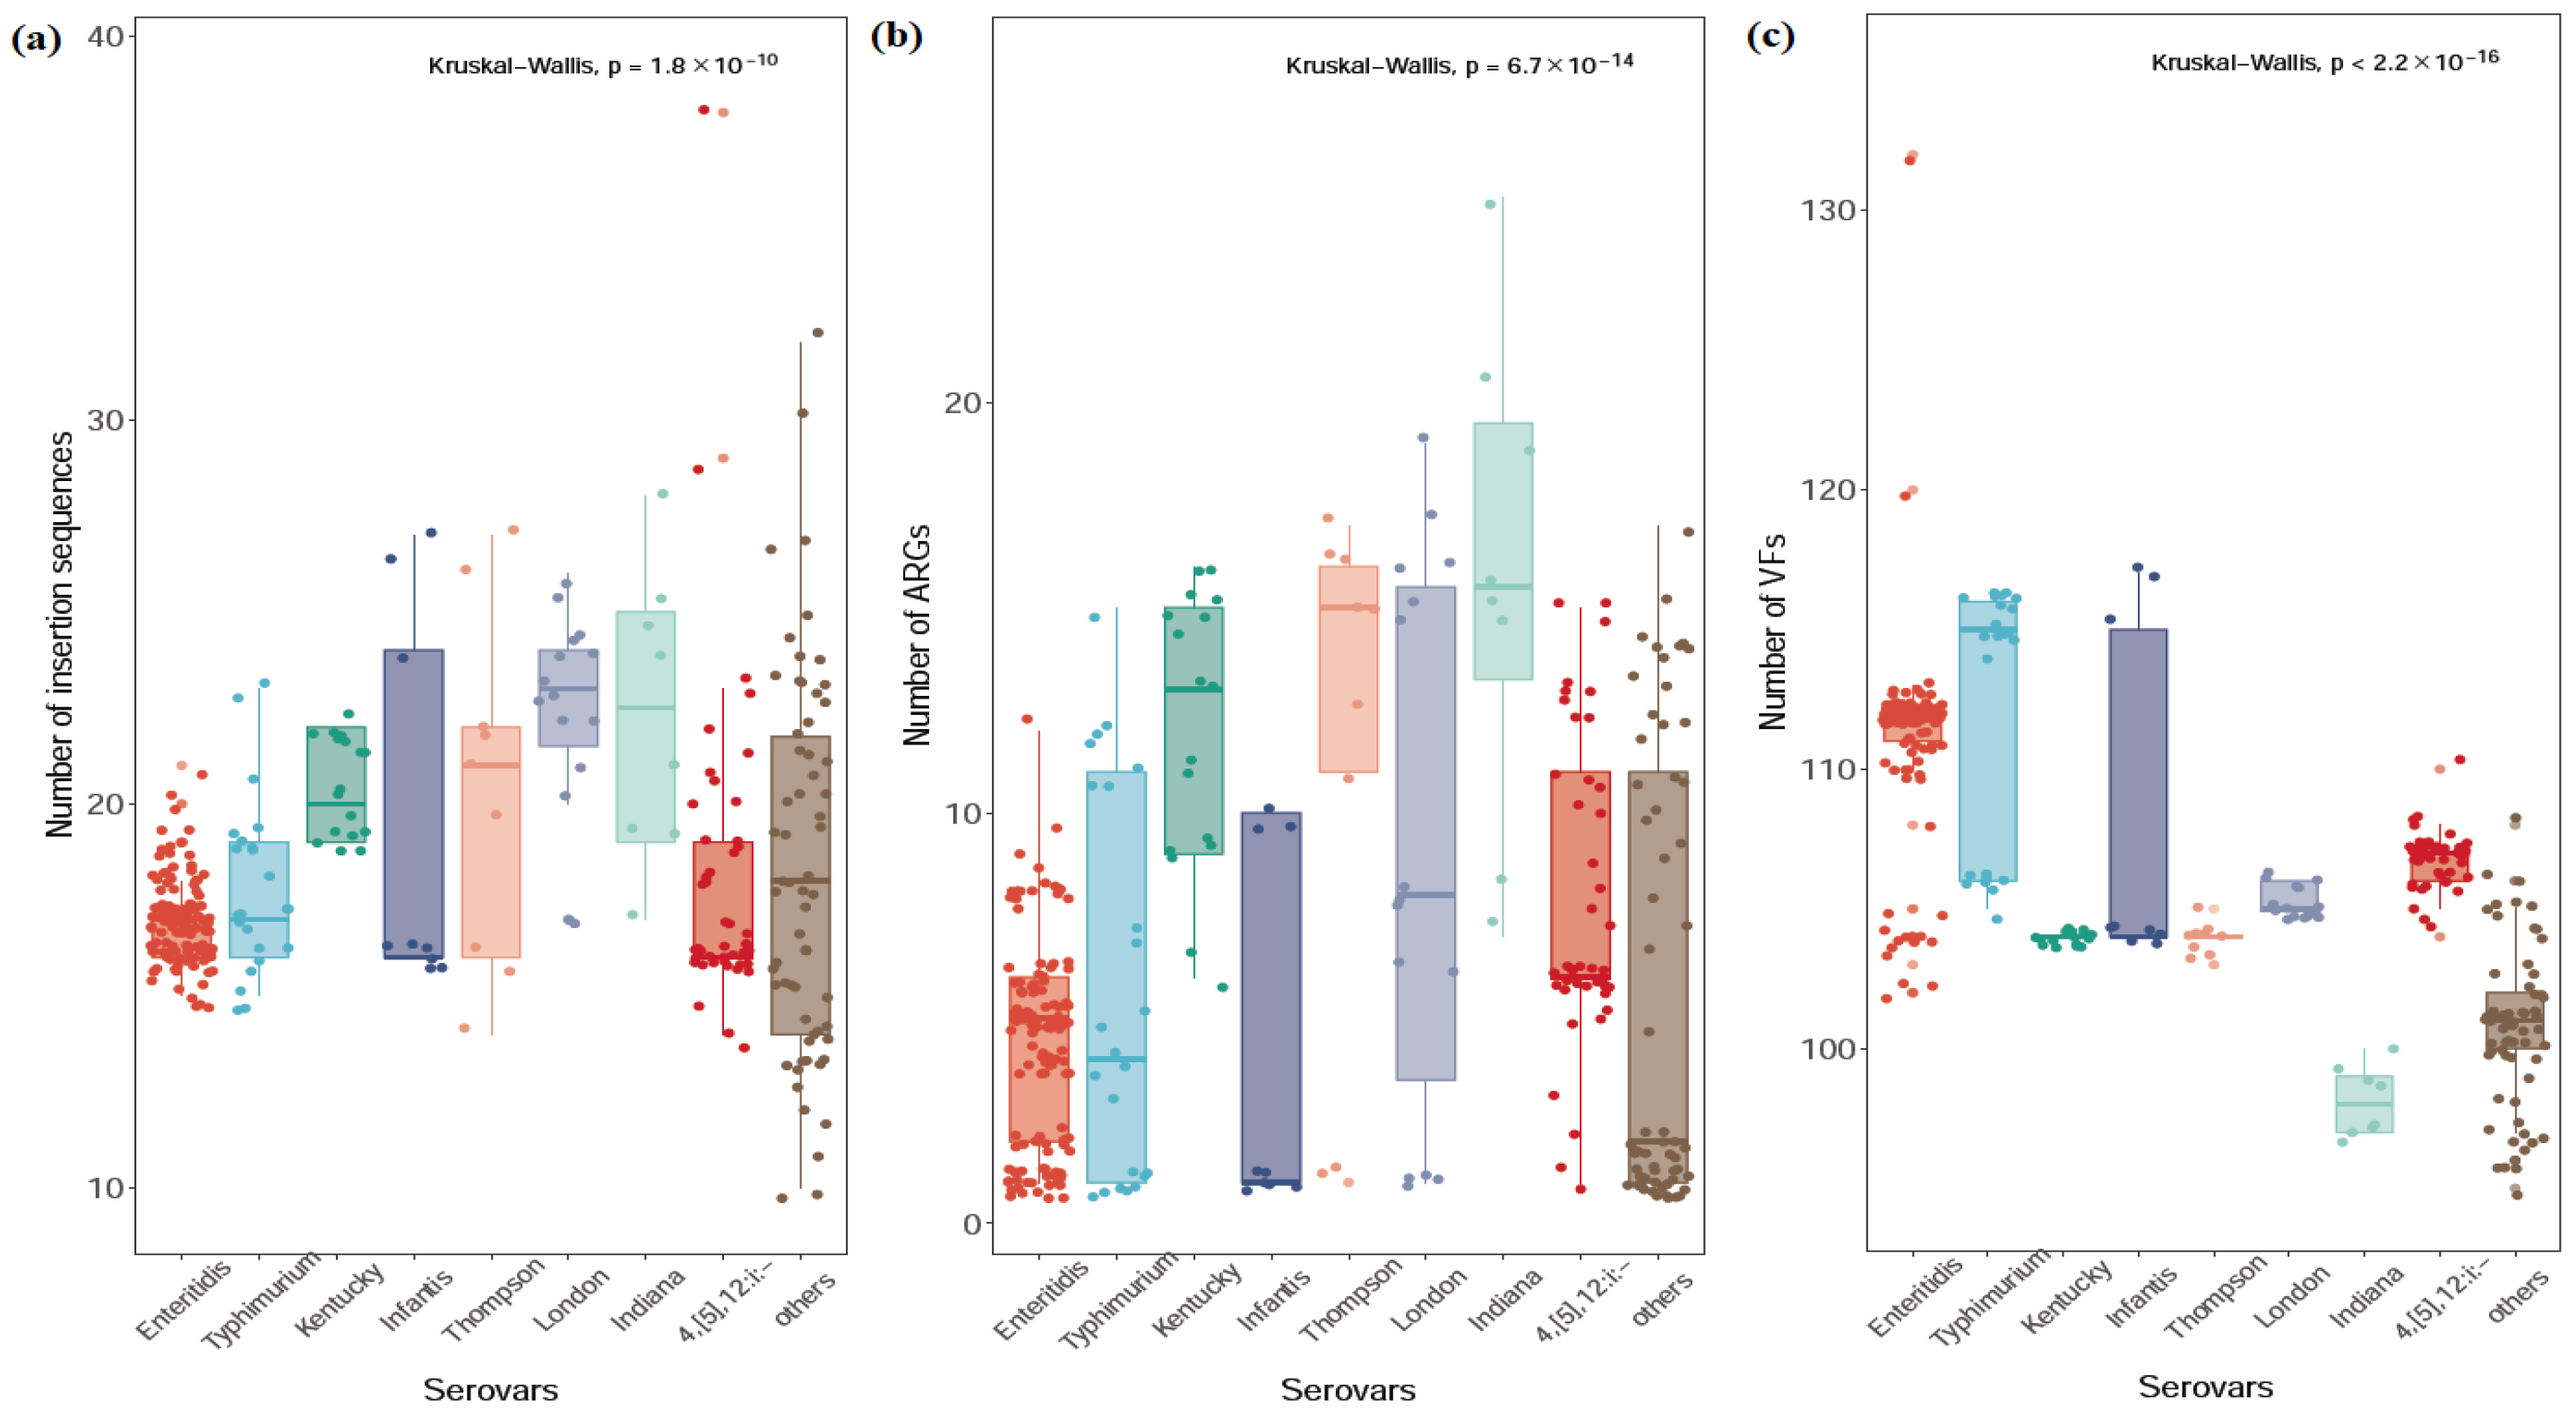
The mean number of ARGs varied significantly among the serovars, ranging from 4.00 to 15.75 (Figure 4 and Table A3). S. Indiana exhibited the highest mean ARG count 15.75 , n = 8 , significantly exceeding all other serovars (p < 0.05), indicating a markedly enriched resistome, followed by S. Kentucky (11.94, n = 17), S. Thompson (11.67, n = 9) and S. London (9.20, n = 15). In contrast, S. Enteritidis (4.30, n = 126), S. Infantis (4.00, n = 9), and other serovars (5.44, n = 62) harbored the lowest ARG counts, suggesting a more limited intrinsic resistance repertoire. Salmonella Typhimurium (5.70, n = 23) and S. 4,[5],12:i:- (7.73, n = 45) showed intermediate ARG levels.
A positive association was observed between high IS element counts and elevated ARG numbers. S. Indiana again demonstrated the highest mean IS element count (22.25), supporting a potential role of IS-driven genomic plasticity in ARG acquisition. Elevated IS counts were also observed in S. London (22.33), S. Kentucky (20.47), S. Thompson (20.44), and S. Infantis (19.22), suggesting enhanced mobilome activity in these serovars. Lower IS loads were found in S. Enteritidis (16.91), S. Typhimurium (17.83), S. 4,[5],12:i:- (18.13), and other serovars (18.18), indicating relatively stable genomic structures.
The Kruskal–Wallis test revealed a statistically significant difference in the mean number of virulence factors (VFs) across the Salmonella serovars (p < 2.2 × 10⁻¹⁶). As detailed in Table A3, S. Enteritidis and S. Typhimurium harbored the highest mean number of VFs, with 111.17 and 112.13, respectively. These were followed closely by S. Infantis (108.11) and S. 4,[5],12:i:- (107.06). Serovars such as S. Thompson, S. London, and other minor serovars exhibited moderate mean VF counts, ranging from 100.77 to 105.33. S. Indiana and S. Kentucky displayed the lowest mean number of VFs among the analyzed serovars, with a mean of 98.13.

4. Discussion

In this study, 314 strains of Salmonella isolated from food and clinical sources exhibited eight predominant serovars in Liaoning China between 2022 and 2024. Salmonella Enteritidis, the most prevalent serovar overall, exhibited broad epidemiological relevance, being detected across multiple food sources at 42.94% (73/170) and all clinical age groups at 35.81 % ( 53 / 144 ) . It was also the predominant serovar in raw poultry in this study, accounting for 53.72% of positive samples. This contrasts sharply with the serovar distribution in U.S. poultry, where S. Kentucky is dominant (35.47%) and S. Enteritidis ranks only third [22]. The predominance of S. Enteritidis in clinical isolates (35.81%) was similarly higher than in U.S. data (27.81%), mirroring the pattern observed in poultry [23].
Salmonella 4,[5],12:i:- is a monophasic variant of S. Typhimurium. Since the serotype first caused a major outbreak in Spain in the mid-1990s, it has rapidly spread globally [24]. Over the past two decades, it has become one of the top five serotypes responsible for human and animal infections [25]. Unlike other serovars prevalent in raw meat, this serovar was rarely detected there but showed a strong link to cooked meat and clinical cases, particularly in vulnerable populations (41.43% of cases in ages 0–6 years; 15.15% in >60 years), suggesting that contamination occurs later in the food chain. Accounting for 59% of cases in the United States and 28% in the United Kingdom, it has emerged as a dominant cause of human salmonellosis globally, consistent with its substantial burden in both the United States and Europe [26].
In our study, nearly all S. Indiana (100%) and S. Kentucky (94.12%) isolates originated from poultry with only rare clinical detection (Table A4, Figure 2), underscoring their strong food source predominance. A 2021–2024 duck study reported consistent findings, identifying S. Indiana (21.93%) and S. Kentucky (18.42%) as predominant serovars in poultry, with most isolates exhibiting high resistance to multiple antibiotics [27]. Consistent with their rare clinical detection in this study, all S. Kentucky isolates belonged to the poultry-adapted strain (ST198, n = 17 ) , which only occasionally infects humans [28,29].
The pronounced seasonal variation, with prevalence peaking in summer for both food (14.06%) and clinical samples (91 cases), reflects the environmental influence on Salmonella. Higher ambient temperatures during summer promote bacterial replication in food matrices and increase human exposure through outdoor food preparation and consumption patterns [30,31]. Our observation reflects the true burden of diarrheal illness during this season.
The overall prevalence of antimicrobial resistance in this study (90.13% AMR, 67.83% MDR) reflects the continued selective pressure exerted by antibiotic use. This pressure is especially pronounced in China, which ranks as the world’s largest producer and consumer of antibiotics, where the share used in animals accounts for more than half of the total consumption [32].
Aminoglycoside resistance genes were the most prevalent and diverse category identified in foodborne Salmonella isolates across multiple continents [33]. The gene aac(6′)-Iaa was universally present (100%) in all serovars. S. Kentucky (ST198) harbored the most diverse genes, with high carriage rates of aac(3)-Id (17.65%), aac(3)-IId (64.71%), aadA17 (52.94%), aadA7 (88.24%), and rmtB (17.65%), a 16S rRNA methylase conferring high-level pan-aminoglycoside resistance. The presence of rmtB is particularly concerning due to its potential for horizontal transfer and its association with clinically significant resistance. Recent genomic surveillance from China has similarly documented aac(3)-Id, aadA2, aadA7, and rmtB in S. Kentucky (ST198) isolates from both human clinical cases and food sources, confirming the persistence of this resistance profile in China [34,35].
The β-lactamase gene profile was dominated by the broad-spectrum blaTEM-1B, which was present in the majority of serovars, particularly S. Enteritidis (73.02%), S. 4,[5],12:i:- (77.78%), and S. London (60.00%). The World Health Organization has classified ESBL-producing Enterobacteriaceae as high-priority pathogens, underscoring the global significance of these findings. In this study, blaCTX-M-55, a common ESBL variant in food animals, was detected in S. Indiana (50.00%), S. Kentucky (52.94%), and S. Thompson (33.33%). The detection of blaCTX-M-14, blaCTX-M-65, and blaCTX-M-123 highlights the diversity of ESBL genes circulating in these serovars. One S. Indiana strain (ST17) isolated from chicken carried blaNDM-9, a carbapenemase gene conferring resistance to last-line carbapenem antibiotics. This finding aligns with the recent and ongoing emergence of extensively drug-resistant S. Indiana harboring blaNDM-9 across multiple regions in China, including Fujian and Shanghai, raising concerns for public health [36,37,38].
Resistance to folate pathway inhibitors was mediated by a combination of sul and dfrA genes. sul1 and sul2 were the predominant sulfonamide resistance genes. The sul2 gene was particularly frequent in S. 4,[5],12:i:- (86.67%) and S. Indiana (87.50%), while sul1 was ubiquitous in S. Kentucky (94.12%). The dfrA genes (conferring trimethoprim resistance) showed serovar-specific associations. The dfrA14 gene was common in S. Kentucky (64.71%) and S. Thompson (66.67%), while dfrA12 was associated with S. Typhimurium (21.74%) and S. London (33.33%).
Tetracycline resistance was primarily conferred by tet(A) and tet(B). The tet(A) gene was widespread, with extremely high prevalence in S. Indiana (87.50%), S. Kentucky (88.24%), and S. London (73.33%). In contrast, tet(B) was almost exclusively found in S. 4,[5],12:i:- (80.00%). This pronounced serovar-specific partitioning is consistent with global observations, wherein S. 4,[5],12:i:- frequently harbors tet(B) as an integral component of the classical ASSuT MDR module [26,39]. In addition to tet(B), this module comprises blaTEM-1B (77.78%), aph(3)-Ib/aph(6)-Id (91.11%), and sul2 (86.67%) in this study, collectively conferring resistance to ampicillin, streptomycin, sulfisoxazole, and tetracycline.
Beyond the stable core ASSuT module, our data suggest that this successful clone is increasingly acting as a platform for the acquisition of additional resistance determinants. Within the S. 4,[5],12:i:-, we observed notable co-carriage of ARR-3 (24.44%), which confers rifampicin resistance, as well as the plasmid-mediated quinolone resistance (PMQR) genes aac(6′)-Ib-cr (13.33%) and qnrS1 (26.67%). This evolutionary trajectory mirrors findings from international surveillance; for instance, a U.S. study reported that 16% of isolates within the MDR clade harbored genetic determinants associated with decreased susceptibility to ciprofloxacin, ceftriaxone, or azithromycin [40].
Regarding macrolide resistance, S. Indiana exhibited the highest carriage rate of mph(A) at 75.00%, followed by S. Kentucky (41.18%) and S. London (40.00%). In contrast to S. Indiana and S. Kentucky, which were predominantly poultry-associated, S. London in this study was primarily recovered from pork samples (Table 1). A recent surveillance of retail pork in Sichuan, China, revealed S. London as the dominant serovar, exhibiting a 47.83% carriage rate of the mph(A) gene [41]. The mph(A) carriage rates in China far exceed azithromycin resistance prevalence in the EU (1.90%) and US (4.09%) [15,16], highlighting stronger selective pressure for macrolide resistance in Chinese swine and poultry sectors.
PMQR genes and target mutations were widely distributed. The qnrS1 gene was prevalent, peaking in S. Thompson (77.78%) and S. London (40.00%). The aac(6′)-Ib-cr gene was alarmingly high in S. Indiana (75.00%), S. London (40.00%), and S. 4,[5],12:i:- (13.33%), while oqxAB was mainly confined to S. Indiana (37.50%). The gyrA gene mutations correlated strongly with NAL resistance: S. Indiana and S. Kentucky exhibited 100% gyrA mutations and complete NAL resistance, followed by S. Enteritidis (94.44% for both). Consistent with previous reports [42,43], gyrA mutations alone did not confer CIP resistance without parC alterations. Accordingly, S. Indiana, S. Kentucky, and S. Thompson exhibited nearly complete CIP resistance (95–100%) alongside high parC mutation rates, underscoring the critical role of parC in fluoroquinolone resistance.
Quantitative analysis revealed fundamental, serovar-specific differences in resistance architecture: AMR distribution correlates with distinct mobile genetic element burdens and gene repertoires [44]. This association was evident in the highest-burden serovars: S. London (22.33 IS; 9.20 ARGs), S. Indiana (22.25; 15.75), and S. Kentucky (20.47; 11.94). Conversely, S. Enteritidis displayed the lowest mean IS element count (16.91) and the second-lowest ARG burden (4.30). The MDR rates across serovars in our study revealed distinct groupings.
Our analysis of the mean number of VFs across different serovars (Table A3 and Figure 4) revealed a high degree of concordance with their prevalence in clinical isolates. S. Enteritidis, the most frequently isolated serovar from clinical samples (37.5%), possessed the highest mean VF count among all serovars analyzed (111.17). This finding aligns with previous genomic studies demonstrating that S. Enteritidis consistently harbors a complete set of pathogenicity islands (SPIs 1–5, 12–14, 16–17) and plasmid-encoded virulence genes that contribute to its epidemiological success [45]. Salmonella 4,[5],12:i:-, ranking second in clinical samples (27.08%), demonstrated a mean VF count of 107.06. Conversely, serovars such as S. Kentucky and S. Indiana, which were prominent in food samples, but not among the top clinical isolates, exhibited the lowest mean VF counts (104.00 and 98.13, respectively). This inverse relationship between food prevalence and VF counts suggests that while these serovars successfully contaminate the food supply, their reduced virulence potential limits their ability to cause human disease [46]. However, the presence of elevated antimicrobial resistance gene (ARG) and insertion sequence (IS) loads in S. Kentucky and S. Indiana—despite their lower VF counts—underscores their importance in risk assessment and surveillance. These genetic features indicate adaptation to agricultural environments where antimicrobial selection pressure is intense, and they retain the potential to serve as reservoirs for resistance determinants that could be horizontally transferred to more virulent serovars [47]. Thus, the convergence of resistance determinants in these serovars poses a persistent threat, warranting targeted interventions beyond virulence-based risk assessment. To mitigate the spread of Salmonella and its antimicrobial resistance, targeted interventions should include enhanced surveillance during peak summer months and prudent antibiotic use in livestock production, particularly in poultry farming. These measures are essential to reduce the burden of multidrug-resistant serovars such as S. Indiana and S. Kentucky.

5. Conclusions

This comprehensive genomic surveillance conducted in Liaoning Province from 2022 to 2024 elucidates the intricate epidemiological and resistome profiles of non-typhoidal Salmonella (NTS) at the human–food interface. Our findings demonstrate a pronounced seasonal peak in summer, underscoring the role of environmental factors in Salmonella transmission. The serovar distribution was markedly source-specific: while S. Enteritidis was the predominant serovar across both food and clinical settings, Salmonella 4,[5],12:i:- exhibited a unique epidemiological niche, rarely detected in raw meat but predominantly isolated from cooked/processed food products and clinical samples from vulnerable populations, and genomically harbored the classical ASSuT resistance module. Alarmingly, the study reveals a high prevalence of multidrug resistance (67.83%), with specific serovars like S. Indiana and S. Kentucky serving as critical reservoirs of clinically significant resistance genes, including blaNDM-9, mcr-1.1, and rmtB. These serovars exhibited extensive MDR phenotypes linked to high ARGs and IS loads, indicating their role as platforms for horizontal gene transfer. Conversely, the epidemiological success of S. Enteritidis appears to be driven by its high virulence factor (VF) load rather than extensive AMR.
These findings underscore the urgent need for integrated “One Health” surveillance bridging food safety and clinical antimicrobial stewardship. Targeted interventions in livestock production, particularly poultry farming, are critical to mitigating the public health threat posed by multidrug-resistant Salmonella. An emphasis should be placed on seasonal risk communication, post-processing food hygiene, and antimicrobial stewardship programs to address the distinct transmission dynamics and resistance reservoirs identified in this study.

Author Contributions

Conceptualization, methodology, writing—original draft preparation, M.Z. (Mingyan Zhang); validation, formal analysis, funding acquisition, L.Y.; investigation, formal analysis, M.L.; investigation, M.Z. (Meimei Zhang); investigation, formal analysis, W.W.; investigation, data curation, H.L.; data curation, validation, Y.G., M.Y., J.M. and Q.W.; project administration, resources, W.D.; writing—review and editing, supervision, Y.W. All authors have read and agreed to the published version of the manuscript.

Funding

This study was supported by Key Research Project of Liaoning Province—Technology for Improving People’s Livelihood No. 2024JH2/102500079; Liaoning Provincial Key Laboratory of Emergency Response and Etiological Detection of Infectious Diseases; Talent Development Program for Public Health Professionals; and Liaoning Provincial Key Laboratory of Air Haze and Population Health Monitoring.

Institutional Review Board Statement

This study was approved by the Liaoning Province Liaoning Provincial Center for Disease Control and Prevention Bioethics Committee (No. LNCDCEC-2024-010; approve date: 24 December 2024).

Informed Consent Statement

Patient consent was waived due to the research involved retrospective analysis of de-identified data and leftover clinical isolates from routine laboratory surveillance, with no direct interaction with human subjects.

Data Availability Statement

The original contributions presented in this study are included in the article. Further inquiries can be directed to the corresponding authors.

Conflicts of Interest

The authors declare no conflicts of interest.

Appendix A

Table A1. The genotypic AMR profiles per isolate of the predominant Salmonella serovars.
ClassificationsGenesGenotypic AMR Rate (%)
S. Enteritidis
(n = 126)
S. Typhimurium
(n = 23)
S. 4,[5],12:i:-
(n = 45)
S. Indiana
(n = 8)
S. Infantis
(n = 9)
S. Kentucky
(n = 17)
S. London
(n = 15)
S. Thompson
(n = 9)
Others
(n = 62)
Aminoglycosidesaac(3)-Id0.000.000.000.000.0017.650.000.000.00
 aac(3)-IIa0.000.000.000.000.000.000.000.001.61
 aac(3)-IVa0.000.006.6775.0033.330.006.6744.446.45
 aac(3)-IId2.380.004.440.000.0064.7140.0022.228.06
 aac(6′)-Iaa100.00100.00100.00100.00100.00100.00100.00100.00100.00
 aadA10.000.000.000.000.000.000.000.004.84
 aadA160.008.7011.110.000.000.0040.000.003.23
 aadA170.000.000.000.000.0052.940.000.000.00
 aadA20.0021.740.0012.500.000.000.0044.4419.35
 aadA220.000.000.000.000.000.000.000.001.61
 aadA510.320.000.0037.500.000.000.000.001.61
 aadA70.000.000.000.000.0088.240.000.000.00
 aadA8b0.000.000.000.000.000.0033.330.000.00
 ant(3″)-Ia1.5921.746.6712.5033.3317.656.6733.3317.74
 aph(3′)-Ia0.000.004.4437.5033.33100.000.0066.6714.52
 aph(3″)-Ib58.7326.0991.1137.500.0017.6540.0044.444.84
 aph(3′)-IIa3.970.000.000.000.000.000.000.000.00
 aph(4)-Ia0.000.006.6775.0033.330.000.0044.446.45
 aph(6)-Id58.7326.0991.1162.500.0017.6540.0066.6716.13
 rmtB0.000.000.000.000.0017.650.000.000.00
 armA0.000.000.0012.500.000.000.000.000.00
 ARR-30.008.7024.4475.000.0064.7133.3366.6720.97
β-lactamsblaCMY-20.000.000.000.000.000.006.670.000.00
 blaCTX-M-1230.000.000.0012.500.000.000.000.000.00
 blaCTX-M-147.940.004.440.000.000.000.000.000.00
 blaCTX-M-14b0.000.000.000.000.0023.530.000.000.00
 blaCTX-M-270.004.350.000.000.000.000.000.000.00
 blaCTX-M-553.170.002.2250.000.0052.940.0033.339.68
 blaCTX-M-640.004.350.000.000.000.000.000.000.00
 blaCTX-M-650.000.008.8925.0033.330.000.0044.443.23
 blaNDM-90.000.000.0012.500.000.000.000.000.00
 blaOXA-10.000.002.2275.000.000.000.000.001.61
 blaOXA-100.000.0011.110.000.000.006.6744.444.84
 blaTEM-1270.790.000.000.000.000.000.000.000.00
 blaTEM-1413.170.000.000.000.0041.180.000.000.00
 blaTEM-1A0.000.000.000.000.000.000.000.001.61
 blaTEM-1B73.0252.1777.7825.000.0011.7660.0033.3324.19
PhenylpropanolscatA20.000.000.000.000.000.0020.000.000.00
 catB30.000.002.2275.000.000.000.000.001.61
 cmlA10.7921.7411.110.000.000.006.6733.3319.35
 floR2.3834.7835.5662.5033.3376.4746.6766.6732.26
SulfonamidesdfrA10.000.000.000.000.005.880.000.000.00
 dfrA120.0021.740.0025.000.000.0033.330.0014.52
 dfrA141.590.0015.560.0033.3364.716.6766.6717.74
 dfrA1710.320.000.0037.500.000.000.000.001.61
 dfrA270.008.7011.110.000.000.0040.000.003.23
 sul10.008.7011.1175.0033.3394.1240.000.008.06
 sul247.6234.7886.6787.500.000.0040.000.0020.97
 sul30.0021.740.0012.500.000.0033.3366.6724.19
FosfomycinsfosA310.320.000.0037.500.0041.180.0022.220.00
 fosA70.000.000.000.000.000.000.000.0014.52
Lincosamideslnu(F)0.000.004.4425.000.0070.590.0066.678.06
Polymyxinsmcr-1.10.000.000.0050.000.000.000.0011.110.00
Macrolidesmph(A)0.008.704.4475.000.0041.1840.0022.226.45
 mph(E)0.004.350.0012.500.000.000.000.001.61
 msr(E)0.004.350.0012.500.000.000.000.001.61
QuinolonesoqxA0.004.350.0037.500.000.006.670.001.61
 oqxB0.004.350.0037.500.000.006.670.001.61
 qnrB190.000.000.000.000.000.000.000.0012.90
 qnrB60.000.002.220.000.000.0033.330.003.23
 qnrS17.1434.7826.670.000.0023.5340.0077.7829.03
 qnrS20.004.352.2212.500.000.000.000.001.61
 aac(6′)-Ib-cr0.004.3513.3375.000.000.0040.000.003.23
Tetracyclinestet(A)26.1943.4813.3387.5033.3388.2473.3344.4432.26
 tet(B)0.000.0080.000.000.000.000.000.001.61
 tet(M)0.0030.430.000.000.000.000.000.008.06
Table A2. Occurrence of quinolone target gene mutations in predominant Salmonella serovars.
GeneQuinolone Target Gene Mutation Rate (%)
S. Enteritidis
(n = 126)
S. Typhimurium
(n = 23)
S. 4,[5],12:i:-
(n = 45)
S. Indiana
(n = 8)
S. Infantis
(n = 9)
S. Kentucky
(n = 17)
S. London
(n = 15)
S. Thompson
(n = 9)
Others
(n = 62)
gyrA94.4452.174.4410033.3310013.3311.1111.3
gyrB000000000
parC5.5604.4487.510094.1273.3388.8988.71
parE000000000
Table A3. Mean number of genetic elements in different Salmonella serovars.
IndexS. Enteritidis
(n = 126)
S. Typhimurium
(n = 23)
S. 4,[5],12:i:-
(n = 45)
S. Indiana
(n = 8)
S. Infantis
(n = 9)
S. Kentucky
(n = 17)
S. London
(n = 15)
S. Thompson
(n = 9)
Others
(n = 62)
Mean number of ARGs4.30 a5.70 ab7.73 ab15.75 c4.00 a11.94 b9.20 b11.67 b5.44 a
Mean number of IS elements16.91 a17.83 a18.13 a22.25 b19.22 a20.47 b22.33 b20.44 b18.18 a
Mean number of VFs111.17 c112.13 c107.06 bc98.13 a108.11 b103.97 ab105.33 ab103.89 ab100.77 a
Footnote: Different superscript letters (a, b, c) in the same row denote statistically significant differences among serovars based on Dunn’s test after the Kruskal–Wallis test (p < 0.05). Serovars sharing the same letter are not significantly different.
Table A4. Distribution of Salmonella Serovars by Source: Food and Stool Cases.
Salmonella SerovarNumber of Isolates from Food SourcesNumber of Isolates from Stool SamplesTotal Number of Isolates
S. Enteritidis7353126
S. 4,[5],12:i:-73845
S. Typhimurium14923
S. Kentucky16117
S. London7815
S. Infantis729
S. Thompson729
S. Indiana808
Figure A1. This circular phylogenetic tree illustrates the evolutionary relationships among different serovars of Salmonella, presenting a multi-layered view of relevant characteristics. The innermost ring is color-coded to represent different Salmonella serovars. The second ring from the inside showcases the ST of the Salmonella isolates. The third ring from the inside indicates the source of the Salmonella isolates. The outermost ring displays the antimicrobial resistance (AMR) phenotype. From inner to outer, the drugs corresponding to the resistance markers are as follows: CT, PB, CHL, SXT, AZM, AMK, CFX, IPM, CTX/C, CPM, CXM, CTX, GEN, CAZ, NAL, AMP, AMS, TET, CIP, CFZ.
Microorganisms 14 00823 g0a1

References

  1. Nemhauser, J.B. (Ed.) CDC Yellow Book 2024: Health Information for International Travel; Oxford University Press: New York, NY, USA, 2023. [Google Scholar]
  2. Kirk, M.D.; Pires, S.M.; Black, R.E.; Caipo, M.; A Crump, J.; Devleesschauwer, B.; Döpfer, D.; Fazil, A.; Fischer-Walker, C.L.; Hald, T.; et al. World Health Organization estimates of the global and regional disease burden of 22 foodborne bacterial, protozoal, and viral diseases, 2010: A Data Synthesis. PLoS Med. 2015, 12, e1001921, Erratum in PLoS Med. 2015, 12, e1001940. https://doi.org/10.1371/journal.pmed.1001940. [Google Scholar] [CrossRef] [Scilit]
  3. Brenner, F.W.; Villar, R.G.; Angulo, F.J.; Tauxe, R.; Swaminathan, B. Salmonella nomenclature. J. Clin. Microbiol. 2000, 38, 2465–2467. [Google Scholar] [CrossRef] [Scilit] [PubMed]
  4. Galán-Relaño, Á.; Valero Díaz, A.; Huerta Lorenzo, B.; Gómez-Gascón, L.; Rodríguez, M.Á.M.; Jiménez, E.C.; Rodríguez, F.P.; Márquez, R.J.A. Salmonella and Salmonellosis: An update on public health implications and control strategies. Animals 2023, 13, 3666. [Google Scholar] [CrossRef] [Scilit]
  5. CDC. About Salmonella Infection. Available online: https://www.cdc.gov/Salmonella/ (accessed on 9 March 2026).
  6. Bush, L.M.; Vazquez-Pertejo, M.T. Nontyphoidal Salmonella infections. In Merck Manual Professional Edition; Merck & Co.: Rahway, NJ, USA, 2024. [Google Scholar]
  7. Mai, C.; Hou, G.; Chen, X.; Shi, L.; Li, X. Non-typhoidal Salmonella bacteremia complicated by aortic dissection: A case report and literature review. Chin. J. Emerg. Med. 2025, 34, 1131–1134. [Google Scholar] [CrossRef]
  8. Foley, S.L.; Lynne, A.M. Food animal-associated Salmonella challenges: Pathogenicity and antimicrobial resistance. J. Anim. Sci. 2008, 86, E173–E187. [Google Scholar] [CrossRef] [Scilit]
  9. WHO. Invasive non-typhoidal Salmonella (iNTS) disease. In Immunization, Vaccines and Biologicals; World Health Organization: Geneva, Switzerland, 2022. [Google Scholar]
  10. Chen, J.; Huang, L.; An, H.; Wang, Z.; Kang, X.; Yin, R.; Jia, C.; Jin, X.; Yue, M. One Health approach probes zoonotic non-typhoidal Salmonella infections in China: A systematic review and meta-analysis. J. Glob. Health 2024, 14, 04187. [Google Scholar] [CrossRef] [Scilit] [PubMed]
  11. Li, Y.; Liu, L.; Bai, L.; Liu, Z.; Li, N.; Kang, W.; Yang, D.; Peng, Z.; Niu, L. Spatio-temporal prevalence and distribution of Salmonella spp. serovars in animal-origin foods in China: A comprehensive outlook derived from nine years of national surveillance, 2014–2022. Food Res. Int. 2025, 219, 116931. [Google Scholar] [CrossRef] [Scilit] [PubMed]
  12. WHO Bacterial Priority Pathogens List, 2024: Bacterial Pathogens of Public Health Importance to Guide Research, Development and Strategies to Prevent and Control Antimicrobial Resistance. Available online: https://www.who.int/publications/i/item/9789240093461 (accessed on 9 March 2026).
  13. Lv, P.; Pei, Y.; Jiang, Y.; Wang, Q.; Liu, Y.; Qu, M.; Xu, X.; Chen, M.; Wang, Y. Genomic insights into antibiotic-resistant non-typhoidal Salmonella isolates from outpatients in Minhang District in Shanghai. Commun. Med. 2025, 5, 950. [Google Scholar] [CrossRef] [Scilit]
  14. FDA. NARMS Now; U.S. Department of Health and Human Services: Rockville, MD, USA, 2024. [Google Scholar]
  15. European Food Safety Authority (EFSA); European Centre for Disease Prevention and Control (ECDC). The European Union Summary Report on Antimicrobial Resistance in Zoonotic and Indicator Bacteria from Humans, Animals and Food in 2020/2021. EFSA J. 2023, 21, e07867. [Google Scholar] [CrossRef] [Scilit]
  16. Khan, S.; Zada, S.; Ali, A.; Shah, M.A.; Khan, S.; Khan, A.U. Antimicrobial resistance in Salmonella: One Health perspective on global food safety challenges. Sci. One Health 2025, 4, 100117. [Google Scholar] [CrossRef] [Scilit]
  17. Nambiar, R.B.; Elbediwi, M.; Ed-Dra, A.; Wu, B.; Yue, M. Epidemiology and antimicrobial resistance of Salmonella serovars Typhimurium and 4,[5],12:i- recovered from hospitalized patients in China. Microbiol. Res. 2024, 283, 127631. [Google Scholar] [CrossRef] [Scilit]
  18. Zhang, X.X.; Huang, X.; Li, X.Q.; Wang, Z.; Jiang, Y.; Jiao, X.; Li, Q.; Wang, J.; Zhong, F. Emergence of ciprofloxacin-and tigecycline-resistant extended-spectrum β-lactamase (ESBL)-producing Salmonella enterica serovar Kentucky ST198 from horse, China. J. Glob. Antimicrob. Resist. 2025, 44, 207–210. [Google Scholar] [CrossRef] [Scilit] [PubMed]
  19. GB 4789.4-2024; National Food Safety Standard—Food Microbiological Examination—Salmonella. National Health Commission of the People’s Republic of China, State Administration for Market Regulation: Beijing, China, 2024.
  20. CLSI M07; Methods for Dilution Antimicrobial Susceptibility Tests for Bacteria That Grow Aerobically, 12th ed. Clinical and Laboratory Standards Institute: Wayne, PA, USA, 2024.
  21. CLSI M100; Performance Standards for Antimicrobial Susceptibility Testing, 34th ed. Clinical and Laboratory Standards Institute: Wayne, PA, USA, 2024.
  22. Sohail, N.; Sodagari, H.; Varga, C. Differences in the prevalence and antimicrobial resistance among non-typhoidal Salmonella serovars isolated from retail chicken meat across the United States of America, 2013–2020. Foodborne Pathog. Dis. 2024, 21, 789–798. [Google Scholar] [CrossRef] [Scilit]
  23. Johnson, K.A.; Bainbridge, E.D.; Salmonellosis. Current Medical Diagnosis & Treatment 2024, 63rd ed.; McGraw-Hill Education: New York, NY, USA, 2024; Available online: https://accessmedicine.mhmedical.com/content.aspx?bookid=3594&sectionid=299552527 (accessed on 30 March 2026).
  24. Nakamura, M. Origin of Salmonella enterica subspecies enterica serovar 4,[5],12:i- (the monophasic variant of S. Typhimurium) and the prevalence of this serovar in Japan and worldwide. J. Jpn. Soc. Poult. Dis. 2016, 52, 3–12. [Google Scholar]
  25. Huang, D.; Wu, Z.; Jiang, Y.; Hu, L.; Cai, R.; Yang, X.; Du, C.; Chen, S.; Yang, P.; Guo, B.; et al. Plasmid-driven clonal expansion of multidrug-resistant monophasic Salmonella Typhimurium in a global food trade hub. mBio 2026, 17, e00542-26. [Google Scholar] [CrossRef] [Scilit]
  26. Trachsel, J.M.; Bearson, B.L.; Brunelle, B.W.; Bearson, S.M.D. Relationship and distribution of Salmonella enterica serovar I 4,[5],12:i:- strain sequences in the NCBI Pathogen Detection database. Front. Microbiol. 2022, 13, 845872. [Google Scholar] [CrossRef] [Scilit]
  27. Chen, J.; Li, X.; Liu, Y.; Rong, W.; Fu, L.; Wang, S.; Li, Y.; Duan, X.; Zhao, Y.; Guo, L. Comprehensive Analysis of the Molecular Epidemiological Characteristics of Duck-Derived Salmonella in Certain Regions of China. Microbiol. Res. 2025, 16, 184. [Google Scholar] [CrossRef] [Scilit]
  28. Richards, A.K.; Kue, S.; Norris, C.G.; Shariat, N.W. Genomic and phenotypic characterization of Salmonella enterica serovar Kentucky. Microb. Genom. 2023, 9, 001089. [Google Scholar] [CrossRef] [Scilit]
  29. Saraiva, M.M.S.; Benevides, V.P.; Da, S.N.M.V.; Varani, A.d.M.; Neto, O.C.d.F.; Berchieri, Â.; Delgado-Suárez, E.J.; Rocha, A.D.d.L.; Eguale, T.; Munyalo, J.A.; et al. Genomic and Evolutionary Analysis of Salmonella enterica Serovar Kentucky Sequence Type 198 Isolated from Livestock in East Africa. Front. Cell. Infect. Microbiol. 2022, 12, 772829. [Google Scholar] [CrossRef] [Scilit]
  30. Edache, S.E.; Horton, V.; Trujillo, S.; Algino, R.; Dewsbury, D.M.; George, L.A.; Shi, X.; Nagaraja, T.; Edrington, T.S.; Renter, D.G.; et al. Regional and Seasonal Trends in Salmonella enterica: A Study of Cull Dairy Cattle Lymph Nodes. Foodborne Pathog. Dis. 2026. [Google Scholar] [CrossRef] [Scilit] [PubMed]
  31. Alexandra, C.; Karina, A.C.; Carlos, P.; Carpio, C.; Echeverry, A.; Brashears, M. Seasonal effect on Salmonella, Shiga toxin-producing E. coli O157:H7 and non-O157 in the beef industry in Colombia, South America. Heliyon 2021, 7, 07547. [Google Scholar] [CrossRef] [Scilit]
  32. Xu, J.; Sangthong, R.; McNeil, E.; Tang, R.; Chongsuvivatwong, V. Antibiotic use in chicken farms in northwestern China. Antimicrob. Resist. Infect. Control 2020, 9, 10. [Google Scholar] [CrossRef] [Scilit] [PubMed]
  33. Dushayeva, L.Z. Antimicrobial resistance in foodborne Escherichia coli and Salmonella spp. from animal-origin foods: Transmission pathways, global surveillance gaps, and alternative therapeutic strategies. Vet. World 2025, 18, 3288–3305. [Google Scholar] [CrossRef] [Scilit]
  34. Qu, M.; Huang, Y.; Lyu, B.; Zhang, X.; Tian, Y.; Feng, Z.; Gao, Z.; Zhang, D. Prevalence and Genomic Characterization of Multidrug-Resistant Salmonella enterica Serovar Kentucky Sequence Type 198 Circulating—Beijing Municipality, China, 2016–2023. China CDC Wkly. 2024, 6, 825–833. [Google Scholar] [CrossRef] [Scilit]
  35. Zhan, Z.; Mai, Z.; Hu, M. Characterization of an Extensively Drug-Resistant Salmonella Kentucky ST198 Co-Harboring cfr, mcr-1 and tet(A) Variant from Retail Chicken Meat in Shanghai, China. Foods 2025, 14, 3025. [Google Scholar] [CrossRef] [Scilit]
  36. Jing, W.; Yue, J.; Caiyue, M.; Wang, Z.; Zhong, F.; Zhang, X.; Lv, L.; Lu, M.; Wu, H.; Jiao, X. Characterization of an Extensively Drug-Resistant Salmonella enterica Serovar Indiana Strain Harboring Chromosomal blaNDM-9 in China. Infect. Drug Resist. 2022, 15, 2015–2019. [Google Scholar] [CrossRef] [Scilit]
  37. Hu, Y.; Huang, P.; Zheng, L.; He, J.; Li, B.; Zhao, J.; Fanning, S.; Bai, L.; Dong, Y.P. Genomic Epidemiology of Foodborne blaNDM-9 Gene-Carrying Extensively Drug-Resistant (XDR) Salmonella enterica Serovar Indiana ST17. Biomed. Environ. Sci. 2025, 38, 1558–1563. [Google Scholar] [CrossRef] [Scilit]
  38. Zhan, Z.; He, S.; Hu, M.; Cui, Y.; Tai, C.; Shi, X. High Prevalence of Multidrug-resistant Salmonella from Retail Meat in Shanghai and the Molecular Characterization of blaNDM-9-carrying Plasmid. J. Futur. Foods 2025, in press. [Google Scholar] [CrossRef] [Scilit]
  39. Sun, H.; Cui, Z.; Du, X.; Fan, F.; Sun, B.; Diao, B.; Zhou, H.; Kan, B.; Yan, M. Prevalence of Salmonella enterica Serotype 4,[5],12:i:- from Human Sources: Antimicrobial Resistance, Genotypic Diversity and Emergence of Carbapenem Resistance—China, 2017–2023. China CDC Wkly. 2025, 7, 821–830. [Google Scholar] [CrossRef] [Scilit]
  40. Plumb, I.D.; Brown, A.C.; Stokes, E.K.; Chen, J.C.; Carleton, H.; Tolar, B.; Sundararaman, P.; Saupe, A.; Payne, D.C.; Shah, H.J.; et al. Increased Multidrug-Resistant Salmonella enterica I Serotype 4,[5],12:i:- Infections Associated with Pork, United States, 2009–2018. Emerg. Infect. Dis. 2023, 29, 314–322. [Google Scholar] [CrossRef] [Scilit]
  41. Li, L.; Sun, H.; Zhao, J.; Sheng, H.; Li, M.; Zhao, L.; Liu, S.; Fanning, S.; Wang, L.; Wang, Y.; et al. The genomic characteristics of dominant Salmonella enterica serovars from retail products in Sichuan Province, China. Int. J. Food Microbiol. 2025, 434, 111129. [Google Scholar] [CrossRef] [Scilit]
  42. Ferrari, R.; Antonio, G.; Rosa, C.; Magnani, M.; Tognim, M.; Oliveira, T.C.; Royo, G. Plasmid-mediated quinolone resistance (PMQR) and mutations in the topoisomerase genes of Salmonella enterica strains from Brazil. Braz. J. Microbiol. 2013, 44, 651–656. [Google Scholar] [CrossRef] [Scilit] [PubMed]
  43. Hao, H.; Yang, B.; Shi, J.; Xi, M.; Wang, X.; Cui, Y.; Meng, J. Drug resistance and related genes of chickenborne Salmonella to quinolone and fluoroquinolones. Acta Microbiol. Sin. 2011, 51, 1413–1420. [Google Scholar]
  44. Algarni, S.; Ricke, S.C.; Foley, S.L.; Han, J. The Dynamics of the Antimicrobial Resistance Mobilome of Salmonella enterica and Related Enteric Bacteria. Front. Microbiol. 2022, 13, 859854. [Google Scholar] [CrossRef] [Scilit] [PubMed]
  45. Mansour, M.N.; Yaghi, J.; El Khoury, A.; Felten, A.; Mistou, M.-Y.; Atoui, A.; Radomski, N. Prediction of Salmonella serovars isolated from clinical and food matrices in Lebanon and genomic-based investigation focusing on Enteritidis serovar. Int. J. Food Microbiol. 2020, 333, 108789. [Google Scholar] [CrossRef] [Scilit] [PubMed]
  46. Fenske, G.J.; Pouzou, J.G.; Pouillot, R.; Taylor, D.D.; Costard, S.; Zagmutt, F.J. The genomic and epidemiological virulence patterns of Salmonella enterica serovars in the United States. PLoS ONE 2023, 18, e0294624. [Google Scholar] [CrossRef] [Scilit]
  47. Lilibeth, T.; David, O.; Karen, L.; Fernández-Moreira, E.; Larrea-Álvarez, M. In Silico Detection of Antimicrobial Resistance Integrons in Salmonella enterica Isolates from Countries of the Andean Community. Antibiotics 2021, 10, 1388. [Google Scholar] [CrossRef] [Scilit]
Figure 1. Prevalence distribution of top five Salmonella serovars in food and clinical samples.
Microorganisms 14 00823 g001
Figure 2. Distribution patterns of Salmonella serovars in different classifications.
Microorganisms 14 00823 g002
Figure 3. The phenotypic antimicrobial resistance rate of the predominant serovars.
Microorganisms 14 00823 g003
Figure 4. The comparation of genotypic features among different predominant Salmonella serovars in (a) Number of insertion sequences; (b) Number of ARGs; (c) Number of VFs.
Microorganisms 14 00823 g004
Table 1. The detection rate and prevalent serovars under the different classifications.
ClassificationSubcategoryNumber of Positive
Samples
Total
Samples Tested
Detection Rate (%)Most Prevalent Serovar (1st)Second Most Prevalent Serovar (2nd)
Source (food)Poultry12141928.88S. Enteritidis (53.72%)S. Kentucky (10.74%)
 Pork177522.67S. London (23.53%)S. Infantis (23.53%)
 Beef102074.83S. Kentucky (20.00%)S. Typhimurium (20.00%)
 Aquatic
products
1212001.00S. Typhimurium (25.00%)S. Enteritidis (16.67%)
 Others106141.63S. 4,[5],12:i:- (40.00%)S. Enteritidis (20.00%)
Age group (clinics)0–6 years7020153.47S. 4,[5],12:i:- (41.43%)S. Enteritidis (27.14%)
 6–18 years712350.57S. Enteritidis (71.43%)S. Goldcoast (14.29%)
 18–60 years3370650.47S. Enteritidis (48.48%)S. 4,[5],12:i:- (15.15%)
 >60 years3433551.01S. Enteritidis (38.24%)S. 4,[5],12:i:- (11.76%)
Table 2. Seasonal Distribution of Salmonella Detection Rates in Food and Clinical Samples.
Sample TypeSeasonNumber of Positive SamplesTotal Samples TestedDetection Rate (%)
Food sampleSpring256244.01
 Summer8963314.06
 Autumn426336.64
 Winter146252.24
Clinical sampleSpring2210902.02
 Summer9173461.24
 Autumn2944760.65
 Winter27580.26
Disclaimer/Publisher’s Note: The statements, opinions and data contained in all publications are solely those of the individual author(s) and contributor(s) and not of MDPI and/or the editor(s). MDPI and/or the editor(s) disclaim responsibility for any injury to people or property resulting from any ideas, methods, instructions or products referred to in the content.