Abstract
The clinical impact of non-pathogenic colonizing bacteria in pneumonia remains poorly understood. This retrospective study analyzed the mutual influence of pneumonia and non-pathogenic bacterial flora in the lungs. Bronchoalveolar lavage fluid samples from 483 patients were analyzed using metagenomic next-generation sequencing, and differences in colonizing bacteria in different pneumonia types and their impact on disease prognosis were determined. Patients with bacterial pneumonia exhibited higher and lower colonization rates of Granulicatella adiacens and Streptococcus parasanguinis, respectively, than those without. Fungal pneumonia showed lower and higher colonization rates of Abiotrophia defectiva and Veillonella parvula, respectively; viral pneumonia showed higher colonization rates of Abiotrophia defectiva and Streptococcus mitis. Rothia mucilaginosa was associated with shorter duration of fever, and lower risks of sepsis and multiple organ dysfunction syndrome (MODS). Prevotella melaninogenica was associated with lower risks of sepsis and MODS. These findings suggest that select non-pathogenic bacteria might influence disease severity and also highlight the need for further investigation into microbiome-based therapeutic strategies, potentially guiding personalized pneumonia treatments.
1. Introduction
Pneumonia contributes significantly to the global disease burden, with an annual increase in hospitalization rates and intensive care unit (ICU) admissions. Approximately 649 out of every 100,000 people are hospitalized because of pneumonia, with a mortality rate of approximately 6.5% during hospitalization [1,2]. Identification of the causative pathogen is crucial for effective pneumonia treatment; however, in many hospitalized patients, the pathogen remains unidentified [3]. Conventional microbiological tests often have limitations in terms of sensitivity, timeliness, and the range of detectable pathogens. Metagenomic next-generation sequencing (mNGS) is a valuable tool for diagnosing infections of unknown causes [4,5]. mNGS has shown promise in guiding antibiotic treatment decisions by providing comprehensive and rapid identification of pathogens [6], thus facilitating targeted treatment strategies and potentially reducing the unnecessary use of broad-spectrum antibiotics.
Numerous studies have obtained bronchoalveolar lavage fluid (BALF) through bronchoscopy and confirmed, through pathogen detection, the presence of large numbers of colonizing bacteria in the lungs [7,8,9]. These colonizing bacteria include pathogenic and opportunistic pathogenic microbes and symbiotic communities [10,11]. Non-pathogenic bacterial flora is associated with the prognosis of many diseases, such as chronic obstructive pulmonary disease (COPD), idiopathic pulmonary fibrosis, asthma, and acute respiratory distress syndrome. Furthermore, non-pathogenic bacterial flora influences lung immune responses, including the levels of cytokines such as interleukin (IL)-1, IL-6, and tumor necrosis factor (TNF)-α [12,13]. Determining whether pathological changes in lung structure cause microbial dysbiosis or whether dysbiosis in the microbial community causes structural changes in the lung remains a challenge in lung disease research. The ecological imbalance caused by non-pathogenic bacterial flora may play a pathogenic role in lung disease by modulating the immune microenvironment, including cytokine regulation. However, although previous studies have described the influence of the lung microbiota in chronic respiratory conditions, the relationship between non-pathogenic lung-colonizing bacteria and pneumonia remains unclear. In the present study, we aimed to investigate the interactions and mutual influences between pneumonia and non-pathogenic lung-colonizing bacteria and elucidate the ecological microenvironment of the lower respiratory tract microbiota. The findings of this study can assist in the development of future clinical treatment strategies for pneumonia, can provide new insights into the lung microbial ecology in pneumonia, and may inform microbiome-targeted therapeutic approaches for improving patient outcomes.
2. Materials and Methods
2.1. Ethics Approval and Consent to Participate
All procedures conducted in this study adhered to the ethical standards set by the appropriate national and institutional committees on human experimentation, as well as the Helsinki Declaration of 1975 and its 2008 revision. All patients included in this study signed informed consent forms for fiberoptic bronchoscopy and alveolar lavage procedures. This retrospective analysis was approved by the Medical Ethics Committee of Guangzhou First People’s Hospital (approval number: K-2023-103-02).
2.2. Patient Cohort and Study Design
This retrospective, single-center study examined data from 583 patients diagnosed with pneumonia at the Guangzhou First People’s Hospital, China. Patients who were admitted to our hospital for pneumonia, underwent fiber bronchoscopy during hospitalization, and had their BALF tested for pathogens using mNGS from December 2017 to December 2023 were included. The exclusion criteria were as follows: (1) cancer or connective tissue diseases, (2) hematological disorders such as leukemia and lymphoma, and (3) incomplete clinical data. Figure 1 illustrates a flowchart detailing the patient selection process. The final analysis included data from 483 patients with pneumonia. The baseline was defined as the point at the time of patient admission. The endpoint was defined as death or discharge of the patient. The median hospitalization stay was 10 (range: 8–15) days.
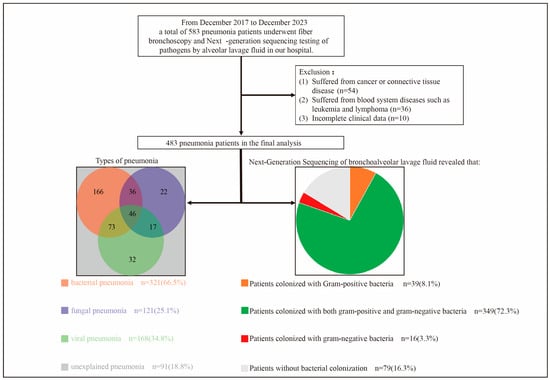
Figure 1.
Flowchart of patient selection.
Some of the patients had mixed pneumonia. In addition, some patients had unexplained pneumonia.
2.3. Definitions
Unexplained pneumonia was defined as pneumonia for which the specific type could not be determined despite comprehensive testing that included biological evidence, such as sputum culture, blood culture, and BALF-mNGS [14,15]. The pathogenic bacteria that cause pneumonia in patients were identified by two deputy chief physicians with a background in infectious diseases based on the patient’s symptoms and signs, imaging results, bacterial culture results of alveolar lavage fluid, and metagenomic next-generation sequencing results [16,17]. Non-pathogenic colonizing bacteria were defined as bacteria detected by BALF-mNGS that were not considered pathogenic bacteria. Non-pathogenic colonizing bacteria included opportunistic pathogens and commensal bacteria.
2.4. Collection of BALF
The specific location of pneumonia was determined using computed tomography. A fiberoptic bronchoscope was inserted into the affected segmental or subsegmental bronchus, and 20 mL of sterile saline (0.9% NaCl at room temperature) was instilled, immediately aspirated, and recovered. All patients underwent fiberoptic bronchoscopy and BALF collection within 1 week of hospitalization.
2.5. Cytokine Level Measurement
According to the manufacturer’s instructions, we measured the levels of cytokines such as IL-2, IL-4, IL-6, IL-10, interferon (IFN)-γ, and TNF-α for all patients using the Human Cytokine Standard 27-plex Assay Panel and the Bio-Plex 200 System (Bio-Rad Laboratories, Hercules, CA, USA).
2.6. Nucleic Acid Extraction, Library Preparation, and Sequencing
For the extraction of genomic material, we employed a multi-step procedure. Sample processing began with the isolation of DNA molecules by applying the QIAamp® UCP Pathogen DNA Kit manufactured by Qiagen (Hilden, Germany) in accordance with the supplier’s protocol. To enhance microbial DNA purity, contaminating human genetic material was eliminated through a combination of benzonase enzyme (Qiagen) and the detergent Tween 20 (Sigma-Aldrich, St. Louis, MO, USA), following established methods [18]. In parallel, we extracted viral and microbial RNA components from the specimens utilizing the QIAamp® Viral RNA Kit (Qiagen). The quality of extracted RNA was improved by depleting ribosomal RNA sequences with Illumina’s Ribo-Zero rRNA Removal Kit (San Diego, CA, USA) [19]. Subsequently, complementary DNA was synthesized from the purified RNA through an enzymatic reaction with reverse transcriptase and deoxynucleoside triphosphates supplied by Thermo Fisher Scientific (Waltham, MA, USA). We prepared genomic and complementary DNA library constructs utilizing Nextera XT DNA Library Preparation system (Illumina, San Diego, CA, USA) [20]. The pooled libraries underwent sequencing on an NextSeq 550Dx platform (Illumina, San Diego, CA, USA) utilizing a 75-cycle single-end approach, which yielded an average of 20 million sequence reads for each individual library. To establish appropriate controls, we utilized peripheral blood mononuclear cells obtained from healthy individuals, prepared at a density of 105 cells/mL, which were subjected to identical processing procedures alongside each experimental batch. Additionally, we incorporated sterile deionized water as a non-template control (NTC) that underwent the same extraction workflow as the test specimens [21].
2.7. Bioinformatic Analyses
Sequence quality filtration was accomplished using the Trimmomatic (v0.39), which facilitated the elimination of poor-quality sequences, adapter-derived contamination, redundant reads, and any fragments not meeting the minimum length threshold of 50 base pairs [22]. To further enhance data quality, we used Kcomplexity with its default settings to filter out sequences characterized by low nucleotide complexity [23]. Sequences originating from the human host were computationally distinguished and subsequently filtered out by conducting alignment against the hg38 human reference assembly utilizing the alignment algorithm implemented in Burrows–Wheeler Aligner (v0.7.17) [24]. The sequence data analysis involved mapping microbial sequence fragments to reference databases through SNAP software (version 1.0beta.18) [25]. For quantitative assessment, we calculated a normalized abundance metric by dividing each microorganism’s reads per million (RPM) value in patient samples by its corresponding value in negative controls, yielding what we termed the RPM-ratio (RPM-r). An organism was confirmed present when this RPM-r exceeded or equaled 5 [19].
2.8. Data Collection
We collected comprehensive data for each patient from the medical system, including demographics, comorbidities, symptoms, imaging reports (initial results upon admission), laboratory test results (initial results upon admission), treatments, outcomes, and hospital costs. A dedicated team of physicians and researchers collaborated to cross-check and verify the accuracy of the patient data.
2.9. Quantification and Statistical Analysis
For data analysis, we utilized two statistical software packages: IBM’s SPSS, version 25.0 (Armonk, NY, USA), alongside the GraphPad Prism application, version 8.0.0 (San Diego, CA, USA). Upon testing our continuous variables with the Shapiro–Wilk method, we determined that normal distribution patterns were absent across all measurements. Consequently, we have expressed these continuous data as median values accompanied by their interquartile ranges (IQRs). For categorical data, we have opted for numerical counts supplemented with corresponding percentages. When conducting between-group comparisons, non-parametric Mann–Whitney U testing was employed for continuous variables, while either Chi-square analysis or Fisher’s exact probability test was applied to categorical data [26]. The Kaplan–Meier method was used to compare fever duration and hospitalization duration with group comparisons performed using the log-rank test. Spearman’s correlation analysis was used to analyze the correlation between non-pathogenic lung-colonizing bacteria and cytokine levels. The Shannon Diversity Index was calculated using the following formula: . The Simpson Index was calculated as D = . The Chao Richness Score, used to compute the number of species in a community, was calculated through manual enumeration [27]. Differences in the Shannon Diversity Index and Chao Richness Score among groups were determined using the Mann–Whitney U test or the non-parametric Kruskal–Wallis test. Principal component analysis and principal coordinate analysis were used for analyzing β-species diversity [28,29]. All statistical tests were two-sided, with p < 0.05 considered statistically significant.
Through the univariable and multivariable logistic regression analyses, we found that age, sex, comorbidities, antibiotic use, and disease severity may serve as confounding factors affecting patients’ clinical outcomes (Tables S1–S3). To standardize confounding factors and minimize bias, propensity score matching (PSM) analysis was performed. The patients in the groups were matched 1:1 using the greedy-matching nearest-neighbor algorithm with a caliper of 0.02 [30,31]. All confounding factors in this study were balanced between the groups after PSM analysis.
3. Results
3.1. Baseline Characteristics of All Patients
Table S4 shows the baseline clinical characteristics of all patients in this study. The median age of the patients was 63 years (IQR: 50–71 years), with male patients accounting for 61.7% of the cohort. In total, 26.3%, 18.6%, 7.5%, and 13.0% of the patients had hypertension, diabetes, CHD, and COPD, respectively. Elevated white blood cell counts were observed in 24.0% of the patients. Most patients showed no obvious abnormalities in liver or kidney function or myocardial enzyme levels. In addition, IL-2, IL-4, IL-6, IL-10, TNF-α, and IFN-γ levels were elevated by varying amounts depending on the type of pneumonia. During hospitalization, each patient received a median of 2 antibiotic types (IQR: 1–4) for a median of 9 days (IQR: 7–13 days). In addition, 65.4% of the patients required oxygen inhalation therapy, and 14.3% required ventilator-assisted ventilation. With regard to the disease prognosis, 15.1% of the patients developed severe pneumonia, 10.8% were admitted to the ICU for monitoring, 10.4% experienced multiple organ dysfunction syndrome (MODS), 6.4% developed sepsis, and 3.3% died. The common pathogenic bacteria in bacterial pneumonia patients in this study were Streptococcus pneumoniae, Pseudomonas aeruginosa, Haemophilus influenzae, Klebsiella pneumoniae, and Acinetobacter baumannii (Table S5). The common pathogenic fungi in fungal pneumonia patients in this study were Candida, Pneumocystis jirovecii, and Aspergillus (Table S6).
Figure S1 illustrates the characteristics of the non-pathogenic colonizing flora in all patients. Figure S1a details the top 15 non-pathogenic colonizing Gram-positive bacteria by colonization rate, with the top three being Rothia mucilaginosa (40.4%), Granulicatella adiacens (15.9%), and Abiotrophia defectiva (11.8%). Figure S1b shows the sequences of the top 15 non-pathogenic colonizing Gram-positive bacteria, most of which had quartiles between 10 and 1000. Figure S1c displays the top 15 non-pathogenic colonizing Gram-negative bacteria by colonization rate, and the top three were Veillonella parvula (34.2%), Prevotella melaninogenica (33.1%), and Veillonella dispar (14.7%). Figure S1d presents the sequences of the top 15 non-pathogenic colonizing Gram-negative bacteria.
3.2. Differences in Non-Pathogenic Bacterial Flora Colonizing the Lungs Between Patients with and Those Without Bacterial Pneumonia
Before PSM, compared with patients without bacterial pneumonia, those with bacterial pneumonia exhibited higher colonization rates for Granulicatella adiacens (19.6% vs. 8.6%, p = 0.002), Gemella haemolysans (10.9% vs. 4.3%, p = 0.015), Fusobacterium nucleatum (16.8% vs. 8.6%, p = 0.015), Porphyromonas gingivalis (17.1% vs. 5.6%, p < 0.001), Tannerella forsythia (13.1% vs. 6.8%, p = 0.037), Campylobacter concisus (12.5% vs. 5.6%, p = 0.018), and Veillonella atypica (11.5% vs. 4.9%, p = 0.019). Furthermore, they showed higher numbers of sequences for Abiotrophia defectiva (p = 0.040), Megasphaera micronuciformis (p = 0.044), Staphylococcus epidermidis (p = 0.027), and Tannerella forsythia (p = 0.014) (Figure S2).
Considering that confounding factors such as age, sex, and comorbidities might cause differences in the bacterial colonization rate, we performed PSM (Table S7). After PSM, no statistically significant differences were observed in age, sex, hypertension, diabetes, CHD, or COPD between patients with and those without bacterial pneumonia.
Figure 2 shows the full comparison of colonization rates of patients after PSM. Compared with patients without bacterial pneumonia, those with bacterial pneumonia demonstrated higher colonization rates for Granulicatella adiacens (17.5% vs. 7.8%, p = 0.010) (Figure 2a), Gemella haemolysans (14.3% vs. 3.9%, p = 0.002), Fusobacterium nucleatum (20.8% vs. 9.1%, p = 0.004) (Figure 2c), Porphyromonas gingivalis (12.3% vs. 5.8%, p = 0.047), Tannerella forsythia (14.3% vs. 7.1%, p = 0.043), and Campylobacter concisus (12.3% vs. 5.8%, p = 0.047), along with a lower colonization rate for Streptococcus parasanguinis (6.5% vs. 14.3%, p = 0.025). Moreover, patients with bacterial pneumonia after PSM had more Veillonella atypica sequences (p = 0.044) (Figure 2d).
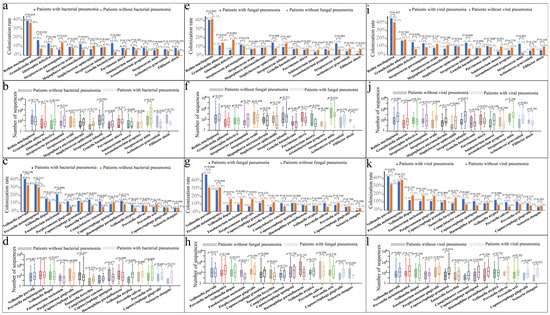
Figure 2.
Comparison of colonization rates with sequence numbers of Gram-positive and Gram-negative bacteria in the lungs of patients with different types of pneumonia after propensity score matching (PSM). (a) Comparison of the colonization rate of Gram-positive bacteria between patients with and without bacterial pneumonia. (b) Comparison of the number of sequenced Gram-positive bacteria between patients with and those without bacterial pneumonia (c). Comparison of the colonization rate of Gram-negative bacteria between patients with and those without bacterial pneumonia. (d) Comparison of the number of sequenced Gram-negative bacteria between patients with and those without bacterial pneumonia. (e) Comparison of the colonization rate of Gram-positive bacteria between patients with and those without fungal pneumonia. (f) Comparison of the number of sequenced Gram-positive bacteria between patients with and those without fungal pneumonia. (g) Comparison of the colonization rate of Gram-negative bacteria between patients with and those without fungal pneumonia. (h) Comparison of the number of sequenced Gram-negative bacteria between patients with and those without fungal pneumonia. (i) Comparison of the colonization rate of Gram-positive bacteria between patients with and those without viral pneumonia. (j) Comparison of the number of sequenced Gram-positive bacteria between patients with and those without viral pneumonia. (k) Comparison of the colonization rate of Gram-negative bacteria between patients with and those without viral pneumonia. (l) Comparison of the number of sequenced Gram-negative bacteria between patients with and those without viral pneumonia.
3.3. Differences in Non-Pathogenic Bacterial Flora Colonizing the Lungs Between Patients with and Those Without Fungal Pneumonia
Before PSM, compared with patients without fungal pneumonia, those with fungal pneumonia exhibited lower colonization rates of Abiotrophia defectiva (5.8% vs. 13.8%, p = 0.018), Solobacterium moorei (3.3% vs. 8.8%, p = 0.045), Filifactor alocis (1.7% vs. 8.0%, p = 0.013), Veillonella dispar (9.1% vs. 16.6%, p = 0.044), Porphyromonas gingivalis (6.6% vs. 15.5%, p = 0.013), and Tannerella forsythia (5.8% vs. 12.7%, p = 0.035). Conversely, they had higher colonization rates of Streptococcus mitis (13.2% vs. 4.7%, p = 0.001) and Veillonella parvula (47.1% vs. 29.8%, p < 0.001). Furthermore, patients with fungal pneumonia had a higher number of sequences for Rothia mucilaginosa (p = 0.022) and fewer sequences for Filifactor alocis (p = 0.029) (Figure S3).
Table S8 shows the results of comparisons between patients with and those without fungal pneumonia after PSM. Age, sex, and comorbidities were balanced between the two groups after PSM. Compared with patients without fungal pneumonia, those with fungal pneumonia showed a lower lymphocyte count (p < 0.001), a higher neutrophil count (p = 0.005), and higher serum creatinine levels (p = 0.014). Moreover, these patients were more likely to experience abnormal liver function (aspartate transaminase > 40 U/L) (p = 0.034), hypoproteinemia (p = 0.001), and myocardial damage (p = 0.023), with lower blood levels of IL-10 (p = 0.009), TNF-α (p = 0.004), and IFN-γ (p = 0.008).
After PSM, compared with patients without fungal pneumonia, those with fungal pneumonia showed lower colonization rates of Abiotrophia defectiva (5.9% vs. 17.8%, p = 0.005) (Figure 2e) and Porphyromonas gingivalis (6.8% vs. 16.1%, p = 0.024) (Figure 2g) and higher colonization rates of Veillonella parvula (48.3% vs. 31.4%, p = 0.008). Furthermore, they exhibited lower numbers of sequences for Filifactor alocis (p = 0.037) (Figure 2f) and Fusobacterium nucleatum (p = 0.012) (Figure 2h).
3.4. Differences in Non-Pathogenic Bacterial Flora Colonizing the Lungs Between Patients with and Those Without Viral Pneumonia
Before PSM, compared with patients without viral pneumonia, those with viral pneumonia exhibited lower colonization rates of Solobacterium moorei (4.2% vs. 9.2%, p = 0.045) and higher colonization rates of Streptococcus infantis (14.3% vs. 7.9%, p = 0.028) and Streptococcus mitis (13.1% vs. 3.5%, p < 0.001). Furthermore, patients with viral pneumonia had higher numbers of sequences of Rothia mucilaginosa (p < 0.001), Granulicatella adiacens (p = 0.010), Streptococcus oralis (p = 0.003), Staphylococcus epidermidis (p = 0.024), Streptococcus infantis (p < 0.001), Streptococcus mitis (p = 0.032), Veillonella parvula (p = 0.013), and Capnocytophaga granulosa (p = 0.036) (Figure S4).
Table S9 shows the clinical characteristics of patients with and those without viral pneumonia after PSM. Compared with patients without viral pneumonia after PSM, those with viral pneumonia were more likely to exhibit hypoproteinemia (p = 0.013) and had lower lymphocyte counts (p = 0.003) and blood IFN-γ levels (p = 0.019).
After PSM, compared with patients without viral pneumonia, those with viral pneumonia had higher colonization rates of Abiotrophia defectiva (15.0% vs. 6.9%, p = 0.020) (Figure 2i), Streptococcus infantis (14.4% vs. 7.5%, p = 0.049), and Streptococcus mitis (13.1% vs. 2.5%, p < 0.001). Furthermore, patients with viral pneumonia after PSM had a higher number of sequences for Rothia mucilaginosa (p < 0.001) (Figure 2j), Granulicatella adiacens (p = 0.044), Streptococcus oralis (p = 0.004), Staphylococcus epidermidis (p = 0.041), Streptococcus infantis (p = 0.015), and Capnocytophaga granulosa (p = 0.014) (Figure 2l).
3.5. Impact of Rothia Mucilaginosa Colonization in Patients with Pneumonia
We conducted PSM to account for confounding factors. After PSM, confounding factors such as age, sex, comorbidities, antibiotic use, pneumonia type, and disease severity were balanced (Table 1). Rothia mucilaginosa colonization did not affect laboratory results, including white blood cell counts, lymphocyte levels, liver and kidney function, myocardial enzyme levels, and cytokine concentrations.

Table 1.
Clinical characteristics of pneumonia patients with or without Rothia mucilaginosa colonization before and after PSM.
Before PSM, lung colonization by Rothia mucilaginosa was associated with shorter hospital stays (p = 0.006) (Figure S5). After PSM, patients with pneumonia with Rothia mucilaginosa colonization exhibited shorter duration of fever (p = 0.015), and lower risks of sepsis (p = 0.032) and MODS (p = 0.034) than patients without Rothia mucilaginosa colonization (Figure 3).
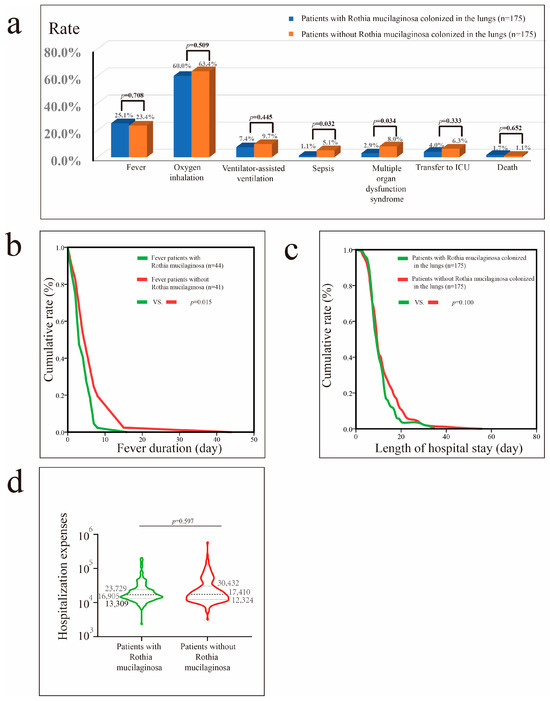
Figure 3.
Impact of Rothia mucilaginosa colonization in patients with pneumonia after propensity score matching (PSM). (a) Impact of Rothia mucilaginosa colonization on fever, oxygen inhalation, ventilator-assisted ventilation, sepsis, MODS, transfer to the ICU, and mortality rates. (b) Impact of Rothia mucilaginosa colonization on fever duration in patients with fever. (c) Impact of Rothia mucilaginosa colonization on hospital stay in patients with pneumonia. (d) Impact of Rothia mucilaginosa colonization on hospital costs in patients with pneumonia.
3.6. Impact of Veillonella Parvula Colonization in Patients with Pneumonia
Before PSM, significant differences were observed in age, comorbidities, and pneumonia types between patients with pneumonia and those without Veillonella parvula colonization (Table 2). Consequently, we conducted PSM to control for these confounding factors and analyze the impact of Veillonella parvula on pneumonia outcomes. After PSM, we found that Veillonella parvula colonization did not affect laboratory results, including white blood cell counts, lymphocyte levels, procalcitonin levels, liver and kidney function, cardiac enzymes, and cytokine levels.
Table 2.
Clinical characteristics of pneumonia patients with or without Veillonella parvula colonization before and after PSM.
Before PSM, Veillonella parvula colonization was associated with higher hospital costs (p = 0.036) and greater reliance on supplemental oxygen (p = 0.002) (Figure S6). After PSM, the proportion of patients with pneumonia requiring oxygen inhalation therapy remained higher among those with Veillonella parvula colonization (p < 0.001) (Figure 4).
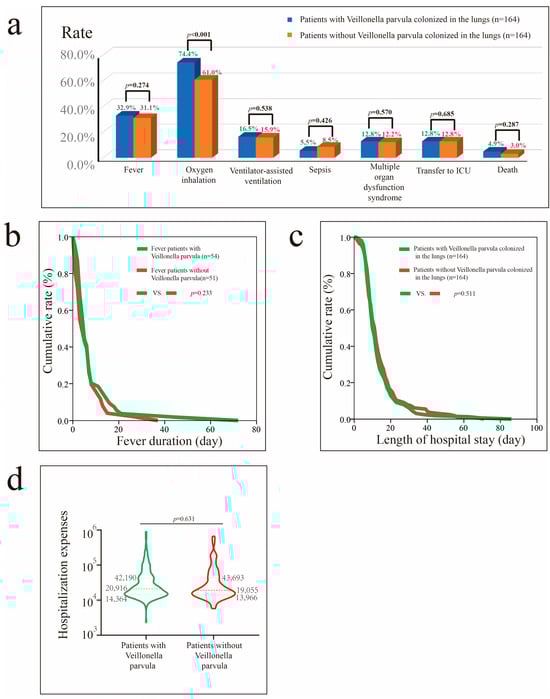
Figure 4.
Impact of Veillonella parvula colonization in patients with pneumonia after PSM. (a) Impact of Veillonella parvula colonization on fever, oxygen inhalation, ventilator-assisted ventilation, sepsis, MODS, transfer to the ICU, and mortality rate. (b) Impact of Veillonella parvula on fever duration in patients with fever. (c) Impact of Veillonella parvula on hospital stay in patients with pneumonia. (d) Impact of Veillonella parvula on hospital costs in patients with pneumonia.
3.7. Impact of Prevotella Melaninogenica Colonization in Patients with Pneumonia
Table 3 outlines the clinical features of patients with pneumonia with Prevotella melaninogenica colonization. After PSM, higher levels of IL-4 (0.35 [0.02–0.69] vs. 0.21 [0.01–0.57], p = 0.014) were observed in patients with Prevotella melaninogenica colonization.
Table 3.
Clinical characteristics of pneumonia patients with or without Prevotella melaninogenica colonization before and after PSM.
Before PSM, Prevotella melaninogenica colonization in patients with pneumonia was associated with a reduced need for oxygen inhalation therapy (p = 0.002) (Figure S7) and ventilator-assisted therapy (p = 0.014), lower risks of progression to sepsis (p = 0.013) and MODS (p = 0.007), lower likelihood of ICU transfer (p = 0.024), shorter hospital stays (p < 0.001), and lower hospital costs (p < 0.001). After PSM, Prevotella melaninogenica colonization reduced the risks of sepsis (p = 0.032) and MODS (p = 0.010) (Figure 5).
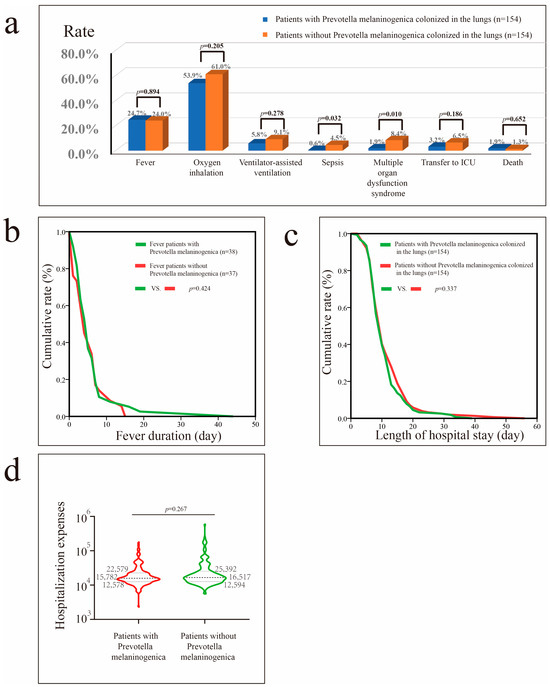
Figure 5.
Impact of Prevotella melaninogenica colonization in patients with pneumonia after PSM. (a) Impact of Prevotella melaninogenica colonization on fever, oxygen inhalation, ventilator-assisted ventilation, sepsis, MODS, transfer to ICU, and mortality rates. (b) Impact of Prevotella melaninogenica on fever duration in patients with fever. (c) Impact of Prevotella melaninogenica on hospital stay in patients with pneumonia. (d) Impact of Prevotella melaninogenica on hospital costs in patients with pneumonia.
3.8. Correlations Among Non-Pathogenic Colonizing Bacteria and Cytokine Levels
Figure 6 suggests a potential correlation between colonizing bacteria and cytokine levels.
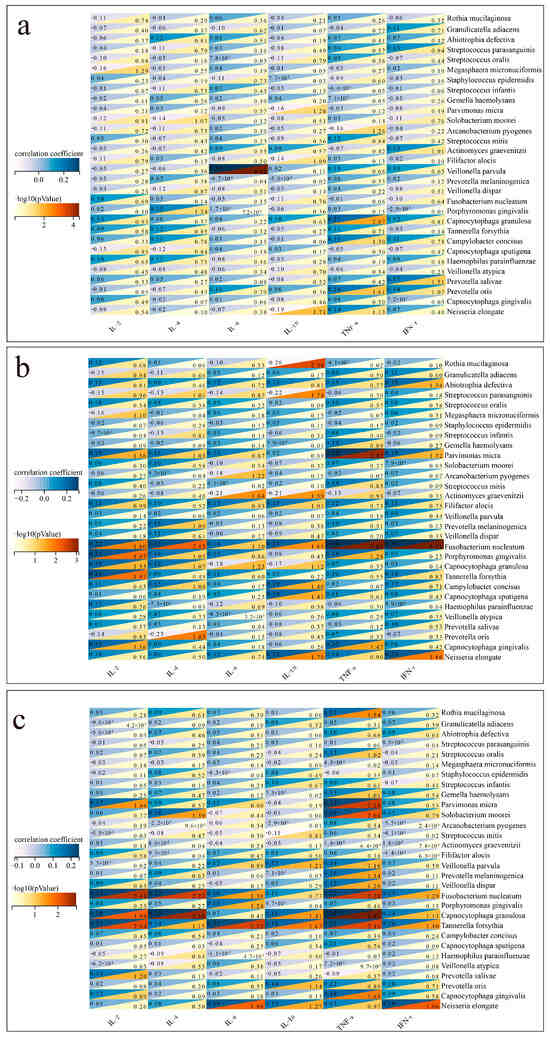
Figure 6.
Correlation between colonizing bacteria and cytokines. (a) Correlation between colonizing bacteria and cytokines in patients with bacterial pneumonia. (b) Correlation between colonizing bacteria and cytokines in patients with fungal pneumonia. (c) Correlation between colonizing bacteria and cytokines in patients with viral pneumonia.
In patients with bacterial pneumonia (Figure 6a), positive correlations were found between IL-6 and Veillonella parvula (p < 0.001), while TNF-α positively correlated with Capnocytophaga granulosa (p = 0.009). A negative correlation was observed between IL-10 and Neisseria elongate (p = 0.019). In patients with fungal pneumonia (Figure 6b), positive correlations were found between TNF-α and Fusobacterium nucleatum (p < 0.001). A negative correlation was observed between IL-10 and Rothia mucilaginosa (p = 0.004). In patients with viral pneumonia (Figure 6c), positive correlations were found between TNF-α and Fusobacterium nucleatum (p = 0.005), while IL-2 positively correlated with Capnocytophaga granulosa (p = 0.011).
3.9. Comparison of Microbial Diversity of Non-Pathogenic Lung-Colonizing Bacteria in Patients with Different Types of Pneumonia
Figure 7a shows the relative abundances of colonizing bacteria in patients with different types of pneumonia. Indices measuring microbial diversity, including Shannon, Simpson, InvSimpson, richness, the abundance-based coverage estimator (ACE), and Chao1, were similar among the groups at the genus and species levels (Figure 7b) (p > 0.05). β-diversity was also not significantly different among the groups (Figure 7c).
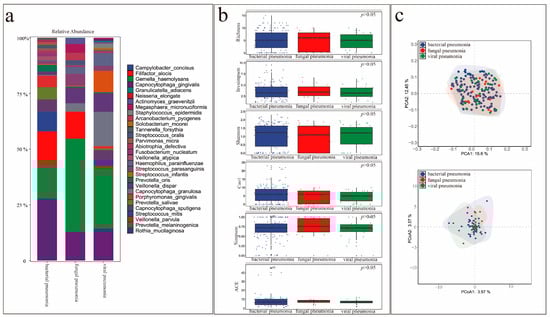
Figure 7.
Comparison of microbial diversity of non-pathogenic colonizing bacteria in the lungs of patients with different types of pneumonia. (a) Abundance of the top 30 colonizing bacteria in patients with different types of pneumonia. (b) Comparison of α-species diversity in patients with different types of pneumonia. (c) Comparison of β-species diversity in patients with different types of pneumonia.
4. Discussion
This study aimed to investigate the role of non-pathogenic lung-colonizing bacteria in pneumonia prognosis using mNGS analysis of BALF samples. Our study identified the top 15 g-positive and Gram-negative bacteria with the highest colonization rates. We found that different types of pneumonia led to variations in the bacterial communities colonizing the lungs. As previously reported, sarcoidosis affects the microbiota in the lower respiratory tract [32]. Asthma and COPD may also influence the respiratory microbiome [33]. Certain colonizing bacteria may thrive in certain respiratory diseases, resulting in their widespread colonization and dominance within the respiratory tract of patients with such diseases, leading to higher colonization rates and increased presence of these bacteria within the entire microbial community.
Furthermore, we found that the bacteria colonizing the lungs affected the prognosis of pneumonia. In this study, the bacteria with the highest colonization rates were Rothia mucilaginosa (40.4%), Veillonella parvula (34.2%), and Prevotella melaninogenica (33.1%). Therefore, we focused our analysis on these three bacteria, with Rothia mucilaginosa representing Gram-positive bacteria and Veillonella parvula and Prevotella melaninogenica representing Gram-negative bacteria. Previous studies have indicated the presence of a core lung bacterial microbiome, comprising Prevotella, Veillonella, and Rothia [34,35]. For each individual, the composition of the pulmonary microbiome is based on the balance between microbial transmission from the upper respiratory tract and microbial elimination by the host’s defense mechanisms [36,37]. When the colonizing bacteria that dominate the colonizing flora differ, differences in the prognosis of lung diseases may arise [38]. Despite numerous previous studies reporting the negative impact of intrapulmonary colonizing bacteria on pulmonary diseases, our research revealed that Rothia mucilaginosa and Prevotella melaninogenica might be beneficial for the prognosis of pneumonia patients. Rothia mucilaginosa was associated with shorter duration of fever, and lower risks of sepsis and MODS. Prevotella melaninogenica was associated with lower risks of sepsis and MODS. Beyond pneumonia, colonizing bacteria influence the occurrence and development of lung cancer and sarcoidosis [39]. Furthermore, lung function correlates significantly with the richness and diversity of colonizing bacteria [40]. However, some studies have reported that colonizing bacteria do not affect the prognosis of certain lung diseases; for example, short-term changes in the composition of the airway microbiota have not been associated with the deterioration of lung disease in cystic fibrosis [41]. Veillonella and Prevotella play crucial roles in respiratory system health as unique components of the normal lung microbiota and other moist epithelial cell populations. Notably, a negative correlation has been observed between influenza-specific H1 IgA titers and Veillonella [42]. Furthermore, Prevotella is more common in healthy individuals than in children with asthma and patients with COPD [43].
Our findings suggest that intrapulmonary colonizing bacteria may affect cytokine levels. A previous study analyzed IL-1β levels and airway microbiota in patients with bronchiectasis, finding a correlation between the relative abundance of Proteobacteria and IL-1β [44]. Furthermore, the abundance of resident bacteria may be associated with airway immunological characteristics that primarily involve a reduction in TNF-α and IL-1β levels [45]. In addition, the α-diversity of the lung microbiota in patients with lung transplants may be associated with IL-2 levels in BALF.
Limitations of the Study
This study has some limitations. The timing of fiberoptic bronchoscopy was inconsistent across all patients, potentially leading to differences in the number and types of colonizing bacteria detected using mNGS. At the time of BALF acquisition, the position of the bronchoscope was not always consistent during bronchoscopy, potentially resulting in differences in the types of colonizing bacteria detected. Despite our quality control monitoring, the sampling environment, detection environment, and pollutants may have still affected the results of bacterial colonization detected by mNGS. The detected colonizing bacteria may comprise PPMs, symbiotic bacteria, and other potential sources of contamination. Although clinicians recognize the presence of normal respiratory microbiota within the lungs, the results of mNGS should be interpreted with caution. Quantitative methods and interpretation standards for mNGS are needed to distinguish pathogens from commensals and minimize false-positive results. In addition, since our research population only came from China, it is difficult to generalize the conclusions to other races or countries. Furthermore, antibiotic use in patients with pneumonia during hospitalization may affect the number and types of colonizing bacteria. In this study, non-pathogenic bacteria include opportunistic pathogens and commensal bacteria, and opportunistic pathogens may affect clinical outcomes in patients with weakened immunity. Finally, this retrospective study was conducted at a single center with a limited patient sample. These limitations highlight the need for standardized protocols, and prospective multicenter clinical studies are needed to validate our findings and fully elucidate the clinical implications of lung-colonizing microbiota in pneumonia management.
In summary, our findings support the hypothesis that non-pathogenic colonizing bacteria may influence pneumonia outcomes through immune modulation. Future studies should aim to explore causal mechanisms and evaluate the potential of microbiome-targeted therapies in respiratory infections.
5. Conclusions
The bacterial communities colonizing the lungs of patients with different types of pneumonia are distinct. The presence of certain colonizing bacteria, such as Rothia mucilaginosa and Prevotella melaninogenica, may improve patient prognosis. Our findings highlight the potential value of characterizing non-pathogenic lung-colonizing bacteria as part of the diagnostic and prognostic assessment in pneumonia management. Future research should focus on exploring the mechanistic role of these commensal bacteria in immune modulation and disease progression, as well as their possible therapeutic implications.
Supplementary Materials
The following supporting information can be downloaded at https://www.mdpi.com/article/10.3390/microorganisms13092099/s1. Figure S1: Characteristics of the colonizing flora in all patients before PSM (a. top 15 colonizing Gram-positive bacteria by colonization rate; b. number of sequences of the top 15 colonizing Gram-positive bacteria; c. top 15 colonizing Gram-negative bacteria by colonization rate; d. number of sequences of the top 15 colonizing Gram-negative bacteria). Figure S2: Comparison of colonization rates and sequence numbers in patients with and without bacterial pneumonia before PSM (a. comparison of the colonization rate of Gram-positive bacteria between patients with and those without bacterial pneumonia; b. comparison of the number of sequenced Gram-positive bacteria between patients with and those without bacterial pneumonia; c. comparison of the colonization rate of Gram-negative bacteria between patients with and those without bacterial pneumonia; d. comparison of the number of sequenced Gram-negative bacteria between patients with and those without bacterial pneumonia). Figure S3: Comparison of colonization rates and sequence numbers in patients with and without fungal pneumonia before PSM (a. comparison of the colonization rate of Gram-positive bacteria between patients with and those without fungal pneumonia; b. comparison of the number of sequenced Gram-positive bacteria between patients with and those without fungal pneumonia; c. comparison of the colonization rate of Gram-negative bacteria between patients with and those without fungal pneumonia; d. comparison of the number of sequenced Gram-negative bacteria between patients with and those without fungal pneumonia). Figure S4: Comparison of colonization rates and sequence numbers in patients with and without viral pneumonia before PSM (a. comparison of the colonization rate of Gram-positive bacteria between patients with and those without viral pneumonia; b. comparison of the number of sequenced Gram-positive bacteria between patients with and those without viral pneumonia; c. comparison of the colonization rate of Gram-negative bacteria between patients with and those without viral pneumonia; d. comparison of the number of sequenced Gram-negative bacteria between patients with and those without viral pneumonia). Figure S5: Impact of Rothia mucilaginosa colonization in patients with pneumonia before PSM (a. impact of Rothia mucilaginosa colonization on fever, oxygen inhalation, ventilator-assisted ventilation, sepsis, MODS, transfer to ICU, and mortality; b. impact of Rothia mucilaginosa on fever duration in patients with fever; c. impact of Rothia mucilaginosa on hospital stay of patients with pneumonia; d. impact of Rothia mucilaginosa on hospital costs in patients with pneumonia). Figure S6: Impact of Veillonella parvula colonization in patients with pneumonia before PSM (a. impact of Veillonella parvula colonization on fever, oxygen inhalation, ventilator-assisted ventilation, sepsis, MODS, and transfer to ICU; b. impact of Veillonella parvula on fever duration in patients with fever; c. impact of Veillonella parvula on hospital stay in patients with pneumonia; d. impact of Veillonella parvula on hospital costs in patients with pneumonia). Figure S7: Impact of Prevotella melaninogenica colonization in patients with pneumonia before PSM (a. impact of Prevotella melaninogenica colonization on fever, oxygen inhalation, ventilator-assisted ventilation, sepsis, MODS, severe pneumonia, transfer to ICU, and mortality; b. impact of Prevotella melaninogenica on fever duration in patients with fever; c. impact of Prevotella melaninogenica on hospital stay in patients with pneumonia; d. impact of Prevotella melaninogenica on hospital costs in patients with pneumonia). Table S1. Results of the univariable and multivariable logistic regression analyses of risk factors for sepsis in bacterial pneumonia patients. Table S2. Results of the univariable and multivariable logistic regression analyses of risk factors for death in fungal pneumonia patients. Table S3. Results of the univariable and multivariable logistic regression analyses of risk factors for the need for ventilator-assisted breathing in viral pneumonia patients. Table S4. Baseline characteristics of all patients. Table S5. The types and proportions of the common pathogenic bacteria in 321 confirmed bacterial pneumonia patients. Table S6. The types and proportions of the common pathogenic fungi in 121 confirmed fungal pneumonia patients. Table S7. Clinical characteristics of patients with and without bacterial pneumonia before and after PSM. Table S8. Clinical characteristics of patients with and without fungal pneumonia before and after PSM. Table S9. Clinical characteristics of patients with and without viral pneumonia before and after PSM.
Author Contributions
Conceptualization, C.-Y.H. and Z.-X.Z.; methodology, C.-Y.H., Z.-X.Z., Y.-F.L., C.S., and S.-F.Y.; investigation, C.-Y.H., Z.-X.Z., Y.-F.L., Y.-J.L., and J.L.; writing—original draft, C.-Y.H., Z.-X.Z., Y.-F.L., Y.-J.L., C.S., Q.-Z.W., and J.L.; writing—review and editing, C.-Y.H., Z.-X.Z., Y.-F.L., Y.-J.L., C.S., Q.-Z.W., and J.L.; funding acquisition, C.-Y.H., Q.-Z.W., and Z.-X.Z.; resources, C.-Y.H. and Z.-X.Z.; supervision, C.-Y.H. and Z.-X.Z. All authors have read and agreed to the published version of the manuscript.
Funding
This work was supported by the National Nature Science Foundation of China under Grant number 82270041, The Medical Scientific Research Foundation of Guangdong Province under Grant number B2025167, and the Science and Technology Projects in Guangzhou, China, under Grant numbers SL2022A04J00473, SL2023A04J00962, and 202201020299.
Institutional Review Board Statement
All procedures conducted in this study adhered to the ethical standards set by the appropriate national and institutional committees on human experimentation, as well as the Helsinki Declaration of 1975 and its 2008 revision. This retrospective analysis was approved by the Medical Ethics Committee of Guangzhou First People’s Hospital (approval number: K-2023-103-02 and date of approval: 19 August 2024).
Informed Consent Statement
All patients included in this study signed informed consent forms for fiberoptic bronchoscopy and alveolar lavage procedures.
Data Availability Statement
The original contributions presented in this study are included in the article/Supplementary Materials. Further inquiries can be directed to the corresponding author.
Conflicts of Interest
The authors declare no conflicts of interest.
Abbreviations
The following abbreviations are used in this manuscript:
| BALF | Bronchoalveolar lavage fluid |
| IFN | Interferon |
| ICU | Intensive care unit |
| mNGS | Metagenomic next-generation sequencing |
| PSM | Propensity score matching |
| MODS | Multiple organ dysfunction syndrome |
| NTC | Non-template control |
| RPM | Reads per million |
| IQR | Interquartile range |
| CHD | Coronary heart disease |
| COPD | Chronic obstructive pulmonary disease |
| ACE | Abundance-based coverage estimator |
References
- Ramirez, J.A.; Wiemken, T.L.; Peyrani, P.; Arnold, F.W.; Kelley, R.; Mattingly, W.A.; Nakamatsu, R.; Pena, S.; Guinn, B.E.; Furmanek, S.P.; et al. Adults hospitalized with pneumonia in the United States: Incidence, epidemiology, and mortality. Clin. Infect. Dis. 2017, 65, 1806–1812. [Google Scholar] [CrossRef]
- Fan, G.; Zhou, Y.; Zhou, F.; Yu, Z.; Gu, X.; Zhang, X.; Liu, Z.; Zhou, M.; Cao, B. The mortality and years of life lost for community-acquired pneumonia before and during COVID-19 pandemic in China. Lancet Reg. Health West. Pac. 2024, 42, 100968. [Google Scholar] [CrossRef] [PubMed]
- Azoulay, E.; Russell, L.; Van de Louw, A.; Metaxa, V.; Bauer, P.; Povoa, P.; Montero, J.G.; Loeches, I.M.; Mehta, S.; Puxty, K.; et al. Diagnosis of severe respiratory infections in immunocompromised patients. Intensive Care Med. 2020, 46, 298–314. [Google Scholar] [CrossRef]
- Seo, S.; Renaud, C.; Kuypers, J.M.; Chiu, C.Y.; Huang, M.L.; Samayoa, E.; Xie, H.; Yu, G.; Fisher, C.E.; Gooley, T.A.; et al. Idiopathic pneumonia syndrome after hematopoietic cell transplantation: Evidence of occult infectious etiologies. Blood 2015, 125, 3789–3797. [Google Scholar] [CrossRef]
- Filkins, L.M.; Bryson, A.L.; Miller, S.A.; Mitchell, S.L. Navigating clinical utilization of direct-from-specimen metagenomic pathogen detection: Clinical applications, limitations, and testing recommendations. Clin. Chem. 2020, 66, 1381–1395. [Google Scholar] [CrossRef]
- Toma, I.; Siegel, M.O.; Keiser, J.; Yakovleva, A.; Kim, A.; Davenport, L.; Devaney, J.; Hoffman, E.P.; Alsubail, R.; Crandall, K.A.; et al. Single-molecule long-read 16S sequencing to characterize the lung microbiome from mechanically ventilated patients with suspected pneumonia. J. Clin. Microbiol. 2014, 52, 3913–3921. [Google Scholar] [CrossRef]
- Shenoy, M.K.; Iwai, S.; Lin, D.L.; Worodria, W.; Ayakaka, I.; Byanyima, P.; Kaswabuli, S.; Fong, S.; Stone, S.; Chang, E.; et al. Immune response and mortality risk relate to distinct lung microbiomes in patients with HIV and pneumonia. Am. J. Respir. Crit. Care Med. 2017, 195, 104–114. [Google Scholar] [CrossRef]
- Langelier, C.; Kalantar, K.L.; Moazed, F.; Wilson, M.R.; Crawford, E.D.; Deiss, T.; Belzer, A.; Bolourchi, S.; Caldera, S.; Fung, M.; et al. Integrating host response and unbiased microbe detection for lower respiratory tract infection diagnosis in critically ill adults. Proc. Natl Acad. Sci. USA 2018, 115, E12353–E12362. [Google Scholar] [CrossRef]
- Pendleton, K.M.; Erb-Downward, J.R.; Bao, Y.; Branton, W.R.; Falkowski, N.R.; Newton, D.W.; Huffnagle, G.B.; Dickson, R.P. Rapid pathogen identification in bacterial pneumonia using real-time metagenomics. Am. J. Respir. Crit. Care Med. 2017, 196, 1610–1612. [Google Scholar] [CrossRef] [PubMed]
- Dickson, R.P.; Erb-Downward, J.R.; Martinez, F.J.; Huffnagle, G.B. The microbiome and the respiratory tract. Annu. Rev. Physiol. 2016, 78, 481–504. [Google Scholar] [CrossRef] [PubMed]
- Natalini, J.G.; Singh, S.; Segal, L.N. The dynamic lung microbiome in health and disease. Nat. Rev. Microbiol. 2023, 21, 222–235. [Google Scholar] [CrossRef] [PubMed]
- O’Dwyer, D.N.; Zhou, X.; Wilke, C.A.; Xia, M.; Falkowski, N.R.; Norman, K.C.; Arnold, K.B.; Huffnagle, G.B.; Murray, S.; Erb-Downward, J.R.; et al. Lung dysbiosis, inflammation, and injury in hematopoietic cell transplantation. Am. J. Respir. Crit. Care Med. 2018, 198, 1312–1321. [Google Scholar] [CrossRef]
- Segal, L.N.; Clemente, J.C.; Tsay, J.C.J.; Koralov, S.B.; Keller, B.C.; Wu, B.G.; Li, Y.; Shen, N.; Ghedin, E.; Morris, A.; et al. Enrichment of the lung microbiome with oral taxa is associated with lung inflammation of a Th17 phenotype. Nat. Microbiol. 2016, 1, 16031. [Google Scholar] [CrossRef] [PubMed]
- Chen, H.; Zhan, M.; Liu, S.; Balloux, F.; Wang, H. Unraveling the potential of metagenomic next-generation sequencing in infectious disease diagnosis: Challenges and prospects. Sci. Bull. 2024, 69, 1586–1589. [Google Scholar] [CrossRef]
- Rodino, K.G.; Simner, P.J. Status check: Next-generation sequencing for infectious-disease diagnostics. J. Clin. Investig. 2024, 134, e178003. [Google Scholar] [CrossRef]
- Jiang, L.; Han, L.; Zhong, Y.; Zhang, M.; Li, J.; Rao, G.; Xiang, S. High utility of bronchoalveolar lavage fluid metagenomic next-generation sequencing approach for etiological diagnosis of pneumonia. BMC Infect. Dis. 2024, 24, 1232. [Google Scholar] [CrossRef]
- Shi, Y.; Peng, J.M.; Hu, X.Y.; Yang, Q.W.; Wang, Y. Metagenomic next-generation sequencing for detecting aspergillosis pneumonia in immunocompromised patients: A retrospective study. Front. Cell. Infect. Microbiol. 2023, 13, 1209724. [Google Scholar] [CrossRef] [PubMed]
- Amar, Y.; Lagkouvardos, I.; Silva, R.L.; Ishola, O.A.; Foesel, B.U.; Kublik, S.; Schöler, A.; Niedermeier, S.; Bleuel, R.; Zink, A.; et al. Pre-digest of unprotected DNA by benzonase improves the representation of living skin bacteria and efficiently depletes host DNA. Microbiome 2021, 9, 123. [Google Scholar] [CrossRef]
- Zhu, N.; Zhou, D.; Xiong, W.; Zhang, X.; Li, S. Performance of mNGS in bronchoalveolar lavage fluid for the diagnosis of invasive pulmonary aspergillosis in non-neutropenic patients. Front. Cell. Infect. Microbiol. 2023, 13, 1271853. [Google Scholar] [CrossRef]
- Miller, S.; Naccache, S.N.; Samayoa, E.; Messacar, K.; Arevalo, S.; Federman, S.; Stryke, D.; Pham, E.; Fung, B.; Bolosky, W.J.; et al. Laboratory validation of a clinical metagenomic sequencing assay for pathogen detection in cerebrospinal fluid. Genome Res. 2019, 29, 831–842. [Google Scholar] [CrossRef]
- Li, H.; Gao, H.; Meng, H.; Wang, Q.; Li, S.; Chen, H.; Li, Y.; Wang, H. Detection of pulmonary infectious pathogens from lung biopsy tissues by metagenomic next-generation sequencing. Front. Cell. Infect. Microbiol. 2018, 8, 205. [Google Scholar] [CrossRef]
- Xu, Y.; Kang, L.; Shen, Z.; Li, X.; Wu, W.; Ma, W.; Fang, C.; Yang, F.; Jiang, X.; Gong, S.; et al. Dynamics of severe acute respiratory syndrome coronavirus 2 genome variants in the feces during convalescence. J. Genet. Genom. 2020, 47, 610–617. [Google Scholar] [CrossRef] [PubMed]
- Bolger, A.M.; Lohse, M.; Usadel, B. Trimmomatic: A flexible trimmer for Illumina sequence data. Bioinformatics 2014, 30, 2114–2120. [Google Scholar] [CrossRef] [PubMed]
- Li, H.; Durbin, R. Fast and accurate short read alignment with burrows-wheeler transform. Bioinformatics 2009, 25, 1754–1760. [Google Scholar] [CrossRef]
- Zhang, X.; Chen, H.; Han, D.; Wu, W. Clinical usefulness of metagenomic next-generation sequencing for Rickettsia and Coxiella burnetii diagnosis. Eur. J. Clin. Microbiol. Infect. Dis. 2023, 42, 681–689. [Google Scholar] [CrossRef]
- Hu, C.Y.; Cui, W.S.; Lei, Y.; Tang, Y.W.; Zhang, Y.Y.; Su, Q.M.; Peng, F.; Zeng, Y.F.; Song, J.L.; Luo, C.N.; et al. Comparison of azvudine and nirmatrelvir/ritonavir and combined use in patients with COVID-19. Infect. Drug Resist. 2023, 16, 7797–7808. [Google Scholar] [CrossRef]
- Li, Y.; Fu, X.; Ma, J.; Zhang, J.; Hu, Y.; Dong, W.; Wan, Z.; Li, Q.; Kuang, Y.Q.; Lan, K.; et al. Altered respiratory virome and serum cytokine profile associated with recurrent respiratory tract infections in children. Nat. Commun. 2019, 10, 2288. [Google Scholar] [CrossRef]
- Cheng, C.; Wang, Z.; Wang, J.; Ding, C.; Sun, C.; Liu, P.; Xu, X.; Liu, Y.; Chen, B.; Gu, B. Characterization of the lung microbiome and exploration of potential bacterial biomarkers for lung cancer. Transl. Lung Cancer Res. 2020, 9, 693–704. [Google Scholar] [CrossRef]
- Checinska, A.; Probst, A.J.; Vaishampayan, P.; White, J.R.; Kumar, D.; Stepanov, V.G.; Fox, G.E.; Nilsson, H.R.; Pierson, D.L.; Perry, J.; et al. Microbiomes of the dust particles collected from the international space station and spacecraft assembly facilities. Microbiome 2015, 3, 50. [Google Scholar] [CrossRef] [PubMed]
- Zhang, Y.J.; Yang, W.J.; Liu, D.; Cao, Y.Q.; Zheng, Y.Y.; Han, Y.C.; Jin, R.S.; Han, Y.; Wang, X.Y.; Pan, A.S.; et al. COVID-19 and early-stage lung cancer both featuring ground-glass opacities: A propensity score-matched study. Transl. Lung Cancer Res. 2020, 9, 1516–1527. [Google Scholar] [CrossRef]
- Yang, Q.; Zhou, Y.; Wang, X.; Gao, S.; Xiao, Y.; Zhang, W.; Hu, Y.; Wang, Y. Effect of hypertension on outcomes of adult inpatients with COVID-19 in Wuhan, China: A propensity score-matching analysis. Respir. Res. 2020, 21, 172. [Google Scholar] [CrossRef]
- Zimmermann, A.; Knecht, H.; Häsler, R.; Zissel, G.; Gaede, K.I.; Hofmann, S.; Nebel, A.; Müller-Quernheim, J.; Schreiber, S.; Fischer, A. Atopobium and fusobacterium as novel candidates for sarcoidosis-associated microbiota. Eur. Respir. J. 2017, 50, 1600746. [Google Scholar] [CrossRef]
- Jin, H.; Hu, G.; Sun, C.; Duan, Y.; Zhang, Z.; Liu, Z.; Zhao, X.M.; Chen, W.H. mBodyMap: A curated database for microbes across human body and their associations with health and diseases. Nucleic Acids Res. 2022, 50, D808–D816. [Google Scholar] [CrossRef] [PubMed]
- Erb-Downward, J.R.; Thompson, D.L.; Han, M.K.; Freeman, C.M.; McCloskey, L.; Schmidt, L.A.; Young, V.B.; Toews, G.B.; Curtis, J.L.; Sundaram, B.; et al. Analysis of the lung microbiome in the “healthy” smoker and in COPD. PLoS ONE 2011, 6, e16384. [Google Scholar] [CrossRef] [PubMed]
- Zhao, J.; Schloss, P.D.; Kalikin, L.M.; Carmody, L.A.; Foster, B.K.; Petrosino, J.F.; Cavalcoli, J.D.; VanDevanter, D.R.; Murray, S.; Li, J.Z.; et al. Decade-long bacterial community dynamics in cystic fibrosis airways. Proc. Natl Acad. Sci. USA 2012, 109, 5809–5814. [Google Scholar] [CrossRef] [PubMed]
- Morris, A.; Beck, J.M.; Schloss, P.D.; Campbell, T.B.; Crothers, K.; Curtis, J.L.; Flores, S.C.; Fontenot, A.P.; Ghedin, E.; Huang, L.; et al. Comparison of the respiratory microbiome in healthy nonsmokers and smokers. Am. J. Respir. Crit. Care Med. 2013, 187, 1067–1075. [Google Scholar] [CrossRef]
- Wypych, T.P.; Wickramasinghe, L.C.; Marsland, B.J. The influence of the microbiome on respiratory health. Nat. Immunol. 2019, 20, 1279–1290. [Google Scholar] [CrossRef]
- Rogers, G.B.; Zain, N.M.M.; Bruce, K.D.; Burr, L.D.; Chen, A.C.; Rivett, D.W.; McGuckin, M.A.; Serisier, D.J. A novel microbiota stratification system predicts future exacerbations in bronchiectasis. Ann. Am. Thorac. Soc. 2014, 11, 496–503. [Google Scholar] [CrossRef]
- Goto, T. Microbiota and lung cancer. Semin. Cancer Biol. 2022, 86, 1–10. [Google Scholar] [CrossRef]
- Charlson, E.S.; Diamond, J.M.; Bittinger, K.; Fitzgerald, A.S.; Yadav, A.; Haas, A.R.; Bushman, F.D.; Collman, R.G. Lung-enriched organisms and aberrant bacterial and fungal respiratory microbiota after lung transplant. Am. J. Respir. Crit. Care Med. 2012, 186, 536–545. [Google Scholar] [CrossRef]
- Fodor, A.A.; Klem, E.R.; Gilpin, D.F.; Elborn, J.S.; Boucher, R.C.; Tunney, M.M.; Wolfgang, M.C. The adult cystic fibrosis airway microbiota is stable over time and infection type, and highly resilient to antibiotic treatment of exacerbations. PLoS ONE 2012, 7, e45001. [Google Scholar] [CrossRef] [PubMed]
- Salk, H.M.; Simon, W.L.; Lambert, N.D.; Kennedy, R.B.; Grill, D.E.; Kabat, B.F.; Poland, G.A. Taxa of the nasal microbiome are associated with influenza-specific IgA response to live attenuated influenza vaccine. PLoS ONE 2016, 11, e0162803. [Google Scholar] [CrossRef]
- Hilty, M.; Burke, C.; Pedro, H.; Cardenas, P.; Bush, A.; Bossley, C.; Davies, J.; Ervine, A.; Poulter, L.; Pachter, L.; et al. Disordered microbial communities in asthmatic airways. PLoS ONE 2010, 5, e8578. [Google Scholar] [CrossRef]
- Perea, L.; Bottier, M.; Cant, E.; Richardson, H.; Dicker, A.J.; Shuttleworth, M.; Giam, Y.H.; Abo-Leyah, H.; Finch, S.; Huang, J.T.J.; et al. Airway IL-1β is related to disease severity and mucociliary function in bronchiectasis. Eur. Respir. J. 2024, 64, 2301966. [Google Scholar] [CrossRef] [PubMed]
- Thorsen, J.; Rasmussen, M.A.; Waage, J.; Mortensen, M.; Brejnrod, A.; Bønnelykke, K.; Chawes, B.L.; Brix, S.; Sørensen, S.J.; Stokholm, J.; et al. Infant airway microbiota and topical immune perturbations in the origins of childhood asthma. Nat. Commun. 2019, 10, 5001. [Google Scholar] [CrossRef] [PubMed]
Disclaimer/Publisher’s Note: The statements, opinions and data contained in all publications are solely those of the individual author(s) and contributor(s) and not of MDPI and/or the editor(s). MDPI and/or the editor(s) disclaim responsibility for any injury to people or property resulting from any ideas, methods, instructions or products referred to in the content. |
© 2025 by the authors. Licensee MDPI, Basel, Switzerland. This article is an open access article distributed under the terms and conditions of the Creative Commons Attribution (CC BY) license (https://creativecommons.org/licenses/by/4.0/).