1. Introduction
Since the introduction of penicillin in the 1940s, antibiotics have significantly reduced the burden of bacterial infections, including pneumonia, sepsis, and wound infections [
1]. However, the widespread and often inappropriate use of antibiotics has accelerated the emergence and dissemination of antibiotic-resistant bacteria. This trend poses a serious threat to global public health and clinical treatment effectiveness. According to a comprehensive analysis, antimicrobial resistance (AR) was directly responsible for an estimated 1.27 million deaths in 2019 and contributed to nearly 5 million deaths globally. Without effective intervention, AMR-related deaths are projected to rise to 10 million annually by 2050, with cumulative deaths exceeding 39 million from 2025 to 2050 [
2].
The development of resistance is not limited to acquired resistance through horizontal gene transfer, such as plasmids or transposons [
3]. Accumulating evidence indicates that many bacterial strains rapidly develop resistance to antibiotics, including newly introduced synthetic antibiotics, shortly after their clinical application. These cases cannot be explained solely by traditional acquired resistance theories, highlighting the critical role of spontaneous (or intrinsic) resistance mechanisms [
4,
5]. Spontaneous resistance involves innate genomic adaptations such as mutations in drug targets, changes in membrane permeability, activation of efflux pumps, and reprogramming of gene expression, including tRNA rearrangements, without the involvement of exogenous genes [
6,
7].
Our previous studies have shown that under antibiotic-induced oxidative stress, bacteria can rapidly upregulate tRNA levels through RecA-mediated genome recombination, sustaining translational elongation and survival [
8,
9]. This early-stage adaptation provides bacteria with a generalized resistance strategy, even in the absence of specific resistance genes or target mutations [
8]. Therefore, early intervention against this RecA-mediated adaptive process may delay or prevent the emergence of drug-resistant strains.
RecA plays a central role in bacterial homologous recombination and SOS response in almost all bacteria [
10]. We and other researchers have found that RecA deletion reduces the resistance of clinical
E. coli strains against multiple antibiotics [
11]. Inhibition of RecA activity can disrupt bacterial DNA repair and reduces the mutagenesis of
E. coli that was exposed to antibiotics [
12]. In contrast, elevated RecA expression enhances the AR of
Proteus spp. strains against ciprofloxacin [
13]. These results indicated that the RecA should be a universal target of AR in bacteria. Although knocking out RecA is not possible in clinical treatment, we postulate that inhibiting RecA using RecA inhibitors may serve as a practical way to prevent or delay AR evolution. Several chemotypes of RecA inhibitors have been described with two main modes of action: (i) compounds that block ssDNA-stimulated ATP hydrolysis and/or destabilize RecA–ssDNA filaments, thereby preventing recombination and the co-protease activity that drives SOS induction; and (ii) agents that interfere with filament assembly on ssDNA and reduce recombination-dependent mutagenesis [
14].
High-throughput screening has identified the compound BRITE-338733 (BR), a 2-amino-4,6-diarylpyridine derivative with potent RecA ATPase inhibition (
= 4.7
) [
15]. In this study, we constructed a long-term adaptation model using
E. coli BW25113 exposed to sublethal doses of various antibiotics, with or without BR co-treatment. We evaluated the effect of BR on bacterial growth kinetics, tRNA regulation, RecA expression, and transcriptome dynamics, aiming to elucidate the molecular mechanism by which BR suppresses spontaneous AR [
16]. This study provides a potential pharmacological strategy for inhibiting early resistance mechanisms and preventing the escalation to high-level resistance.
2. Materials and Methods
2.1. Bacterial Strains and Cell Lines
Escherichia coli strain BW25113 was purchased from the Coli Genetic Stock Center of Yale University (New Haven, CT, USA) [
17]. The reference genome sequence NZ_CP009273.1 and its annotation (downloaded from NCBI) were used in the bioinformatics. The human normal lung epithelial cell line BEAS-2B and human non-small cell lung cancer cell lines A549, H292, and H1299 used in this study were obtained from our research group and purchased from ATCC [
18]. During cell culture, strict mycoplasma testing was performed regularly to ensure that the cells were free of mycoplasma contamination.
2.2. Serial Passage of Bacteria with Antibiotics and RecA Inhibitor
The RecA inhibitor used in this study was BRITE-338733 (2-(4-(5-ethylfuran-2-yl)-6-(2,2,6,6-tetramethylpiperidin-4-ylamino)pyridin-2-yl)-4-methylphenol), purchased from Shanghai Yuanye Bio-Technology Co., Ltd. (Shanghai, China). CAS: 503105-88-2; formula
; molecular weight (MW) 433.5857; purity ≥98%. BR is a synthetic small molecule originally sourced from the BRITE diversity compound library (Biogen-Idec, Cambridge, MA, USA) [
15]. For experiments, a concentrated stock was prepared in 95% ethanol, aliquoted, protected from light, and stored at
; working solutions (0.1–10
) were freshly prepared in culture medium. The final vehicle (ethanol) content was kept at ≤0.1% (
v/
v) in all conditions, and vehicle controls were included. Identity of the batch used was confirmed
H NMR (
Figure A2).
In this study, the inhibitory effect of BR on the initial universal resistance mechanisms of bacteria during adaptation to antibiotics was tested using the sensitive strain BW25113 [
15]. The experiment consisted of two groups: the single antibiotic adaptation group (control) and the BR-antibiotic combination adaptation group.
For the single antibiotic adaptation group, BW25113 was cultured in LB medium from a single colony as generation 0. Bacteria were inoculated at a 1:500 dilution into fresh LB medium containing 1/2 minimum inhibitory concentration (MIC) antibiotics and incubated at
with shaking at 200 rpm for 12 h [
19]. MICs were re-evaluated every 12 h, and this process was repeated for 15 generations.
For the BR-antibiotic combination adaptation group, six concentrations of BR (10 , 5 , 1 , 0.5 , 0.2 , and 0.1 ) were tested in combination with five antibiotics: ciprofloxacin (CIP), ampicillin (AMP), polymyxin B (PMB), kanamycin (KAN), and tetracycline (TET). BR was used to inhibit the bacteria’s initial universal resistance mechanisms, such as tRNA rearrangement, during adaptation. Bacteria were subjected to the same 12 h cycle, and MICs were determined for each generation to evaluate the inhibitory effect of BR on resistance development.
MICs were measured for each generation using 48-well plates containing serial dilutions of antibiotics, and the lowest concentration with OD600 < 0.1 was recorded as the MIC [
20]. Bacterial populations from each generation were pooled and subjected to transcriptomic sequencing and bioinformatics analysis to characterize the molecular dynamics underlying adaptive evolution and antibiotic resistance development.
2.3. Assessment of Mammalian Cell Proliferation and Viability
Cells in the logarithmic growth phase were seeded into a 96-well plate at a density of 5000 cells per well, with three replicates for each drug concentration. A drug gradient was prepared by adding drugs to the culture medium at a volume of 200 per well to achieve the following final concentrations: 0.06, 0.12, 0.24, 0.49, 0.98, 1.95, 3.91, 7.81, 15.63, 31.25, 62.50, and 125 . After the cells adhered to the plate, the supernatant was removed, and 200 of the drug-containing culture medium was added to each well. The cells were incubated for 48 h in a humidified incubator. Following the incubation, CCK-8 solution was added to each well, and the absorbance at 450 nm was measured. The absorbance values were plotted against the drug concentrations to analyze the effects of different drug concentrations on cell proliferation.
2.4. Quantitative Analysis of tRNA Expression by Gel Electrophoresis
Equal amounts of RNA samples from a selected generation were loaded and subjected to electrophoresis. The agarose electrophoresis was performed at 120 mV for 30 min on a 1% agarose gel, and the polyacrylamide electrophoresis was run at 120 mV for 120 min on a 15% polyacrylamide gel. The grayscale of the rRNA and tRNA bands was measured and analyzed using Adobe Photoshop (version 13.0).
2.5. Transcriptome Sequencing
The bacterial cells were harvested by centrifugation at 4 °C, 4000×
g for 5 min. The cell pellet was resuspended and washed using PBS. The cells were treated with using 1.25 mg/mL lysozyme at 4 °C for 10 min and collected by centrifugation at 5000×
g for 5 min. The pellet was dissolved in 1 mL Trizol reagent, and the RNA was extracted using the Trizol method. Total RNA was extracted from bacterial samples collected from two repeated experiments for each group. RNA sequencing was performed by Chi Biotech Co., Ltd. (Shenzhen, China) and Novogene Co., Ltd. (Beijing, China). After library construction and sequencing, mapping and analysis were performed by Chi-Cloud with FANSe3 [
21].
Gene expression levels were quantified as read counts and RPKM (reads per kilobase per million mapped reads). Pearson correlation coefficients (R) were calculated between samples and visualized using the
pheatmap package in R software (version 3.5.3). Hierarchical clustering and correlation heatmaps were generated to evaluate data consistency [
22,
23].
Differentially expressed genes (DEGs) were identified using the DESeq2 package (version 1.26.0), with thresholds of fold change >2 and adjusted
p-value < 0.05 [
24]. GO and KEGG enrichment analyses were performed using the
clusterProfiler R package (version 3.14.3) [
25]. GO terms were categorized into biological process (BP), molecular function (MF), and cellular component (CC). Enriched pathways related to translation, ribosome structure, electron transport, and oxidative metabolism were analyzed to understand transcriptional changes under antibiotic stress and BR treatment.
2.6. Bacterial Growth Curve Analysis
Bacterial growth (OD600) was monitored using a growth detection device (Chi Biotech Co., Ltd., Zhang’s Laboratory). The bacteria were incubated at 37 °C with shaking for 12 h. Data before 2 h were excluded to account for the adaptation phase, and data after 2 h were used for curve fitting.
The bacterial growth data were analyzed using the corrected Gompertz model (Equation (
1)) and fitted with Origin 2021 software (OriginLab, Northampton, MA, USA) [
26].
where
t represents time (min);
is the absorbance at time
t;
and
are the maximum and minimum OD values, respectively;
is the maximum growth rate (
); and
is the lag phase duration (min).
2.7. Western Blotting
The bacterial protein was isolated after bacterial lysis and was quantified by Pierce Quantitative Colorimetric Peptide Assay (Thermo, Waltham, MA, USA). After being separated by SDS-PAGE, the protein was transferred to a PVDF membrane and blocked with 5% milk for 2 h. The membrane was incubated with the primary antibody at 4 °C overnight, followed with incubation of the corresponding secondary antibody at room temperature for 1 h. The protein signal bands were detected and visualized by enhanced chemiluminescence.
2.8. Statistical Analysis
All data in this study were analyzed and plotted using GraphPad Prism 10.1.2 for Windows (GraphPad Prism Software, San Diego, CA, USA). One-way analysis of variance (ANOVA) was used to analyze the mean difference in the normal distribution data. For data that did not follow a normal distribution, the Kruskal–Wallis (KW) test was applied to assess group differences. * , **, ***, or ****; these experimental results were considered to have significant differences.
3. Results
3.1. BR Suppresses CIP-Induced Resistance Development in E. coli BW25113
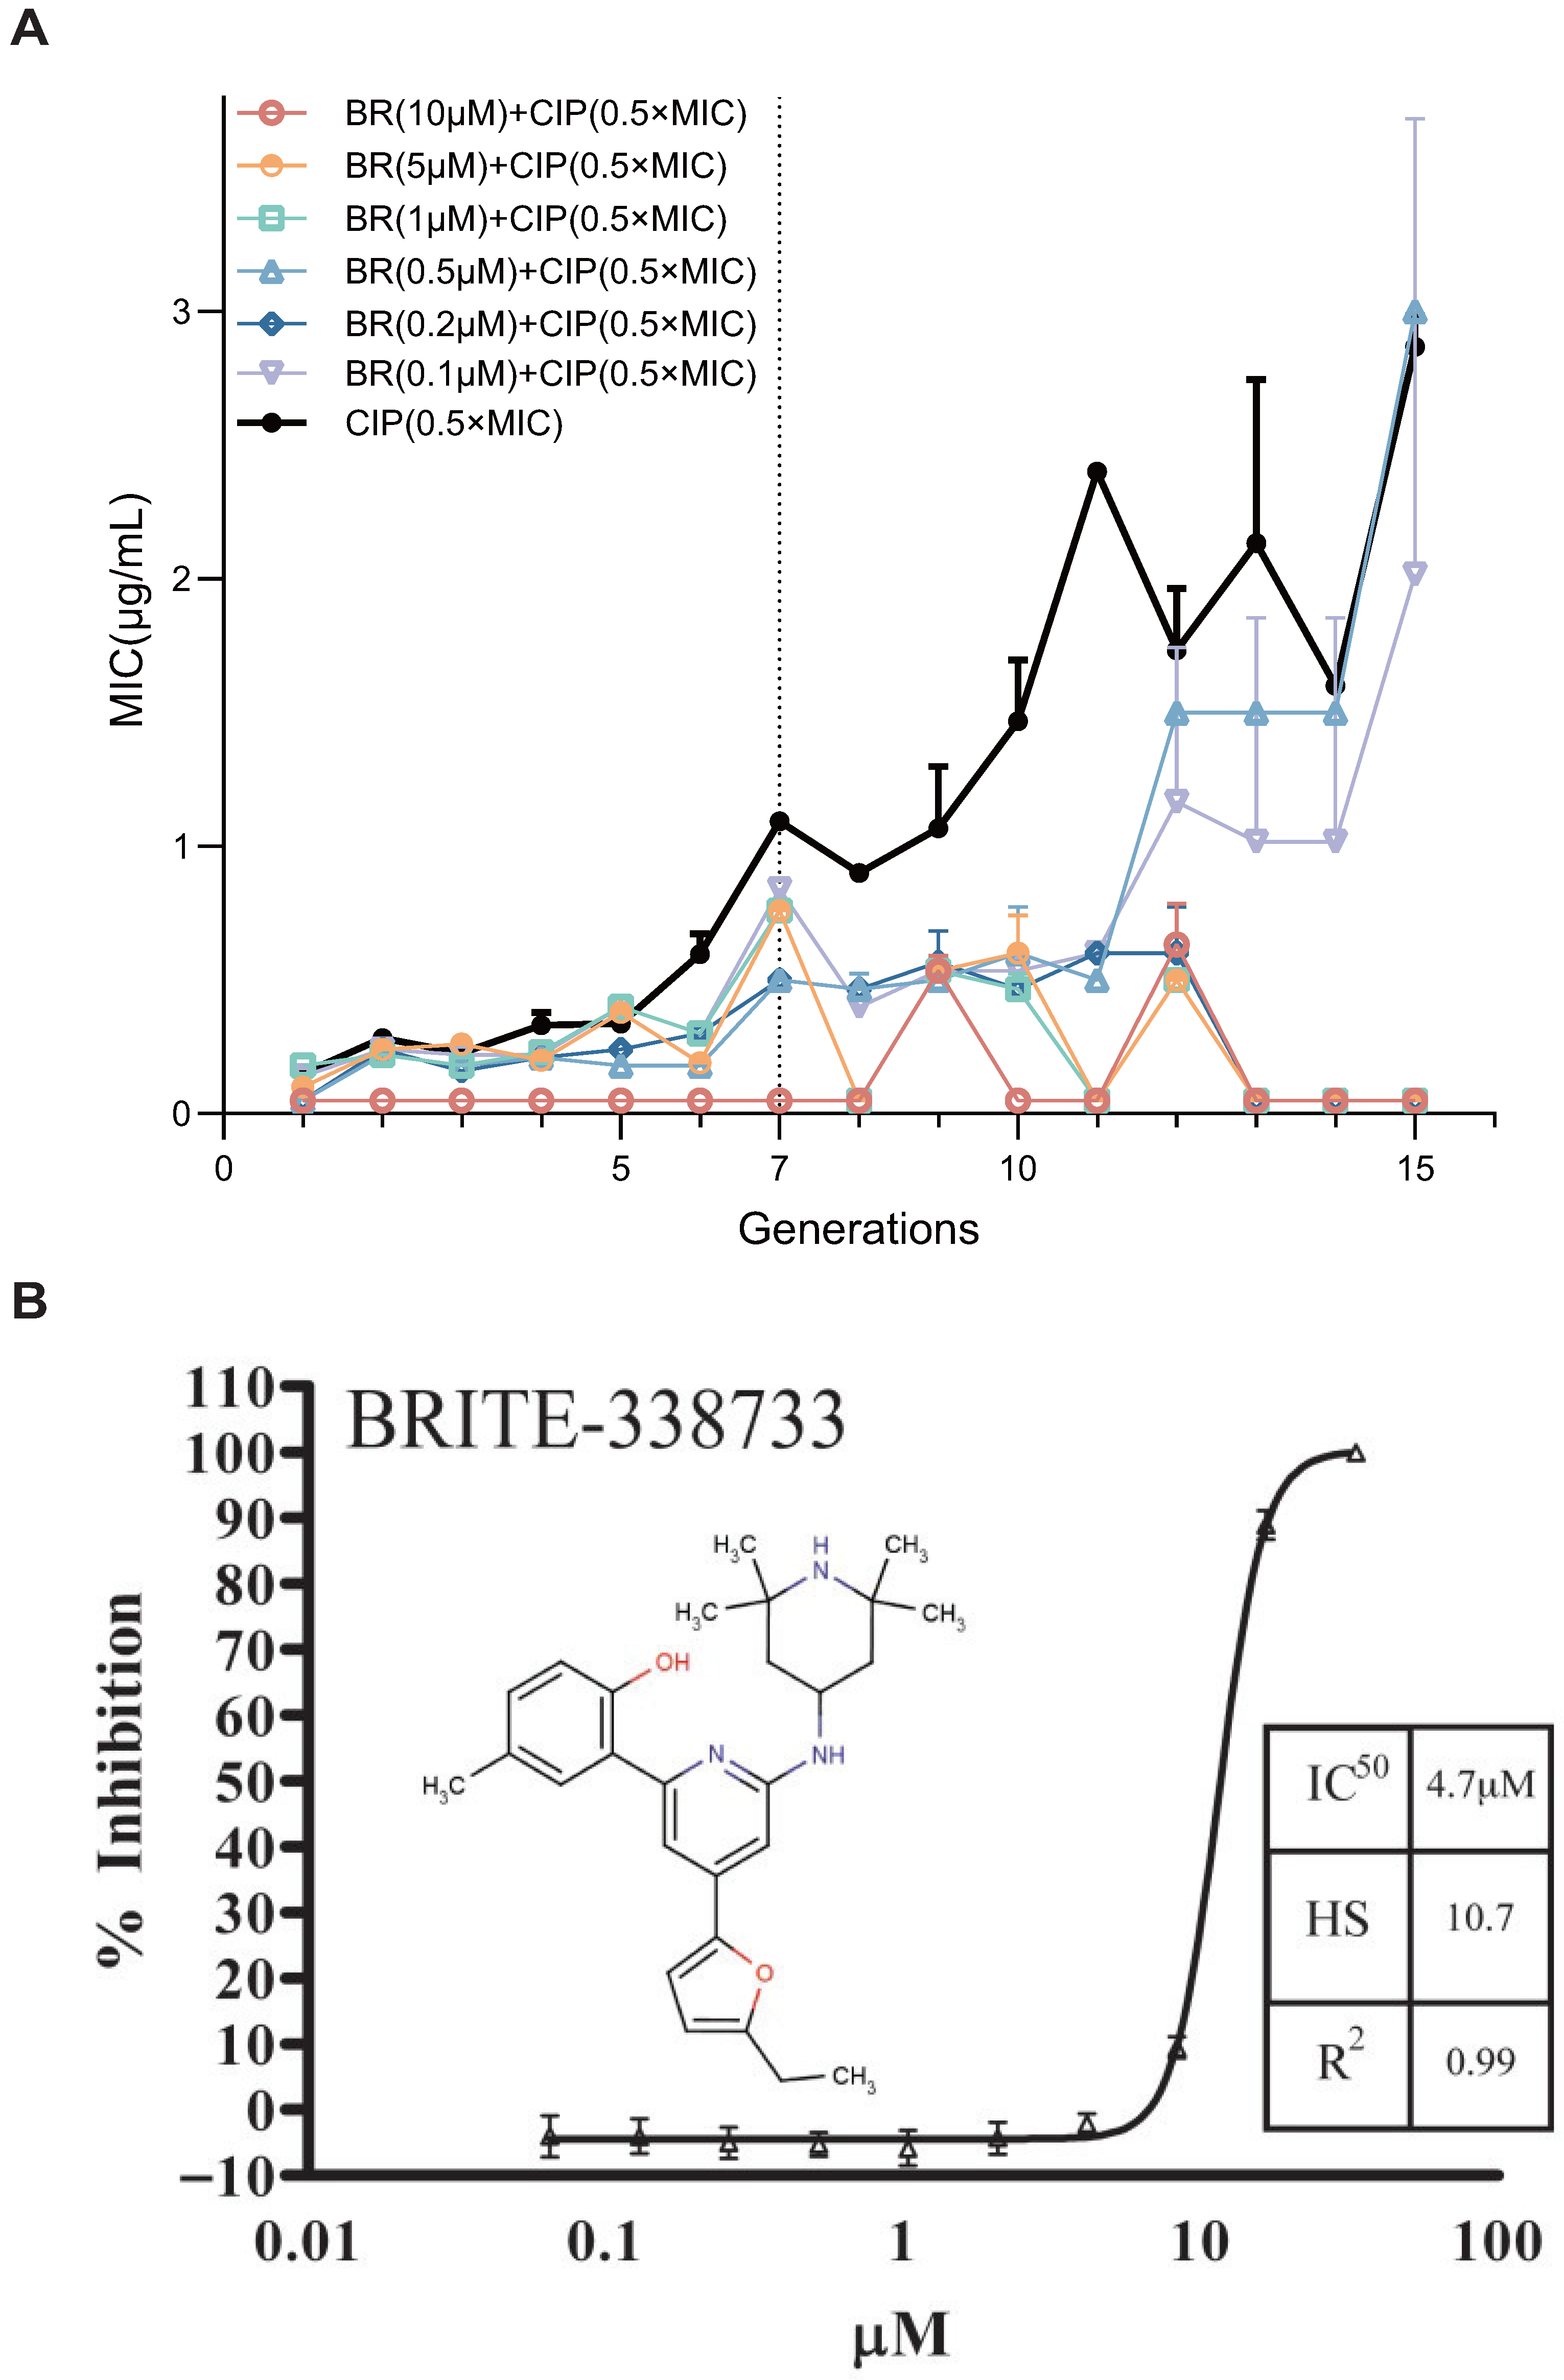
To evaluate the ability of BR, a RecA inhibitor, to suppress the spontaneous development of AR, we established an in vitro resistance evolution model. BR’s chemical structure and its RecA ATPase dose-response (
= 4.7
) are shown in
Figure 1B [
15].
Escherichia coli BW25113 was serially passaged for 15 generations under sub-inhibitory pressure of CIP (0.5× MIC), with or without six concentrations of BR (10, 5, 1, 0.5, 0.2, and 0.1
). MIC values were recorded every generation to evaluate the kinetics of resistance acquisition (
Figure 1A) [
27].
In the absence of BR, the MIC of CIP increased steadily with generations, indicating successful resistance evolution. BR at high concentrations (10, 5, 1, and 0.2 ) completely suppressed MIC elevation throughout all 15 generations. BR at 0.5 and 0.2 showed partial inhibition, delaying MIC increase until later generations (Generation 12–15).
These findings suggest that BR can dose-dependently suppress early-stage resistance adaptation to CIP. Notably, BR at concentrations ≥1 can fully inhibit resistance development, likely by interfering with the key molecular pathways required for early-stage adaptation.
3.2. BR Selectively Inhibits Antibiotic Resistance Development Without Significant Cytotoxicity in Mammalian Cells
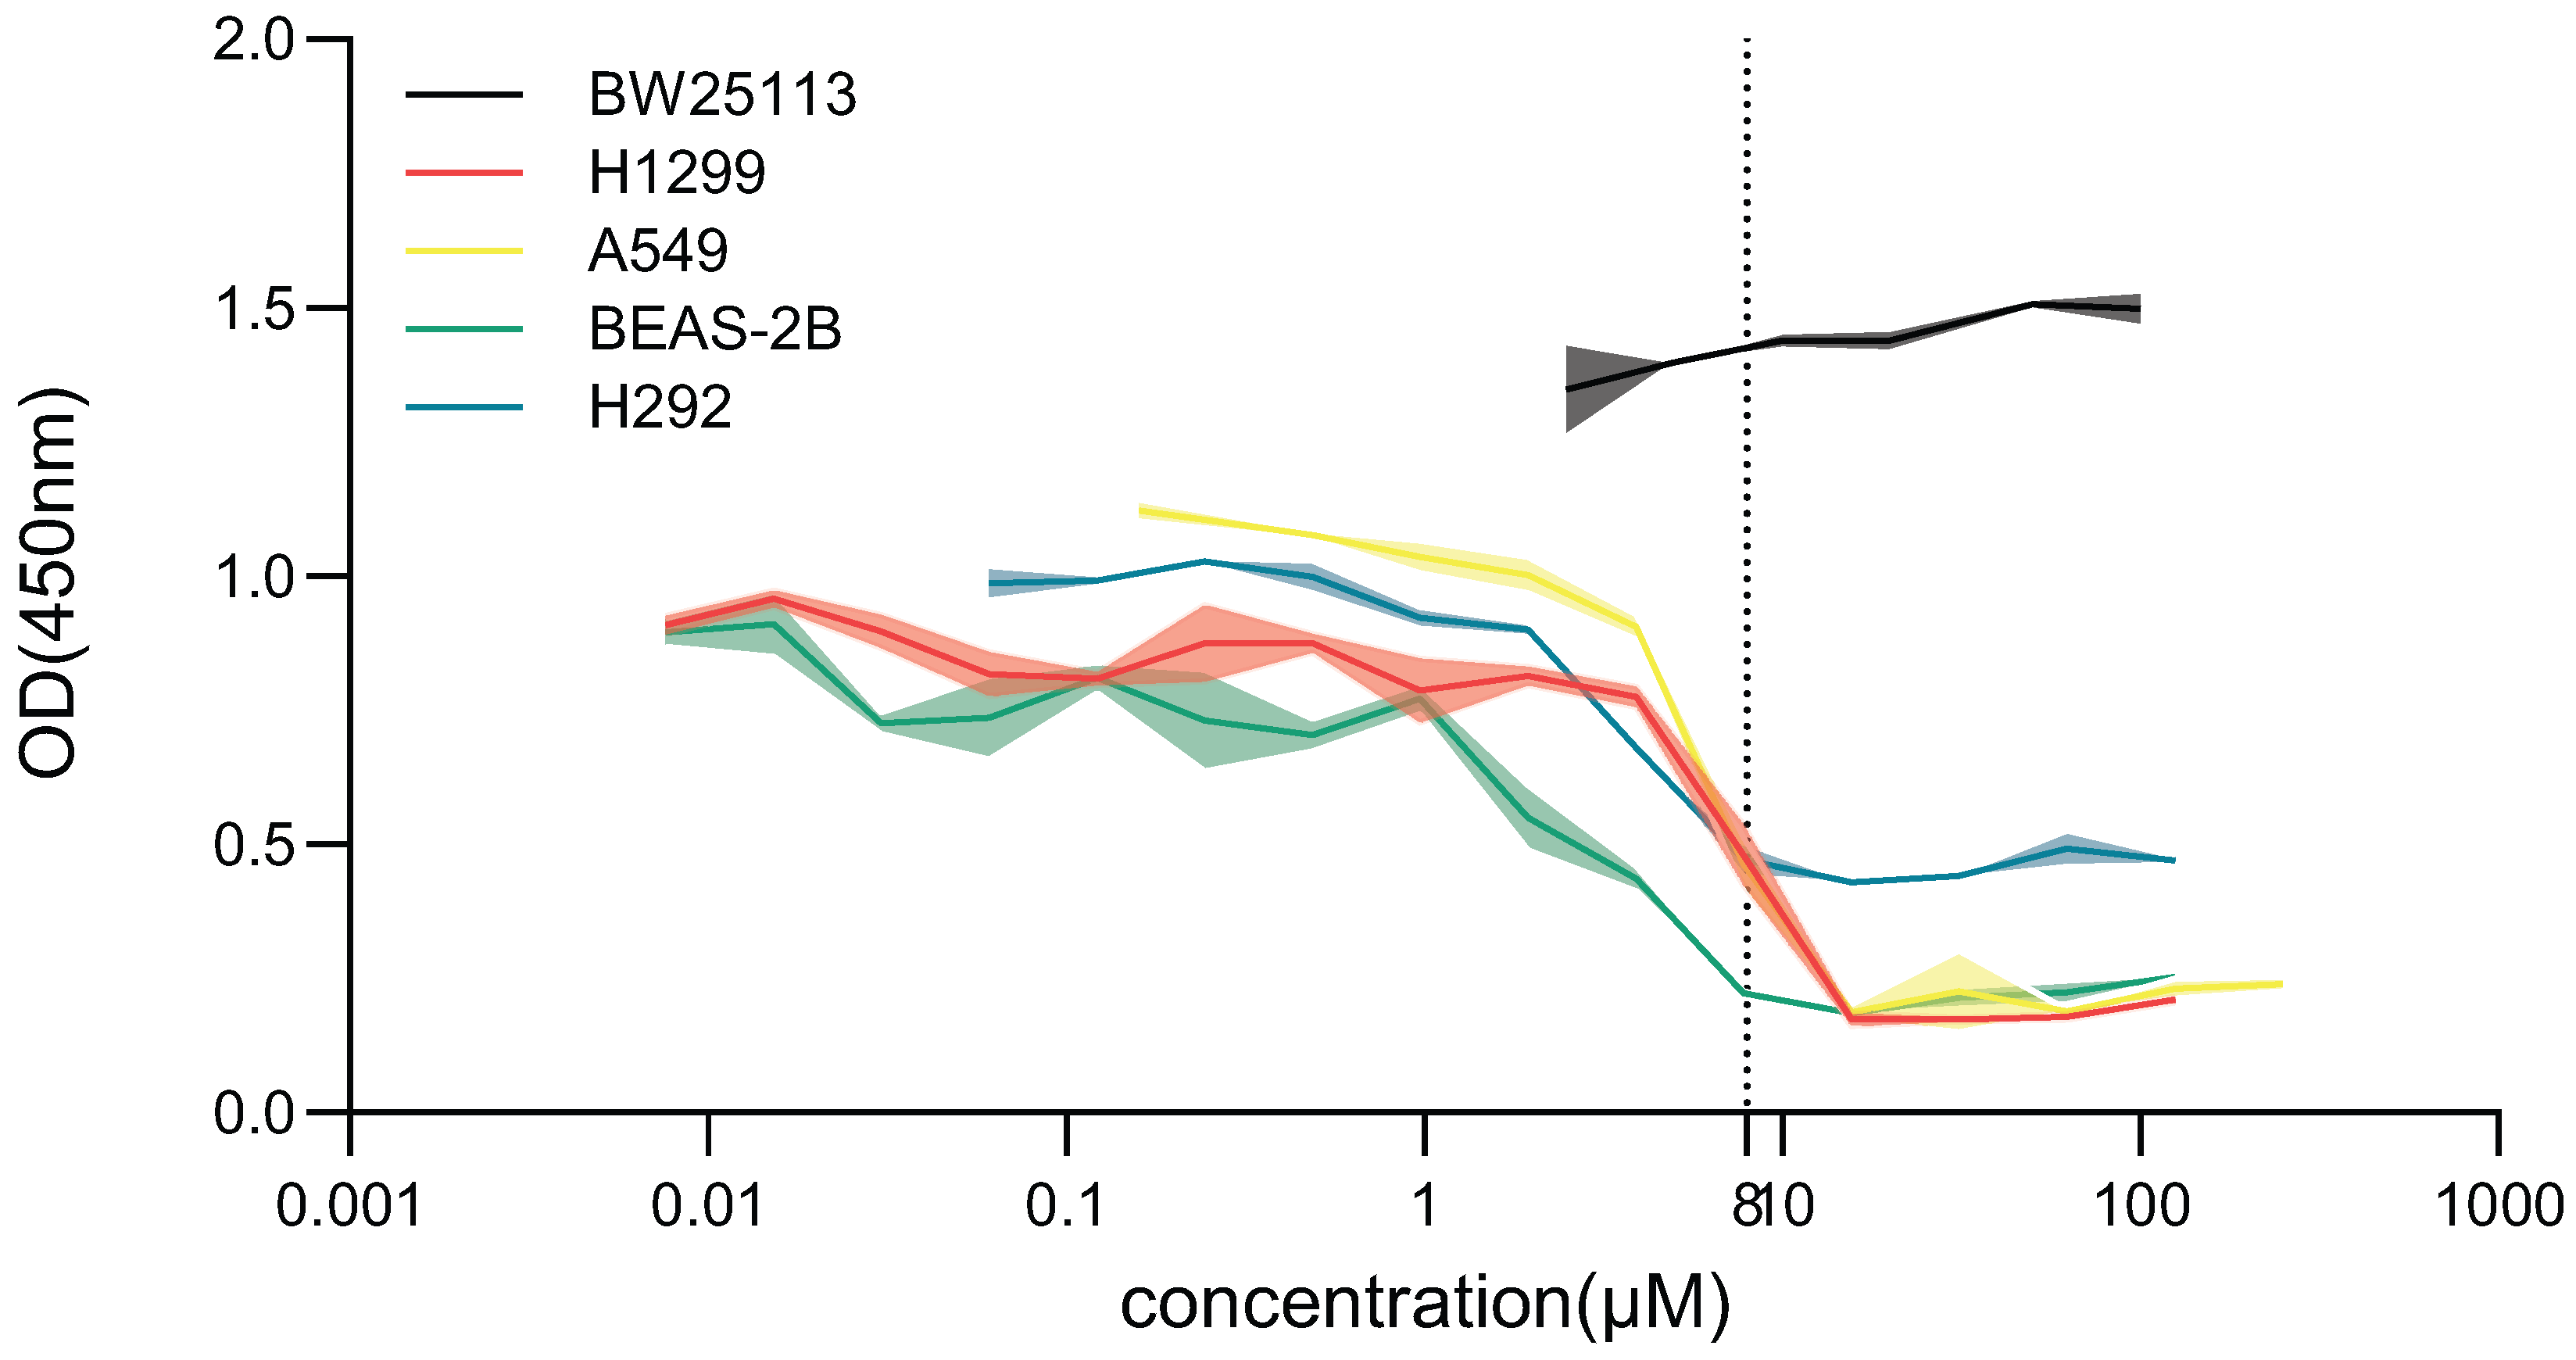
To assess the safety profile of BR within its effective concentration range, we evaluated its effects on both bacterial and human cell proliferation. Four representative human cell lines—H1299, A549, BEAS-2B, and H292—were exposed to BR at concentrations ranging from 0.06 to 125 for 48 h. Cell viability was assessed using the CCK-8 assay.
At BR concentrations ≥ 7.81
, proliferation of H1299, A549, and H292 cells was significantly suppressed, whereas BEAS-2B cells showed reduced viability only at ≥3.91
. In contrast, no significant cytotoxicity was observed in the 0.1–1.0
range across all four cell lines, indicating that BR is well tolerated at concentrations effective for resistance inhibition (
Figure 2).
Furthermore, BR did not impair the growth of
E. coli BW25113 at any concentration tested 0–100
, as OD450 values remained stable, confirming that BR is non-toxic to bacteria under normal culture conditions and does not affect bacterial viability in the absence of antibiotic pressure (
Figure 2).
These findings confirm that BR exerts favorable selectivity, inhibiting resistance evolution while sparing bacterial growth and mammalian cell viability at therapeutic concentrations. This safety profile supports the potential clinical application of BR as an adjuvant compound in antimicrobial therapy.
3.3. BR Inhibits Growth Fitness and Adaptive Evolution of Drug-Resistant BW25113
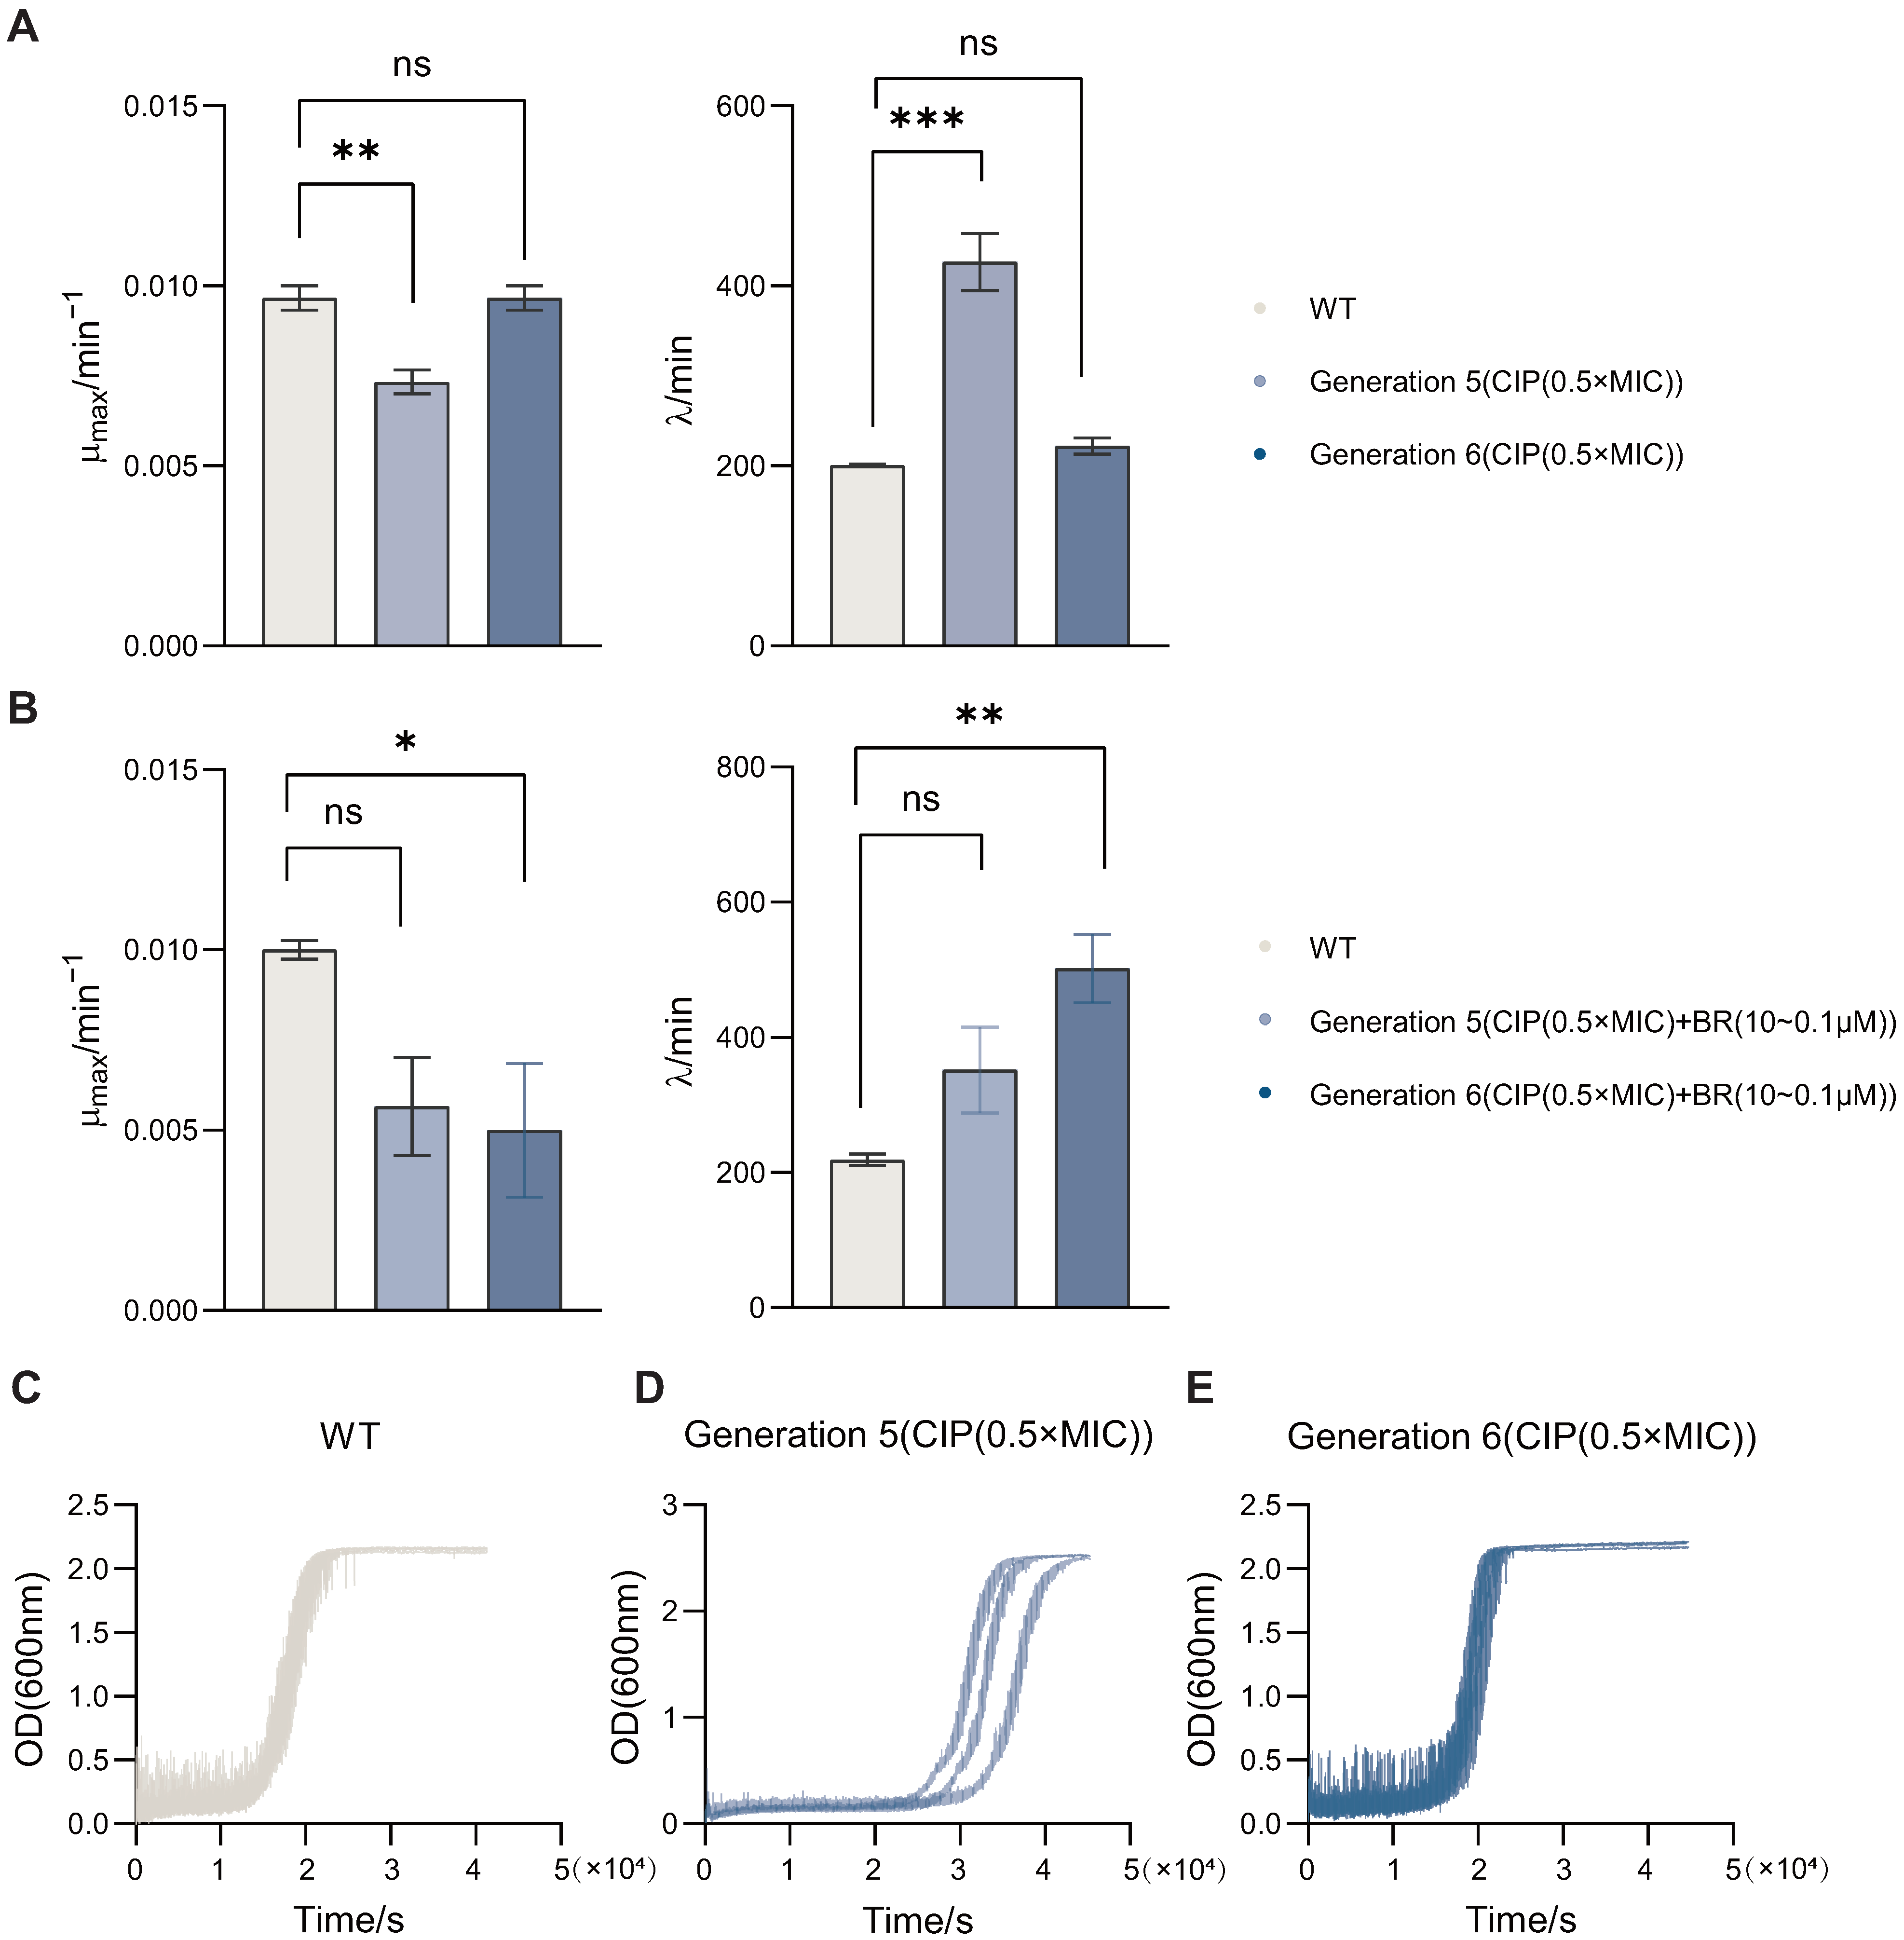
To assess how BR affects bacterial growth dynamics during resistance adaptation, we monitored the growth kinetics of BW25113 strains passaged under CIP (0.5× MIC), with or without BR treatment. Bacterial growth was recorded over time and fitted to the modified Gompertz model to derive key parameters including maximum growth rate () and lag time ().
By comparing wild-type (WT) and passaged strains, we found that (
Figure 3A) CIP-only passaging for five generations significantly reduced
(
) and prolonged
(
) versus WT. As shown in
Figure 3B, co-treatment with CIP and BR in sixth-generation strains also decreased
and increased
relative to WT. Representative growth curves for WT and CIP-passaged strains (Gen5 and Gen6) are shown in
Figure 3C–E. These results indicate that BR is associated with reduced
and extended
during the early stage of adaptation.
Since a high and short lag time are commonly associated with strong bacterial viability and potential virulence, these shifts suggest that BR may attenuate the fitness of adapting populations. Compared with CIP monotherapy, the CIP + BR combination produced larger changes—particularly at Generation 6, supporting a role for BR in suppressing early-stage spontaneous resistance development.
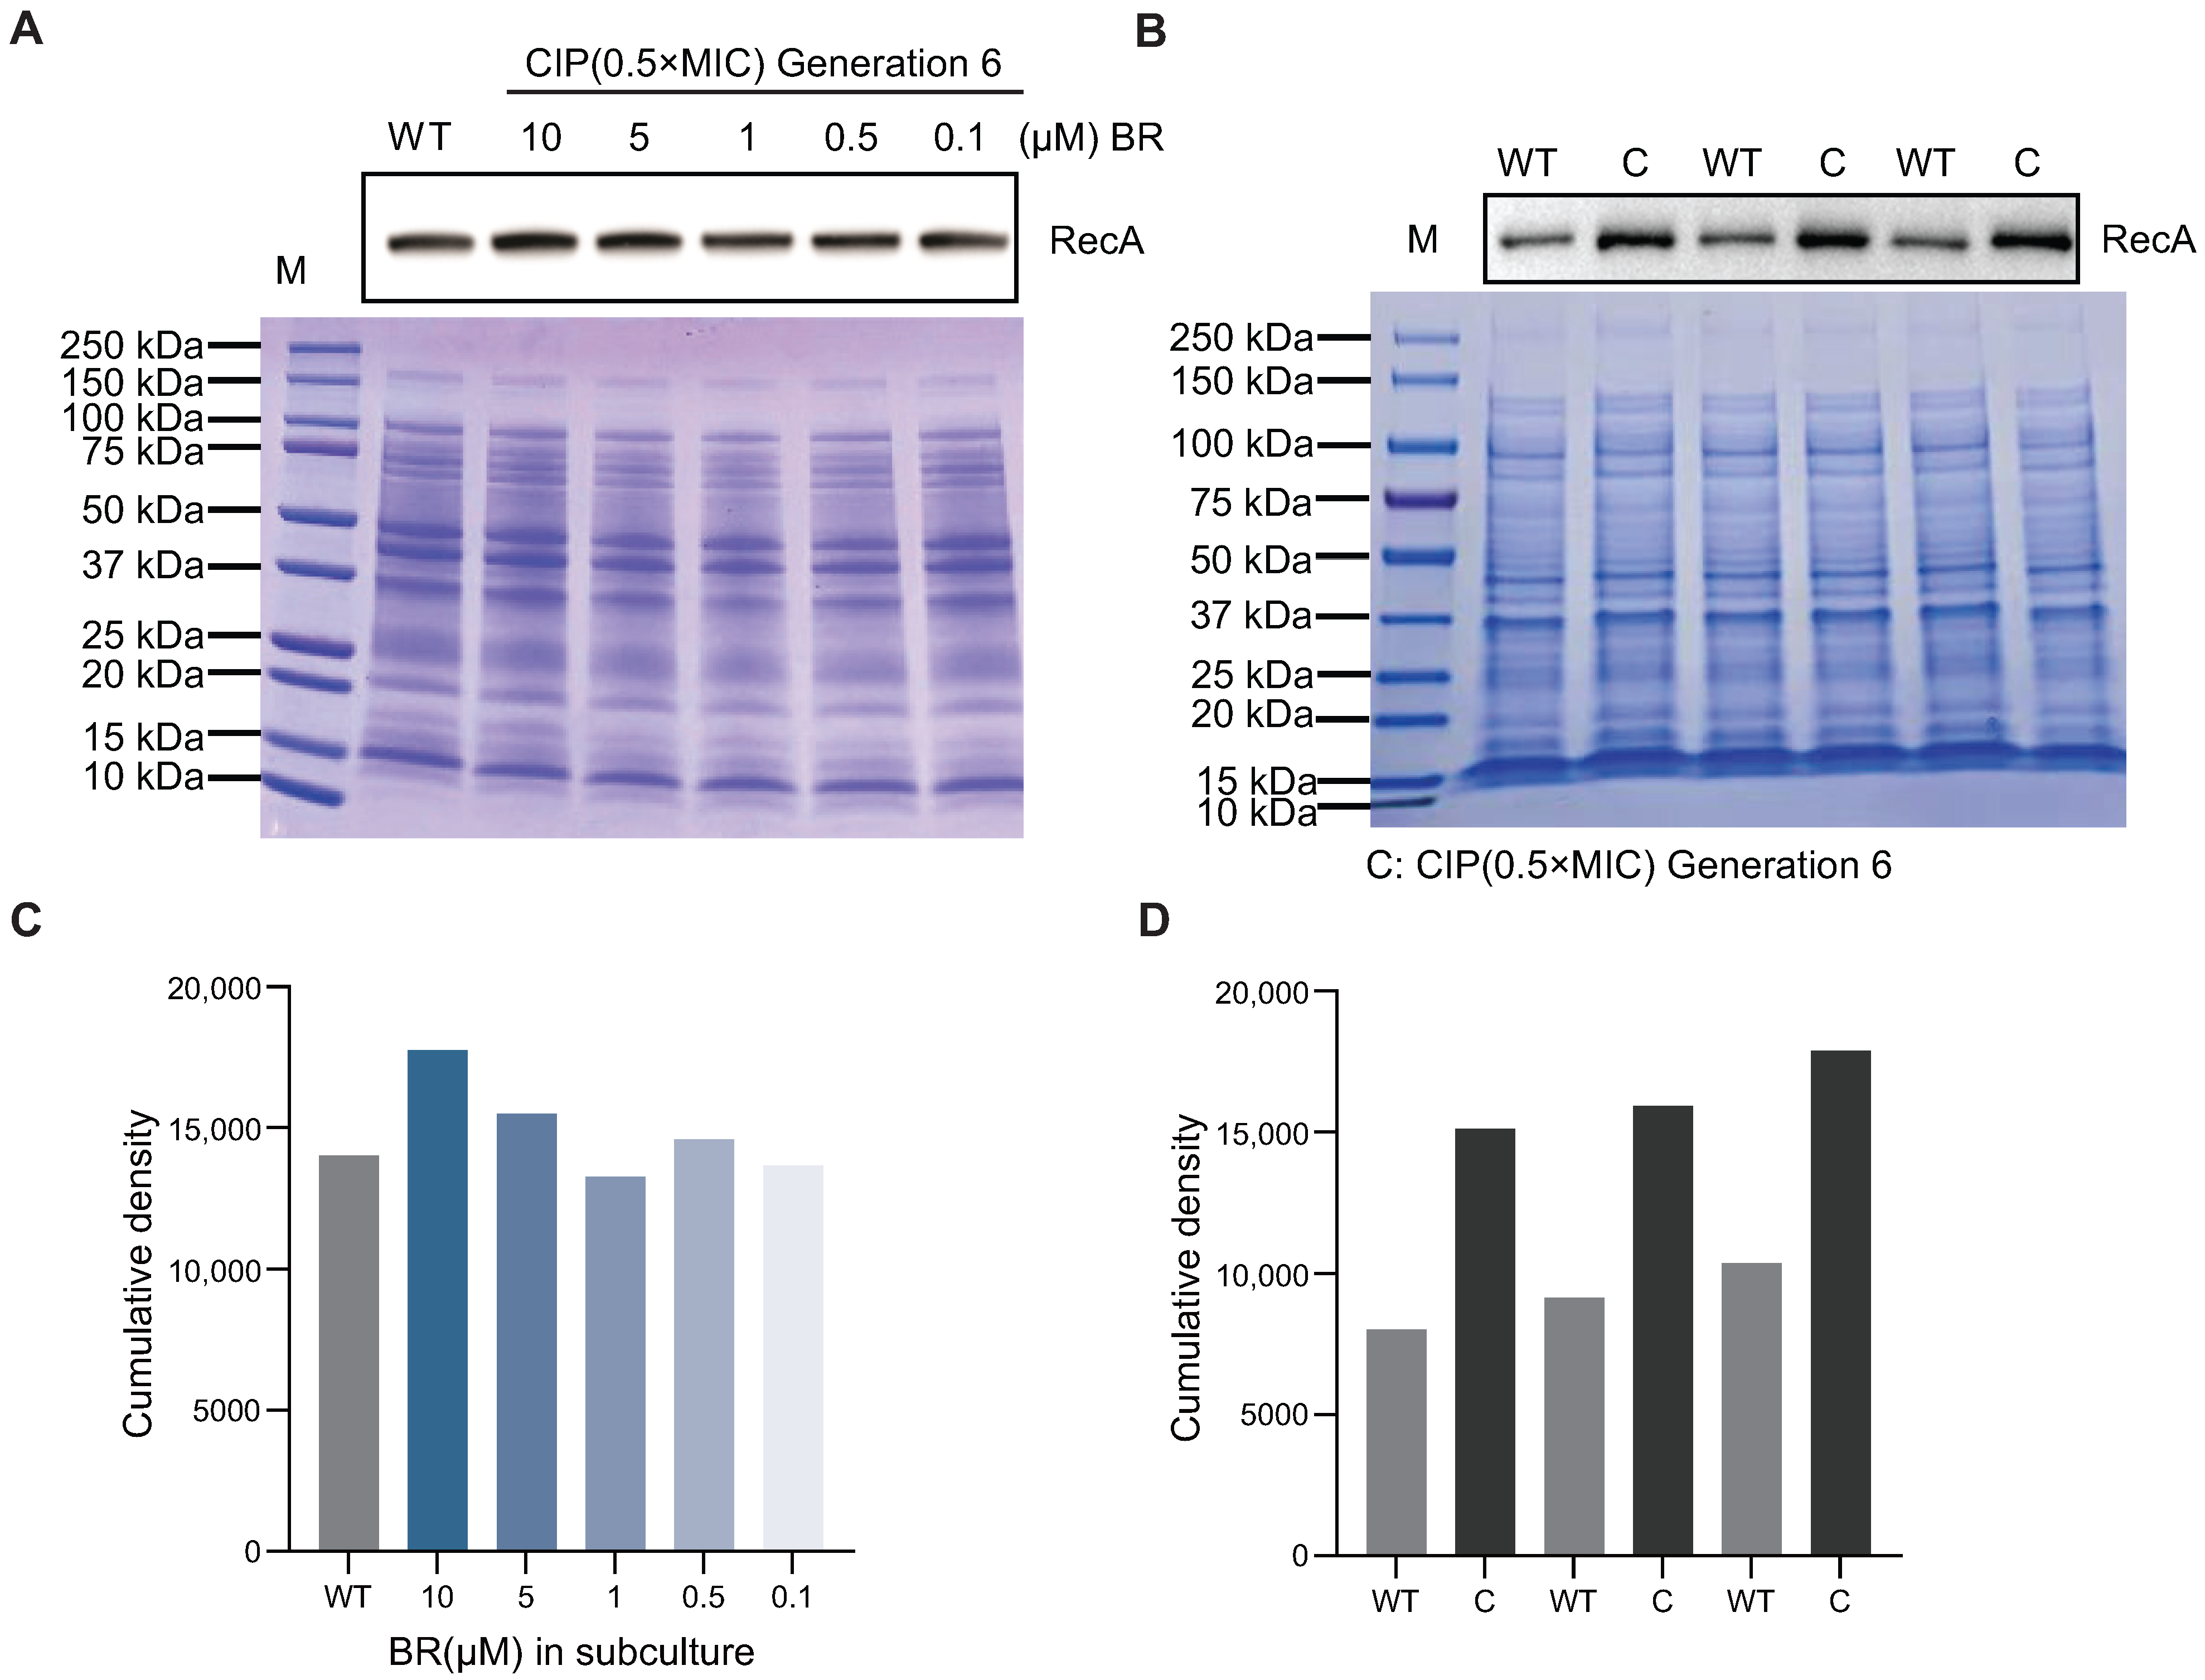
3.4. BR Maintains RecA Protein Expression and Suppresses Resistance Driven by DNA Repair
To further explore the molecular basis of BR’s inhibition of spontaneous resistance, we investigated its effect on RecA protein levels during resistance adaptation. RecA is a central regulator of homologous recombination and DNA damage repair, and its upregulation has been associated with the emergence of spontaneous AR.
Western blotting was performed to assess RecA expression in sixth-generation BW25113 strains passaged under CIP (0.5× MIC), with or without BR co-treatment (
Figure 4B,D). However, in strains co-treated with BR at 10, 5, 1, 0.5, and 0.1
, RecA protein levels remained comparable to wild-type levels (
Figure 4A,C), showing no upregulation during the passage process [
10].
In summary, BR prevents CIP-induced overexpression of RecA during early-stage adaptation, thereby suppressing DNA repair activity and limiting recombination events that may lead to tRNA amplification and the emergence of broad-spectrum resistance mechanisms.
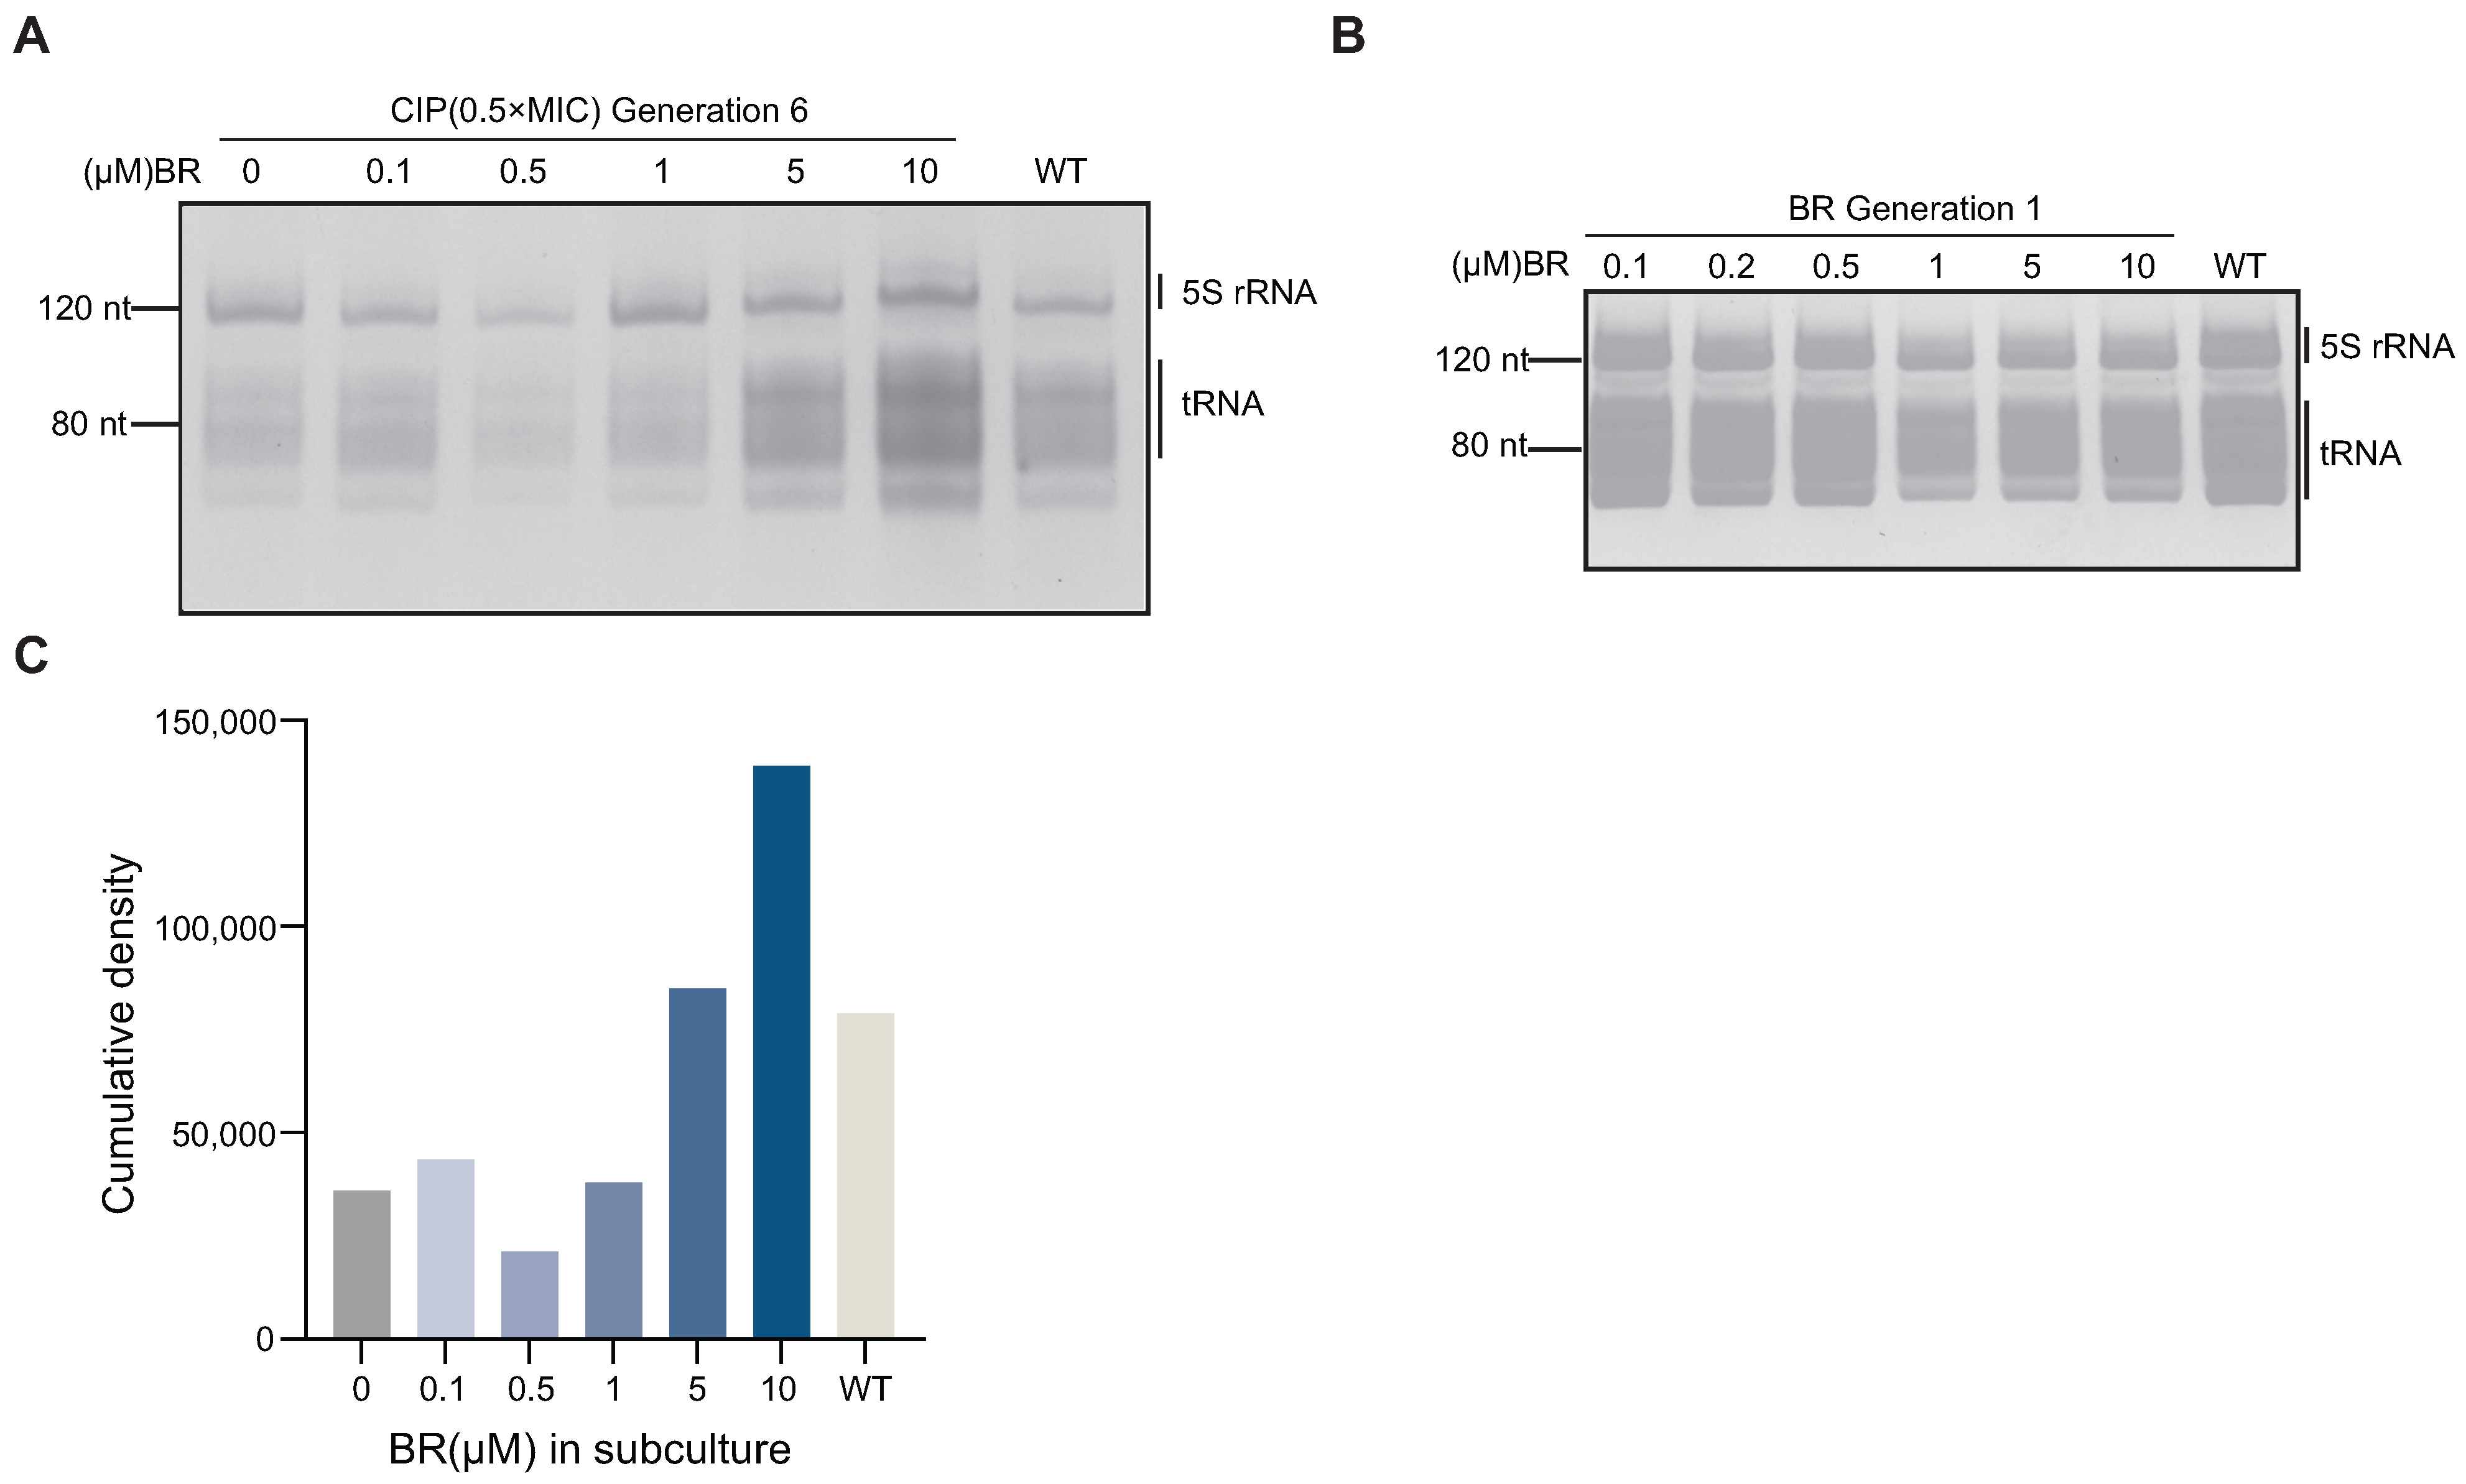
3.5. BR Downregulates tRNA Expression and Interrupts the Resistance Pathway
To investigate whether BR inhibits spontaneous resistance by suppressing RecA-mediated recombination and thereby limiting tRNA amplification, we analyzed tRNA levels in BW25113 during CIP adaptation. Total RNA was extracted from sixth-generation strains treated with CIP (0.5× MIC) combined with different concentrations of BR (10, 5, 1, 0.5, or 0.1
). Denaturing PAGE analysis showed that tRNA levels in BR + CIP-treated strains were significantly reduced compared to the wild-type (
Figure 5A). Denaturing PAGE and fluorescence-based quantification (
Figure 5A,C) revealed that tRNA levels were reduced in early-stage adapted strains (Generation 6) treated with a combination of CIP and BR (1, 0.5, and 0.1
), compared to the wild-type (
Figure 5C).
This reduction may reflect a bacterial survival strategy of lowering translation and energy metabolism to cope with antibiotic-induced stress. The result is consistent with earlier findings that BR delays growth and reduces metabolic activity. To verify whether this effect is stress-induced, we analyzed tRNA levels in Generation 1 strains treated with BR alone (10–0.1
). No significant change was observed compared to the wild-type (
Figure 5B), indicating that BR alone does not affect tRNA expression under normal conditions.
These findings support the conclusion that BR suppresses RecA-driven tRNA amplification and interferes with the translational machinery required for spontaneous resistance development [
8].
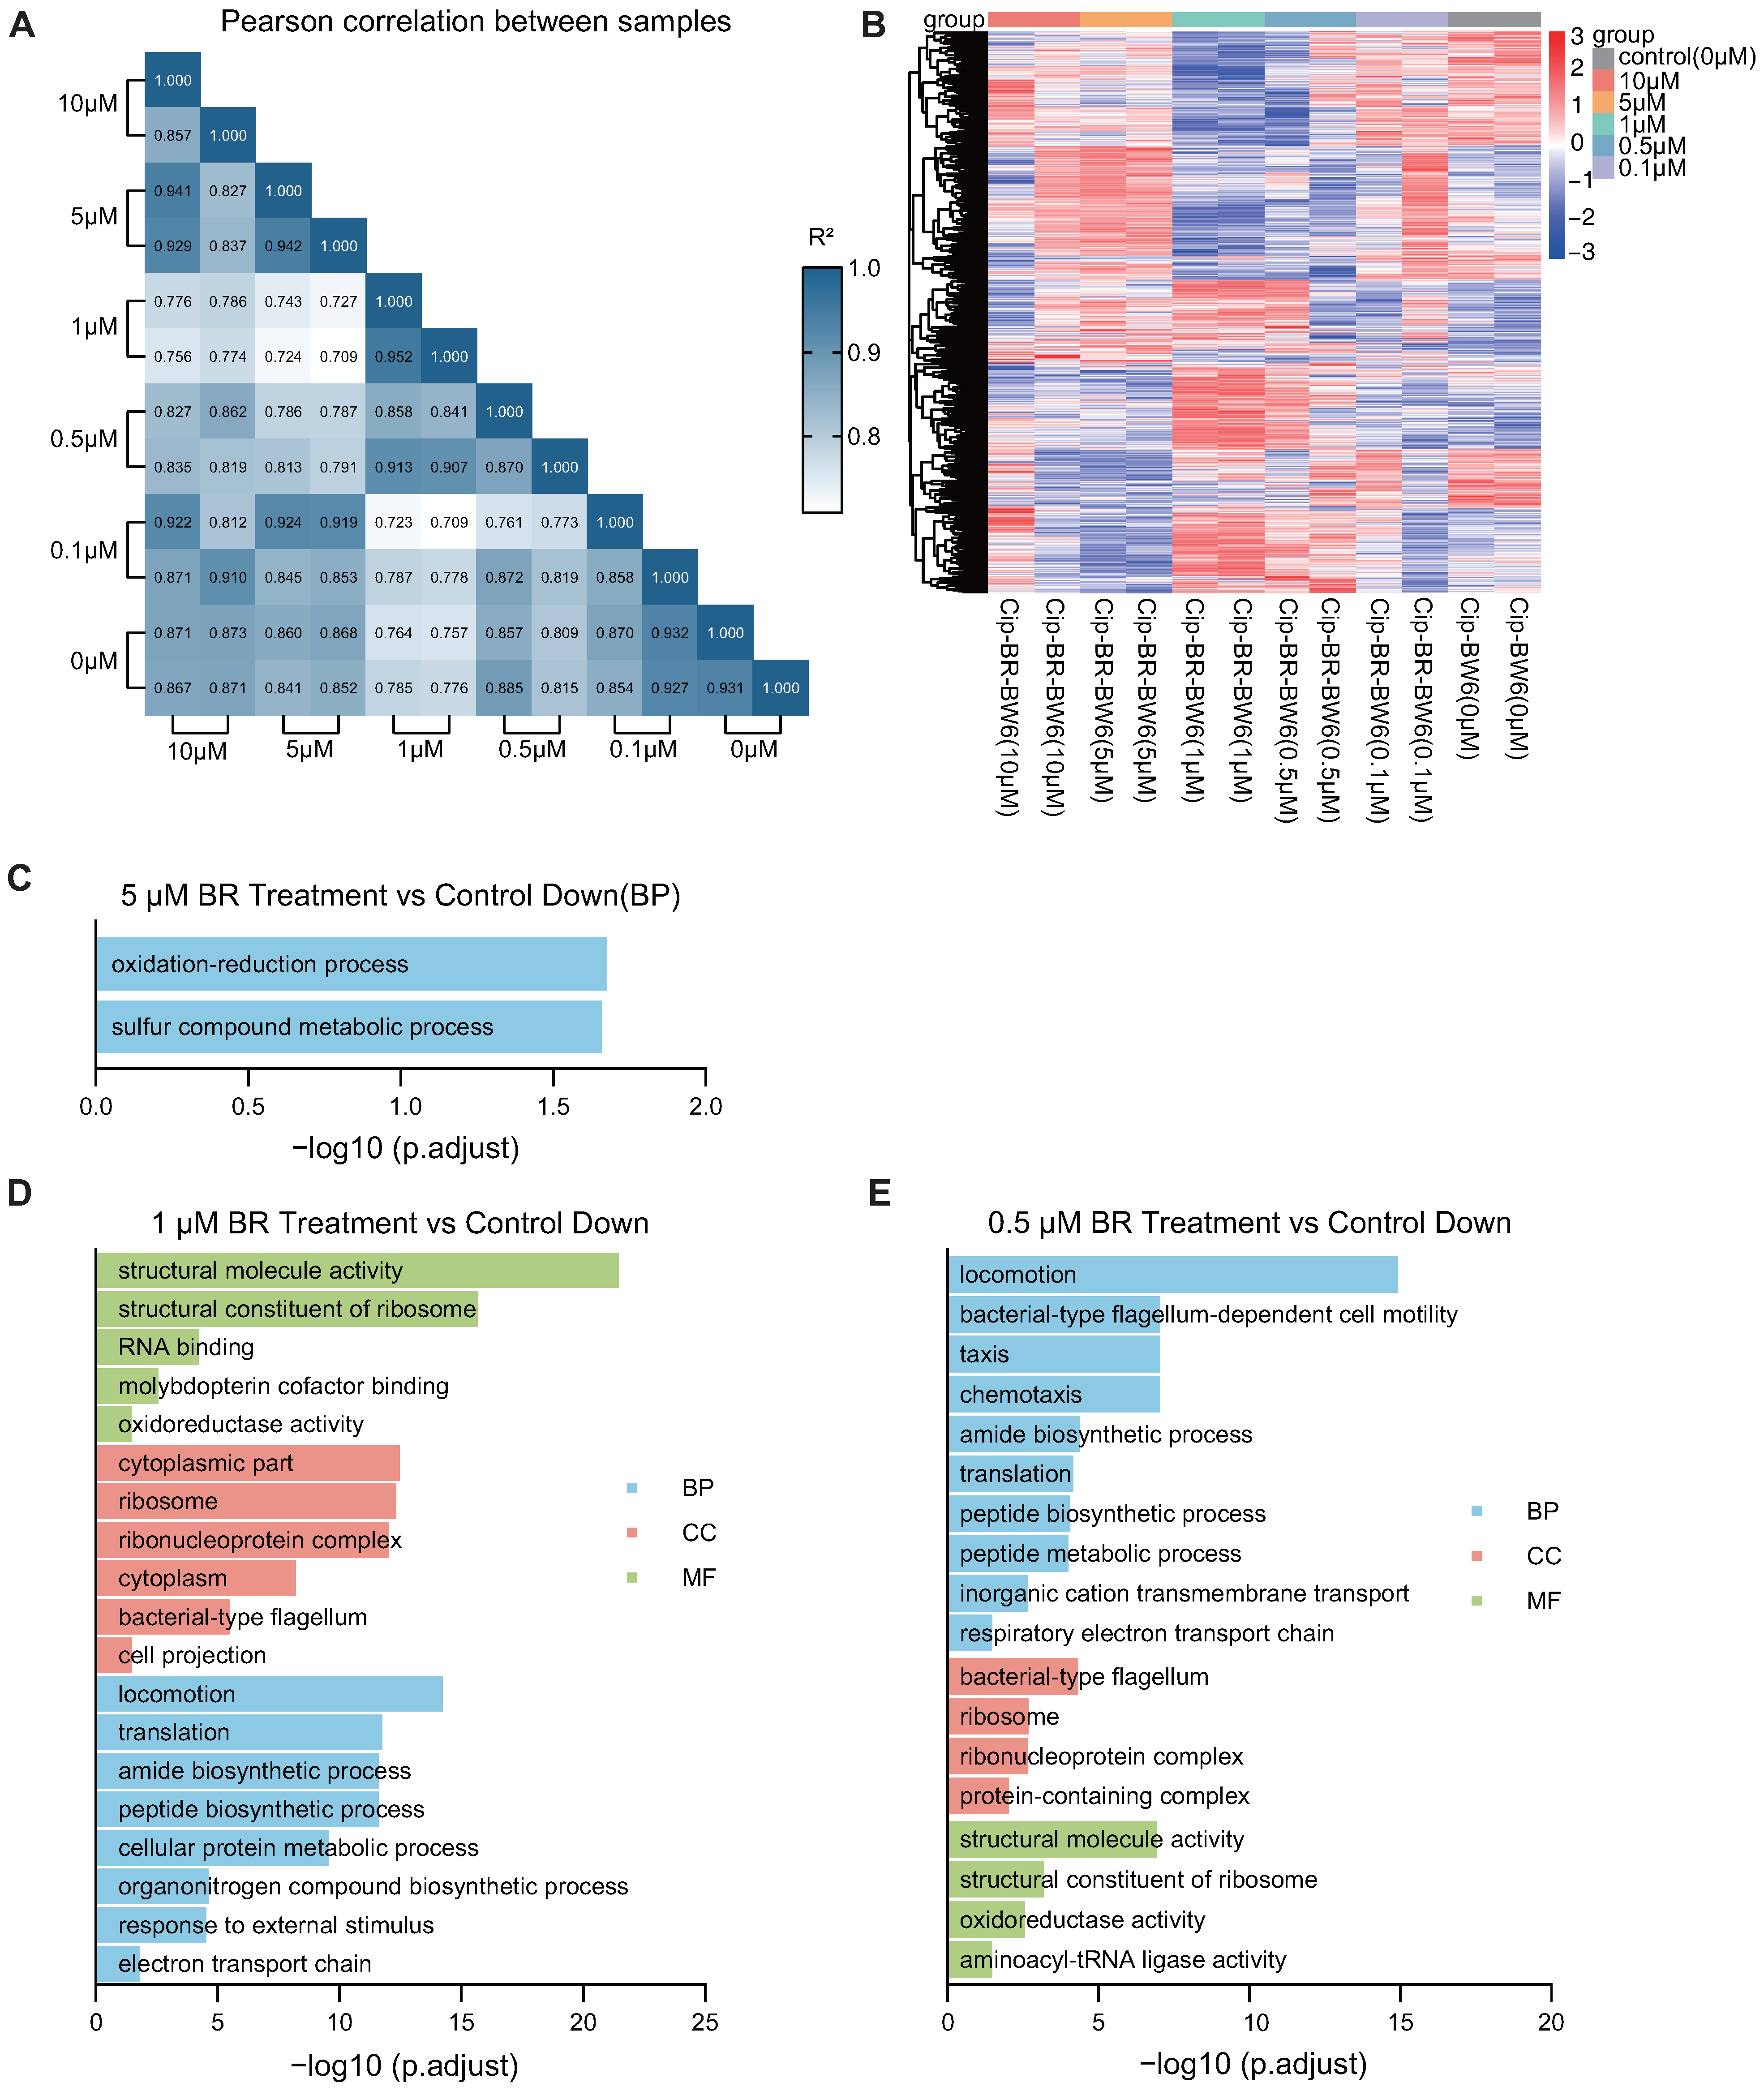
3.6. BR Inhibits the Transcriptome and Suppresses Key Pathways in Resistant Strains
To explore how BR impairs the early adaptation of CIP-resistant
E. coli, RNA-seq was performed on Generation 6 strains treated with different concentrations of BR (0.1–10
) in combination with CIP. The differential gene expression heatmap and correlation heatmaps showed that 1–5
BR treatment caused substantial shifts in the global transcriptional profiles compared to CIP-only controls, while 0.1–0.5
BR had weaker effects (
Figure 6A,B).
Gene ontology (GO) enrichment analysis of downregulated genes revealed that BR disrupted several critical biological pathways associated with energy metabolism and translation. Specifically, 5
BR significantly suppressed the oxidation-reduction process and sulfur compound metabolism (
Figure 6C) [
28,
29]; 1
BR led to downregulation of genes involved in translation, motility, electron transport, and protein biosynthesis (
Figure 6D); and 0.5
BR impaired respiratory chain activity, chemotaxis, and ribosomal structure and function (
Figure 6E).
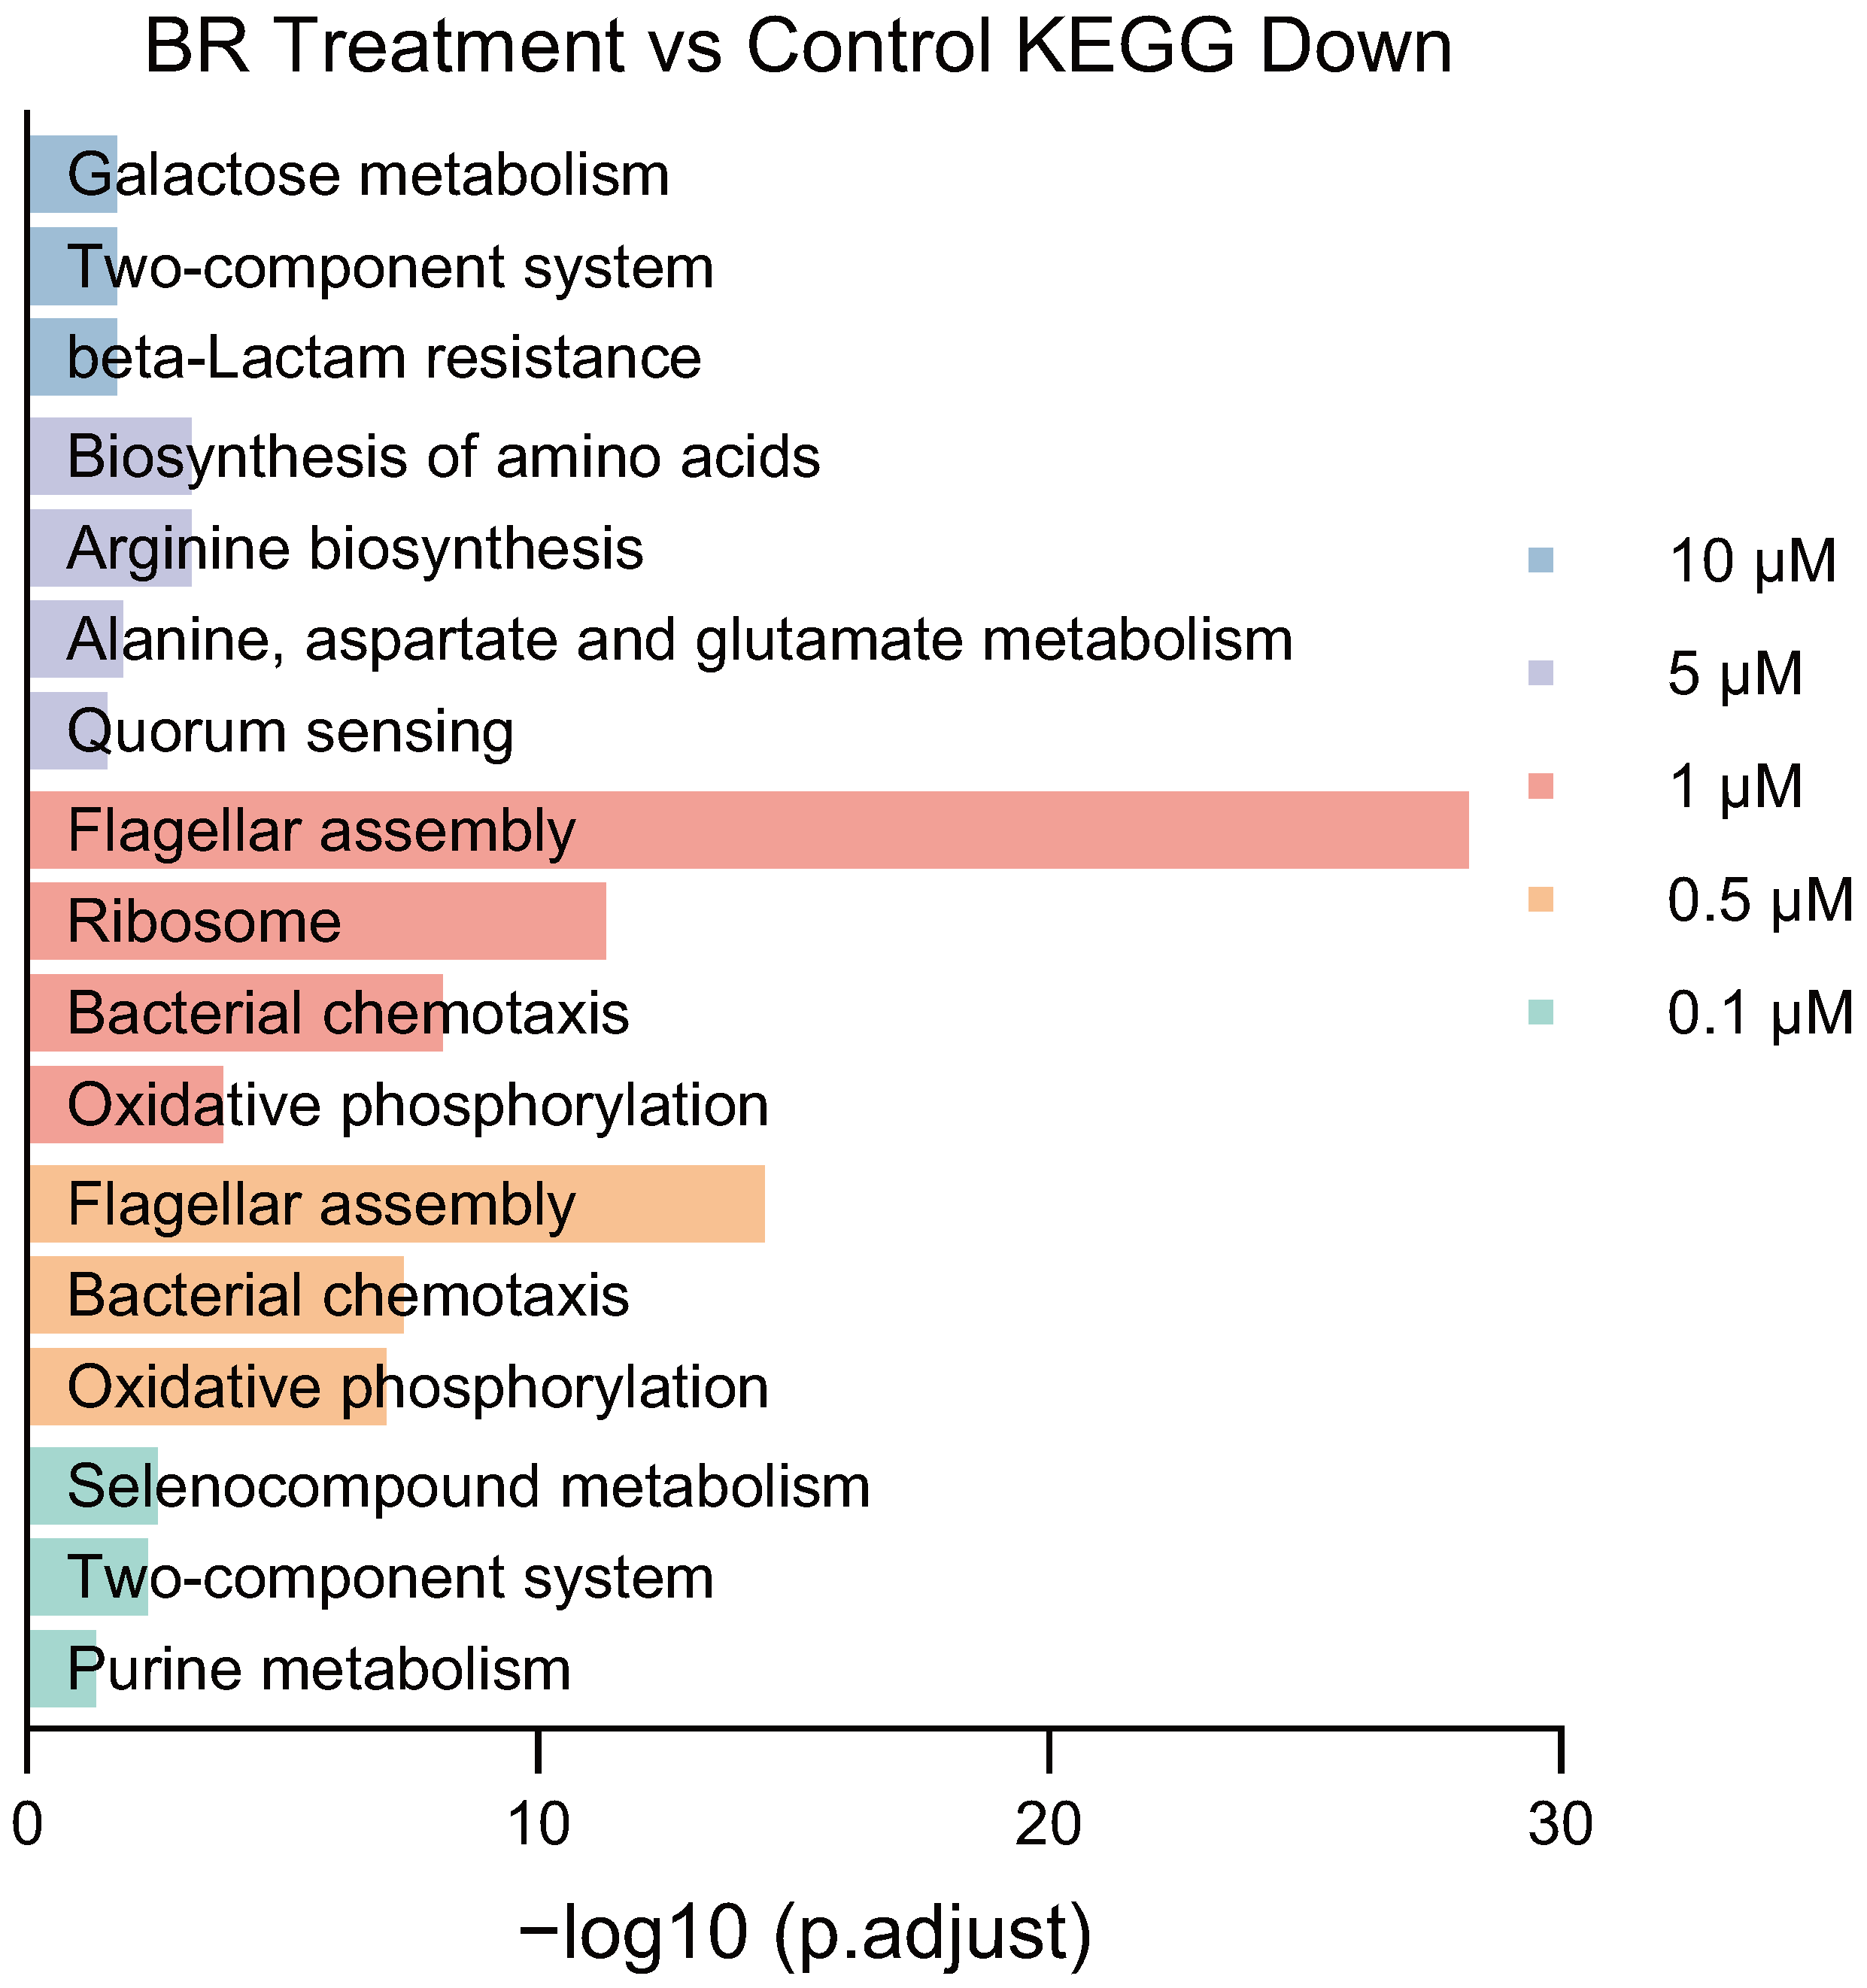
In addition to GO enrichment, KEGG analysis further confirmed that BR treatment disrupted key signaling and metabolic pathways during early resistance adaptation. Specifically, 1
BR suppressed ribosome function, translation, amide biosynthetic process, peptide biosynthetic process, and cellular protein metabolic process, indicating impaired protein synthesis and energy production (
Figure A1). Moreover, locomotion, flagellar assembly, and chemotaxis were significantly downregulated, suggesting a reduction in motility and nutrient foraging. Downregulation of the respiratory electron transport chain implied impaired oxidative phosphorylation and ATP production. These impairments collectively contribute to reduced bacterial viability and stress response capacity [
30].
At 0.5 BR, KEGG results showed suppression of oxidative phosphorylation, chemotaxis, and ribosomal structural constituents. These data suggest that BR interferes with both energy metabolism and translational machinery in a concentration-dependent manner. Importantly, the suppression of ribosome biogenesis and motility-related genes may explain the bacteriostatic effect of BR during early adaptation and its inhibition of stress-induced tRNA upregulation.
These results suggest that BR concentrations ranging from 0.5 to 5 impair cellular energy supply and translational capacity, thereby limiting the growth and resistance adaptation of bacteria.
3.7. BR Exhibits Broad-Spectrum Inhibitory Effects on Spontaneous Resistance Evolution Against Multiple Classes of Antibiotics
To evaluate whether the inhibitory effect of BR on spontaneous resistance evolution is generalizable beyond CIP, we tested BR in combination with four additional antibiotics—PMB, AMP, KAN, and TET—at sublethal concentrations (0.5× MIC). BW25113 was serially passaged for 15 generations with each antibiotic alone or in combination with BR (0.1–10 ), and MICs were determined at each generation.
As shown in
Figure 7, BR exerted varying degrees of suppression against resistance development depending on the antibiotic and BR concentration. For PMB (
Figure 7A), 10
BR completely blocked MIC elevation throughout 15 generations, 5
BR delayed resistance up to generations 9–15. For AMP (
Figure 7B), all six BR concentrations (0.1–10
) inhibited MIC elevation within the first nine generations; MIC increases appeared beyond Generation 9. For KAN (
Figure 7C), four BR concentrations (1.0, 0.5, 0.2, and 0.1
) fully suppressed MIC elevation within the first seven generations. For TET (
Figure 7D), BR at 5, 0.5, 0.2, and 0.1
partially delayed resistance development, with MIC increases resuming beyond Generation 7.
These findings demonstrate that BR can attenuate early resistance adaptation across diverse antibiotic classes. Although the inhibitory effectiveness varied depending on BR dose and antibiotic type, low concentrations of BR (≤1 ) showed reproducible suppressive effects against resistance emergence under KAN and TET pressure. This suggests the potential applicability of BR as a general adjuvant to suppress the emergence of AR.
4. Discussion
AR poses a critical challenge to global health, often rendering conventional treatments ineffective. Traditionally, antibiotic resistance has primarily been attributed to the horizontal acquisition of resistance determinants such as plasmids, integrons, or transposons from environmental reservoirs [
1]. Yet resistance emerges soon after the clinical introduction of entirely synthetic antibiotics, which cannot be explained by gene acquisition. This highlights the importance of spontaneous (intrinsic) resistance—adaptation without foreign DNA—driven by target mutations, altered permeability, efflux, and reprogrammed gene expression, including tRNA rearrangements [
4,
5,
6].
Antibiotic stress induces oxidative damage that demands rapid cellular responses; while canonical regulators (
SoxRS,
OxyR) require ∼20–30 min to activate, translational responses can act faster [
30]. In our study, BR co-treatment downregulated translation-related genes, ribosomal components, and aminoacyl-tRNA synthetases, indicating suppressed initiation of protein synthesis and blunted stress-response activation. Consistent with this, growth-kinetics analyses showed reduced
and prolonged
during the early adaptation window under sub-MIC pressure, supporting a model in which BR constrains early translational and energetic capacity and limits survival during initial antibiotic insult.
The mechanism of BR brings a series of advantages and limitations, especially in the context of clinical treatment. Mechanistically, BR abolished the RecA upregulation induced by various antibiotics and thus delayed the genome recombination-mediated tRNA upregulation and the subsequent translation-based spontaneous AR at early stage. Together with the transcriptomic signatures pointing to reduced oxidative phosphorylation, electron transport, and translation, the data converge on a lower-energy, lower-protein-synthesis state under BR. Due to the highly conserved RecA and SOS repair system across bacterial species, BR should be effective in various bacteria and for most antibiotics. Since RecA-mediated AR is only for the early stage, the potential usage of BR should be accompanied with antibiotics in the very beginning of clinical treatment. Also, due to this mechanism, BR would not reverse the AR if specific AR through efflux pumps or mutations has already occurred. Therefore, BR should be used only with the antibiotics that the bacteria is sensitive to. In terms of stability, it seems that BR was stable throughout the entire process of multiple-day subculturing experiments. However, the rate of clearance in vivo should be further investigated to guide clinical practice.
Across antibiotic classes—PMB, AMP, KAN, and TET—BR attenuated early-stage adaptation to varying degrees, likely reflecting differences in drug mechanisms and induced stress pathways. Notably, suppression did not scale monotonically with dose, suggesting a nonlinear dose-response; in some settings, higher BR did not further improve control, and resistance could re-emerge via energy-conservation strategies such as growth arrest or reduced motility. This means that the dosage of BR should be investigated in depth for each bacteria and for each antibiotics. We also note a plausible link between BR exposure and persister-like, low-energy cells; second messengers (e.g., c-di-GMP) and toxin proteins such as HipH may modulate persistence and genome stability, meriting future co-targeting studies [
31]. Optimizing BR-based combinations and scheduling by antibiotic class/mechanism may therefore maximize efficacy.
From a translational perspective, BR showed minimal cytotoxicity in human cell lines within the antibacterial-adjuvant range and did not impair bacterial growth in the absence of antibiotic pressure, suggesting a favorable selectivity window. Nonetheless, clinical safety requires rigorous evaluation, particularly potential effects on the eukaryotic homolog Rad51 and DNA-repair processes [
32]. Although speculative, in perinatal care—where certain antibiotics (e.g., aminoglycosides, tetracyclines) pose toxicity risks—low-dose BR co-treatment with
-lactams might help delay resistance without increasing fetal toxicity; in scenarios requiring polymyxins, BR could extend treatment windows by delaying resistance resurgence [
29]. Additional regulatory layers such as codon-usage bias may also affect RecA translation under stress and warrant investigation with codon-optimized constructs [
33,
34], alongside in vivo validation.
In summary, our data indicate that targeting RecA with BR attenuates early-stage spontaneous resistance across multiple antibiotic classes by constraining recombination-linked tRNA upregulation and curbing translational/energetic capacity. This study offers a practical framework—phenotype, transcriptome, protein, and tRNA metrics across multiple antibiotics—for evaluating resistance-suppressing adjuvants. Future work should refine dosing strategies, explore co-targets that limit persistence, and pursue in vivo efficacy to translate this approach into clinical antimicrobial regimens.
